crop quality and grain storage management
TRANSCRIPT
Crop Quality and Grain Storage Management
The ISU Extension Grain Management Team Charles Hurburgh, Shawn Shouse, Greg Brenneman
Agricultural Engineering Kelvin Leibold, Steve Johnson
Farm ManagementMark Licht: Agronomy
Alison Robertson: Plant Pathology

OUTLINE• Crop quality – learning from history
– 2009 Corn Issues– 2010 Weather and Quality– 2011 Weather and Quality
• Basic inventory management practice• Future issues


Wet Corn!

Photos courtesy: Mark Licht, ISU Extension
Hail damage, Sac County, 8‐09‐2009

Ear rot assessments – percent severity; rot present
Gibberella
Fusarium
Penecillium
Fusarium
Cladosporium
Trichoderma

Corn, NE Iowa, January 2010

Ear Rot SummaryMean ear rot
severity (%)(Range)
Ear rots present
Hail damage samples (N=56)
11.8(0 –
53.4)
Fusarium*Gibberella*
Cladosporium, Penecillium
Background samples (N=27)
3.3(0 –
16.4)
Cladosporium*Fusarium, Gibberella
Standing corn samples (N=72) (No increased toxin)
24.0(0.2 ‐
83.8)
Cladosporium*Fusarium, Gibberella
* Predominant ear rot present
Total Damage

Iowa Grain Quality Initiative www.iowagrain.org
1/08/2007 Copyright © 2010 Iowa State University
Maximum storage time (months) for corn and soybeans*
Corn temperature
° F
Corn, soybeans moisture content
13%,11%
14%,12%
15%,13%
16%,14%
17%,15%
18%,16%
24%N/A
40 150 61 29.0 15.0 9.4 6.1 1.3
50 84 34 16.0 8.9 5.3 3.4 0.5
60 47 19 9.2 5.0 3.0 1.9 0.3
70 26 11 5.2 2.8 1.7 1.1 0.2
80 15 6 2.9 1.6 0.9 0.9 0.06
*Based on 0.5% maximum dry matter loss—calculated on the basis of USDA research at Iowa State University. Corresponds to one grade number loss; 2-3% pts in damaged seedsSoybeans approximated at 2% lower moisture than corn.
Reduce to half if TW < 52 lb/bu

Blue-eye; Penicillium or A. GlaucusNo Dry Air in July and August!

Any time you have EMC balanced with 65% RH, Blue Eye is possible

2010 – warm and wet

Flooded Corn

In September and October, 2010 we had extremely dry air.

2011 Quality• Heat unit accumulation +/- to normal• Hot July = Early maturity, pollenation• Dry weather – reduced fill but cooler. August was
some buffer.• Corn:
Lower kernel weight; fewer kernels. Average+ TW except wilted, hail, frost, stalk rotMoisture – mid to low teens; wetter eastProtein – highly variable; higher in dry areas
• Soybeans: Mixed bag –small seeds but lots of them. A few Green beans North, SW but dried fast.Low protein and low oil


Iowa Grain Quality Initiative www.iowagrain.org
Copyright © 2007
Inbound Grading
• Moisture– 0.1% Moisture = 1-3 cents/bu– +/- 0.3% vs GIPSA– More than just once a year– Calibration update
• Test Weight– +/- 0.5 lb/bu vs GIPSA – 1 lb/bu = 1.5% inventory error– Cup? Training or
worse than meter!
149 mhz
By 8/1/2012?

Iowa Grain Quality Initiative www.iowagrain.org
Copyright © 2007
Iowa Grain Quality Initiative www.iowagrain.org
Copyright © 2007
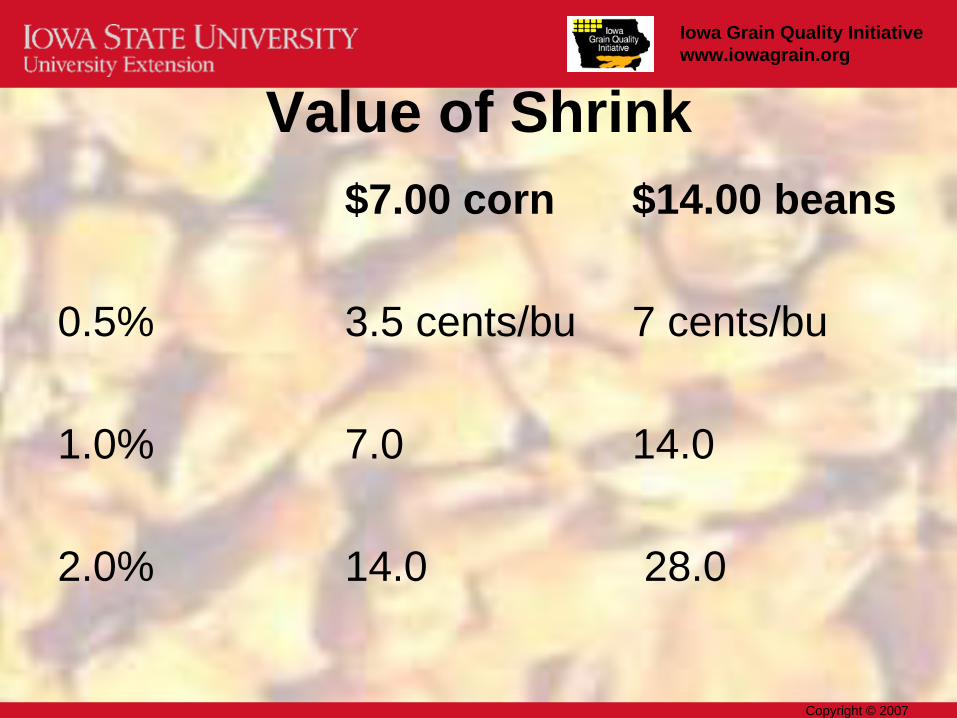
Value of Shrink$7.00 corn $14.00 beans
0.5% 3.5 cents/bu 7 cents/bu
1.0% 7.0 14.0
2.0% 14.0 28.0

Iowa Grain Quality Initiative www.iowagrain.org
Copyright © 2007
Storage ManagementChoose which grain for less flexible storage.
– Clean– Uniform moisture; means has been aerated– Higher test weight; as possible (56+ for corn)– From one crop year– No history of problems; under your control for as
long as possible.
– Sort on Test Weight.– Remove the center core.

Iowa Grain Quality Initiative www.iowagrain.org
Copyright © 2007
Shrink – Handling and Storage• Lost kernels, dust, mold, increased FM• Some Estimates:
– 0.5% (0.005) weight loss per in and out. Out to Pile counts double. More if multiple turns.
– 0.2% FM Increase per rotation (15% corn); 0.4% if 13%, etc. More with dryer stress cracks or low TW (2x)
– 0.5% weight loss per 3% pt damage increase.• Example: 3% to 12% is 9% pts = 1.5% shrink

Iowa Grain Quality Initiative www.iowagrain.org
Copyright © 2007
Aeration Phases• Phase 1: Fall Cool Down
• Lower grain temperatures stepwise • September 50-55 F!!! • October 40-45 F• November 35-40 F• December 28-35 F
• Phase 2: Winter Maintenance• Maintain temperatures with intermittent aeration
• January, February 28-35 F• Phase 3: Spring Holding
– Keep cold grain cold• Seal fans• Ventilate headspace intermittentlySource: Purdue Univ.

Corn Yield Potential
Source: Monsanto, June 2010
Overall = 2.1 bu/a/yr; Last 10= 3.5 bu/a/yr; Seed industry = 4-6 bu/a/yr; +400-500 million bu/year Nitrogen use: 1.0-1.1 lb/bu down to 0.7-0.8 lb/bu


Iowa Grain Quality Initiative www.iowagrain.org
2-17-2011 Copyright © 2011
FDA - Food Safety Modernization Act
Update registration every two yearsUpdate registration every two yearsA written food safety plan is requiredA written food safety plan is requiredCarrier certification and examination (BSE)Carrier certification and examination (BSE)Surveillance inspection every 5Surveillance inspection every 5--7 years7 years
Accuracy guidelines for enhanced traceabilityFDA now can force a recallSelf reporting website apply to mycotoxins???Inspect records and audit without prior cause

Iowa Grain Quality Initiative www.iowagrain.org
2-17-2011 Copyright © 2011
First Actions• Train new inspectors, visit facilities• Emphasis on food safety plans – FEED!• Specific audits and checks in familiar areas;
eg sanitation, BSE/meat products• Traceability/recall – ask state of the art• Wild card: Moldy grain and mycotoxins• Third party audits – fading reputation

27
Coal Asbestos
Glass Dead vermin

28

29


Summary• Variable weather outlook will increase grain
management problems.• Probably new issues never seen before.• Challenges of volume despite known science.• Higher value rewards precise management.• Food safety regulations will apply.
31

Copyright © 2010 Iowa State University
Where To Find Us…
Analytical ProgramsQuality Management
Systems