crop coefficients of jatropha (jatropha ... -...
TRANSCRIPT
1
Wiley Interdisciplinary Reviews: Energy and Environment
Crop coefficients of Jatropha (Jatropha curcas) and Pongamia
(Pongamia pinnata) using water balance approach
Kaushal K. Garg, Suhas P. Wani*, A.V.R. Kesava Rao
International Crops Research Institute for the Semi Arid Tropics, Patancheru, Andhra Pradesh,
India
DOI: http://dx.doi.org/10.1002/wene.88
This is author version post print archived in the official Institutional Repository of
ICRISAT www.icrisat.org
Crop coefficients of Jatropha (Jatropha curcas) and Pongamia (Pongamia pinnata)
using water balance approach
Kaushal K. Garg, Scientist , Suhas P Wani , Principal Scientist, A. V. R. Kesava Rao,
Scientist
International Crops Research Institute for the Semi Arid Tropics, Patancheru 502 324, Andhra
Pradesh, India
2
Abstract
Jatropha and Pongamia are potential source of bio-diesel and grow in a wide range of agro climatic
zones and soil conditions. Data and knowledge available on water requirement of Jatropha and
Pongamia are very scarce. Crop coefficients are important parameters used for assessing water
requirement and irrigation scheduling. In present study, crop coefficients of Jatropha and Pongamia
were estimated using water balance approach. Temporal data on soil moisture at different depths in
block plantations of Jatropha and Pongamia at ICRISAT farm, Patancheru in India were collected at 15
days interval between 2007 and 2010. Measured soil moisture data were analyzed using one
dimensional water balance model. Results showed that annual water requirement of Jatropha is 750
mm and of Pongamia is about 950 mm in semi-arid tropics. Crop-coefficients of Jatropha ranged from
0.10 to 0.95 and of Pongamia from 0.30 to 1.10 depending on plant growth stage in different months.
ICRISAT received 820 mm of rainfall in a normal year (data between 2001 and 2010) during the
monsoon, of which 52 % (430 mm) contributed to evapo-transpiration, 34 % (280 mm) was stored in soil
and, 14 % (110 mm) was lost through surface runoff. Stored soil moisture during monsoon season was
subsequently utilized by the Jatropha and 270 mm converted into ET during non-monsoonal period.
Pongamia utilized stored soil moisture more effectively than Jatropha as it could remove water from
deeper soil layers even at high levels of soil moisture suction.
Key words: Bio-diesel, Jatropha, Pongamia, Green water, Semi arid tropics, Water Impact Calculator
INTRODUCTION
Food and energy security are becoming a major issue both for developing and developed countries all
over the world. Biofuel such as ethanol and bio-diesel are considered as one of the potential alternatives
to reduce fossil fuel dependency 1,2, also to reduce greenhouse gas emission and to sequester carbon
2,3,4. In recent years, governments of many countries have targeted use of biofuel by blending it with
conventional petroleum fuel and are promoted for wide industrial adaptability 1,5. In contrary, it is also
hypothesized that biofuel production at large scale may threaten the food security by competing with
food crops and thus affecting the food supply and prices 6,7. On the other hand, production of bio-diesel
from plants grown in degraded lands offers opportunities to address the issues of environmental
protection and provide options for improving rural livelihood especially in developing countries3,8,9.
Jatropha curcas (Jatropha) and Pongamia pinnata (Pongamia) are identified as potential bio-diesel crops
and may be grown in marginal and degraded lands with a wide range of rainfall and ecological
conditions 4,10,11,12.
3
Although, the demand for bio-diesel is increasing, available data and knowledge on yield potential and
water requirement of Jatropha and Pongamia are very limited and thus research efforts are required to
address such issues13. However, few estimates on water requirements of Jatropha have been reported
in literatures. For example, Rao et al.14 reported that evapotranspiration (ET) from Jatropha plantation
ranges from 1410 to 1538 mm in optimal conditions and 614-930 mm in field conditions in a semi-arid
tropical location in India. They observed moisture extraction from soil layers 150 cm below from surface
by five year old plants. Transpiration requirement of Jatropha was estimated as 300 mm and 500 mm at
4th and 12th year of growth stage at Owen Sithole College of Agriculture near Empangeni on the KZN
north coast and Makhathini, Southern Africa, respectively 15. Gush and Moodley16 estimated total
transpiration of 1983 ℓ (147 mm) for a 4-year-old J. curcas tree grown at a relatively wetter location, and
4884 ℓ (362 mm) for a 12-year-old J. curcas tree grown at a dry site of South Africa. Transpiration rate
was found high during the warm wet summer months and negligible during winter due to the deciduous
nature of the Jatropha species.
Water requirement of a plant may be estimated by multiplying crop coefficients (Kc) with atmospheric
water demand (ET0). In this method, effect of crop transpiration and evaporation are integrated by a
single coefficient, which is known as crop coefficient17. The Kc-ET0 approach provides a simple,
convenient and reproducible way to estimate water requirement of crops in different climatic
conditions17,18. Crop coefficient values have been reported for several crops 17 and tree plantations19,20
and have been widely used for irrigation scheduling 17,21, simulation studies22 and decision making
process 17.
Several methodologies were developed for estimating Kc, for example, weighing lysimeter based
techniques23, agronomic measurements18 and remote sensing-based techniques24. Irrespective to
methodologies, basis for estimating Kc in all such techniques is common i.e., computation of water and
energy balance components. In the present study, we used soil moisture data collected at ICRISAT
research station for analyzing water balance of Jatropha and Pongamia crops using one dimensional
hydrological model. Specific objectives of the present study are: i) to estimate Kc for Jatropha and
Pongamia crops and ii) to assess water requirements and analyzing field water balance of Jatropha and
Pongamia crops in semi-arid tropics.
4
MATERALS AND METHODS
Experimental setup and data monitoring
International Crops Research Institute for the Semi-Arid Tropics (ICRISAT) is located at 17° 53’N, 78°
27’E, and about 545 m above mean sea level in the Medak district of Andhra Pradesh, India. Climate of
the study area is tropical monsoon. Long term (1974-2010) average annual rainfall is 898 mm (standard
deviation, σ =225 mm), of which about 80-85% is received during June to October. Rainfall is highly
erratic, both in terms of total amount and distribution over time. Monsoon is preceded by hot summers
(minimum air temperature between 16o and 29oC and maximum air temperature between 30o and 43oC
in May) and followed by cool winters (minimum air temperature in between 6o and 20oC and maximum
air temperature between 23o and 32oC in December). Estimated potential Evapotranspiration (PET) of
the study area is 1650 mm annually.
Two micro-watersheds each of 2 ha area were selected for cultivating Jatropha and Pongamia crops at
ICRISAT research station, respectively. Soil of experimental site is classified as Vertisols having maximum
depth up to 3 m. Topography of micro-watersheds is relatively flat with average slope between 1.0 and
2.0 %. Soil physical and chemical properties of experimental site e.g. bulk density, texture, organic
carbon and soil water retention parameters were measured. Mean values of soil organic carbon was
0.65 % (standard deviation, σ=0.2) in 0-15 cm depth and 0.50 % (σ=0.10) in 15-30 cm soil depth. Soil bulk
density of upper soil layers is relatively higher (1.4 g cm-3 up to 75 cm layer) compared to lower layers
(1.2 g cm-3 between 120 and 150 cm). Bulk density of surface soil varied between 1.30 and 1.55 with
average of 1.35 g cm-3 across the watersheds. Subsurface soils are high in clay content and hold more
amount (soil moisture availability = 0.25 g/g) of soil moisture compared to shallow soils (soil moisture
availability =0.14 g/g).
Jatropha (3 m 2 m spacing) and Pongamia (5 m 5 m spacing) seedlings were planted in year 2004.
Crops were grown under rainfed conditions and chemical fertilizers were applied every year according
to need of plants at its different growth stages. Nitrogen and phosphorus was applied @76 kg ha-1 and
10 kg ha-1, respectively during 2006 and 2007. During subsequent growth stages, fertilizers dose was
increased. Nitrogen and phosphorus was applied @ 92 kg ha-1 and 50 kg ha-1, respectively during 2008
and 2009 Source of N and P in above fertilization was urea and single super phosphate, respectively14.
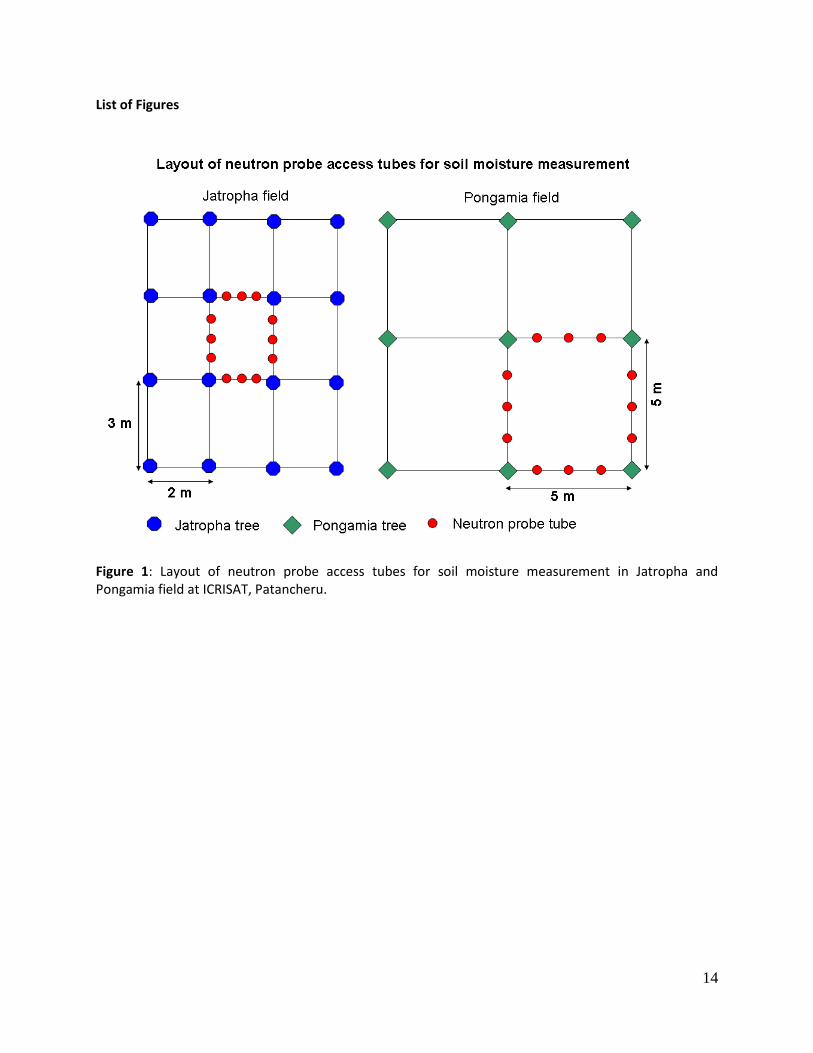
Total 12 neutron probe tubes in each of Jatropha and Pongamia micro-watersheds were installed for
monitoring soil moisture content. Schematic layout of the experimental setup is shown in Figure 1
5
describing spacing and location of neutron probe tubes between the plants rows. Soil moisture content
of each 15 cm thick layer was monitored from surface to 225 cm depth using calibrated neutron probe
(Troxler 4302) at 15 days interval between 2007 and 2010. In addition, moisture in surface soils (0-15
and 15-30 cm) was also measured by gravimetric method. Daily weather data (rainfall, maximum
temperature, minimum temperature, wind speed, solar radiation, relative humidity, and pan
evaporation) of experimental site were collected from meteorological station located at 200 m distance
from the micro-watersheds. Data on agronomic growth, seed yield and oil content were measured both
from the Jatropha and Pongamia fields.
Description of simulation model
A simple and one dimensional hydrological model (Water Impact Calculator, WIC developed in ICRISAT)
was used to analyze field water balance in the present study. WIC requires data on soil (soil depth and
water retention), weather (reference evapotranspiration and rainfall), crop growth (biomass and root
growth function), topography (land slope, land form conditions), ex-situ interventions (water harvesting
capacity) and crop management (date of crop sowing and harvesting irrigation method) as an input. WIC
analyzes water balance on daily time scale for each one cm soil layer (generate simulation matrix: time
vs. soil depth). Rainfall, which is the only source of water for rainfed situation was partitioned into
several hydrological components as defined by following mass balance equation:
Rainfall = Surface runoff + Deep percolation + Evapotranspiration (Evaporation + Transpiration) + Change
in soil moisture storage Eq.1
Surface runoff is the flow of excess rainwater after soil becomes saturated and generally occurs either
during or after the rainfall event. The SCS curve number technique25 was used to estimate surface runoff
in WIC. WIC calculates daily curves number value based on antecedent moisture content of surface soil
layer (assumed for 15 cm depth in current analysis) and partition rainfall into surface runoff. Excess
amount of infiltrated water after satisfying soil storage capacity is percolated below the crop root zone
and is defined as deep percolation. Evapotranspiration comprises two basic hydrological processes:
evaporation and transpiration. WIC calculates evaporation and transpiration based on imposed surface
boundary conditions and moisture accessibility from surface soil layer and root zone. Water available in
top 10 cm soil layer is contributed towards the evaporation demand, whereas, moisture available in root
zone is used to meet crop water demand as defined by Allen et al.17. Crop water requirement (CWR) for
a given crop is calculated such as:
6
0ETKCWR C Eq. 2
rootzone
i
rootzone
i
AWCT
CWRTCWRAWCif
1
1
E otherwise
E then :
Eq. 3
where AWC is available water and i denotes each cm increment in soil layer reaching up to root zone. It
was further assumed that evaporation from soil surface is inversely proportional to vegetative
growth/stage. Thus, after achieving full vegetative crop growth (Kc ≥ 1.0), evaporation from the soil
surface is considered almost negligible. Detailed description of WIC, model development, testing and
validation procedure are shown by Garg et al. 26
Estimation of crop coefficients
According to FAO-56 nomenclature, Kc calculates water requirements under growing conditions having
a high level of management and with little or no water stress17. Appropriate corrections need to be
incorporated while estimating crop coefficients in case of water stress situation due to less water
uptake. Allen et al. 17 described the effects of soil water stress on crop evapotranspiration (ETc) by
multiplying the crop coefficient (Kc) and the water stress coefficient (Ks) with ET0 such as: ETc = Ks x Kc x
ETo Eq. 4
Soils of the experimental watershed are characterized by Vertisols which has medium to high water
holding capacity and average depth of 2.5-3.0 m. In current study, Kc is estimated under the fully
developed stage (between 2007 and 2011) and is expected to experience with minimal water stress
situation. Despite this, whenever available soil moisture depleted below the threshold limit, stress
adjustment in ETc was made as defined by Allen et al 17 and Kc was estimated using Eq. 4. Seventy per
cent of total available water (soil moisture) is considered as readily available for crop uptake and further
it declined linearly. Water stress coefficient (Ks in Eq.4) is assumed 0.7 for Jatropha and Pongamia as
both are stress tolerant and deep rooted trees17,27,28,29. Crop coefficient of Jatropha and Pongamia crops
were estimated using the inverse optimization technique. Solver is an optimization program built in
Microsoft excel (developed for mixed integer nonlinear parameterization) was used for the current
study. Based on field measurements, field capacity and permanent wilting point are defined for every 15
cm soil layer up to 300 cm depth. Maximum root zone depth for Jatropha and Pongamia plant is
7
considered as 150 cm and 250 cm, respectively.27,28,29 Model is set by assigning atmospheric boundary
condition (rainfall and PET) on the soil surface as upper boundary and deep percolation from the bottom
layer as the lower boundary. Simulation period is started after the four years of plant establishment.
Total soil moisture status in root zone was used as the auxiliary variable in the objective function and
crop coefficient at different crop growth stages were estimated using inverse optimization technique.
WIC performance was assessed by comparing the simulated and measured soil moisture content using
the root-mean-squared error (RMSE) of prediction:
n
i
ii yxn
RMSE1
2)(1
Eq. 5
where n is the number of data points of measured (xi) and simulated (yi) profile soil moisture.
Estimation of crop water balance
The calibrated model set-up was used to simulate water balance of 10-year time period between 2001
and 2010 capturing large variability of rainfall. Water balance components (ET, runoff and soil moisture)
are derived for dry, normal and wet years according to following classification (India Meteorological
Department, Pune, India; http://www.imdpune.gov.in): Rainfall less than 20% of the long-term average
= dry; Rainfall between –20% to +20% of the long-term average = normal; Rainfall greater than 20% of
long-term average = wet.
Model further was used to estimate ET under non-limiting water stress situation both for Jatropha and
Pongamia crops by applying auto irrigation setting in WIC between 2001 and 2010. Crop water stress
was analyzed by considering difference between actual ET and ET under non-limiting water condition
such as:
situtation water limitingNon under ET
actual ET-1 (-)Factor StressWater Eq. 6
RESULTS AND DISCUSSION
Variation of soil moisture in Jatropha and Pongamia watersheds
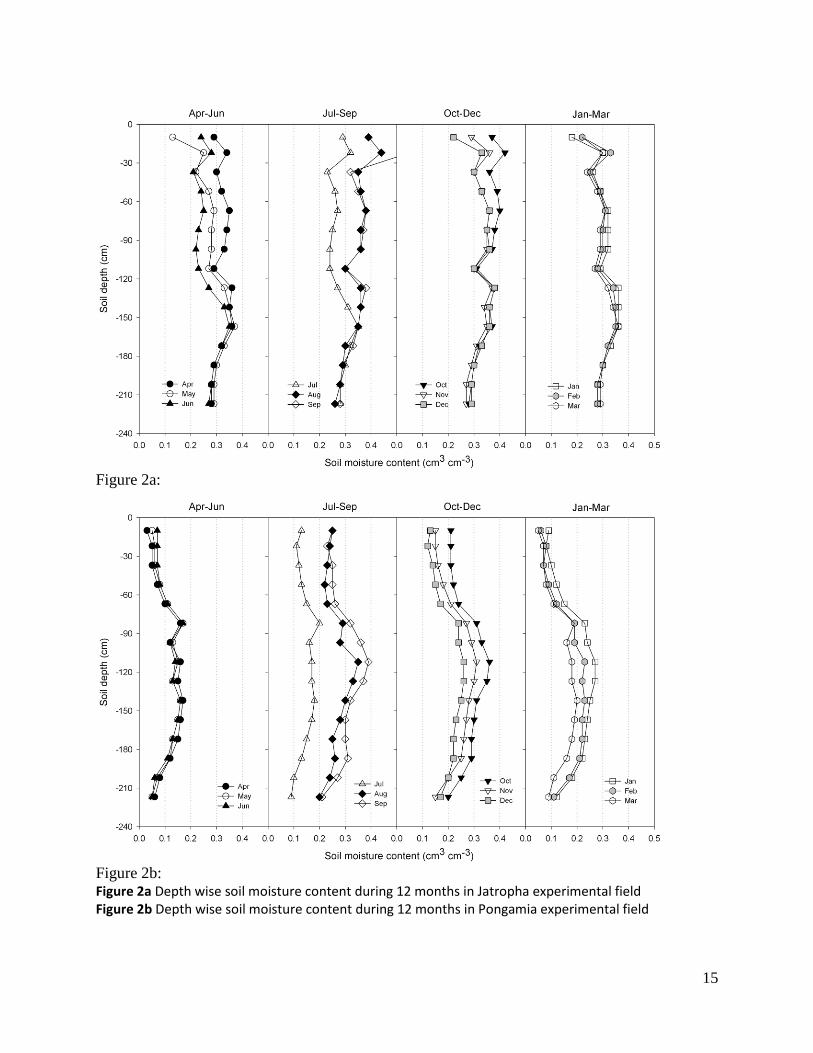
Soil moisture variation in block plantations of Jatropha and Pongamia are depicted in Figures 2a and 2b,
respectively. Figures are divided into four panels and each one shows moisture profile of three
consecutive months. In Jatropha field, new leaf flushes and biomass growth started by beginning of
8
April; flowering initiated by May/June; and pod formation and harvesting stage occurred between
September and December14. Previous stored soil moisture into subsurface layers was used by Jatropha
plants to fulfill water requirements during leaf sprouting. Thus, moisture level depleted significantly
between April and June (Figure 2a). Large variation in moisture profile is observed between July and
September, as this period coincided with peak vegetative growth and occurrence of monsoonal rainfall.
Total soil moisture was found highest during September. Moisture in soil profile is depleted slightly
during pod formation and harvesting stage during November/December. Variation in profile moisture
was found minimal between January and March because crop entered into dormancy phase and leaf
started falling down (Figure 2a). Soil moisture fluctuation generally was found up to 150 cm indicating
maximum effective rooting depth for Jatropha crop.27
In Pongamia field, low variation in moisture profile was observed during April and June, indicating lesser
water uptake (Figure 2b). Soil moisture content was increased during monsoon season and depleted
subsequently in non-monsoonal period as expected. Data showed that Pongamia being a perennial crop
could extract water from deeper and drier soil conditions. Several other studies indicated that Pongamia
has an extensive lateral root system and thick-long tap root28, which could be developed maximum up to
5-10 m length at fully matured stage29. Soil moisture level in Pongamia cultivated field is depleted much
higher compared to Jatropha cultivated fields. For example, soil moisture content for Jatropha and
Pongamia cultivated field in month of May-June was recorded as 0.2-0.3 cm3 cm-3 and 0.03-0.15 cm3 cm-
3, respectively.
Model performance
Soil moisture measured in Jatropha and Pongamia fields is compared with model simulated moisture
level between 2007 and 2011. Simulated soil moisture fluctuations are found comparable with observed
numbers at most of the times both for Jatropha and Pongamia cultivated fields. Root mean square error
in estimating profile moisture is 6.0 cm and 5.0 cm, which is equivalent to less than 10 % of total
moisture in given soil profiles, thus model performance is considered acceptable.
Crop coefficients and crop water requirements
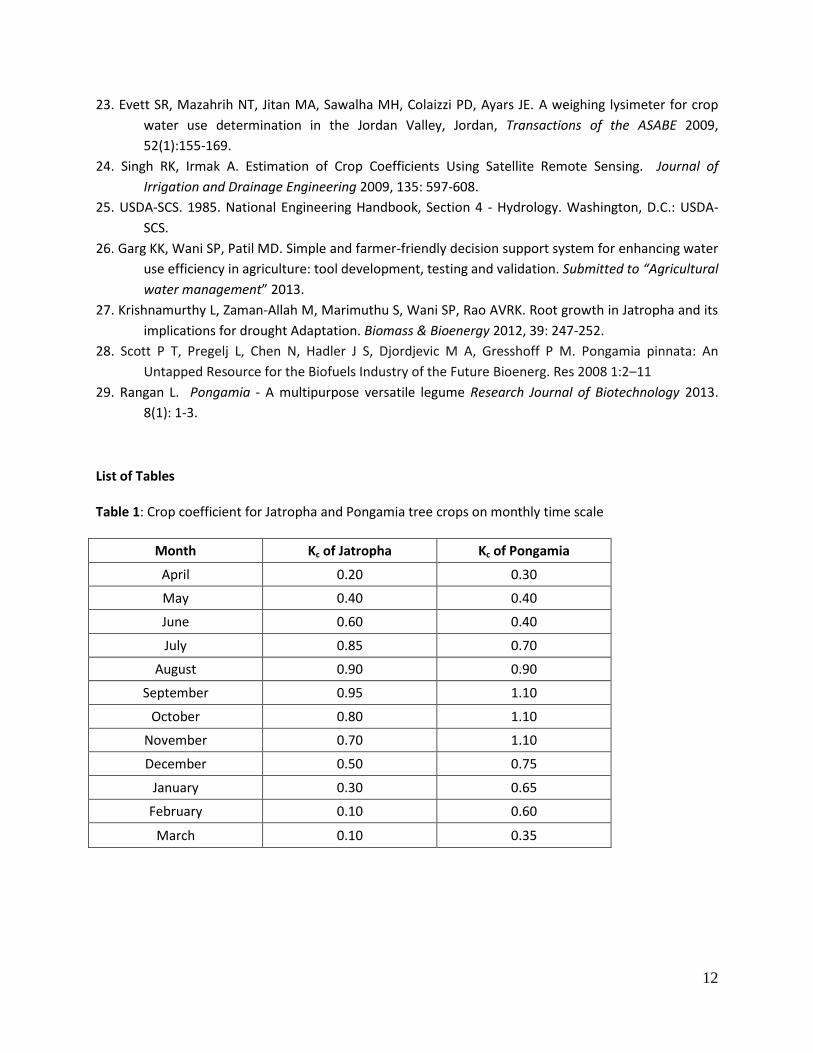
Crop coefficients estimated for Jatropha and Pongamia crops are summarized in Table 1. Kc for Jatropha
and Pongamia are found in range between 0.10-0.95 and 0.30-1.10, respectively. Maximum Kc was
found during August and September for both the crops.
9
Water balance components of Jatropha and Pongamia fields are summarized in Table 2. During normal
years, rainfall recorded was 911 mm (820 mm in monsoon and 91 mm in non-monsoon) at experimental
site. In these years, ET from Jatropha and Pongamia crop were estimated to be 685 and 830 mm year-1,
respectively. Surface runoff generated from both the crop lands is found almost similar, i.e., 130-135
mm (15 % of total rainfall). In Jatropha field, nearly 100 mm rainfall was harvested in terms of green
water. In Pongamia fields, 35 mm of net deficit in green water storage was observed by end of the crop
season in normal years.
ET from Jatropha and Pongamia field was found larger than the rainfall received during dry years. About,
130-150 mm harvested green water in previous years was utilized by crops during dry years as shown by
negative balance (Table 2). Surface runoff and deep percolation volume were estimated to be 90-100
mm, i.e., 14% of rainfall received. Results showed that poor rainfall in dry years led to develop water
shortage by 21 % (in terms of ET) than the required quantity for Pongamia crop (shown by water stress
factor in Table 2). On the other hand, crop water demand and availability for Jatropha crop was found in
comparable range.
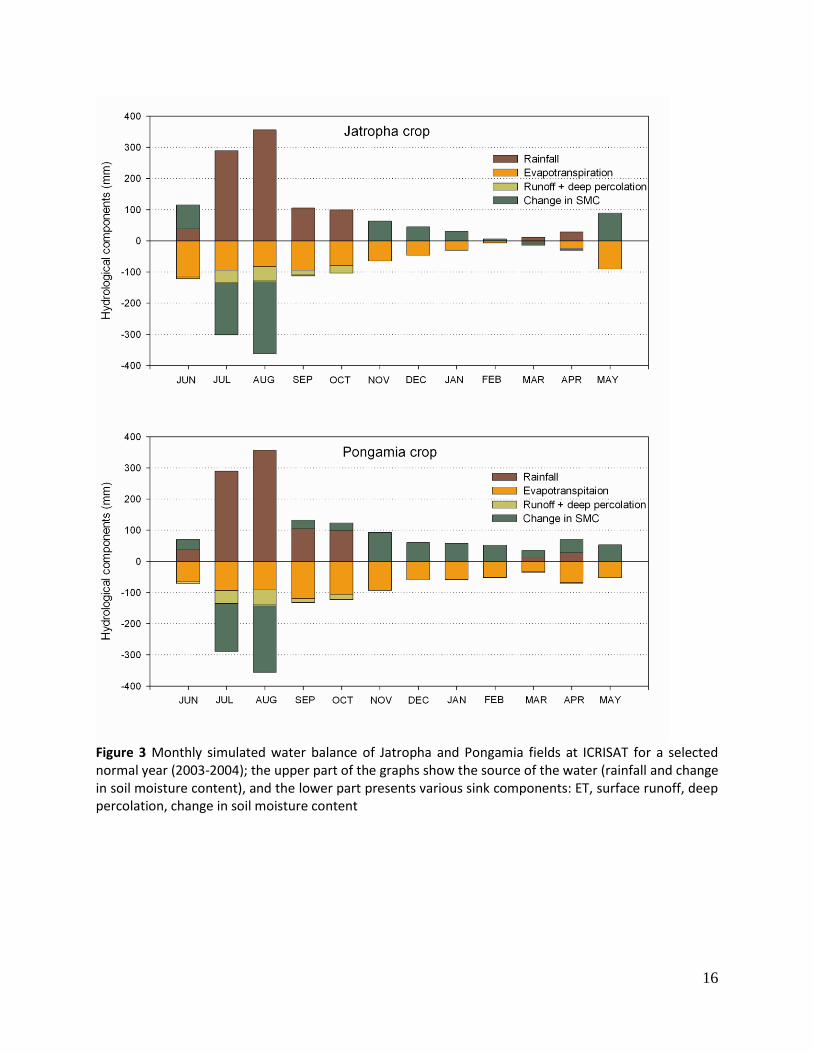
To show a detail description of mass balance, the monthly water balance of Jatropha and Pongamia field
is presented for one of the selected normal year (Figure 3). Total 850 mm of rainfall was received during
monsoon in year 2003. Thirty four per cent of monsoonal rain was captured as soil moisture, 52 % (440
mm) contributed to ET and 14 % (120 mm) was exported as surface runoff. In non-monsoon period
(Nov-May), harvested green water acted as source of water as shown in Figure 3. Results showed that
water requirements of both the crops were nearly same during monsoon period (460 mm) but
Pongamia required additional 200 mm water during non-monsoon season compared to Jatropha (240
mm). June is found the critical period for Jatropha growth and supplemental irrigation could be helpful
in dry years.
Conclusions
Jatropha and Pongamia are potential bio-diesel crops and could be grown in wide range of agro-climatic
and soil conditions. Water requirement of these two crops are estimated in the current study. Key
findings of this study are:
1. Water requirements of Jatropha and Pongamia are estimated to be 750 and 950 mm in semi-
arid tropics, respectively. Water balance showed that at ICRISAT out of 820 mm rainfall received
10
during monsoon period, 52 % was contributed to ET, 34 % stored as soil moisture and 14 %
exported outside from watershed as surface runoff. Consumptive water use by Jatropha and
Pongamia are found to be nearly same in monsoon, i.e., 460-500 mm. Water requirement (ET)
of Jatropha during non-monsoon period is found as 265 mm. Pongamia required 200 mm
additional water than Jatropha during non-monsoonal period.
2. Crop coefficients of Jatropha and Pongamia ranged from 0.10-0.95 and 0.30-1.1 depending on
growth stage, respectively. Pongamia is found to utilize green water from deeper and drier soil
layers compared to Jatropha crop.
3. Water availability for Pongamia crops was found adequate in wet years but slightly less (10%
shortage) in normal year. Poor rainfall in dry years led to develop water shortage by 20 % than
the required quantity in Pongamia field, whereas Jatropha experienced negligible water stress in
all the years. In-situ moisture availability played an important role in supplying water both for
Jatropha and Pongamia crops especially in non-monsoon period.
Crop coefficient estimated in current study could be useful to assess technical feasibility to grow
Jatropha and Pongamia crops in different agro-ecological regions and soil conditions.
References
1. Government of India. National Policy on Biofuels. Ministry of New & Renewable Energy 2009 New
Delhi.
2. Achten WMJ, Maes WH, Aerts R, Verchot L, Trabucco A, Mathijs E, Singh VP, Muys B. Jatropha: From
global hype to local opportunity. Journal of Arid Environments 2010, 74:164–165.
3. Wani SP, Sreedevi TK, Marimuthu S, Rao AVRK, Vineela C. Harnessing the potential of Jatropha and
Pongamia plantations for improving livelihoods and rehabilitating degraded lands. 6th
International Biofuels Conference 2009, March 4-5, New Delhi, India.
4. Wani SP, Chander G, Sahrawat KL, Rao CS, Raghvendra G, Susanna P, Pavani M. Carbon sequestration
and land rehabilitation through Jatropha curcas (L.) plantation in degraded lands. Agriculture,
Ecosystems and Environment 2012, 161: 112– 120.
5. EC. Communication from the European Commission on An EU Strategy for Biofuels, COM 2006, 34
final. European Commission,
6. Doornbosch R, Steenblik R. Round Table on Sustainable Development Biofuels: Is the cure worse than
the disease? Organization for Economic Cooperation and Development (OECD) 2007, 11-12
September.
7. Naylor R, Steinfield H, Falcon W, Galloway J, Smil V, Bradford E, Alder J, Mooney H. Losing the Links
between Livestock and Land. Science 2007, 310: 1621-1622.
8. Wani SP, Sreedevi TK. Pongamia’s journey from forest to microenterprise for improving livelihood,
International Crop Research Institute for the Semi-Arid Tropics. Research Report 2005 Global
Theme of Agroecosystems, Patancheru, India.
11
9. Sreedevi TK, Wani SP, Srinivasa Rao CH, Chaliganti R, Reddy RL. Jatropha and Pongamia rain-fed
plantations on wastelands in India for improved livelihoods and protecting environment. 6th
International Biofuels Conference 2009, March 4-5 New Delhi, India.
10. Wani SP, Osman M, D’Silva E, Sreedevi TK. Improved livelihoods and environmental protection
through biodiesel plantations in Asia. Asian Biotechnology and Development Review 2006 8(2):
11-29.
11. Achten WMJ, Verchot L, Franken YJ, Mathijs E, Singh VP, Aerts R. Review: Jatropha bio-diesel
production and use. Biomass & Bioenergy 2008, 32: 1063–1084.
12. Garg KK, Karlberg L, Wani SP, Berndes G. Jatropha production on wastelands in India: opportunities
and trade-offs for soil and water management at the watershed scale. Biofuels, Bioproducts &
Biorefining 2011, 5: 410–430.
13. Raju KV. Biofuels in South Asia: An overview, editorial introduction. Asian Biotechnology and
Development Review 2006: 8(2): 1-9.
14. Rao AVRK, Wani SP, Singh P, Srinivas K, Srinivasa Rao Ch. Water requirement and use by Jatropha
curcas in a semi-arid tropical location. Biomass & Bioenergy 2012, 39: 175-181.
15. Holl MA, Gush MB, Hallowes J, Versfeld DB. Jatropha curcas in South Africa: An Assessment of its
Water Use and Bio-Physical Potential. Report submitted to the Water Research Commission on
the project “Investigation into the Impacts of Large-Scale Planting of Jatropha curcas on Water
Resources, through Process-Based Research and Modelling”. WRC Report No 1497/1/07,
NOVEMBER 2007.
16. Gush MB and Moodley M. Water use assessment of Jatropha curcas. In: Holl M, Gush MB, Hallowes J
and Versfeld DB (eds.) Jatropha curcas in South Africa: An Assessment of its Water Use and Bio-
Physical Potential. WRC Report No. 1497/1/07 (Chapter 4). Water Research Commission,
Pretoria, RSA
17. Allen RG, Pereira LS, Raes D, Smith M. Crop evapotranspiration: Guidelines for computing crop water
requirements, Irrigation and Drainage Paper 56. United Nations FAO, Rome, 300 p.
http://www.fao.org/docrep/X0490E/X0490E00.htm 1998
18. Allen RG, Pereira LS. Estimating crop coefficients from fraction of ground cover and height. Irrigation
Science 2009, 28: 17–34.
19. Teixeira AH, de C, Bastiaanssen GM, Moura MSB, Soares JM, Ahmad MD, Bos MG. Energy and water
balance measurements for water productivity analysis in irrigated mango trees, Northeast
Brazil. Agricultural and Forest Meteorology 2008, 148: 1524–1537.
20. Paco TA, Ferreira MI, Rosa RD, Paredes P, Rodrigues GC, Conceicao N, Pacheco CA, Pereira LS. The
dual crop coefficient approach using a density factor to simulate the evapotranspiration of a
peach orchard: IMDualKc model versus eddy covariance measurements. Irrigation Science 2012,
30: 115–126.
21. Chen F, Robinson PJ. Estimating reference crop evapotranspiration with ET gauges. Journal of
Irrigation and Drainage Engineering 2009, 135 (3): 335-342.
22. Cancela JJ, Cuesta TS, Neira XX, Pereira LS. Modelling for improved irrigation water management in a
temperate region of Northern Spain. Biosystems Engineering 2006, 94(1): 151–163.
12
23. Evett SR, Mazahrih NT, Jitan MA, Sawalha MH, Colaizzi PD, Ayars JE. A weighing lysimeter for crop
water use determination in the Jordan Valley, Jordan, Transactions of the ASABE 2009,
52(1):155-169.
24. Singh RK, Irmak A. Estimation of Crop Coefficients Using Satellite Remote Sensing. Journal of
Irrigation and Drainage Engineering 2009, 135: 597-608.
25. USDA-SCS. 1985. National Engineering Handbook, Section 4 - Hydrology. Washington, D.C.: USDA-
SCS.
26. Garg KK, Wani SP, Patil MD. Simple and farmer-friendly decision support system for enhancing water
use efficiency in agriculture: tool development, testing and validation. Submitted to “Agricultural
water management” 2013.
27. Krishnamurthy L, Zaman-Allah M, Marimuthu S, Wani SP, Rao AVRK. Root growth in Jatropha and its
implications for drought Adaptation. Biomass & Bioenergy 2012, 39: 247-252.
28. Scott P T, Pregelj L, Chen N, Hadler J S, Djordjevic M A, Gresshoff P M. Pongamia pinnata: An
Untapped Resource for the Biofuels Industry of the Future Bioenerg. Res 2008 1:2–11
29. Rangan L. Pongamia - A multipurpose versatile legume Research Journal of Biotechnology 2013.
8(1): 1-3.
List of Tables Table 1: Crop coefficient for Jatropha and Pongamia tree crops on monthly time scale
Month Kc of Jatropha Kc of Pongamia
April 0.20 0.30
May 0.40 0.40
June 0.60 0.40
July 0.85 0.70
August 0.90 0.90
September 0.95 1.10
October 0.80 1.10
November 0.70 1.10
December 0.50 0.75
January 0.30 0.65
February 0.10 0.60
March 0.10 0.35
13
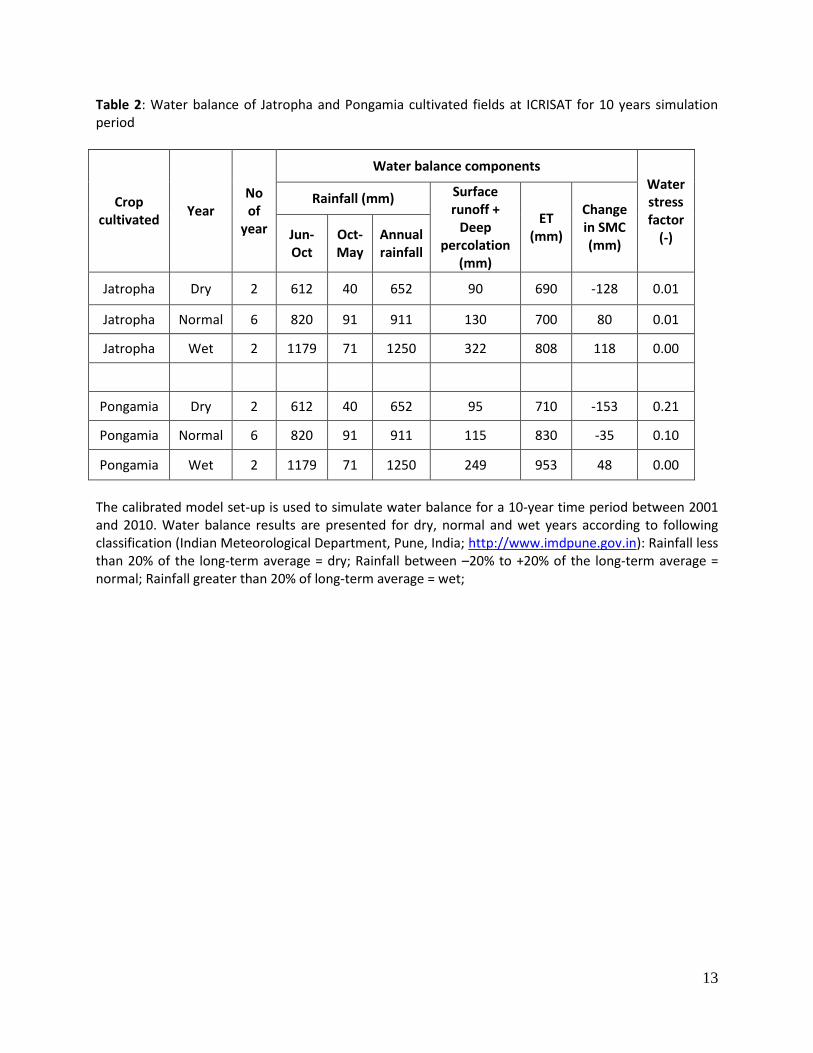
Table 2: Water balance of Jatropha and Pongamia cultivated fields at ICRISAT for 10 years simulation period
Crop cultivated
Year No of
year
Water balance components Water stress factor
(-)
Rainfall (mm) Surface runoff +
Deep percolation
(mm)
ET (mm)
Change in SMC (mm)
Jun-Oct
Oct-May
Annual rainfall
Jatropha Dry 2 612 40 652 90 690 -128 0.01
Jatropha Normal 6 820 91 911 130 700 80 0.01
Jatropha Wet 2 1179 71 1250 322 808 118 0.00
Pongamia Dry 2 612 40 652 95 710 -153 0.21
Pongamia Normal 6 820 91 911 115 830 -35 0.10
Pongamia Wet 2 1179 71 1250 249 953 48 0.00
The calibrated model set-up is used to simulate water balance for a 10-year time period between 2001 and 2010. Water balance results are presented for dry, normal and wet years according to following classification (Indian Meteorological Department, Pune, India; http://www.imdpune.gov.in): Rainfall less than 20% of the long-term average = dry; Rainfall between –20% to +20% of the long-term average = normal; Rainfall greater than 20% of long-term average = wet;
14
List of Figures
Figure 1: Layout of neutron probe access tubes for soil moisture measurement in Jatropha and Pongamia field at ICRISAT, Patancheru.
15
Figure 2a:
Figure 2b: Figure 2a Depth wise soil moisture content during 12 months in Jatropha experimental field Figure 2b Depth wise soil moisture content during 12 months in Pongamia experimental field
16
Figure 3 Monthly simulated water balance of Jatropha and Pongamia fields at ICRISAT for a selected normal year (2003-2004); the upper part of the graphs show the source of the water (rainfall and change in soil moisture content), and the lower part presents various sink components: ET, surface runoff, deep percolation, change in soil moisture content