crop calorie supply under climate change and vulnerability ... · pot-ir: yield potential for ......
TRANSCRIPT

Crop calorie supply under climate change and vulnerability to drought events at +2°C of global warming threshold in Europe
Juraj Balkovič, Rastislav Skalský, Christian
Folberth, Nikolay Khabarov, Erwin Schmid, Mikuláš
Madaras, Michael Obersteiner, and Marijn van der
Velde
IIASA, BOKU, CRI, JRC

"Indicators for climate extremes and socio-economic impacts under different emission targets", Ispra, JRC, 4-6 Oct. 2017
Outline
• Methods
• Tools validation
• Vulnerability to drought events
• Impact of a +2°C global warming
• Bracketing uncertainties
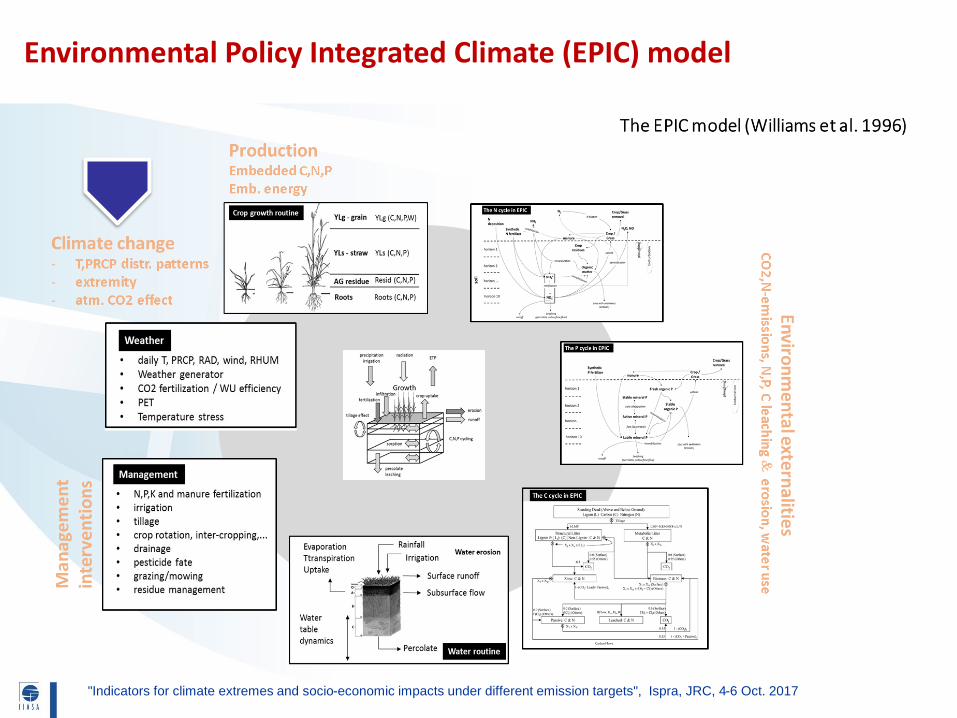
Environmental Policy Integrated Climate (EPIC) model
"Indicators for climate extremes and socio-economic impacts under different emission targets", Ispra, JRC, 4-6 Oct. 2017

EPIC-IIASA GGCM to simulate agricultural systems at large scale
• EU-version gridded at 1-km resolution (Balkovič et al. 2013)
"Indicators for climate extremes and socio-economic impacts under different emission targets", Ispra, JRC, 4-6 Oct. 2017

EPIC-IIASA GGCM Agricultural crop calorie yield
"Indicators for climate extremes and socio-economic impacts under different emission targets", Ispra, JRC, 4-6 Oct. 2017
yt,p,s,c – simulated crop yield (in t ha-1) c – crop (maize, wheat, rye, barley, rapeseed, sunflower, sugar beet, potato, soya, rice) p – grid cell, s – climate change scenario t – year
y(r), y(i) – simulated crop yield under rainfed (r) and irrigated conditions (i) fc,p – fraction of irrigated area of the c-th crop in the p-th grid, Yt,p,s – aggregated calorie yield (in Gcal ha–1) k – number of crops gc – calorie content in the unit yield
BAU: BAU-fertilization and irrigation (Balkovič et al. 2013; Wriedt et al. 2009) POT-RF: yield potential for rainfed systems POT-IR: yield potential for irrigated systems and environments not limited by water
𝑦𝑡,𝑝,𝑠,𝑐 = 1 − 𝑓𝑐,𝑝 ∙ 𝑦(𝑟 𝑡,𝑝,𝑠,𝑐 + 𝑓𝑐,𝑝∙ 𝑦(𝑖 𝑡,𝑝,𝑠,𝑐
𝑌𝑡,𝑝,𝑠 = 𝑔𝑐 ∙ 𝑦𝑡,𝑝,𝑠,𝑐
𝑘
𝑐=1

"Indicators for climate extremes and socio-economic impacts under different emission targets", Ispra, JRC, 4-6 Oct. 2017
Outline
• Methods
• Tools validation
• Vulnerability to drought events
• Impact of a +2°C global warming
• Bracketing uncertainties

MODEL VALIDATION Long-term historical crop calorie yields
• CGMS weather data from 1990 to 2000 • Aggregated at EU NUTS2 regions (EPIC vs EUROSTAT)
"Indicators for climate extremes and socio-economic impacts under different emission targets", Ispra, JRC, 4-6 Oct. 2017

EU
MODEL VALIDATION Anomalies in crop calorie yields due to drought events
R2 = 0.62 P<0.003
"Indicators for climate extremes and socio-economic impacts under different emission targets", Ispra, JRC, 4-6 Oct. 2017
• Heat wave and drought 2003
Russo et al. (2015, ERL 10)
EU
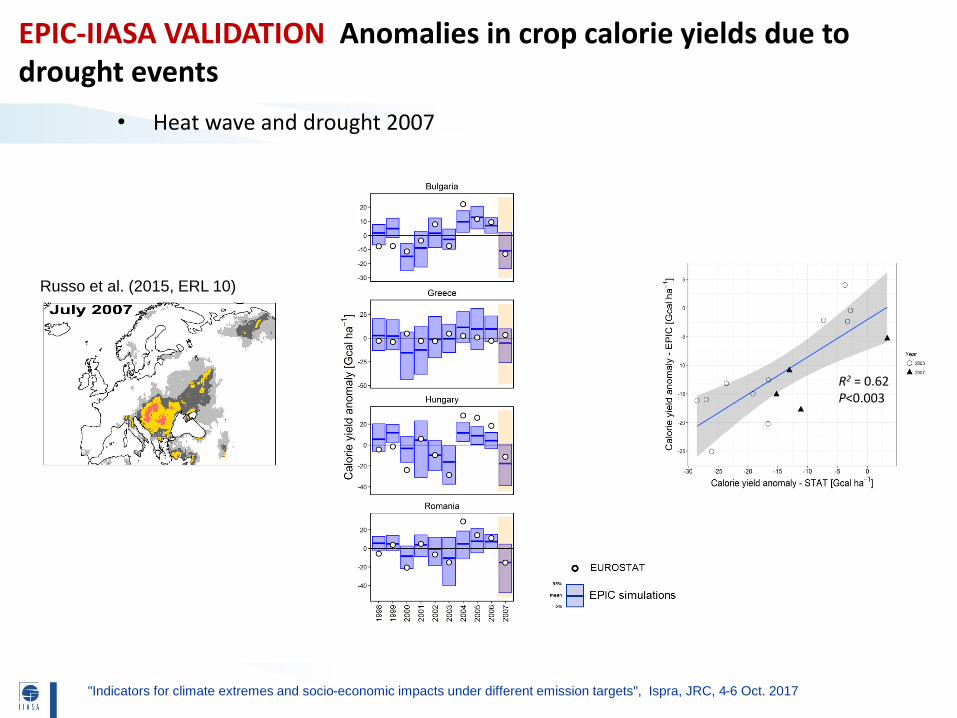
EPIC-IIASA VALIDATION Anomalies in crop calorie yields due to drought events
"Indicators for climate extremes and socio-economic impacts under different emission targets", Ispra, JRC, 4-6 Oct. 2017
Russo et al. (2015, ERL 10)
R2 = 0.62 P<0.003
• Heat wave and drought 2007

"Indicators for climate extremes and socio-economic impacts under different emission targets", Ispra, JRC, 4-6 Oct. 2017
Outline
• Methods
• Tools validation
• Vulnerability to drought events
• Impact of a +2°C global warming
• Bracketing uncertainties

• Yield vulnerability (V) is quantified as a fraction of crop yield that may be lost due
to harmful effects of climate
• The meteorological drought was identified using SPEI (Vicente-Serrano et al. 2010) calculted monthly
• Drought: mean SPEI over the growing season < -1 (Van Oijen et al. 2014)
• Vulnerability to meteorological drought (Vd):
VULNERABILITY Concept of vulnerablity to drought events
"Indicators for climate extremes and socio-economic impacts under different emission targets", Ispra, JRC, 4-6 Oct. 2017
𝑉𝑑𝑝 = 1
𝑛 𝑔𝑐 ∙ 𝑦𝑡,𝑝,𝑠,𝑐
𝑛𝑡=1,𝑠=1
𝑘𝑐=1 −
1
𝑚 𝑔𝑐 ∙ 𝑦𝑡,𝑝,𝑠,𝑐
𝑚𝑡=1,𝑠=1
𝑘𝑐=1
m years with SPEI < -1 n years with SPEI ≥ -1

• mean SPEI of crop growing season • regionalized index of drought
VULNERABILITY Proof Of Concept
"Indicators for climate extremes and socio-economic impacts under different emission targets", Ispra, JRC, 4-6 Oct. 2017
drought
FARM (ACRP 8th Call Project)
Burgenland Lower Austria Carinthia
Styria Salzburg

VULNERABILITY SPEI to determine yield vulnerability
25% 44%
"Indicators for climate extremes and socio-economic impacts under different emission targets", Ispra, JRC, 4-6 Oct. 2017
FARM (ACRP 8th Call Project)

"Indicators for climate extremes and socio-economic impacts under different emission targets", Ispra, JRC, 4-6 Oct. 2017
Outline
• Methods
• Tools validation
• Vulnerability to drought events
• Impact of a +2°C global warming
• Bracketing uncertainties

• The Quantifying Projected Impacts Under 2°C Warming (IMPACT2C) Project (http://impact2c.hzg.de)
• Bias-corrected data from EURO-CORDEX database form IMPACT2C
+2°C WARMING Background
• CSC-REMO/MPI-ESM-LR (RCP 4.5) • SMHI-RCA4/EC-EARTH (RCP 4.5) • KNMI-RACMO22E/EC-EARTH (RCP 4.5) • SMHI-RCA4/HadGEM2-ES (RCP 4.5) • IPSL-WRF331F/IPSL-CM5A-MR (RCP 4.5)
• +2°C period when the 30-year running mean temperature calculated from the base period 1971–2000 exceeds the +2°C threshold globally (Vautard et al., 2014)
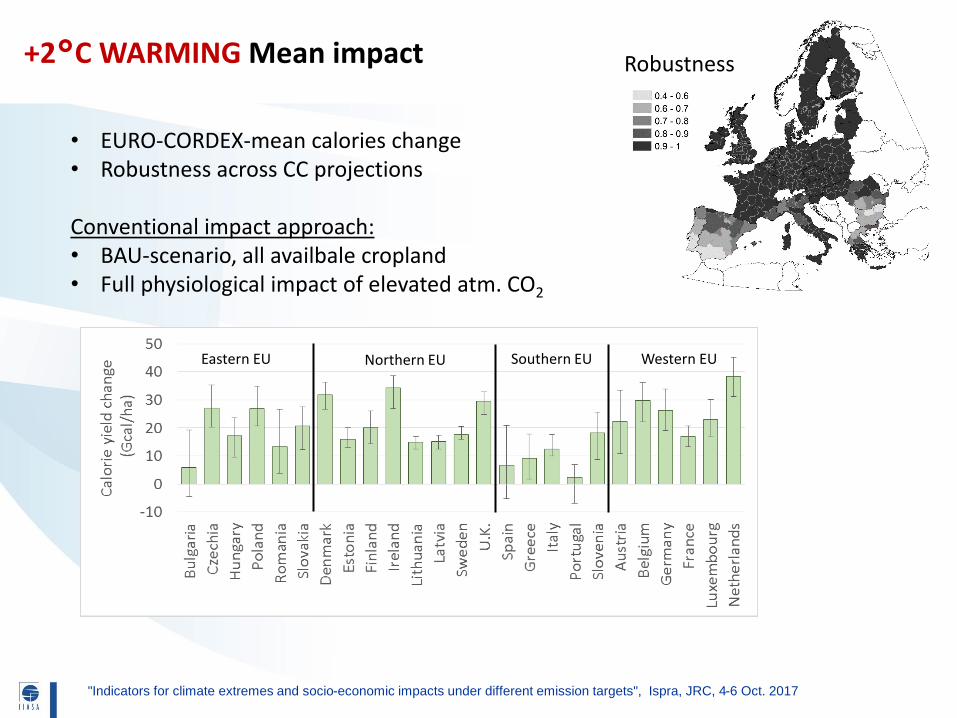
• EURO-CORDEX-mean calories change • Robustness across CC projections
Conventional impact approach: • BAU-scenario, all availbale cropland • Full physiological impact of elevated atm. CO2
+2°C WARMING Mean impact
"Indicators for climate extremes and socio-economic impacts under different emission targets", Ispra, JRC, 4-6 Oct. 2017
Eastern EU Northern EU Southern EU Western EU
Robustness

• high vulnerability (> 40 Gcal/ha) in the Pannonian zone, namely Bulgaria, Romania, and Hungary
• followed by Greece and Spain (> 30 Gcal/ha)
+2°C WARMING Drought vulnerability
"Indicators for climate extremes and socio-economic impacts under different emission targets", Ispra, JRC, 4-6 Oct. 2017
Figure. Crop calorie yield distribution under +2°C (red: years with dry GS, blue: years with normal GS)

"Indicators for climate extremes and socio-economic impacts under different emission targets", Ispra, JRC, 4-6 Oct. 2017
Outline
• Methods
• Tools validation
• Vulnerability to drought events
• Impact of a +2°C global warming
• Bracketing uncertainties

• Uncertainty analysis of elevated CO2 and temperature impacts (wheat example) • KNMI projection • Ample nutrients; rainfed and irrigated
+2°C WARMING Projection uncertainty (T and CO2)
"Indicators for climate extremes and socio-economic impacts under different emission targets", Ispra, JRC, 4-6 Oct. 2017
Asseng et al. 2014
Kimball 2016
+200 ppm

• Soil degradation (D) • Soil degradation with conservation practic. (Dc) • Crop intensification (POT) • Elevated CO2 impact (+/- CO2) • Temperature impact
+2°C WARMING Bracketing projection-specific uncertainties
"Indicators for climate extremes and socio-economic impacts under different emission targets", Ispra, JRC, 4-6 Oct. 2017
+2°C period

"Indicators for climate extremes and socio-economic impacts under different emission targets", Ispra, JRC, 4-6 Oct. 2017
Thank you for your attention!