crisis in a fog or what hopes the russian pharma for? - rafm 2015_demidov_ims health.pdf · crisis...
TRANSCRIPT

0
Кризис в тумане или на что надеется
российский фармрынок в 2015 году
IMS General manager Russia&CIS
04.06.2015
Crisis in a fog or what hopes the Russian pharma for?
Nickolai Demidov

Russia entered a period of economic turmoil (1 / 1)
-3,8% 0,6% 1,3% 3,4% 4,3%
2015E
42,0
2014
43,7
2013
43,4
2012
42,9
2011
41,5
2010
39,8
Russian GDP dynamics, trillion rubles
GDP, Constant prices, Trillion RUB
Comments
Macroeconomic outlook is worsening due to
drop in the oil prices
economic sanctions
Healthcare spending level will remain unchanged (4,1% of GDP)
Potential increase (1,4% of GDP) initially planned by the government will not be realized
G
enera
l tr
ends
Econom
ic c
risis
Source: EIU, IMF, Ministry of health, IMS Health analysis
1 Russian pharmaceutical market at a crossroad
2015E
93,7%
2014
99,0%
2013
103,2%
2012
104,6%
2011
100,5%
2010
105,9% Real disposable income dynamics, % change to the previous year
Unemployment rate dynamics, % of economically active population
-0,8 p.p.
0,0 p.p. -1,0 p.p.
2010
7,3%
+0,9 p.p.
+0,1 p.p.
2013
5,5%
2012
5,5%
2011
6,5%
2014
5,6% 6,5%
2015E
Disposable income growth is no more supporting the consumption and doesn’t help to compensate inflation
Unemployment forecast is showing threat to reach the worst level since 2009
But we also should keep in
mind that official forecast
especially for negative
trends are commonly more
cautious

2
Week macroeconomic outlook, evident negative tendencies and high uncertainty with the future leave the business uncertain regarding the future Context of first 5 months
• after 3 months of market volatility kind of break began in April 2015 - is it a major trend or just a respite?
• decrease of domestic income, and some subjective predictions that “people will be short of money already in summer” - true or false?
• short term benefits for wholesalers – then painfully landing from the peak of roller coaster or it’s a year of whlsaller?
• feverish regulation, obvious lack of agreement between the branches of government – should we wait for any support from state in order to sustain the crisis?
• In general: there are evidences that Russian pharma put on hold in terms of enhancement of investments though strategic projects go on
Ma
rket re
actin
g to
crisis
O
OP
se
cto
r tr
en
ds
2
Russian pharmaceutical market at a crossroad
How ph companies react?
• Budgets frozen and under constant revision, though pharma is strongly #1 at TV
increasing interest to calculations of immediate effect, ROI and factors determining
But decrease of common excepted ROI?
• Price increase
Rx EDL – toughly restrained by regulation
Rx&OTC non EDL - restrained naturally by elasticity
• Revision of partnership with whs and chains
with whsl: reinforce of financial and shipments volumes and frequency
with chains: Promo – seeking for optimal minimum
G
en
era
l tr
en
ds
3
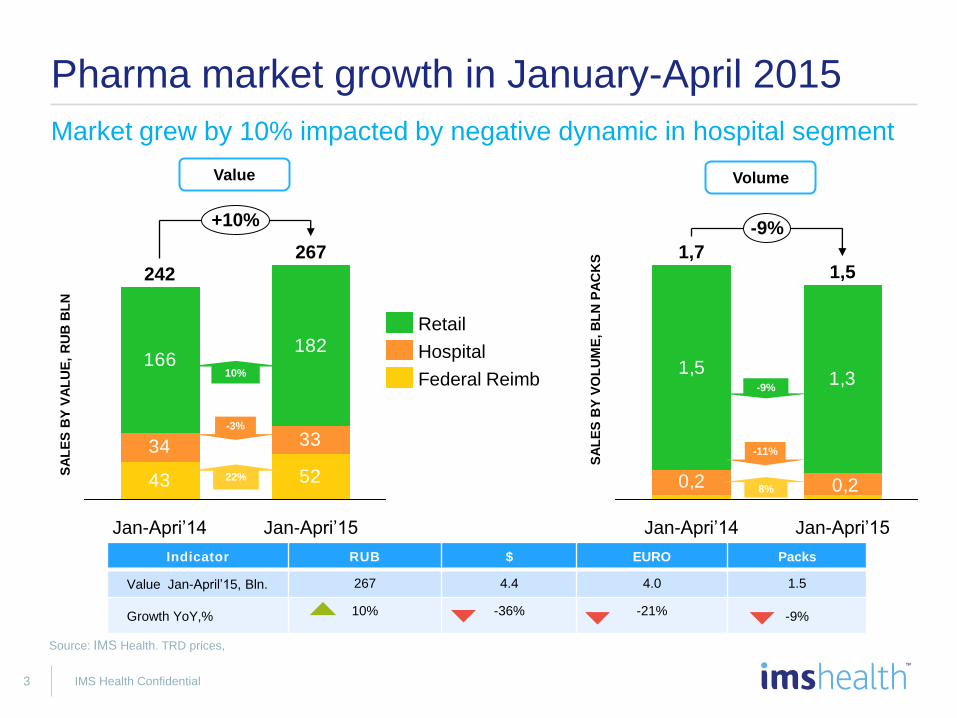
Indicator RUB $ EURO Packs
Value Jan-April’15, Bln. 267 4.4 4.0 1.5
Growth YoY,% 10% -36% -21% -9%
IMS Health Confidential
Pharma market growth in January-April 2015
43 52
34 33
166182
+10%
Jan-Apri’15
267
Jan-Apri’14
242
Retail
Federal Reimb
Hospital
SA
LE
S B
Y V
AL
UE
, R
UB
BL
N
22%
Value Volume
SA
LE
S B
Y V
OL
UM
E, B
LN
PA
CK
S
0,2
1,51,3
0,2
1,5
Jan-Apri’14 Jan-Apri’15
-9%
1,7
8%
Source: IMS Health. TRD prices,
Market grew by 10% impacted by negative dynamic in hospital segment
10%
-3%
-9%
-11%

Retail out-of-pocket market growth in Jan-Apr 2015 vs. Jan-Apr 2014
81,3 88,4
84,6 93,8
+9,6%
YTD4_2014
193,5
11
YTD4_2013
176,6
10,7 0,12 0,12
0,45 0,41
1,03 0,94
-8%
YTD4_2014
1,47
YTD4_2013
1,59
Food supplements
Rx
OTC
Value Volume
6,1%
10,9%
8,6%
+1,3%
-8,3%
-8,9%
SA
LE
S B
Y V
ALU
E,
RU
B B
LN
SA
LE
S B
Y V
OLU
ME
, B
LN
PA
CK
S
Source: IMS Health. TRD prices
© 2014 IMS Health Incorporated or its affiliates. All rights reserved 4
OTCs grow faster by value but dropped deeper with volumes consumed

5 IMS Health Confidential
Medical Devices+Parapharma sales dynamics in Q1 2015 vs. Q2 2014, TRD prices
Tonometers+
Thermometers
Glucometers+
Test-strips
Insulin.syringes+
needles
1.426
1.258 1.264
+24%
1.297
Condoms+
Lubricants
84
+10%
Incontinence
care
0%
+10%
Enteral nutrition
1.157
1.434
55
706
990
128 141
+40%
+54%
Q1 2015
Q1 2014
Va
lue
in m
io R
UR
, in
wh
ls p
rice
s

6 IMS Health Confidential
Retail market monthly sales and growth structure in January-April 2015
Dec Nov Oct Sep Aug Jul Jun May Apr Mar Feb Jan
2015 2014 2013
VA
LU
E (
TR
D)
Total
Growth
10%
New
products
1,9%
Volume
10,9%
Structure
0,6%
Price
20,3%
Drop-out
products*
-0,1
Growth components*
Source: IMS Health. Data at TRD prices, drop-out products are excluded due to low figures
Market keeps growing being driven by inflation
• Jan-Apr 2015 wasn’t similar to previous year
• Restore of purchase in February after peak in December’14
Price increase again drives sales on OOP market…
Price increase tuned back as major growth component though EDL price regulation
• Eliminated switch to better/more expensive factor (Structure)
• Still have positive effect from new products launches
• Volumes decrease is strongly negative factor pulling the growth down

7 IMS Health Confidential
Retail market growth in January-April 2015
Dec Nov Oct Sep Aug Jul Jun May Apr Mar Feb Jan
2015 2014 2013
VA
LU
E (
TR
D)
Source: IMS Health. Data at TRD prices, drop-out products are excluded due to low figures
Market keeps seasonality, every year consistently over past years
• Jan-Apr 2015 wasn’t similar to previous year
• Restore of purchase in February after peak in December’14
• Volumes strongly dropped
• declining trend
• no hint for further improvement
• summer is expected to be “cold”
Price increase drives sales on OOP market while volumes of pharmaceuticals
sold are declining
2015 2014 2013
Dec Nov Oct Sep Aug Jul Jun May Apr Mar Feb Jan
VO
LU
ME
(T
RD
)
Monthly dynamics in Jan’13-Apr’15 by value, RUB
Monthly dynamics in Jan’13-Apr’15 by volume, packs
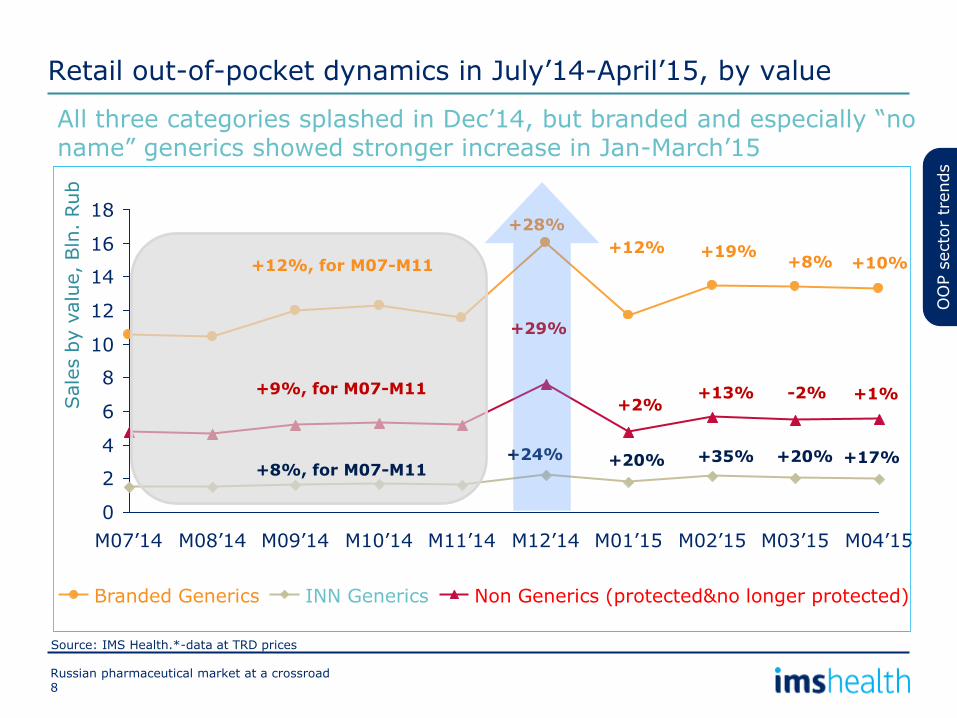
Retail out-of-pocket dynamics in July’14-April’15, by value
Source: IMS Health.*-data at TRD prices
OO
P s
ecto
r tr
ends
18
16
14
12
10
8
6
4
2
0
M04’15 M03’15 M02’15 M01’15 M12’14 M11’14 M10’14 M09’14 M08’14 M07’14
Sale
s b
y v
alu
e, Bln
. Rub
Non Generics (protected&no longer protected) Branded Generics INN Generics
All three categories splashed in Dec’14, but branded and especially “no name” generics showed stronger increase in Jan-March’15
+12%, for M07-M11
+28%
+12% +19%
+8%, for M07-M11 +24% +20% +35%
+9%, for M07-M11
+29%
+2% +13%
+8%
+20%
-2%
8 Russian pharmaceutical market at a crossroad
+10%
+17%
+1%

Retail out-of-pocket dynamics in July’14-April’15, by volume
Source: IMS Health.*-data at TRD prices
OO
P s
ecto
r tr
ends
120
100
80
60
40
20
0
M03’15 M02’15 M01’15 M12’14 M11’14 M10’14 M09’14 M08’14 M07’14 M04’15
Sale
s b
y v
olu
me, M
ln. packs
Non Generics (protected&no longer protected) Branded Generics INN Generics
After rapid increase in December, there is likely to be a trend break/ swing in Dec’14/Jan’15
+5%, for M07-M11
-4%, for M07-M11
+2%, for M07-M11
+9%
-8% -1%
+8%
-4%
+9%
+12%
-13% +4%
-11%
-6%
-17%
9 Russian pharmaceutical market at a crossroad
-9%
-10%
-13%
10
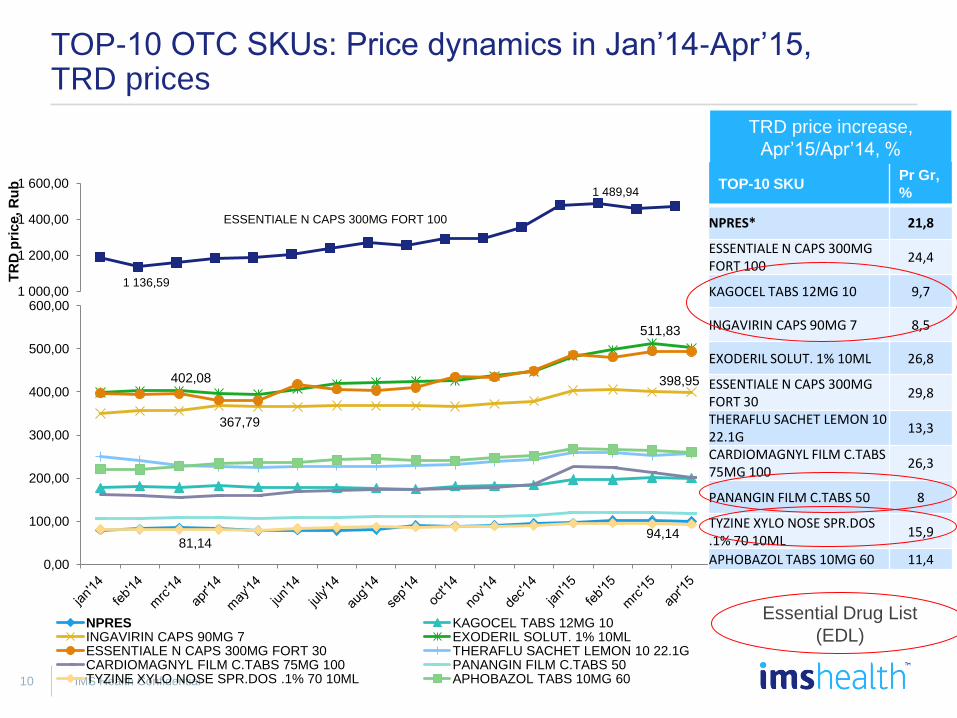
Essential Drug List
(EDL)
IMS Health Confidential
TOP-10 OTC SKUs: Price dynamics in Jan’14-Apr’15, TRD prices
1 136,59
1 489,94
1 000,00
1 200,00
1 400,00
1 600,00
TR
D p
ric
e, R
ub
ESSENTIALE N CAPS 300MG FORT 100
367,79
398,95 402,08
511,83
81,14 94,14
0,00
100,00
200,00
300,00
400,00
500,00
600,00
NPRES KAGOCEL TABS 12MG 10 INGAVIRIN CAPS 90MG 7 EXODERIL SOLUT. 1% 10ML ESSENTIALE N CAPS 300MG FORT 30 THERAFLU SACHET LEMON 10 22.1G CARDIOMAGNYL FILM C.TABS 75MG 100 PANANGIN FILM C.TABS 50 TYZINE XYLO NOSE SPR.DOS .1% 70 10ML APHOBAZOL TABS 10MG 60
TOP-10 SKU Pr Gr,
%
NPRES* 21,8
ESSENTIALE N CAPS 300MG FORT 100
24,4
KAGOCEL TABS 12MG 10 9,7
INGAVIRIN CAPS 90MG 7 8,5
EXODERIL SOLUT. 1% 10ML 26,8
ESSENTIALE N CAPS 300MG FORT 30
29,8
THERAFLU SACHET LEMON 10 22.1G
13,3
CARDIOMAGNYL FILM C.TABS 75MG 100
26,3
PANANGIN FILM C.TABS 50 8
TYZINE XYLO NOSE SPR.DOS .1% 70 10ML
15,9
APHOBAZOL TABS 10MG 60 11,4
TRD price increase,
Apr’15/Apr’14, %
11 IMS Health Confidential
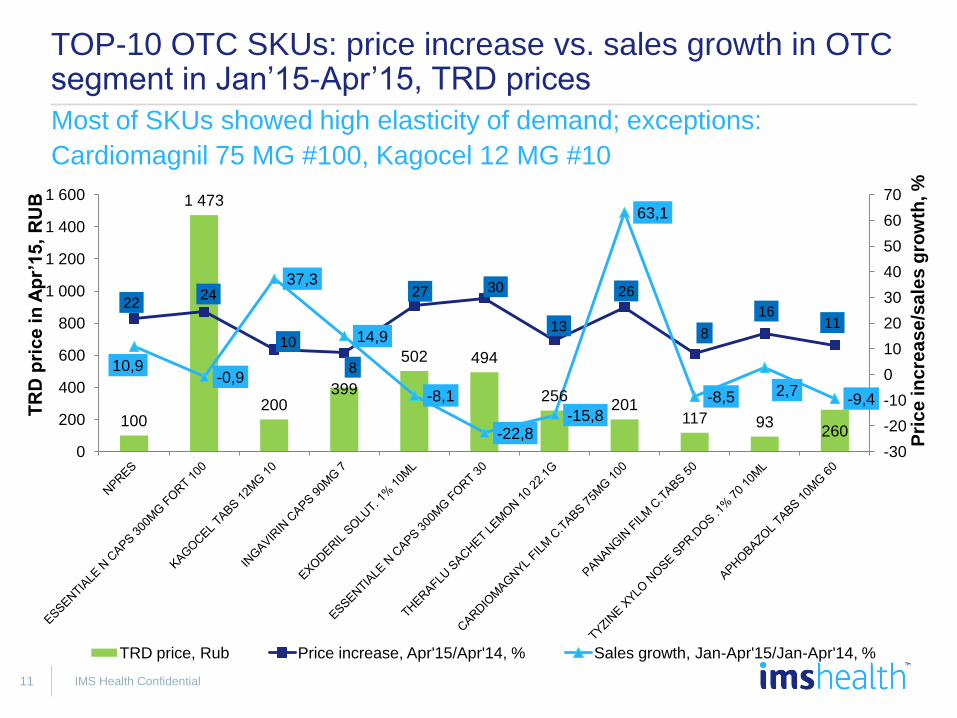
TOP-10 OTC SKUs: price increase vs. sales growth in OTC segment in Jan’15-Apr’15, TRD prices
100
1 473
200 399
502 494
256 201
117 93 260
22 24
10
8
27 30
13
26
8
16 11
10,9 -0,9
37,3
14,9
-8,1
-22,8 -15,8
63,1
-8,5 2,7 -9,4
-30
-20
-10
0
10
20
30
40
50
60
70
0
200
400
600
800
1 000
1 200
1 400
1 600
Pri
ce
in
cre
as
e/s
ale
s g
row
th, %
TR
D p
ric
e in
Ap
r’1
5,
RU
B
TRD price, Rub Price increase, Apr'15/Apr'14, % Sales growth, Jan-Apr'15/Jan-Apr'14, %
Most of SKUs showed high elasticity of demand; exceptions:
Cardiomagnil 75 MG #100, Kagocel 12 MG #10

12
Essential Drug List
(EDL)
IMS Health Confidential
TOP-10 Rx SKUs: Price dynamics in Jan’14-Apr’15, TRD prices
TOP-10 SKU Pr Gr,
%
PRESC 18,6
ALFLUTOP AMP. 10MG 10 1ML
28,0
NISE TABS 100MG 20 41,4
DUPHASTON C.TAB 10MG 20 3,3
ACTOVEGIN AMP. 200MG 5 5ML
18,4
HEPTRAL ENTER.C.TABS 400MG 20
3,6
PREDUCTAL MV C.TAB MR 35MG 60
8,8
OMEZ CAPS 20MG 30 6,4
NIMESIL GRAN F/SUSP 100MG 30 2G
20,8
YAZ FILM C.TABS 28 13,6
CONCOR FILM C.TABS 5MG 50 7,3
TRD price increase,
Apr’15/Apr’14, %
1381
1768
1462
1 515
1 200
1 300
1 400
1 500
1 600
1 700
1 800
ALFLUTOP AMP. 10MG 10 1ML
HEPTRAL ENTER.C.TABS 400MG 20
446 578
528
618
702 673
500
661,12 604
728
874 827
0
100
200
300
400
500
600
700
800
900
PRESC NISE TABS 100MG 20 DUPHASTON C.TAB 10MG 20 ACTOVEGIN AMP. 200MG 5 5ML PREDUCTAL MV C.TAB MR 35MG 60 OMEZ CAPS 20MG 30 NIMESIL GRAN F/SUSP 100MG 30 2G YAZ FILM C.TABS 28 CONCOR FILM C.TABS 5MG 50
13 IMS Health Confidential
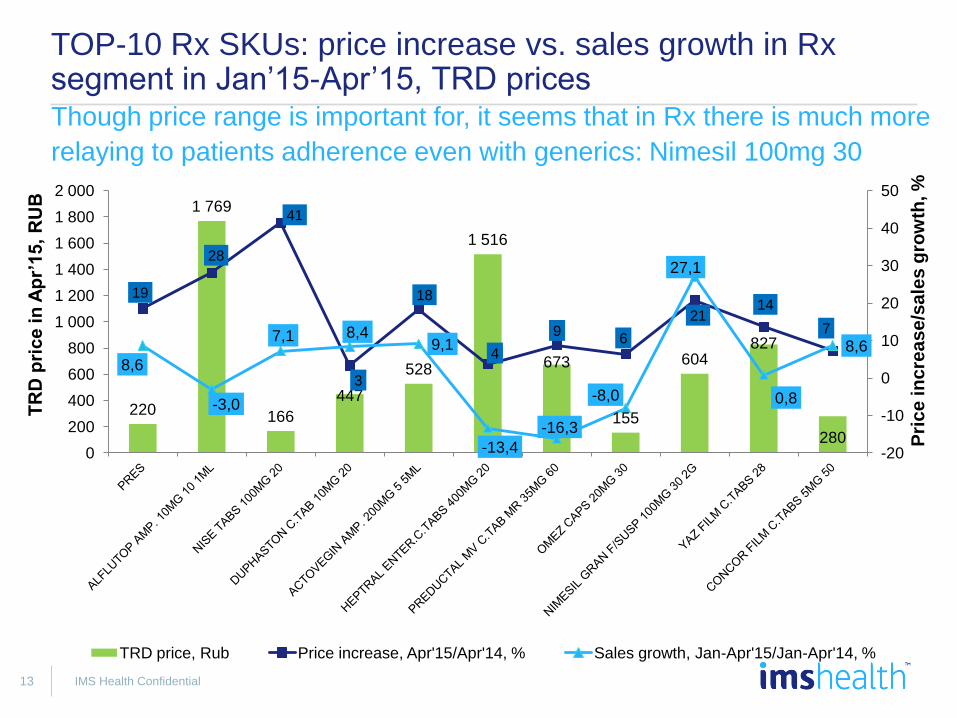
TOP-10 Rx SKUs: price increase vs. sales growth in Rx segment in Jan’15-Apr’15, TRD prices
220
1 769
166
447
528
1 516
673
155
604 827
280
19
28
41
3
18
4
9 6
21 14
7
8,6
-3,0
7,1 8,4 9,1
-13,4
-16,3
-8,0
27,1
0,8
8,6
-20
-10
0
10
20
30
40
50
0
200
400
600
800
1 000
1 200
1 400
1 600
1 800
2 000
Pri
ce
in
cre
as
e/s
ale
s g
row
th, %
TR
D p
ric
e in
Ap
r’1
5,
RU
B
TRD price, Rub Price increase, Apr'15/Apr'14, % Sales growth, Jan-Apr'15/Jan-Apr'14, %
Though price range is important for, it seems that in Rx there is much more
relaying to patients adherence even with generics: Nimesil 100mg 30

Out of pocket market is expected to grow by 12-18%
Source: IMS Health. Data at TRD prices, drop-out products are excluded due to low figures
0,8%
0,2%
8,7%
Total Growth
10%
New products*
Volume Structure Price
0,5% 0,0%
0,8%
2,4%
7,1%
7,1%
Total Growth
13%
New products*
Volume Structure Price
0,0%
Structural shift and price increase of Non-EDL drive retail market
Out of pocket market growth components in EDL segment in 2014
Out of pocket market growth components in Non-EDL segment in 2014
585
523
30
Base
12-18%
Upside
2015E
615
2014
Out of pocket market growth, Bn RUB
OO
P s
ecto
r tr
ends
Mark
et
gro
wth
14 Russian pharmaceutical market at a crossroad

Importance of pharmacy chains is growing due to business consolidation and capture of significant market share
Context
• Pharmacy chains in Russia accumulated around 61% of total retail sales(in value term) in 1Q 2015 and this trend is expected to continue due to announced plans of key players for further organic and in-organic growth
• Pharmacy business consolidation through M&A process is expected to continue (Top10 chains accumulate 20% of total retail market)
• Marketing unions and other type of virtual chains already become a strong tool for negotiation with suppliers
• In the crisis period chains aim to optimize their operational business through:
o Enlarged number of promotional contracts with manufactures
o Revision of product assortment with focus on more profitable / high margin products
o Reduction in product purchases in 2015 to improve the turnover of products
o Revision of payment & delivery terms with distributors & manufactures
o Closure of unprofitable pharmacies
Pharm
acy c
hain
s &
dis
trib
uto
rs
Source: IMS Health; SCI; 20 interviews with chains
OO
P s
ecto
r tr
ends
15 Russian pharmaceutical market at a crossroad

AVE Group became № 1 in retail Market , while Dr.Stoletov is the most profitable by sale p.outlet due to discounter Ozerki
Chain
mark
et
overv
iew
Vita 0,9
Pharmakor
2,3
Rigla 3,1
A.V.E Group(+36,6;Stariy Lekar) 3,3
1,2 Farmland
1,1
A5 Group
2,0
2,1 Implozia**
PharmaImpeks
Raduga (+Pervaya Pomosh)
1,5
2,1 Doctor Stoletov(+Ozerki)
457
266
490
524
875
1.600
316
1.039
1.233
783
Top10 chains 1Q 2015 market share,%
Number of outlets
4,2
9,9
6,1
6,8
5,3
3,5
15,6
7,2
6,6
10,0
Ø 7,5
Gross sales per outlet, mln RUB
20% 7.583
Russian pharmaceutical market at a crossroad
Source: IMS Health
133%
28%
21%
12%
15%
14%
41%
10%
10%
5%
Pharm
acy c
hain
s &
dis
trib
uto
rs
OO
P s
ecto
r tr
ends
16 Russian pharmaceutical market at a crossroad

Distributor segment is quickly consolidating through M&A
Context
• Distributors in Russia accumulated around 82% of total direct drug sales(in value term) in 1 Q 2015
• As in Retail sector, consolidation process through M&A is also continuing in Distributor segment (Ave Group bought Oriola;R-Pharm and SIA Int.)
• The leading distributor Katren is continuing rapidly growth (+42%), leaving behind previous leader, Protek
• In the crisis period distributors aim to optimize their business through:
Increase the level of concentration through further M&A deals
Further process automation of warehouses
Expanding the geographical presence in regions
Revision of product assortment with focus on more profitable / high margin products
Increase the direct sales
Source: IMS Health; SCI; 20 interviews with chains
Pharm
acy c
hain
s &
dis
trib
uto
rs
OO
P s
ecto
r tr
ends
17 Russian pharmaceutical market at a crossroad

The sector is highly concentrated-TOP 10 distributors generate 82% of total direct drug sales with >50% by 4 main players
18
Chain
mark
et
overv
iew
TOP10 distributors by direct drug sales (in value) ,1Q 2015 %
• The growth of pharmaceutical market is 9% year-on-year (1Q2015 vs 1Q2014)
• The distributors is concentrated- the vast majority of sales is accumulated by TOP 10 players with a wide geographical coverage and
• Katren is a leading distributor with significant MS and growth by +42% comparing to previous year
3,6 4,9
Alliance Healthcare
7,5
-6%
-3%
+52%
+6%
+34%
0%
-2%
+79%
-6%
+42% Katren
1,6 1,6
Protek
2,1 3,2
Rosta
3,1 3,3
Pulse
SIA Int
8,6 8,5
R-Pharm
5,5 9,8
Pharmkomplekt
7,5
10,8
BSS
14,3 13,5
Medexport
13,3 18,9
11,5
2014
2013
Source: IMS Health SCI 2015
Sum=82%
Pharm
acy c
hain
s &
dis
trib
uto
rs
OO
P s
ecto
r tr
ends