crina o. tarasi, ruth n. bolton, michael d. hutt, & beth a. · pdf file ·...
TRANSCRIPT

Crina O. Tarasi, Ruth N. Bolton, Michael D. Hutt, & Beth A. Walker
Balancing Risk and Return in aCustomer Portfolio
Marketing managers can increase shareholder value by structuring a customer portfolio to reduce the vulnerabilityand volatility of cash flows. This article demonstrates how financial portfolio theory provides an organizingframework for (1) diagnosing the variability in a customer portfolio, (2) assessing the complementarity/similarity ofmarket segments, (3) exploring market segment weights in an optimized portfolio, and (4) isolating the reward onvariability that individual customers or segments provide. Using a seven-year series of customer data from a largebusiness-to-business firm, the authors demonstrate how market segments can be characterized in terms of riskand return. Next, they identify the firm’s efficient portfolio and test it against (1) its current portfolio and (2) ahypothetical profit maximization portfolio. Then, using forward- and back-testing, the authors show that the efficientportfolio has consistently lower variability than the existing customer mix and the profit maximization portfolio. Theauthors provide guidelines for incorporating a risk overlay into established customer management frameworks. Theapproach is especially well suited for business-to-business firms that serve market segments drawn from diversesectors of the economy.
Keywords: customer portfolio management, market-based assets, financial portfolio theory, return on marketing,market segmentation
Crina O. Tarasi is Assistant Professor of Marketing, Central Michigan Uni-versity (e-mail: [email protected]). Ruth N. Bolton is 2009–2011Executive Director, Marketing Science Institute (e-mail: [email protected]).Michael D. Hutt is Ford Motor Company Distinguished Professor of Market-ing (e-mail: [email protected]), and Beth A. Walker is State Farm Pro-fessor of Marketing (e-mail: [email protected]), W.P. Carey School ofBusiness, Arizona State University. The authors acknowledge the supportof the Marketing Science Institute and are grateful to the managers at thesponsor firm for their responsive support and high level of cooperation.The authors thank Don Lehmann, Kay Lemon, and Michael Mokwa fortheir valuable comments. In addition, the authors thank the three anony-mous JM reviewers for their incisive comments and useful suggestions.
© 2011, American Marketing Association
ISSN: 0022-2429 (print), 1547-7185 (electronic)
Journal of Marketing
Vol. 75 (May 2011), 1–171
The advantage of knowing about risks is that we canchange our behavior to avoid them…. Optimal behaviortakes risks that are worthwhile. (Engle 2004, p. 405)
Although risk management is central to financial port-folio theory and occupies much of chief financialofficers’ time, researchers have given sparse atten-
tion to risk in the theory and practice of market segmenta-tion and customer portfolio management. The existing port-folio of most firms reflects incremental and uncoordinateddecisions from the past, when they gave little attention tohow newly acquired customers contributed to the profitabil-ity and risk of the entire portfolio. For example, Homburg,Steiner, and Totzek (2009) find that firms tend to overesti-mate the value of top-tier customers and underestimate thatof bottom-tier customers. In a similar vein, Dhar and Glazer(2003, p. 88) observe that few companies consider “whetherall of their individually desirable customers are, from thestandpoint of risk, desirable collectively.” This practice is atodds with financial portfolio theory, which posits thatalthough assets are selected individually, performance is
measured on the entire portfolio, in which there is a trade-off between risk and return (Markowitz 1952). We theorizethat, like a financial portfolio, a customer portfolio is formedby making choices among market-based assets (i.e., cus-tomers) that present different risk–reward characteristicsand allocating resources to optimize performance (Guptaand Lehmann 2005; Srivastava, Shervani, and Fahey 1998).
The purpose of our research is to explore how financialprinciples of diversification and the tenets of financial port-folio theory can be effectively applied to manage a firm’scustomer portfolio. We demonstrate how fundamental toolsof analysis that professional investors use in constructingand managing a stock portfolio can be adapted and used toenrich a firm’s market segmentation and customer portfoliodecisions. First, we aim to identify risk that can (and should)be divested away because firms do not reap greater returnsfrom assuming it and (instead) suffer losses when marketconditions change. Second, we attempt to identify ways toconstruct efficient customer portfolios. Third, we build onthese components to develop an actionable approach that,by looking beyond the returns from individual customers,exploits the synergies of a diverse customer base character-ized by heterogeneous risk–return profiles and provides anew approach for managing a firm’s market-based assets.
Cardozo and Smith’s (1983) initial application of finan-cial portfolio theory to product portfolio decisions spawnedcriticism from Devinney, Stewart, and Shocker (1985), whoidentify key differences between financial and productinvestment decisions, arguing that crucial assumptions ofthe theory were violated (see Cardozo and Smith’s [1985]reply). However, recent research has demonstrated thepotential insights that financial portfolio theory can con-tribute to customer portfolio management. Dhar and Glazer

(2003) describe the importance of measuring the riskinessof customers (i.e., customer beta) and illustrate how a firmcan maximize returns by acquiring or retaining particularcustomers or market segments on the basis of how theirspending patterns contribute to the diversification of thecash flow of the overall customer portfolio.
Ryals (2002, 2003) also adopts a financial theory per-spective to examine the risk and return characteristics of acustomer portfolio and describe how a customer relationshipscorecard can be used to assess customer risk. Likewise,Buhl and Heinrich (2008) offer a quantitative model basedon financial portfolio theory that (1) considers the customerlifetime value (CLV) in addition to the associated risks ofcustomer segments and (2) provides a method for adding andsubtracting market segments. Using a case study from thefinancial services industry, they test the model by using theaverage annual incomes of key customer segments (e.g.,lawyers, physicians) as an indicator of cash flows and demon-strate how the optimal portfolio provides both higher utilityand better risk diversification than the existing portfolio.
This study makes the following contributions to customerportfolio theory and practice: First, we build on past researchto show theoretically and empirically how to make a nuancedassessment of customer value by calculating the customerbeta (Buhl and Heinrich 2008; Dhar and Glazer 2003) andcontribute a new metric for customer portfolio management:the customer reward ratio. Customer beta provides a relativemeasure of the sensitivity of an individual customer’s cashflow return to that of the firm’s current customer portfolio.By adjusting for variability, the customer reward ratio,drawn from Sharpe’s (1994) work, takes into account therisk–reward trade-off associated with the customer.
Second, the study evaluates the extent to which classicmarket segmentation variables (e.g., demographics, firmo-graphics) can be used to predict cash flow characteristics(i.e., risk–return profiles) of customers so that managers canassess how potential (and existing) customers might con-tribute to the customer portfolio. Note that unlike some priorresearch that controls for customer heterogeneity (Niraj,Gupta, and Narasimhan 2001; Venkatesan and Kumar2004), our approach evaluates and exploits customerheterogeneity to improve business performance.
Third, the current study is responsive to calls forresearch that examines the financial impact of customerportfolio management decisions (e.g., Rust et al. 2004). Weshow conceptually and empirically how a firm can identifysynergies among customers and assemble the optimal mixof customers by constructing an efficient frontier for cus-tomer portfolios. The efficient frontier describes alternativeoptimal customer portfolios—those characterized by mini-mum risk for a certain level of return or maximum returnfor a certain level of risk. Finally, Tuli, Bharadwaj, andKohli (2010) provide evidence that the number and types ofties a company builds with its best customers not onlyensures higher revenue but also reduces the variability oftheir purchases. We extend their work by demonstrating thatthe firm can manage its portfolio of customer relationshipsto control the overall variability of its cash flow.
We test the feasibility of applying key financial con-cepts to customer portfolios by implementing them using a
2 / Journal of Marketing, May 2011
seven-year series of customer data from a large business-to-business company. We begin by exploring whether we cansegment the firm’s customer base in ways that are compara-ble with financial asset classification. Then, we identify thefirm’s efficient customer portfolio and test it against (1) itscurrent portfolio and (2) a hypothetical profit-optimizationportfolio. Our results show that customers exhibit substan-tial differences in their risk–return profiles and that cluster-ing techniques can be used to identify market segments forbuilding efficient portfolios. Most important, we demon-strate that the firm’s efficient portfolio has constantly lowervariability than the existing customer mix and the profitmaximization portfolio and that its profit performance issuperior in the long run.
Conceptual FrameworkThis section reviews financial portfolio theory and concep-tualizes how key financial constructs can be applied to cus-tomer portfolios. Then, we describe how these financialconstructs can be calculated from customer purchase his-tory data. Next, we turn to how firms can identify the mostdesirable customers by assessing the rate of reward on riskfor each customer. Last, we address how firms can use theseconstructs and measures to segment their customer bases inways that are comparable with financial asset classification.
Financial Portfolio Theory
Financial portfolio theory describes how investors can con-struct portfolios to maximize return according to a givenlevel of market risk, emphasizing that risk is an inherentpart of greater reward (Markowitz 1952). In a stock portfo-lio, the lower the total correlation of a stock with the totalreturn, the more desirable the particular stock is to the port-folio. For example, stocks drawn from different industries,different countries, and different-sized companies are affectedby environmental and economic changes in specific ways(Niemira and Klein 1994). Because many market changescannot be anticipated, diversification ensures that the port-folio includes positive cash flow opportunities and smoothesout potentially negative cash flows. In terms of the variabil-ity and return of each asset, the optimal (efficient) portfoliois considered the one that has the least risk for a desiredlevel of return or the highest level of return for a certainlevel of risk. Any other portfolio would be suboptimal. Theset of efficient portfolios form the efficient frontier, whichborders the set of all possible portfolios (Markowitz 1987).
Among the criticisms of financial portfolio theory is theassumption that asset returns are normally distributed,although large swings in the market occur far more fre-quently than the normal distribution would predict. Forexample, the S&P 500 stock index has experienced a three-standard-deviation negative monthly return event ten timessince 1926, though a normal distribution would predict suchextreme returns perhaps one or two times (Kaplan 2009).Another criticism centers on the assumption that correla-tions between assets are stable. However, during periods ofmarket stress, assets that were previously found to beuncorrelated can suddenly move in lockstep (e.g., Hubbard2009).

Criticism has also been leveled against the efficientportfolio concept. For example, DeMiguel, Garlappi, andUppal (2007) evaluate 14 optimal portfolio models advancedin the finance literature, which are based largely on the cap-ital asset pricing model (Sharpe, Alexander, and Bailey1999), and find that none is better than a naïve approach, inwhich an investor allocates a fraction of wealth to each ofthe assets available for investment. However, by drawing onfinancial portfolio theory and defining the market portfolioas the existing customer base of a firm, our focus differsfrom the capital asset pricing model (for a critique in thecontext of customer portfolios, see Buhl and Heinrich2008).
Despite these criticisms, financial portfolio theory“plays a role in almost every area of financial practice andcan be a useful tool for many important managerial deci-sions” (Grinblatt and Titman 2002, p. 97). In turn, thetheory has been used to inform economic developmentstrategies at multiple levels of analysis. By applying finan-cial portfolio theory to regional economics, Conroy (1974)introduces a method for measuring economic diversificationthat has spawned a rich research tradition in the regionalscience literature (for a review, see Dissart 2003). In thiscontext, a region represents a portfolio of assets (industrysectors) that make up the local economy, and each industryyields a return (employment) but also entails a risk(employment volatility).
Researchers have used this portfolio managementframework to study the growth–instability trade-offs ofmetropolitan areas (e.g., Conroy 1974), individual states’and countries’ economies (e.g., Lande 1994), and interna-tional regions, including Western Europe (Chandra 2003).For example, Lande (1994) examines the economic struc-ture of selected states, identifying industry sectors that con-tribute to employment growth and stability in an optimalportfolio. Collectively, studies from this research traditionlend strong support to our view that financial portfoliotheory can provide a valuable framework for evaluating andmanaging a customer portfolio, particularly for business-to-business firms that serve customers drawn from diverseindustry sectors.
Cash Flow Stability and Firm Value
Extending the work of Srivastava, Shervani, and Fahey(1998), we theorize that the market-based assets of a firminclude distinct customer asset classes, which are character-ized by differing degrees of cash flow variability and vul-nerability. Customer asset classes represent the market seg-ments that constitute the existing customer base andembody the outcomes of relationships between the firm andits customers. Investment portfolio decisions involvechoices within and among various asset classes of stocksand bonds; in contrast, customer portfolio decisions involvechoices within and among distinct customer asset classes(e.g., governance type, size, industry) that encompass bothnew and existing customers in the served market and pre-sent different risk–return profiles for the firm. In support,Gupta and Lehman (2005, p. 8) assert that customers areindeed assets, and therefore customer-related expenditures“should be treated as investments rather than expenses.”
Risk and Return in a Customer Portfolio / 3
They demonstrate that the value of the customer base pro-vides a strong guideline for firm value.
In choosing among customers to add to a portfolio, theless a customer’s purchasing behavior promises to be likethat of the current portfolio, the stronger is its contribution tothe stability and predictability of the portfolio; conversely,the more the behavior is like that of the existing portfolio,the weaker is its contribution. Therefore, the attractivenessof a customer hinges not only on the size and frequency ofpurchases but also on the degree to which the customer’spattern of purchases covaries with those of other customersin the portfolio. The declining cash flow from one customermay be offset by increased returns from another. For exam-ple, during a recession, a transportation company mightexperience a decline in revenue from discretionary retailersthat is offset by an increase from discount retailers ordeclining revenue from auto producers that is partially off-set by a growing revenue stream from after-market autoparts retailers.
By developing a risk-adjusted customer portfolio toachieve profit targets, marketing managers can contribute tofirm value. Because investors favor stable over volatileearnings (Ang, Chen, and Xing 2006; Srinivasan andHanssens 2009) and cash flows that are more stable andpredictable reduce working capital needs (Rao and Bharad-waj 2008; Srivastava, Shervani, and Fahey 1998), firms canenhance shareholder value by reducing the vulnerabilityand volatility of cash flows from the customer portfolio.
Customer Portfolios Versus Financial Portfolios
As the preceding section indicates, customers, like stocks,represent risky assets, and the cost of acquiring them shouldreflect the cash flow they are expected to generate overtime. However, we acknowledge that key differences existbetween financial and customer portfolios with respect tothe nature of the assets, returns, and uncertainty.1
Assets. Because customer portfolio decisions representonly one of many levels of marketing investment a firmmakes, they are embedded in a far more complex invest-ment management framework than financial portfolio deci-sions. Marketing investments are made to enhance the valueof brand assets through, for example, product research anddevelopment, channel support, and advertising. To enhancethe value of customer assets, the firm gives special empha-sis to investments in customer relationship building byusing elements of the marketing promotion mix (e.g., com-munications, sales force, customer–firm interactions;Ambler et al. 2002).
Financial assets can be identified and readily purchased;in contrast, particular customers can be targeted, but there isno assurance that the firm will be successful in attractingthem to the portfolio. Likewise, individual customer rela-tionships take time to develop and usually require continu-ing investments (Johnson and Selnes 2004; Kumar 2008).Therefore, an existing customer asset’s price is the retentioncosts represented by these continuing expenditures, and the
1We thank an anonymous reviewer for suggesting this organiza-tional scheme and focus.

a new customer asset’s price is the associated acquisitioncosts. Compared with a customer portfolio, investors canalso readily make portfolio adjustments by selling assets ata market price and changing the proportion (weight)assigned to particular asset classes. In contrast, there is noliquid market for customer assets (Kundisch, Sackmann,and Ruch 2008), and customer divestment can be costly andrepresents a strategic option that must be exercised spar-ingly (Mittal, Sarkees, and Murshed 2008).
Financial assets can be purchased in parcels of any size;in contrast, customer assets are not infinitely divisible, andmajor portfolio adjustments can be costly and difficult toimplement in a timely manner. An investor who wants toincrease the portfolio weighting of a particular industry sec-tor can readily implement this change by selling stocksfrom one sector (e.g., energy) and buying stocks in another(e.g., technology). To make corresponding changes in theweighting of market segments within the customer portfo-lio, a manager faces a longer time horizon, new strategy pri-orities, and a host of rigidities that the current strategyimposes. To illustrate, reorganizing the customer portfoliomight require a realignment of sales and marketing commu-nication strategies, highlighting the higher transaction costsassociated with customer versus financial portfolios.
Return. For an investor, return is the change in value ofthe investment, which includes capital appreciation (or loss)plus the cash yield. Unlike financial assets, customers canbe interconnected and contribute to the return of a marketsegment through social processes, such as positive word ofmouth (Ryals 2003). Return for the customer portfolio isthe cash flow and profit (revenue minus cost to serve) thataccrue to the firm from investments made in individual cus-tomers and market segments. The firm makes a host ofother marketing investments that enrich the customer rela-tionship strategy but are not directly captured in the cost-to-serve calculation. To illustrate, the decision to increase theweighting of particular market segments in a customer port-folio might require corresponding investments in new prod-uct development or service support that go beyond thedirect customer costs that we consider.
In a financial portfolio, the rate of return is independentof the amount invested. In contrast, a distinct differencebetween customer and financial portfolios is that the returnsfrom investing in customers are likely to be nonlinear.Specifically, the amount of investment has a nonlinear rela-tionship with the “return on customer,” which means, forexample, that small investments might be insufficient toattract or retain an individual customer or market segment.
Managerial control is among the unique characteristicsthat distinguish customer investments from financial invest-ments (Devinney and Stewart 1988). For example, a firmcan increase sales and reduce sales variability by forgingmultiple types of relationship ties with a customer organiza-tion (Tuli, Bharadwaj, and Kohli 2010) or enhance returnsby identifying elements of its customer management effortthat provide the greatest marginal return on additionalinvestments (Bowman and Narayandas 2004). When aninvestor chooses an optimal weight for a particular assetclass and purchases the associated securities, there is no
4 / Journal of Marketing, May 2011
impact on the risk and return for that asset class. In contrast,managers can exercise a significant degree of control overthe risk and return characteristics of the customer portfolio.For example, the weight assigned to a market segment canaffect the performance of that segment because of increas-ing or decreasing returns to scale. Some market segmentscomplement the economies of the seller’s business betterthan others, and some customers within these segments areless costly to serve than others.
Uncertainty. The difference between the expected andactual realized returns of an asset constitutes uncertainty infinancial portfolio theory. Investment uncertainty is charac-terized by the variability, or risk, in the return of a security—namely, the deviation of the return from expected value dur-ing the holding period. Then firms use the variations in thereturns of securities to estimate the covariance among thearray of assets that constitute a portfolio. In the customerportfolio context, the deviation of customer cash flow andprofit from their expected values provides a measure of risk.However, there are other sources of uncertainty that areunique to a customer portfolio. Unlike financial assets,which can be retained as long as the investor desires, cus-tomers can take independent actions and defect or shift ashare of their total purchases to a competitor. Therefore,customer cash flow stability provides a narrow measure ofthe strength of a customer relationship.
Customer portfolio applications. To capitalize on thestrength of financial portfolio analysis while managing theassociated constraints and limitations, a firm can examine therisk–return characteristics and structure of its current cus-tomer portfolio. Specifically, we demonstrate how portfoliotheory provides an organizing framework and supportingmethodology for (1) diagnosing the variability in the overallcustomer portfolio, (2) assessing the complementarity/similarity of market segments, (3) exploring the weights ofmarket segments in an optimized portfolio, and (4) gaugingthe reward on variability that individual customers or seg-ments provide.
In applying financial theory to customer portfolio man-agement, some key limitations must be understood and man-aged. First, during periods of severe economic stress, marketsegments that were previously uncorrelated can suddenlymove in tandem, limiting the benefits of diversification. Sec-ond, our approach determines how the current customer basemight be reconfigured into an optimal portfolio, but someof these adjustments are costly and raise a host of strategicissues beyond the scope of our analysis. The optimal portfo-lio can best be viewed as an ideal customer base that man-agers can evaluate, revise, and assemble over time. There-fore, the optimization process should include a qualitativeoverlay based on managerial judgment to arrive at recom-mended resource allocations by segment. In Markowitz’s(1952, p. 91) seminal work, he emphasizes that the statisti-cal results that issue from his approach should be viewed astentative and then enriched by judgment “on the basis offactors or nuances not taken into account by the formalcomputations.”
Third, our analysis examines the cash flow and profit ofindividual customers but does not assess other important

customer metrics, including customer satisfaction, loyalty,or share of wallet. Likewise, we do not consider the host offactors that influence individual customer profitability, suchas demand stimulating the firm’s efforts or competitivebehavior (Bowman and Narayandas 2004). To that end, ourconceptualization of customer portfolio risk complements,rather than replaces, other approaches from the customermanagement research tradition that examine other types ofrisk, such as the risk of defection and the probability ofachieving CLV outcomes (e.g., Blattberg, Getz, andThomas 2001; Bolton, Lemon, and Verhoef 2008; Rust,Lemon, and Zeithaml 2004).
Appropriate market contexts. Our approach specificallyapplies to situations in which there are meaningful differ-ences in variability across the market segments that consti-tute a firm’s customer portfolio. Therefore, we believe theapproach is best suited for the business market, in whichthese conditions are often present. Compared with con-sumer packaged goods contexts, business marketers tend toallocate greater proportions of their sales and marketingresources at the individual customer level. Likewise, manybusiness-to-business firms serve market segments drawnfrom diverse sectors of the economy, each of which demon-strate a distinct demand function (Dickson and Ginter1987). The approach might also be appropriate for business-to-consumer firms that have direct contact with the cus-tomer, such as telecommunications and financial servicescompanies. However, the approach will be less suitable inthese or other situations if market segments tend to behighly correlated.
Customer Portfolio: Risk and Reward
Markowitz (1987) measures risk using the variability of theprice of the asset, which represents a good proxy for theprobability of encountering an unexpected outcome. Therisk and return associated with the cash flow of each cus-tomer can be computed using purchase history data. His-toric analyses are based on the assumption that the futurewill be like the past (Sharpe, Alexander, and Bailey 1999),and variance is difficult to forecast. However, we assumethat the relationships and correlations of the past are suffi-ciently stable and that past variability is a good proxy forfuture variability (Balagopal and Gilliland 2005; Chan,Karceski, and Lakonishok 1999).
Cash flow variability and overall customer portfolio risk.We define “risk” as volatility or variability associated withcash flow, and it is traditionally estimated using standarddeviation or variance. The formula for computing the vari-ance of customer A, VA, is VA = [S
NAi=1(xAi – xA)2]/(NA – 1),
and standard deviation is sA = VA1/2, where xAi is the cash
flow for customer A in the ith period in which a cash flowoccurred, xA is the average value of cash flow from cus-tomer A for the NA periods, and NA is the number of peri-ods in which a cash flow from customer A occurred.
To obtain a standardized measure of variance that cor-rects for differences in the average levels of cash flowsacross customers, we compute the coefficient of variation asfollows:
Risk and Return in a Customer Portfolio / 5
Cv = sA/xA.
We compute the risk of the entire portfolio Vp using a simi-lar formula, except that the cash flow used is the average ofall customer cash flows (Markowitz 1987):
where xj is the cash flow from all customers active in periodj, xj = S1
Mjxjk (where Mj is the number of customers activein period j and xjk is the cash flow from firm k in period j);N is the number of periods considered; and xp is the averagevalue of cash flow from the customer portfolio for the N peri-ods and M firms, xP = (S
Nj =1xj)/(N – 1). To compare the per-
formance of portfolios with different levels of performance(e.g., different means), we standardize the values by divid-ing the monthly values by the mean of the portfolio beforecomputing variability.
Customer Beta and Customer Reward Ratio
Customer beta. To identify the most desirable cus-tomers, we need a reliable measure of the consistency ofreturns for an individual customer compared with a refer-ence customer or portfolio. In finance applications, beta—ameasure of the volatility of an investment—is computedrelative to an appropriate asset class, usually the marketportfolio. The market portfolio consists of all assets, withthe weight of each held in proportion to the total marketvalue. Because the determination of a comparable portfoliothat includes all customer assets across all firms representsa daunting, if not impossible, task, we define the marketportfolio as the firm’s current customer base, in line withBuhl and Heinrich (2008), Dhar and Glazer (2003), andRyals (2002).
In the financial context, the market is assumed to beefficient, implying that information is fully and immedi-ately reflected in market prices (Fama 1970; Sharpe,Alexander, and Bailey 1999). In contrast, the customer port-folio is not efficient. For a company, variations in the cus-tomer portfolio might reflect the overall performance ofcertain industries or sectors of the economy. Therefore,rather than using beta to describe the risk of the overallportfolio, customer beta captures the degree to which anindividual customer contributes to the risk of the entireportfolio:
where cov(xi, xP) is the covariance between the individualcustomer cash flow and the cash flow of the overall cus-tomer portfolio and Vp is the variance of the cash flow forthe overall customer portfolio.
Customer reward ratio. In measuring the rate of returnon risk of a customer—in other words, the reward forassuming variability—Sharpe’s pioneering work (1994; seealso 1966) provides the foundation for the customer reward
( )
( )
,11
2
1V
x x
NP
j Pj
N
=
−
−=∑
( )cov( , )
,2 βii P
P
x x
V=
ratio. The reward is measured as the return above the risk-free rate:
where RRi represents the customer reward ratio, Ri repre-sents the return for customer i and Rf represents the returnfor the risk-free customer proxy, and si represents the stan-dard deviation of the return. When there is no risk-free assetavailable, Rf = 0, and the equation is simplified to
Finding a risk-free proxy for the customer portfolio (theequivalent of treasury bills, the benchmark for risk-freeinvestments) is often possible. For example, some compa-nies have a set of low-return customers that they might pre-fer not to serve, but they choose to do so to fill spare capac-ity and achieve a modest return. Although not directlytargeted, these customers provide a benchmark return.
If one of the goals in designing a customer portfolio isto minimize the risk for a certain level of return, a key ques-tion becomes, What is the level of return that a customer orsegment with a certain level of variability provides? Thecustomer reward ratio provides the means for evaluating therisk–reward trade-offs of customers in the portfolio. Weprovide a measure for evaluating the relative attractivenessof customers with different levels of return and variability.When customers possess similar return or variability char-acteristics, distinguishing the most desirable customer isstraightforward. (For the same level of risk, the customerwith the highest return is preferred, and for the same levelof return, the customer with the lowest variability is pre-ferred, all else being equal.) However, when both risk andreturn are different, the customer reward ratio provides themeans to identify the most attractive customer.
Segmenting or Classifying Customers Accordingto Risk
In financial markets, assets are grouped into categories thatshare certain risk–return and variability characteristics (e.g.,blue chip stocks, bonds, treasury bills). We can group cus-tomers into segments using cluster analysis according to themonthly variability in their cash flows and then observewhether the resultant segments share other characteristicsthat are meaningful and actionable in the marketplace, suchas demographics and firmographics. In other words, twokey questions in determining the feasibility for building anefficient customer portfolio include the following: (1) Arethere significant differences in variability and rate of returnacross market segments? and (2) Can we identify the differ-ences in variability associated with specific customer char-acteristics (e.g., size of the company, industry)? If theanswer to both questions is yes, we can build efficient port-folios according to the risk–return profiles of clusters ratherthan individual customers (for which cash flows can besomewhat unpredictable). Therefore, we first test whetherthere are significant differences in cash flow variability
( ) ,3 RRR R
ii f
i
=−σ
( ) .4 RRR
ii
i
=σ
6 / Journal of Marketing, May 2011
among different segments that can be characterized in waysthat are normally used for segmentation. Then we attemptto construct an efficient customer portfolio and evaluate itsperformance.
Research Design
Study Context
We test the applicability of our approach to customer port-folios using purchase history data from a business-to-businesscompany with a diverse customer base.2 The client com-pany provided monthly sales and profit data (earningsbefore interest and taxes; hereinafter, EBIT) for all cus-tomers for a seven-year period. The company’s records alsocontained information for each customer regarding numberof product lines purchased, size of business, geographiclocations, and industry sector. The company had servedmore than 10,000 customers in the seven years. However,we focused on the top 250 customers from each of the years2001–2007, which amounts to 516 unique customers and98% of all sales. We supplemented the cooperating com-pany’s purchase records with information from public data-bases. Specifically, 456 of the 516 business customers wereuniquely identified using Dun & Bradstreet codes, so thatwe could record the number of employees and sales reve-nues for specific sites and the entire company/customer.
Analysis Plan
In Stage 1, before developing the efficient portfolio, wewant to assess whether meaningful differences in variabilityexist among customer segments. Stage 2 centers on seg-menting (i.e., clustering) customers according to purchasingpatterns (using standardized monthly purchases over sixyears) rather than using an a priori segmentation scheme.Next, we identify the segments by examining their financialand nonfinancial characteristics. For the segmentation to beactionable for managers, customers in the same segmentsmust share common characteristics, which can be used toidentify similar (potential) customers.
Stage 3 centers on identifying the efficient frontier andbuilding an efficient customer portfolio using the variability-based segmentation scheme identified in Stage 2 to developa diversified portfolio of customers, which should outper-form value maximization portfolios in the long run. Stage 4involves an evaluation of the diversified portfolio’s perfor-mance. The firm’s business performance should be enhancedin two ways: higher returns or reduced risk (or both). Thus,we evaluate the success of our approach by comparing thescenario reflecting the outcomes of the efficient frontierwith the “actual” risk–return profile for the following yearand a profit maximization scenario—all calculated usingthe holdout sample data.
Stage 5 makes necessary adjustments in the composi-tion of the customer portfolio by reexamining the perfor-mance (purchases) of current customers, individually andby segment. Using customer reward ratios and customerbeta indicators, we can asses the riskiness of individual cus-
2To respect confidentiality agreements, we scaled the numbers.
tomers and gauge their impact on the overall portfolio.Using this information—and maintaining a perspective ofcompany goals and the external environment—marketingmanagers can decide on a case-by-case basis whether it isdesirable to attract more business from the specific cus-tomer or to identify segments with similar characteristics topursue in the future.
Stage 1: Assessing Differences in VariabilityAmong Customer Segments
Our assessment is based on an examination of the sales overtime from different market segments defined on an a prioribasis. Specifically, we use the first six years of purchasehistory data to investigate whether there are significant dif-ferences in coefficients of variation across market segmentsdefined by relationship type (contractual vs. noncontrac-tual), size of business, and industry type. Appendix A pro-vides a full discussion of this analysis.
Compared with noncontractual relationships, the analy-sis indicates that contractual customer relationships havelower variability and their introduction into a customer port-folio reduces the overall variability. Likewise, customersfrom small and medium-sized businesses (SMBs) havelower variability than large business customers. For theindustry analysis, we classified customers using the NAICS(North American Industrial Classification System) combinedwith Standard & Poor’s (S&P) sector classification.3Appendix B provides customer reward ratios, betas, andcoefficients of variation of customer purchases over time indifferent industry sectors. The industry analysis was incon-clusive because many of the industries were represented byonly a few large customers; however, the trends were visi-bly distinctive.
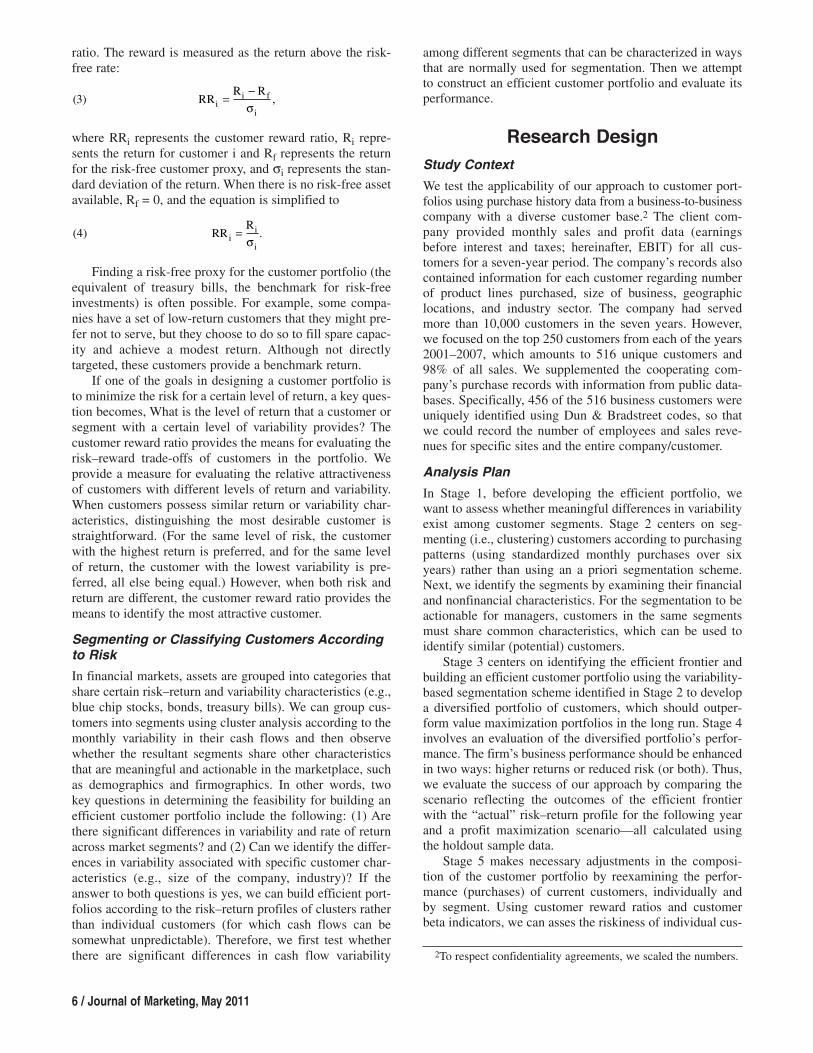
Figure 1 provides a graph of sales revenue over time forthe ten industry categories of customers that generated thehighest average sales. For example, observe that the retailsector exhibits a pronounced growth pattern over six years,while all others exhibit more modest growth, with the autosector and transportation manager customers registering anoticeable decline after 2004.
On the basis of this analysis, we conclude that there arestatistically significant differences in sales variability for cus-tomers with contractual versus noncontractual relationshipsand between customers of different sizes. There are alsomeaningful differences in sales trends for customers fromdifferent industries. Therefore, we believe the foundation is inplace to identify market segments characterized by differentrisk levels (e.g., betas, customer reward ratios) and to buildan efficient customer portfolio for the cooperating company.
Stage 2: Transactional Segmentation
Market segments should be characterized by differentdemand functions and purchase patterns (e.g., Dickson and
Risk and Return in a Customer Portfolio / 7
Ginter 1987). Market segmentation based on similarities ordifferences in purchasing patterns is called transactionalsegmentation, which has been used in financial servicesfirms to determine patterns that signal defections (Pearsonand Gessner 1999).
Each customer has unique and common characteristics,so we utilized a hierarchical clustering analysis of themonthly purchase data for each customer to observe thecommon characteristics. The procedure (PROC CLUSTER,in SAS, using the average linkage method) grouped cus-tomers according to squared distances, in which distancewas measured by the monthly cash flow levels (standard-ized revenue).4 Because there are 72 months of observationin the data, each customer is characterized by 72 variables.A six-cluster solution was robust to method changes, pro-viding support for a solution that is useful for managerialaction. The six-cluster solution grouped together customerswith similar trend characteristics. Comparisons among clus-ters revealed that even though the statistical techniqueswere based on cash flow patterns exclusively, the resultingclusters differed in terms of company size, dominant indus-tries, overall variability, customer reward ratios, and betas.Appendix C presents the results of these comparisons, andFigure 2 illustrates the patterns of the clusters.
3Standard & Poor’s identifies ten industry sectors: energy, mate-rials, industrials, consumer discretionary, consumer staples, healthcare, financials, information technology, telecommunication ser-vices, and utilities (Source: “S&P Industry Classification Standard,”[accessed June 5, 2009], [available at www2.standardandpoors.com/ spf/pdf/index/GICSIndexDocument.PDF]).
4We standardized each customer’s revenue by dividing themonthly value by the mean revenue for the 72 months. Standard-ization enables us to cluster by using variability patterns alone,without interference from the size of the customer purchases.
FIGURE 1Industry Trends
Big retail Paper and packagingAutomotive Consumer goodsFood and beverage Transportation managerHome improvement Electronics and appliancesChemicals Small retail
Year
1,200
1,000
800
600
400
200
02001 2002 2003 2004 2005 2006
Reven
ue (
Millio
n $
)

Stage 3: Identifying the Efficient Frontier and
Building an Efficient Customer Portfolio
Each cluster has a certain level of return, as Figure 2 shows.We computed the return per cluster using profitability databy customer as provided by the sponsoring firm (return =total EBIT per cluster divided by the total revenue per clus-ter). Using the six clusters, we can now build an efficientportfolio by minimizing the cash flow variability for 2006given a certain level of return. Although we use the data for2001–2006 to build the clusters, we use 2006 as the refer-ence year—because it is closest to the holdout period(2007)—to compute the efficient frontier. We need to iden-tify a set of optimal weights for each of the clusters X¢ = [x1x2 x3 x4 x5 x6] that minimizes the portfolio variance andthat, multiplied by the return per cluster, adds up to the tar-geted return. By varying the expected return, we can drawthe entire efficient frontier (Markowitz 1991).
To develop the efficient frontier, we used the quadprogfunction in MATLAB to minimize variance–covariancematrix for various levels of return (in increments of .2%).The quadprog function is designed to solve quadratic pro-gramming problems, in which a covariance matrix is mini-
8 / Journal of Marketing, May 2011
mized by varying the weights of the parameters, while satis-fying certain linear conditions:
min1/2XTHX, such that AX £ B and Aeq X = Beq,
where X is the vector of weights (XT is X transposed) andH is the return covariance matrix or the covariance matrixcomputed using the monthly return for all clusters. Theinequality AX £ B, where A = –[I6] (I being the identitymatrix) and B¢ = [0, 0, 0, 0, 0, 0], ensures that all clusterweights are positive. The equations Aeq X = Beq, whereAeq = [1, 1, 1, 1, 1, 1; r1, r2, r3, r4, r5, r6] (with r1–r6 being theactual returns for clusters 1 to 6) and Beq¢ = [1, R] (with Rbeing the target return), ensure that the sum of weights forall clusters is 1 and the sum of the returns for the efficientportfolio matches the desired return. Quadratic program-ming is classically used for mean-variance portfolio selec-tion (Feldstein 1969). The quadprog function uses themedium scale algorithm for this type of problem andinvolves a two-stage approach: It first estimates a feasiblepoint and then generates a sequence of feasible points untilconvergence occurs.5
FIGURE 2Revenue by Cluster
Month
200
180
160
140
120
100
80
60
40
20
01 3 5 7 9 11 13 15 17 19 21 23 25 27 29 31 33 35 37 39 41 43 45 47 49 51 53 55 57 59 61 63 65 67 69 71
Millio
n $
Cluster 1: Constant growth (return = .066)Cluster 2: Rise and decline (return = .062)Cluster 3: Moderate growth followed by decline (return = .074)Cluster 4: Constant decline (return = .074)Cluster 5: Best customers slowing down (return = .089)Cluster 6: Low-revenue customers (return = .053)
(Return = .062)
C (Return =.
(Return = .074)
C (Return = .089)
C (Return = .053)
(Return = .062)
C (Return =.
(Return = .074)
C (Return = .089)
C (Return = .053)
(Return = .062)
(Return =.
(Return = .074)
C (Return = .089)
C (Return = .053)
(Return = .062)
C (Return =.
(Return = .074)
C (Return = .089)
C (Return = .053)
(Return = .062)
C (Return =.
(Return = .074)
(Return = .089)
C (Return = .053)
(Return = .062)
C (Return =.
(Return = .074)
C (Return = .089)
(Return = .053)
5MathWorks (http://www.mathworks.com/help/toolbox/optim/ug/brnox7l.html).
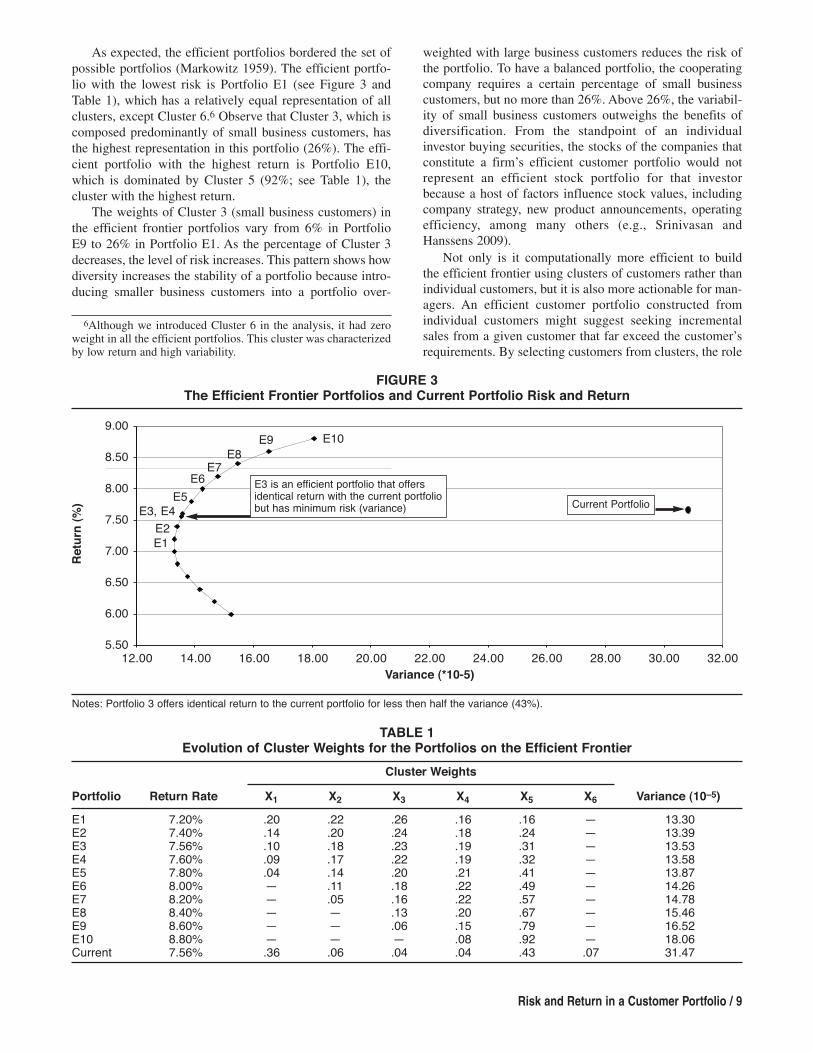
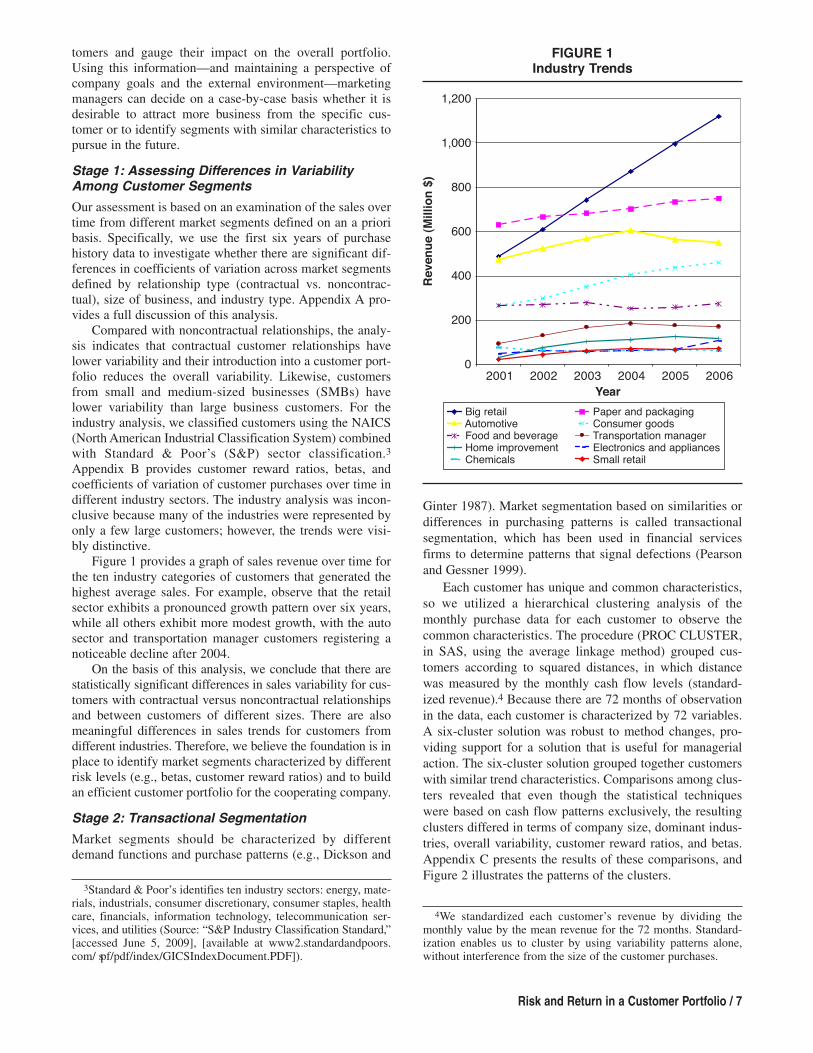
As expected, the efficient portfolios bordered the set ofpossible portfolios (Markowitz 1959). The efficient portfo-lio with the lowest risk is Portfolio E1 (see Figure 3 andTable 1), which has a relatively equal representation of allclusters, except Cluster 6.6 Observe that Cluster 3, which iscomposed predominantly of small business customers, hasthe highest representation in this portfolio (26%). The effi-cient portfolio with the highest return is Portfolio E10,which is dominated by Cluster 5 (92%; see Table 1), thecluster with the highest return.
The weights of Cluster 3 (small business customers) inthe efficient frontier portfolios vary from 6% in PortfolioE9 to 26% in Portfolio E1. As the percentage of Cluster 3decreases, the level of risk increases. This pattern shows howdiversity increases the stability of a portfolio because intro-ducing smaller business customers into a portfolio over-
Risk and Return in a Customer Portfolio / 9
weighted with large business customers reduces the risk ofthe portfolio. To have a balanced portfolio, the cooperatingcompany requires a certain percentage of small businesscustomers, but no more than 26%. Above 26%, the variabil-ity of small business customers outweighs the benefits ofdiversification. From the standpoint of an individualinvestor buying securities, the stocks of the companies thatconstitute a firm’s efficient customer portfolio would notrepresent an efficient stock portfolio for that investorbecause a host of factors influence stock values, includingcompany strategy, new product announcements, operatingefficiency, among many others (e.g., Srinivasan andHanssens 2009).
Not only is it computationally more efficient to buildthe efficient frontier using clusters of customers rather thanindividual customers, but it is also more actionable for man-agers. An efficient customer portfolio constructed fromindividual customers might suggest seeking incrementalsales from a given customer that far exceed the customer’srequirements. By selecting customers from clusters, the role
6Although we introduced Cluster 6 in the analysis, it had zeroweight in all the efficient portfolios. This cluster was characterizedby low return and high variability.
TABlE 1Evolution of Cluster Weights for the Portfolios on the Efficient Frontier
Cluster Weights
Portfolio Return Rate X1 X2 X3 X4 X5 X6 Variance (10–5)
E1 7.20% .20 .22 .26 .16 .16 — 13.30E2 7.40% .14 .20 .24 .18 .24 — 13.39E3 7.56% .10 .18 .23 .19 .31 — 13.53E4 7.60% .09 .17 .22 .19 .32 — 13.58E5 7.80% .04 .14 .20 .21 .41 — 13.87E6 8.00% — .11 .18 .22 .49 — 14.26E7 8.20% — .05 .16 .22 .57 — 14.78E8 8.40% — — .13 .20 .67 — 15.46E9 8.60% — — .06 .15 .79 — 16.52E10 8.80% — — — .08 .92 — 18.06Current 7.56% .36 .06 .04 .04 .43 .07 31.47
FIGURE 3The Efficient Frontier Portfolios and Current Portfolio Risk and Return
Variance (*10-5)
9.00
8.50
8.00
7.50
7.00
6.50
6.00
5.5012.00 14.00 16.00 18.00 20.00 22.00 24.00 26.00 28.00 30.00 32.00
E1
E2
E3, E4
E5
E6E7
E8
E9 E10
Retu
rn (
%)
Notes: Portfolio 3 offers identical return to the current portfolio for less then half the variance (43%).
Current Portfolio
E3 is an efficient portfolio that offersidentical return with the current portfoliobut has minimum risk (variance)

of similar characteristics is emphasized, making the identi-fication of potential new customers easier and implementa-tion more straightforward. This approach offers managersthe choice of either increasing the level of business con-ducted with current customers in the cluster (if the opportu-nity exists) or serving new customers with similar charac-teristics that define the cluster. Moreover, from a practicalstandpoint, managers can even apply this approach at thegroup (cluster) level if they find it difficult to determine thespecific return per customer. The risk could be estimatedaccording to the variability of the customer revenue andused in combination with the return per cluster to estimatethe efficient portfolio.
Stage 4: Testing the Efficient Portfolio
We have constructed an efficient customer portfolio thatminimizes variance for the study period. We compare theperformance of this portfolio with that of a profit maxi-mization portfolio, built using the best customers for 2006and assuming that the company is able to acquire 25% morecustomers with the same level of profit as its best customers(which the client company would do if it could).
First, we compare the performance of an efficient port-folio (E5), the actual portfolio and the profit maximization
10 / Journal of Marketing, May 2011
portfolio and “back-test” them for 2001 through 2005.7 Acustomary practice in finance is to test strategies under his-torical market conditions to evaluate their viability andeffectiveness. This method is especially useful to test a port-folio under different economic conditions, given that testingwith future data is not an option. In Figure 4, Panels A andB, we compare the results for the three portfolios; that is,we compare variability (risk) and actual profits (return).
Using back-testing, we notice that the efficient portfolioconstantly has much lower variability than either of theother two portfolios for all six years examined (Figure 4,Panel A). In terms of profit performance, the efficient port-folio outperforms the actual portfolio each year except 2004and 2005, which were extremely profitable for the company(Figure 4, Panel B). The profit maximization portfolio out-performs the actual and efficient portfolios for just one ofthe years, 2005. In years of high growth, riskier portfoliosare more likely to outperform low-risk portfolios. However,for the other years, further out on the horizon from thebenchmark year for which the portfolio has been optimized,the efficient portfolio outperforms both the actual and profit
7We used the data for 2001–2005 to identify the clusters but notfor the efficient frontier.
FIGURE 4Back- and Forward-Testing the Efficient Portfolio (Simulation Results)
A: Profit Variability by Portfolio
2001 2002 2003 2004 2005 2006 2007
.160
.140
.120
.100
.080
.060
.040
.0200
Current portfolio
Efficient portfolio
Profit maximization portfolio
o
o
o
Current portfolio
Efficient portfolio
Profit maximization portfolio
o
o
o
` `
C: Variability of the Current Customer Portfolio and theEfficient Portfolios Identified Using Annual Data
Between 2001 and 2006
.12
.10
.08
.06
.04
.02
02001 2002 2003 2004 2005 2006 2007
B: Profit by Portfolio (Million $)
370.0
320.0
270.0
220.0
170.0
120.0
70.02001 2002 2003 2004 2005 2006 2007
D: Profitability of the Current Customer Portfolio andthe Efficient Portfolio Identified Using Annual Data
Between 2001 and 2006
300280260240220200180160140120100
2001 2002 2003 2004 2005 2006 2007
Current portfolio 2001 efficient portfolio
2002 efficient portfolio 2003 efficient portfolio
2005 efficient portfolio 2006 efficient portfolio
o
o
o
o
o
o
Current portfolio 2001 efficient portfolio
2002 efficient portfolio 2003 efficient portfolio
2005 efficient portfolio 2006 efficient portfolio
o
o
o
o
o
o

maximization portfolios, providing evidence for the stabil-ity of our method.
Second, we compare the three portfolios using forward-testing; that is, we use the data for 2007 that have not beenused in any other previous analysis. (To do so, we matchedthe customers that entered the top 250 for the first time in2007 to clusters using the size of the business, industry pro-file, and previous purchase history.) When comparing 2007performance, the efficient portfolio outperforms the actualportfolio: higher profit and lower variability. The efficientportfolio has lower overall profitability than the profit max-imization portfolio, but it has a much lower variability. Instable economic conditions, we expect that in the first year(short run), the efficient portfolio might not outperform aprofit maximization portfolio.
To further test the robustness of the efficient portfolioconcept as applied to a customer portfolio, we also builtefficient portfolios using the data for each of the years in the2001–2005 interval and then using data from the remainingyears as the holdout sample. For example, we built the effi-cient frontier for 2001 and used 2002–2007 data as theholdout sample. Except for 2004, when the company imple-mented midyear accounting changes related to the measure-ment of customer profitability, we could fully identify theefficient frontier. According to the simulation results, eachefficient portfolio had similar benefits: The variability wasconstantly much smaller for all the years examined whilecontrolling for the mean (Figure 4, Panel C) and in absolutevalue (Figure 5), though the profitability was comparablewith that of the current portfolio (Figure 4, Panel D). Theseresults show the stability of the solutions computed for dif-
Risk and Return in a Customer Portfolio / 11
ferent years; in simulations, they all manifested a similarlevel of profitability and substantially lower variability.
Stage 5: Revising the Current Customer PortfolioToward an Efficient Portfolio
Thus far, our analysis has centered on groups of customersthat share certain characteristics. However, inside clusters,some customers might be more desirable than others, andgiven limited resources, the firm should prioritize its cus-tomer retention/acquisition efforts. This issue should beconsidered when the firm reweights its customer portfolioto move toward an optimal composition.
Recall that the customer reward ratio can be measured asa function of a risk-free asset (in our case, a risk-free customerproxy) or in absolute terms. By incorporating the risk-freeasset into the calculation, the customer reward ratio providesa more meaningful measure of the relative attractiveness ofalternative customer investments.8 The manager can considerthe return provided by investing in the risk-free asset andtake into account how a diversified allocation of resourcesmight be more attractive than investing in a single asset.
Consider the risk-free asset that a logistics service com-pany might use. Transportation managers act as brokers for
FIGURE 5Absolute Variance Reduction in Efficient Portfolios Versus the Current Portfolio Results
2001 2002 2003 2004 2005 2006
5.00E–04
4.50E–04
4.00E–04
3.50E–04
3.00E–04
2.50E–04
2.00E–04
1.50E–04
1.00E–04
5.00E–05
0.00E+00
Year
Po
rtfo
lio
Vari
an
ce
Actual portfolio variance
Efficient portfolio variance
8For example, for a return of 15 and a standard deviation of 10,the customer reward ratio without the risk-free asset is 1.5 (15/10);with a risk-free asset with a return of 3, it is 1.2 (12/10). For an assetwith return of 28 and standard deviation of 20, the customer rewardratio without the risk-free asset is 1.4 (28/20, less attractive thanthe first asset), but taking into account the risk-free rate, the cus-tomer reward ratio is 1.25 (25/20, compared with 1.2 for the firstexample), which is more attractive than the first asset considered.

SMBs. They are often used by logistics service companiesto find customer shipments to fill at least some capacity forreturn routes from one-way transports. For performing thishelpful service, they are charged less than most other cus-tomers, and their purchases are highly variable. Consideringthem the “risk-free proxy” in computing the reward ratioprovides a useful benchmark for a logistics company. Forfirms that produce maintenance and operating supplies, arisk-free proxy might be a segment of large distributors thatdesire private label products that a firm could produce to fillexcess capacity. Identifying the risk-free customer proxy fora business requires deep insight into the strategic and dailyoperations of the business because, ideally, the risk-freecustomers should be strategically irrelevant and alwaysavailable for the right price. For businesses in which the“strategically irrelevant” customers cannot be identified, thereturn of the risk-free proxy is 0.
For the client company, we identified a segment as arisk-free proxy that initially seemed rather unappealing: alower return (EBIT) than other customers (2.4% comparedwith 6.2%, p < .05), without loyalty, and strategically irrele-vant. Importantly, observe that the customer reward ratiodoes not determine the absolute desirability of a customer.Firms should also consider the impact of the customer onthe overall portfolio (i.e., customer beta) in addition to otherstrategic aspects, like growth potential. However, for cus-tomers with similar impact on the portfolio and no specificstrategic consideration, the customer reward ratio providesa clear criterion for choosing the most desirable customer.Appendix B provides a summary of the customer rewardratios for key industry sectors.
Appendix B shows that most of the industries in the topten (if ranked using the customer reward ratio) belong to thediscretionary category. It is noteworthy that customers inlawn and garden, machinery, and office supply categorieshave the highest levels of reward on risk. When the clientcompany executives saw the analysis, they realized thatmany of the customers that provided the highest reward onrisk were not receiving adequate attention. Representedhere are customers that provide attractive margins but alsoare characterized by high variability. These clients requestservices when they need them, and to receive the speed andquality of the services that they demand, they are willing topay a premium price.
Data Analysis Conclusion
Using the efficient frontier applied to customer segments,we identify an optimal composition of the customer portfo-lio that outperformed, in terms of variability, both the clientcompany’s current strategy and a profit maximization port-folio, as demonstrated by back- and forward-testing (seeFigure 4). By using a diversified, efficient portfolio, compa-nies could reduce the vulnerability and volatility of cashflow from the customer portfolio, better insulating the firmduring downturns in the economy without sacrificing per-formance in the long run. We demonstrate how managerscan use customer beta and the customer reward ratio toevaluate specific individual customers and to make corre-sponding adjustments in the customer portfolio.
12 / Journal of Marketing, May 2011
Discussion and ManagerialImplications
Marketing managers face increased pressure to demonstratethe financial impact of marketing resource allocation deci-sions (Rust et al. 2004). By demonstrating how financialportfolio theory can be applied to customer portfolio man-agement, our research contributes to marketing theory andpractice on several counts. First, we extend Srivastava,Shervani, and Fahey’s (1998) work by demonstrating con-ceptually and empirically how the market-based assets of afirm include distinct customer asset classes that are charac-terized by differing degrees of cash flow variability and vul-nerability. We test whether customers can be categorizedinto segments that share similarities with asset classes usedin traditional financial investments and find support for ourbelief that financial portfolio theory is relevant in a cus-tomer portfolio context. In particular, we show that marketsegments—defined a priori according to classic market seg-mentation variables—could be characterized in terms oftheir risk, in addition to their return, thereby contributing totraditional market segmentation theory.
Second, we contribute to research on customer portfoliomanagement (e.g., Dhar and Glazer 2003; Johnson and Selnes2004) by introducing two methods to assess the value of acustomer: customer beta and the customer reward ratio.Responding to the call of Rust et al. (2004), our approachembraces (rather than controls for) customer heterogeneityas a path to improved business performance. For example,we demonstrate how the customer reward ratio can be usedto examine a customer portfolio through a new lens thatallows managers to isolate desirable customers that receivehigh scores on the reward-on-variability measure. As weillustrate, the attractive customers that rise to the top on thismeasure often present a profile that may not be detected whenusing classical criteria such as average level of purchases.
Third, we present an actionable plan to guide marketingmanagers in creating and managing a diversified portfolioamong existing and new customers. To this end, we con-structed segments according to the variability of standardizedrevenue. We obtained clusters with a high degree of unifor-mity in terms of level of revenue, size of the business, andindustry. We combined the clusters to form an efficient fron-tier that describes the portfolio with the lowest variability ofreturns for a desired level of return. Both back- and forward-testing showed that it is possible to build an efficient customerportfolio. We conclude that if companies want to increase thestability of the customer cash flow, risk management tech-niques can be implemented to ensure diversity among existingand potential customers/segments. This study demonstratesthat companies can diversify their customer portfolios bydeveloping a thorough understanding of customers’ pur-chase patterns and the drivers of these purchasing patterns(e.g., size, preferences for product lines, industry sector).
The Efficient Versus the Profit-MaximizingCustomer Portfolio
The goal of building an efficient customer portfolio is dif-ferent from the profit-maximizing objectives first identifiedin Blattberg and Deighton’s (1996) path-breaking article

and extended in subsequent studies (Blattberg, Getz, andThomas 2001; Reinartz and Kumar 2003; Reinartz,Thomas, and Kumar 2005), which focus on profit maxi-mization in the short and long run. There will be some simi-larities between the efficient and profit-maximizing customerportfolios, but there will also be differences. For example,observe in Table 1 that Cluster 5, which dominates the cur-rent portfolio and contains some of the most profitable cus-tomers, has similar weight in the optimized portfolio (E5).
In contrast, in the efficient portfolio, weights for theother clusters are increased dramatically, especially forCluster 3, which is dominated by SMBs. In other words,SMBs—often not a priority for some businesses—provide abalancing element when it comes to portfolio optimization.Cluster 1, which has relatively low profitability and highvariability, is the one in which weight has been decreasedmost drastically for the efficient portfolio compared withthe company’s current portfolio, from 41% to 4%. Consid-ering that Cluster 1 is one in which customers have exhib-ited the most growth, decisions regarding the customers inthis group should be made on a case-by-case basis.
Implementing the Portfolio Approach
Compared with corresponding adjustments in a financialportfolio, changes in the composition of a customer portfo-lio involve higher transaction costs, require a longer timehorizon to implement, and can introduce a host of strategicalignment issues to consider. Managerial judgment and thestrategic goals of the firm ultimately guide the selection ofthe target portfolio. Therefore, the cluster weights thatdefine the efficient customer portfolio provide a tentativeportfolio structure that managers can then adjust afterexamining the full range of customer metrics that CLV-based methods employ. Observe from Table 1 that the port-folios along the efficient frontier vary widely in clusterweights. For example, the portfolio with the lowest risk(E1) has a balanced composition, whereas the portfolio withthe highest return (E10) gives dominant weight (92%) toCluster 5. Represented in Cluster 5 are large customers,drawn from several industries, which provide higher aver-age revenue and lower variability than other clusters. Byisolating the risk–return characteristics of these customers,managers can make more informed judgments for targetingcustomers and estimating future returns.
The key difference between customer and financialportfolios is that managers can directly influence outcomes.Past studies in the CLV research tradition provide valuableinsights into how profitability can be enhanced by selectingthe right customers for targeting and determining the level ofresources to be allocated to specific customers (e.g., Kumar2008; Bowman and Narayandas 2004). Also, a wealth ofother metrics, such as customer loyalty, share of wallet, andstrength of the exchange relationship, guides customer man-agement. Our approach can be readily incorporated inestablished customer management frameworks to aid man-agers in balancing risk and return in a customer portfolio.
limitations and Further ResearchAlthough our approach allows managers to examine therisk–return characteristics of a customer portfolio through a
Risk and Return in a Customer Portfolio / 13
new lens, this study presents some limitations that couldspawn further research. First, because the current study isconfined to a single firm and industry, further research isneeded to test the viability of our approach in differentindustry contexts. The data and methods used in thisresearch are available to most companies: purchase transac-tions over time, limited demographics or firmographics, andprofitability by cluster. Second, the current study centerssquarely on the structure of the existing portfolio and there-fore does not consider the addition of new market segments.Buhl and Heinrich (2008) offer a heuristic method foradding new segments to the customer portfolio, which pro-vides a promising start for further research.
Third, the customer portfolio measures used in thisstudy center on the variability of cash flow and profitabilitybut are insensitive to the direction of movement. Therefore,managerial judgment, informed by established customermanagement approaches, is needed to discern the root causeof the variability (i.e., growth or decline of cash flow). Fur-ther research could explore customer resource allocationfrom a downside-risk perspective (Harlow 1991). Fourth,we assessed the desirability of customers by analyzing thepast volatility of purchases. However, for estimating futurecustomer worth, the most appropriate measure would befuture volatility. To determine the future volatility, Engle(1982) proposes a weighted moving average model that takesinto account the long-term behavior of a financial asset. Byanalyzing customer purchase information, a similar modelof weighted moving averages could be explored to predictfuture customer cash flow variability more accurately.
ConclusionIn his Nobel Prize acceptance speech, Markowitz (1991, p.496) mentions that “an investor who knows the futurereturns with certainty will invest in only one security,namely the one with the highest future return.” However, asBernstein (1999, p. 1) notes, “Even the most brilliant ofmathematical geniuses will never be able to tell us what thefuture holds. In the end what matters is the quality of ourdecisions in conditions of uncertainty.” We propose anapproach that customer portfolio managers can follow tocope with uncertain market conditions and to improve thequality of their resource allocation decisions. This researchoffers a new perspective on customer portfolio manage-ment, acknowledging an aspect that has been virtuallyignored: the risk of the customer. Paraphrasing Engle’s(2003) Nobel Prize acceptance speech, we infer thatacknowledging risks should provide insight into which cus-tomers are truly worthwhile.
Appendix ACash Flow Variability by
Customer Type
Contractual Relationships
Customer–firm relationships range from formal contractualto transactional relationships. Transactional relationshipsare low involvement, occurring on an as-needed basis. Con-

tractual relationships are governed by rules that are mutu-ally agreed on by the contracting parties (Gundlach andMurphy 1993). Due to their explicit nature, contractual rela-tionships are more predictable than transactional ones andtypically yield cash flows with less variability. Thus, when ahigh proportion of customers have entered into contractualagreements with the firm, especially long-term contracts,the overall risk of the firm’s customer portfolio will be low.
We compare the coefficients of variation for customerpurchases over time between contractual and noncontrac-tual relationships for the cooperating company in the fol-lowing way: The client company offers four different prod-uct lines (similar services, but with different deliverycharacteristics). Product Line 1 relies on contractual rela-tionships, in which assets are allocated to a specific cus-tomer, thus restricting the firm’s flexibility to deploy theseassets elsewhere. All other product lines have greater flexi-bility and no contracts attached.
The coefficient of variation (CoV) for Product Line 1,CoVLine 1 = .525, is significantly lower (p = .000) than thecoefficient of variation for any other product line (CoVLine2 =.879, CoVLine3 = 1.216, CoVLine4 = 1.740, CoVAll Lines =.708). In other words, the contractual product line (1) hasthe smoothest, most predictable cash flows, thereby insulat-ing the firm from troughs (downtimes) and peaks (busytimes). By serving customers that prefer a contractual rela-tionship, the firm reduces the coefficient of variation for itsoverall customer portfolio.
Size of Business
Research regarding financial portfolios has shown thatsmall firms periodically tend to outperform and underper-form large firms, exhibiting a negative correlation in returns(Reinganum 1992). Small firms outperform large firms dur-ing economic booms, but the effect disappears during reces-sions (Kim and Burnie 2002). Large business customers,characterized by financial soundness and greater volume,represent the equivalent of the blue-chip stocks in a finan-cial portfolio (i.e., stocks of companies with steady earningsand a solid reputation but slower growth). In contrast,SMBs have high growth potential (Acs and Audretsch1990). If large firms dominate a financial portfolio, varia-tions in their business cycles will have a substantial impacton their suppliers (LaBahn 1999). Although SMBs usuallyhave less influence on the overall financial portfolio indi-vidually, they can be combined to achieve diversificationand lower overall variability, provided their revenue streamsare not positively correlated (Markowitz 1987).
14 / Journal of Marketing, May 2011
We compare the coefficients of variation for customerpurchases over time between companies of different sizesusing a median split based on the number of employees.The coefficient of variation for the small companies was.67, statistically different (p = .023) from the value of .77for large companies.
Industry Classification
Industries are affected differently by external economicevents. For example, a downturn in the economy is oftenaccompanied by a decrease in home construction and anincrease in home improvement projects. A price increase fora commodity (e.g., silicone) might result in a substantialprice increase for automobile tires, whereas the price of per-sonal grooming products (e.g., shampoos, liquid soaps)might increase very little because silicone is not a relevantcomponent. Dhar and Glazer (2003) show that targetingcustomers in different segments reduces the risk of a reve-nue decline when economic conditions are changing.
We classified customers into major NAICS categories(e.g., transportation, paper and packaging, automotive)combined with the S&P global industry classification cate-gories, which are designed to capture sector differences. Bycombining classification schemes, we obtain a finer granu-larity that allows for more uniformity within the identifiedcategories. For example, NAICS identifies retailers,whereas the S&P standard makes the distinction betweendiscretionary (e.g. Kohl’s) and staples (Wal-Mart) retailers,which are likely to respond differently to peaks and troughsin the economy. Appendix B presents customer rewardratios, betas, and coefficients of variation for customer pur-chases over time in different industry sectors.
Because there are only a small number of companies ineach category (e.g., seven customers provide revenue fromlarge discretionary retail companies [line 11 in AppendixB]), there is insufficient statistical power for t-tests of thedifferences in the average coefficients of variation acrosscategories. However, for example, when we compare theoffice supply segment (line 9), with the food and beveragesegment (line 14), we notice important differences. Officesupply customers are more attractive than the food segment:Negative beta signals negative correlation with the overallportfolio, the customer reward ratio is much higher, and thecoefficient of variation is much smaller (i.e., lower risk).However, the cooperating company has many more cus-tomers in the food sector (42) than in the office supply sec-tor (3), and therefore the t-tests were inconclusive.
APPENDIX BCoefficient of Variation Classified Using Both NAICS and S&P
Average Monthly Six-YearRevenue (in Revenuec
S&P Reward Thousands (in Millions Categorization Industry N Beta Ratio CoVb of Dollars) of Dollars)
1 Beveragea Food and beverage 14 1.199 1.344 .710 369 322 Discretionary Apparel 9 1.261 2.467 .802 245 1283 Discretionary Automotive 35 1.616 1.400 .604 1000 23814 Discretionary Consumer goods 4 .883 .609 .720 599 1705 Discretionary Durables 10 1.874 .181 .656 182 110

Risk and Return in a Customer Portfolio / 15
Cluster Characteristics Industry Dominance
Cluster 1 (Constant Growth): 84 customers and 24% of the six-year revenue
•Higher beta (more rapid growth) than all other clusters•Higher variability (risk measured using coefficient of variation) than Clusters 2, 3, 5, and 6
•Higher absolute and average revenue per customer than Clusters 3and 6*
•Larger business customers (higher number of employees) than Cluster2
•89% of the discretionary retailers (and 53%of all discretionary products)
•56% of material paper and packaging (and48% of all materials)
•55% of all health products•39% of home improvement
Cluster 2 (Rise and Decline):74 customers, 12% of the six-year revenue
•Lower beta than Clusters 1, 3, 5, and 6 but higher than Cluster 4•Lower variability (covariance) than Clusters 1 and 4•Smaller-sized customers (by number of employees) than Cluster 1 butlarger than Cluster 3
•Cluster 2 customers buy overall and on average more than the customersin Clusters 3 and 6 but relatively less than the customers in Cluster 5*
•Discretionary electronics and appliances(61%) and discretionary consumer goods(42%)
•Manufacturers of metal (47%) and wood(39%)
•Food and beverages (35%)
Cluster 3 (Consistency Followed by Decline):52 customers and 3% of six-year revenue
•Lower revenue per customer than Clusters 1, 2, 4,* and 5 but higherthan Cluster 6
•Lower variability (CoV) than Clusters 1 and 4•Smaller-sized customers (by number of employees) than Clusters 2, 4,5, and 6
•Average level of beta (more explicitly, lower beta than Clusters 1 and 5but higher beta than Clusters 2 and 4)
•Health (35%, while 55% is in Cluster 1)•Energy (30%, while 66% is in Cluster 5)•Machinery (15%, while 80% is in Cluster 5)
APPENDIX CComparisons Between Clusters
APPENDIX BContinued
Average Monthly Six-YearRevenue (in Revenuec
S&P Reward Thousands (in Millions Categorization Industry N Beta Ratio CoVb of Dollars) of Dollars)
6 Discretionary Electronics and appliances 18 1.533 2.398 .786 368 3617 Discretionary Home improvement 27 .067 1.169 .705 313 5598 Discretionary Lawn and garden 4 .336 8.521 1.145 167 489 Discretionary Office supply 3 –3.668 2.948 .461 798 162
10 Discretionary Paper and packaging 11 1.584 1.976 .592 659 31111 Discretionary Retail 7 1.125 1.673 .675 5042 247612 Discretionary Sporting goods 7 –.233 .289 .751 123 4613 Energy Oil 5 1.067 2.050 .680 355 6414 Food Food and beverage 42 8.568 .774 .794 352 97315 Health Medical supplies 6 .773 .111 .644 138 5516 Industrials Automotive 8 .909 1.001 .598 237 9817 Industrials Electronics and appliances 5 1.856 .878 .774 152 4718 Industrials Machinery 4 .107 3.120 .567 656 18119 Industrials Paper and packaging 9 3.871 .315 .693 347 22320 Industrials Transportation 10 –18.483 .557 1.212 243 12921 Materials Chemicals 18 .834 1.213 .668 274 30822 Materials Metal manufacturing 12 1.569 1.266 .773 87 6223 Materials Paper and packaging 30 1.516 .850 .622 770 157624 Materials Wood manufacturing 4 .948 .854 .474 142 3325 Staples Consumer goods 18 –3.780 1.058 .792 1763 204826 Staples Paper and packaging 17 .742 .891 .714 1687 203627 Staples Pet supplies 5 16.118 1.789 .631 440 8828 Staples Retail 5 .366 .674 .629 7544 268329 Transportation Transportation 55 .035 2.498 .702 244 743
aThe distinction between food and beverage, though not in the S&P standards, is useful for distinguishing the patterns that are likely to char-acterize foods (e.g., cereals) from those of beverages (e.g., beer, soda).
bCoV = coefficient of variation.cCumulative revenue for the years 2001–2006.

16 / Journal of Marketing, May 2011
ness Markets,” Journal of Marketing Research, 41 (November),433–47.
Buhl, Hans Ulrich and Bernd Heinrich (2008), “Valuing CustomerPortfolios Under Risk–Return Aspects: A Model-BasedApproach and Its Application in the Financial Services Indus-try,” Academy of Marketing Science Review, 12 (5), 1–32.
Cardozo, Richard N. and David K. Smith Jr. (1983), “ApplyingFinancial Portfolio Theory to Product Portfolio Decisions: AnEmpirical Study,” Journal of Marketing, 47 (Spring), 110–19.
——— and ——— (1985), “On the Use of Financial PortfolioTheory in Marketing Decisions: A Reply to Devinney, Stewartand Shocker,” Journal of Marketing, 49 (Fall), 113–15.
Chan, Louis K.C., Jason Karceski, and Josef Lakonishok (1999),“On Portfolio Optimization: Forecasting Covariances andChoosing the Risk Model,” The Review of Financial Studies,12 (January), 937–74.
Chandra, Siddharth (2003), “Regional Economy Size and theGrowth-Instability Frontier: Evidence from Europe,” Journalof Regional Science, 43 (1), 95–122.
Conroy, Michael E. (1974), “Alternative Strategies for RegionalIndustrial Diversification,” Journal of Regional Science, 14 (1),31–46.
DeMiguel, Victor, Lorenzo Garlappi, and Raman Uppal (2007),“Optimal Versus Naïve Diversification: How Inefficient Is the
REFERENCESAcs, Zoltan J. and David B. Audretsch (1990), “The Determinantsof Small-Firm Growth in U.S. Manufacturing,” Applied Eco-nomics, 22 (February), 143–53.
Ambler, Tim, C.B. Bhattacharya, Julie Edell, Kevin Lane Keller,Katherine N. Lemon, and Vikas Mittal (2002), “Relating Brandand Customer Perspectives on Marketing Management,” Jour-nal of Service Research, 5 (August), 13–25.
Ang, Andrew, Joseph Chen, and Yuhang Xing (2006), “DownsideRisk,” Review of Financial Studies, 19 (4), 1191–1239.
Balagopal, Balu and Guy Gilliland (2005), “Integrating Value andRisk in Portfolio Strategy,” report, Boston Consulting Group.
Bernstein, Peter L. (1999), “Wimps and Consequences,” Journalof Portfolio Management, 26 (Fall), 1.
Blattberg, Robert C. and John Deighton (1996), “Manage Market-ing by the Customer Equity Test,” Harvard Business Review,74 (July/August), 136–44.
———, Gary Getz, and Jacquelyn Thomas (2001), CustomerEquity: Building and Managing Relationships as ValuableAssets. Boston: Harvard Business School Press.
Bolton, Ruth N., Katherine N. Lemon, and Peter C. Verhoef(2008), “Expanding Business-to-Business Customer Relation-ships: Modeling the Customer’s Upgrade Decision,” Journal ofMarketing, 72 (January), 46–64.
Bowman, Douglas and Das Narayandas (2004), “Linking Cus-tomer Management Efforts to Customer Profitability in Busi-
Cluster Characteristics Industry Dominance
Cluster 4 (Constant Decline):71 customers and 9% of the six-year revenue
•Lower average revenue and overall revenue than Cluster 5 but higheroverall revenue than Clusters 3* and 6
•Higher variability (CoV) than Clusters 2 and 3 but lower than Clusters 5and 6
•The lowest beta among all clusters in terms of revenue but highest betaamong all clusters in terms of return
•Industrial electronics (60%)•Discretionary automotives (51%)•Durables (45%)•Beverages (47%)
Cluster 5 (Best Customers Slowing Down):61 customers and 47% of six-year revenue
•Higher average revenue and overall revenue than Clusters 2,* 3, 4, and 6
•Lower variability (CoV) than Clusters 1, 4, and 6*•Lower beta than Cluster 1 but higher beta than Clusters 2, 3, 4, and 6 •Larger-sized customers than Cluster 3 (by number of employees) andCluster 6* (by annual sales)
•Staples in general (77%)•Automotive—staples (74%)•Paper and packaging—staples (92%)•Consumer goods—staples (86%)•Energy (66%)•Industrials (43%)•Chemicals (industrial and materials: 36%)•Machinery (80%) •Lawn and garden (45%)
Cluster 6 (low-Revenue Customers):125 customers and 5% of the six-year revenue
•Lower revenue per customer than any other cluster•Lower variability (CoV) than Clusters 1 and 4 but higher than Cluster 5*•Lower beta than Clusters 1 and 5 but higher beta than Clusters 2 and 4in terms of revenue, but lowest beta among all clusters in terms ofreturn
•Larger company sizes (based on the number of employees) than Clus-ter 3 but smaller customer business size (based on annual sales) thanCluster 5*
•Customers in this cluster buy significantly less than the average customer(more than 25% of customers account for 5% of the six-year revenue)and do not have the absolute majority for any of the categories
•This cluster has (statistically) as large of apercentage of the transportation industry as Cluster 5 (about 23%), and the second-highest revenue from the lawn and gardenindustry (32%, while 45% is in Cluster 5)
APPENDIX CContinued
*The difference is significant at the 90% confidence level. All other comparisons are statistically significant at the 95% confidence level or higher.Notes: CoV = coefficient of variation.

1/N Portfolio Strategy?” The Review of Financial Studies, 22(5), 1916–53.
Devinney, Timothy M. and David W. Stewart (1988), “Rethinkingthe Product Portfolio: A Generalized Investment Model,” Man-agement Science, 34 (September), 1080–1095.
———, ———, and Allan D. Shocker (1985), “A Note on theApplication of Portfolio Theory: A Comment on Cardozo andSmith,” Journal of Marketing, 49 (Fall), 107–112.
Dhar, Ravi and Rashi Glazer (2003), “Hedging Customers,” Har-vard Business Review, 81 (May), 86–92.
Dickson, Peter R. and James L. Ginter (1987), “Market Segmenta-tion, Product Differentiation, and Marketing Strategy,” Journalof Marketing, 51 (April), 1–10.
Dissart, J.C. (2003), “Regional Economic Diversity and RegionalEconomic Stability: Research Results and Agenda,” Interna-tional Regional Science Review, 26 (October), 423–46.
Engle, Robert F., III (1982), “Autoregressive Conditional Het-eroskedasticity with Estimates of the Variance of U.K. Infla-tion,” Econometrica, 50 (July), 987–1008.
——— (2004), “Risk and Volatility: Econometric Models andFinancial Practice,” American Economic Review, 94 (3),405–420.
Fama, Eugene F. (1970), “Efficient Capital Markets: A Review ofTheory and Empirical Work,” Journal of Finance, 25 (May),383–417.
Feldstein, Martin S. (1969), “Mean-Variance Analysis in theTheory of Liquidity Preference and Portfolio Selection,”Review of Economic Studies, 36 (January), 5–12.
Grinblatt, Mark and Sheridan Titman (2002), Financial Marketsand Corporate Strategy, 2d ed. Boston: McGraw-Hill/RichardD. Irwin.
Gundlach, Gregory T. and Patrick E. Murphy (1993), “Ethical andLegal Foundations of Relational Marketing Exchanges,” Jour-nal of Marketing, 57 (October), 35–46.
Gupta, Sunil and Donald R. Lehmann (2005), Managing Cus-tomers as Investments: The Strategic Value of Customers in theLong Run. Upper Saddle River, NJ: Wharton School Publishing.
———, ———, and Jennifer A. Stuart (2004), “Valuing Cus-tomers,” Journal of Marketing Research, 41 (February), 7–18.
Harlow, W.V. (1991), “Asset Allocation in a Downside-Risk Frame-work,” Financial Analysis Journal (September/October),28–40.
Homburg, Christian, Viviana V. Steiner, and Dirk Totzek (2009),“Managing Dynamics in a Customer Portfolio,” Journal ofMarketing, 73 (September), 70–89.
Hubbard, Douglas W. (2009), The Failure of Risk Management.Hoboken, NJ: John Wiley & Sons.
Johnson, Michael D. and Fred Selnes (2004), “Customer PortfolioManagement: Toward a Dynamic Theory of Exchange Rela-tionships,” Journal of Marketing, 68 (April), 1–17.
Kaplan, Paul D. (2009), “Déjà Vu All Over Again,” MorningstarAdvisor, (February/March), 28–33.
Kim, Moon K. and David A. Burnie (2002), “The Firm Size Effectand the Economic Cycle,” Journal of Financial Research, 25(Spring), 111–24.
Kumar, V. (2008), Managing Customers for Profit: Strategies toIncrease Profits and Build Loyalty. Philadelphia: WhartonSchool Publishing.
Kundisch, Dennis, Stefan Sackmann, and Markus Ruch (2008),“Transferring Portfolio Selection Theory to Customer PortfolioManagement—The Case of an e-Tailer,” in Enterprise Applica-tions and Services in the Finance Industry, D.J. Veit DennisKundisch, Tim Weitzel, Christof Weinhardt, Fefhi A. Rabhi,and Federico Rajda, eds. Berlin: Springer, 32–49.
Labahn, Douglas W. (1999), “Avoiding Over-Reliance on a SingleLarge Customer: The Impact of Technical Capability, ProductDevelopment and Alternative Key Customers,” Journal ofBusiness to Business Marketing, 5 (4), 5–37.
Risk and Return in a Customer Portfolio / 17
Lande, Paul S. (1994), “Regional Industrial Structure and Eco-nomic Growth and Instability,” Journal of Regional Science, 34(3), 343–60.
Markowitz, Harry (1952), “Portfolio Selection,” Journal ofFinance, 7 (March), 77–91.
——— (1959), Portfolio Selection: Efficient Diversification ofInvestments. New York: John Wiley & Sons.
——— (1987), Mean-Variance Analysis in Portfolio Choice andCapital Markets. New York: Blackwell.
——— (1991), Portfolio Selection: Efficient Diversification ofInvestments. Malden, MA: Blackwell.
Mittal, Vikes, Matthew Sarkees, and Feisal Murshed (2008), “TheRight Way to Manage Unprofitable Customers,” Harvard Busi-ness Review, 86 (April), 95–102.
Niemira, Michael P. and Philip A. Klein (1994), ForecastingFinancial and Economic Cycles. New York: John Wiley &Sons.
Niraj, Rakesh, Mahendra Gupta, and Chakravarthi Narasimhan(2001), “Customer Profitability in a Supply Chain,” Journal ofMarketing, 65 (July), 1–16.
Pearson, Michael M. and Guy Gessner (1999), “TransactionalSegmentation to Slow Customer Defections,” Marketing Man-agement, 8 (Summer), 16–23.
Rao, Ramesh K.S. and Neeraj Bharadwaj (2008), “Marketing Ini-tiatives, Expected Cash Flows, and Shareholders’ Wealth,”Journal of Marketing, 72 (January), 16–26.
Reinartz, Werner J. and V. Kumar (2003), “The Impact of Cus-tomer Relationship Characteristics on Profitable LifetimeDuration,” Journal of Marketing, 67 (January), 77–99.
———, Jacquelyn S. Thomas, and V. Kumar (2005), “BalancingAcquisition and Retention Resources to Maximize CustomerProfitability,” Journal of Marketing, 69 (January), 63–79.
Reinganum, Mark R. (1992), “A Revival of the Small-FirmEffect,” Journal of Portfolio Management, 18 (Spring), 55–62.
Rust, Roland T., Tim Ambler, Gregory S. Carpenter, V. Kumar,and Rajendra K. Srivastava (2004), “Measuring Marketing Pro-ductivity: Current Knowledge and Future Directions,” Journalof Marketing, 68 (October), 76–89.
———, Katherine N. Lemon, and Valarie A. Zeithaml (2004),“Return on Marketing: Using Customer Equity to Focus Mar-keting Strategy,” Journal of Marketing, 68 (January), 109–127.
Ryals, Lynette (2002), “Measuring Risk and Returns in the Cus-tomer Portfolio,” Journal of Database Marketing, 9 (March),219–27.
——— (2003), “Making Customers Pay: Measuring and Manag-ing Risk and Returns,” Journal of Strategic Marketing, 11(September), 165–75.
Sharpe, William F. (1966), “Mutual Fund Performance,” Journal ofBusiness, 39 (January), 119–38.
——— (1994), “The Sharpe Ratio,” Journal of Portfolio Manage-ment, 21 (1), 49–58.
———, Gordon J. Alexander, and Jeffery V. Bailey (1999), Invest-ments, 6th ed. Upper Saddle River, NJ: Prentice Hall.
Srinivasan, Shuba and Dominique Hanssens (2009), “Marketingand Firm Value: Metrics, Methods, Findings, and Future Direc-tions,” Journal of Marketing Research, 46 (June), 293–312.
Srivastava, Rajendra K., Tasadduq A. Shervani, and Liam Fahey(1998), “Market-Based Assets and Shareholder Value: A Frame-work for Analysis,” Journal of Marketing, 62 (January), 2–18.
Tuli, Kapil R., Sundar G. Bharadwaj, and Ajay K. Kohli (2010),“Ties that Bind: The Impact of Multiple Types of Ties with aCustomer on Sales Growth and Sales Volatility,” Journal ofMarketing Research, 47 (January), 36–50.
Venkatesan, Rajkumar and V. Kumar (2004), “A Customer Life-time Value Framework for Customer Selection and ResourceAllocation Strategy,” Journal of Marketing, 68 (October),106–125.