crest awards project_bee-o-diversity
TRANSCRIPT

Bee-o-diversityCREST awards: A guide to completing the project

CHAPTER 1 - INTRODUCTION TO THE CREST AWARDS
1
CREST awards

CHAPTER 1, SECTION 1 - WHAT ARE THE CREST AWARDS?
Why do the CREST awards?
1.You get a qualification certificate.
2.You learn lots of good new scientific skills!
3.You have lots of fun!
Project Aims:
The goal of the CREST award is to develop Science research, investigation and communication skills.
What are the Crest awards?
• The CREST awards are a national qualification run by the British Science Association (BSA).
• They involve you doing a full scientific investigation!!
• For the Bronze award you will spend 10 hours working on the project.
Image 1.1 Crest awards are run by the British Science Association (BSA)
Did you know that? Over 30,000 young people across Britain have achieved a CREST Award in the last year alone.
What are the CREST awards?
2

How will I be marked?
3
Ongoing teacher observations, student (video) log book (on Showbie) and end of project presentations.
Success Criteria: CREST Award level overview w - CREST Awards PROJECT REQUIREMENTS
CHAPTER 2 - RESEARCHING A TOPIC AND CREATING A HYPOTHESIS
4
What is Bee-o-diversity?

CHAPTER 2, SECTION 1 - WHAT ARE WE INVESTIGATING?
Key tasks & activities
1.Put yourselves into groups of four.
2.Create an i-movie to show how biodiversity can change.
3.Create a research question.4.Create a prediction and hypothesis.
Learning objectives
• State the goal of the CREST awards.
• Describe what your Bee-o-diversity project is investigating.
• Explain what you think will be the result of your CREST project.
What is Bee-o-diversity?
5
Make sure that you think about the task, then look for support on the i-book, then ask your group before asking the teacher (boss).
Gallery 2.1 Important group/ project rules and roles!

CHAPTER 2, SECTION 2 -WHAT ARE WE INVESTIGATING?
Thinking point: What do all these images have in common?
Gallery 2.2 What is biodiversity?Key tasks & activities
2.Research the definition for biodiversity and give an example.
Using the image gallery on the right create a definition for biodiversity.Record this on a pages document and upload to Showbie®.
2. What is Biodiversity?
6

CHAPTER 2, SECTION 3 -WHAT ARE WE INVESTIGATING?
Key tasks & activities
3.Create an i-movie trailer to show how biodiversity can change.
Using the websites on the right research what things can effect the biodiversity of an area.Export to your camera roll and upload to Showbie®.
Support: link
3. What is Biodiversity? - Research
7
Links to useful websites:www.instagrok.com (also available as an app).
http://simple.wikipedia.org/wiki/Main_Page
http://www.bbc.co.uk/bitesize/ks3/science/organisms_behaviour_health/food_chains/revision/8/

3. What is Biodiversity?
8
Example factors that effect an organisms distribution in an ecosystem:
Bee Diseases
Competition for food Availability of pollen
Interactive 2.1 Click on the image to see all the different factors that can af-fect the bumble bee population.
1 2 3
CHAPTER 2
9
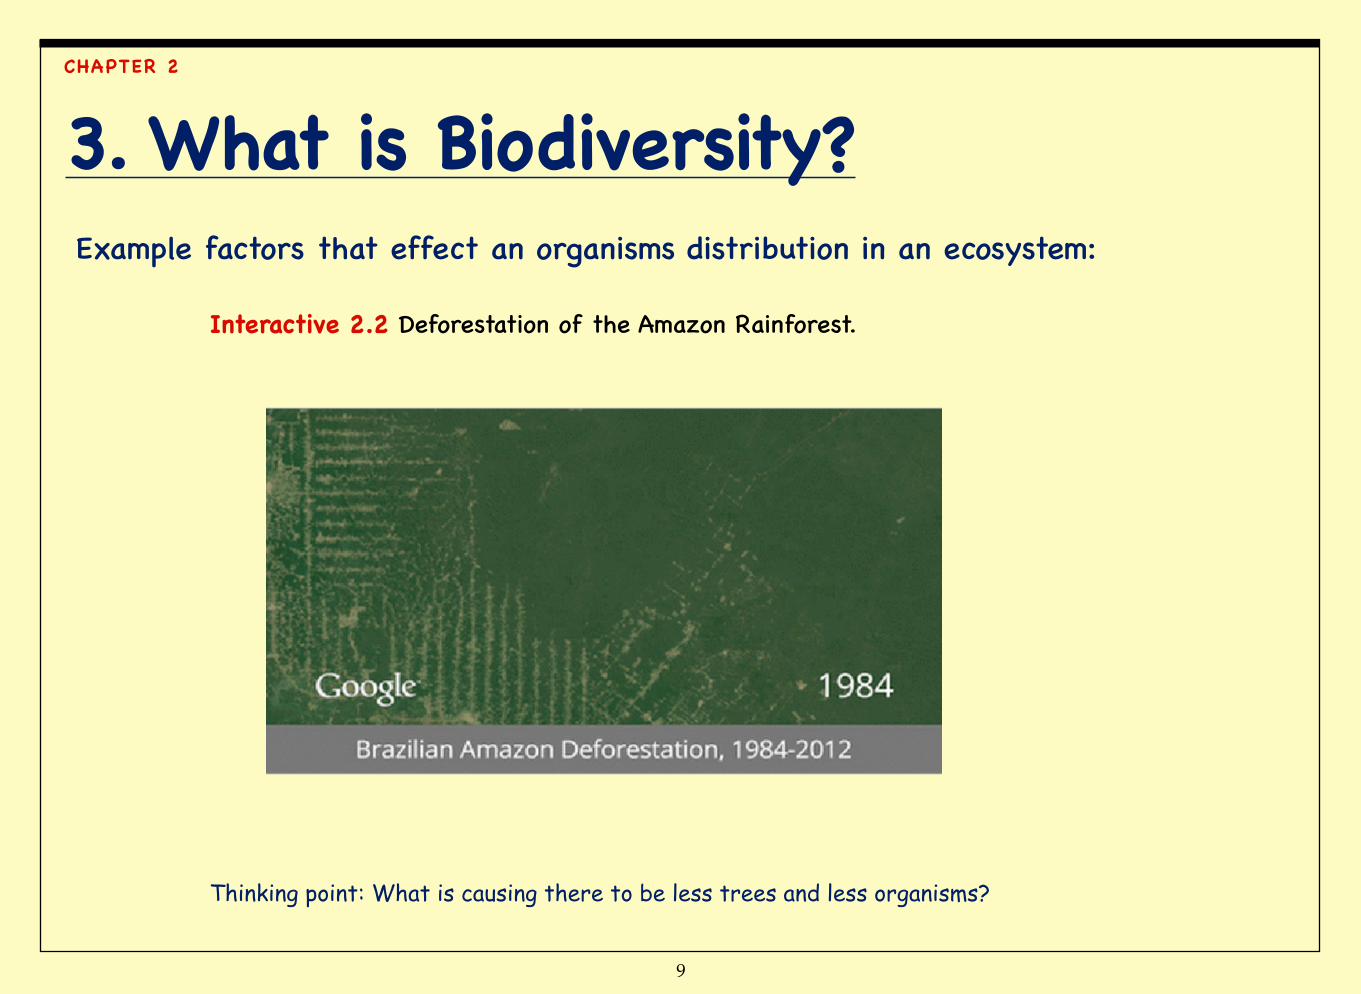
3. What is Biodiversity?Example factors that effect an organisms distribution in an ecosystem:
Interactive 2.2 Deforestation of the Amazon Rainforest.
Thinking point: What is causing there to be less trees and less organisms?
CHAPTER 2

10
4. What is Biodiversity?Review 2.1 What is biodiversity?
Check Answer
Question 1 of 3What does the start of the word (prefix) ‘bio’ refer to?
A. Non-living things.
B. Large objects.
C. Living things.
D. Non-living and living things.
CHAPTER 2
CHAPTER 2, SECTION 4 -WHAT ARE WE INVESTIGATING?
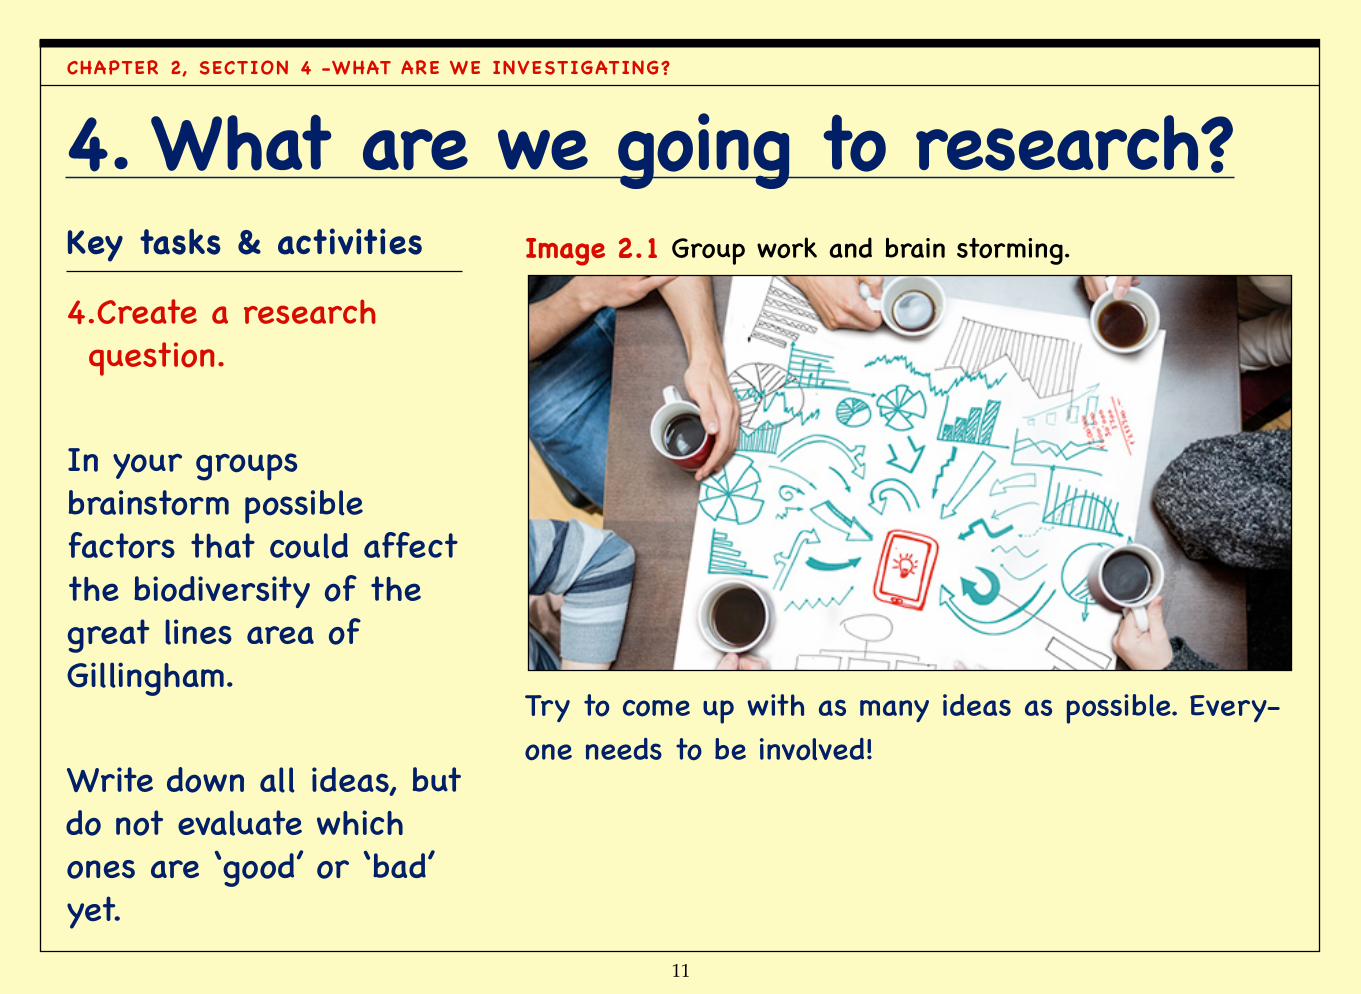
Image 2.1 Group work and brain storming.
Try to come up with as many ideas as possible. Every-one needs to be involved!
Key tasks & activities
4.Create a research question.
In your groups brainstorm possible factors that could affect the biodiversity of the great lines area of Gillingham.
Write down all ideas, but do not evaluate which ones are ‘good’ or ‘bad’ yet.
4. What are we going to research?
11

Narrowing your focus: valid and measurable
12
From your brainstorm, cross off all the factors that are not valid or easily measurable.
Complete the quiz on the right to help you decide.
Review 2.2 Valid and Measurable?
Check Answer
Question 1 of 3Does measuring air pollution need special equipment?
A. Yes
B. no
CHAPTER 2

13
Using your mind map / brainstorm create a research question.
Your research question will include an independent variable (cause) and a dependent variable (effect).
Upload this to Showbie®.
Research question creationCHAPTER 2

14
Possible research questions•“Does the sunny side of the pond / school quad support a greater variety of wildlife than the shaded side?” •“Has the pond school quad built by the builders achieved its aim of attracting and supporting a wide range of wildlife?” •“An extension to the school building is being planned and the completed new classrooms will restrict the amount of sunlight getting to the pond. What will be the impact on the pond’s wild life?” •“Is the number of plant species lower inside the school playground than on the great lines?”
You may want to choose one of the above research questions
CHAPTER 2

CHAPTER 2, SECTION 5 -WHAT ARE WE INVESTIGATING?
Key tasks & activities
4.Create a prediction and hypothesis.
Prediction vs. Hypothesis:Research the differences between the above two statements. (see right)
Using the definitions and your research question create your prediction and hypothesis. Upload this to Showbie®.
What are we going to research?
15
Use the above guide to help you create your prediction and hypothesis.
Interactive 2.3 Guide to writing a prediction and hypothesis.

CHAPTER 3 - CREATING AND TRIALLING A METHOD
16
How can I investigate Bee-o-diversity?

CHAPTER 3, SECTION 1 -WHAT ARE WE INVESTIGATING?
Key tasks & activities
1.Tour the research area and think about how you might use the equipment.
2.Create/ use a method to get some test results.
3.Think about how you can improve your method.
Learning objectives
• Trial a provided method• Create your own method • Evaluate the strengths and weaknesses of your method.
How can I investigate Bee-o-diversity?
17
Image 3.1 Sampling the environment.
You need to come up with a method for investigating your research question!

SECTION 2 -WHAT ARE WE INVESTIGATING?
Key tasks & activities
1.Tour the research area and think about how you might use the equipment.
Using the interactive globe on the right, list all the different types of habitat in pages.Upload this file to Showbie®.
Where am I going to do my experiment?
18
Thinking point: How many of these do you think will be in our local school environment?
Interactive 3.1 The model shows the different types of habitat that the world has.

19
SECTION 2 -WHAT ARE WE INVESTIGATING?
Key tasks & activities
1.Tour the research area and think about how you might use the equipment.
Using the interactive map on the right list down all the different types of habitat that we do have in our school environment.
When this is done tell your teacher and get ready to head outside!
1. Surveying the research area
Interactive 3.2 Environmental habitat for viewing.
These are the main areas that we will be investigating.

SECTION 3 -WHAT ARE WE INVESTIGATING?
Key tasks & activities
2.Create/ use a method to get some test results.
Write down a list of equipment that you need to use on pages.
Add a diagram of how the equipment will be used.
Video yourself using the equipment.
Write down a step by step guide to how you will do your experiment on keynote. - Upload to showbie.
How can I investigate Bee-o-diversity?
20

21
2. Equipment list : SupportUse the following to help jog your memory of what equipment we need.
Interactive 3.3 Equipment that you might use.
Rub the image with your finger to reveal the equipment that you might need.
22
2. Equipment DiagramUse the space below to sketch your equipment diagram.
Interactive 3.4 Blank page for diagram sketching
Use your equipment list to and video to help you draw an equipment diagram. Remember to in-clude labels.

23
2. Method instructionsUsing pages make a step by step method. Upload this step by step method to Showbie.
Thinking Points: How big an area are you going to investigate?How are you going to use the equipment?Are you going to sample the whole area?How are you going to make sure that your sample gives a true guess of the total number of organisms in your research area?
Figure 3.1 Sampling area
You need to pick an area from the school grounds to in-vestigate

24
2. Method instructions - SupportUse the drawing board below to help brainstorm ideas:
Interactive 3.5 Blank page for brainstorming
Try to answer the questions on the previous page!

2. What makes a good method?
25
Complete the method review questions to make sure that your method has all the right parts.Once you have finished the quiz upload your step by step method onto showbie.
Interactive 3.6 Method Quiz.
Log into the Bookry room and answer the questions.

26
2. Carry out your methodOnce you have completed all the tasks (see below) tell your Teacher.Get ready to head outside!
Interactive 3.7 Practical check list
Make sure that this check list is complete before you head outside!

SECTION 4 -WHAT ARE WE INVESTIGATING?
Key tasks & activities
3.Think about how you can improve your method
As you carry out the practical test run make sure that you write down all the things that you found tricky - use pages.
Also you should be videoing what you are doing using your iPad.
These things you will use later to help you improve your method.
How can I investigate Bee-o-diversity?
27
Figure 3.2 Improving your methods
Improving your experimental technique and skills is a key part of being a good scientist!!!

CHAPTER 4 -COMPLETING A METHOD AND RECORDING RESULTS
28
How can I measure Bee-o-diversity?

CHAPTER 4, SECTION 1 - HOW CAN I MEASURE BEE-O-DIVERSITY?
Key tasks & activities
1.Create a list of recommendations for how you could get more accurate, reliable and valid results.
2.Make an explain everything that shows how to record your results correctly.
3.Carry out your practical and record your results.
Learning objectives
• Describe how you could improve your method.
• Explain how you could record your results in a suitable way.
• Create a results table and record your results accurately.
How can I measure Bee-o-diversity?
29
Figure 4.1 Recording results is a key part of an investiga-tion.
Thinking point: How are you going to show your results?
CHAPTER 4, SECTION 2 -WHAT ARE WE INVESTIGATING?
Key tasks & activities
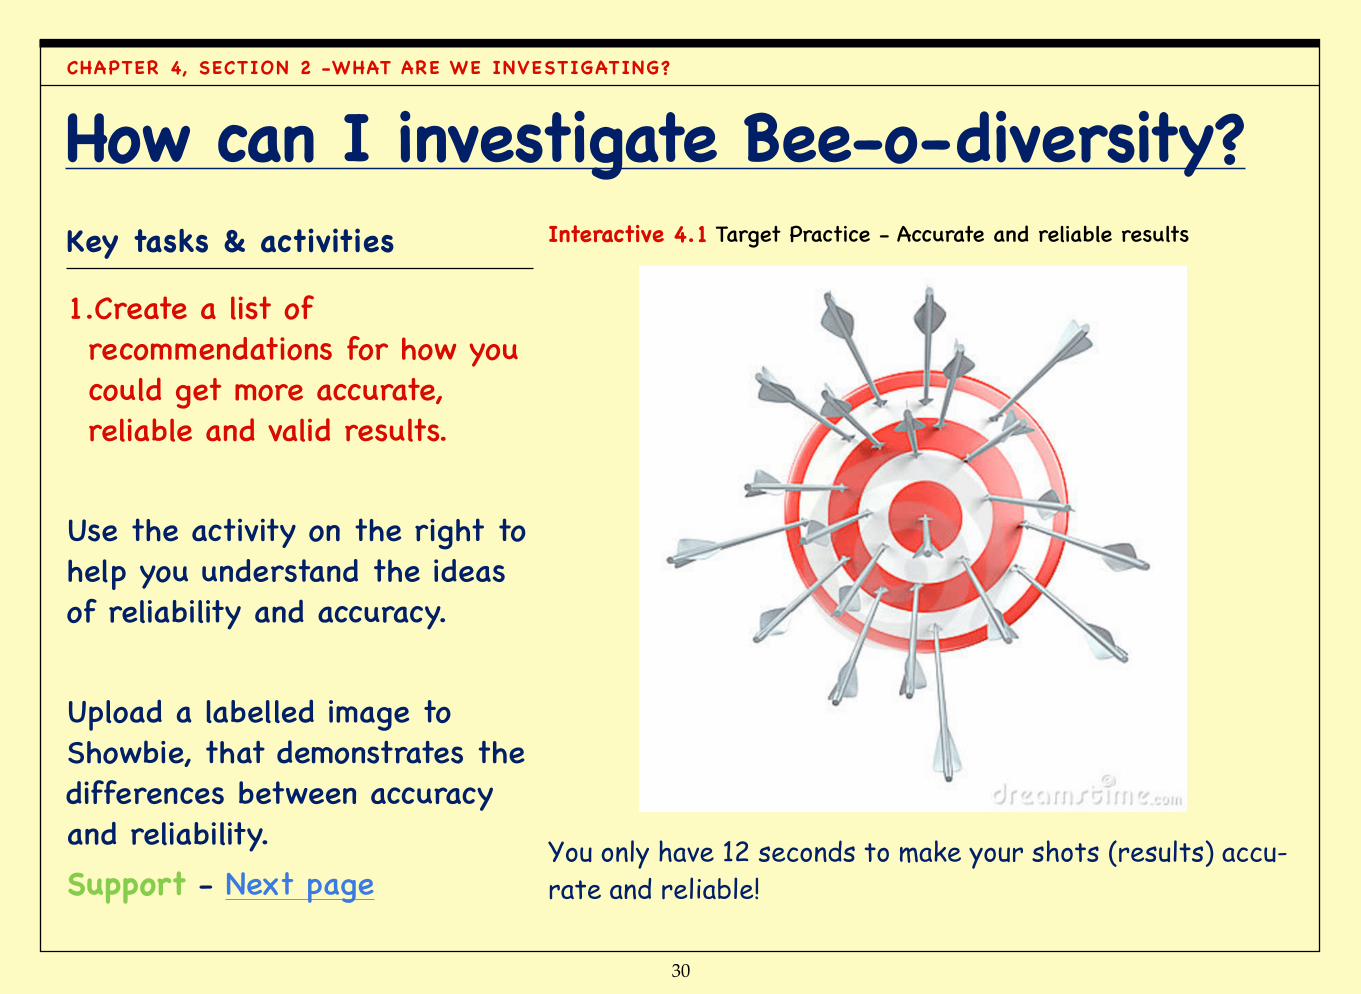
1.Create a list of recommendations for how you could get more accurate, reliable and valid results.
Use the activity on the right to help you understand the ideas of reliability and accuracy.
Upload a labelled image to Showbie, that demonstrates the differences between accuracy and reliability.Support - Next page
How can I investigate Bee-o-diversity?
30
Interactive 4.1 Target Practice - Accurate and reliable results
You only have 12 seconds to make your shots (results) accu-rate and reliable!

31
1. Accuracy vs. ReliabilitySupport - Use the below hidden image to help you complete your task.Interactive 4.2 This image reveal should help you understand the difference between accurate and reliable re-sults.
Rub off the orange colour to show the diagram (start at the top right).
CHAPTER 4

32
1. Sampling: AccuracyUsing your understanding of accuracy and reliability, how could you make your method more accurate?
Interactive 4.3 Improving sampling accuracy
See how repeating your samples makes the daisy number estimate more accurate (close to the truth).
CHAPTER 4
33
1. Method EvaluationComplete an explain everything to help explain what you could do in order to improve your method. Upload to Showbie.
Key Questions to think about:•How many measurements did you do?•Was this enough?•Could you work out what all the different animals were?•Was your area in the right place and over a big enough space (area)?Support: Link
CHAPTER 4
34
CHAPTER 4, SECTION 2
1. Method improvement recommendationsComplete an Explain Everything to help explain what you could do in order to improve your method. Upload to Showbie.

SECTION 3 - RECORDING YOUR RESULTS
Recording your results
35
Key tasks & activities
2.Make an explain everything that shows how to record your results correctly.
Make an explain everything to show how you are going to organise your results table.
Take a picture of your results table (with labels showing how you got the marks) with your iPad and upload this to Showbie.
Use this guide to help you produce a results table.
Interactive 4.4 Guide to creating a results table

36
SECTION 3 - RECORDING YOUR RESULTS
Recording your results - SupportFigure 4.2 You might want to use the below table as a guide for creating your results table.
Independent Variable Dependent Variable

SECTION 4 - CARRY OUT YOUR PRACTICAL
Collecting your results
37
Key tasks & activities
2.Carry out your practical and record your results.
When you have completed all the required tasks (see checklist) carry out your practical.
Figure 4.3 Investigating the environment.
Make sure that you are clear with what you need to do.
38
Collecting your results - ChecklistDouble check that you have completed all the activities.
Interactive 4.5 Ready for Practical - checklist
Complete the checklist then report to your teacher.

CHAPTER 5 - CREATING RESULTS TABLES AND GRAPHS
39
How can I show Biodiversity levels?

CHAPTER 5, SECTION 1 - HOW CAN I SHOW BEE-O-DIVERSITY?
Key tasks & activities
1.Add labels to the blank graph. 2.Plot your data and create step by step instructions describing what you did.
3.Choose a relevant format and display your data in a different way.
Learning objectives
• State what parts are needed in a graph.
• Describe how to plot points on a graph.
• Create different ways of showing results (data).
How can I show Bee-o-diversity?
40
Use the above Keynote to help you produce a graph of your results.
Interactive 5.1 Guide to drawing a graph

CHAPTER 5, SECTION 2 - HOW CAN I SHOW BEE-O-DIVERSITY?
Key tasks & activities
1.Add labels to the blank graph.
Upload to Showbie. If you have any issues, sketch on paper and take a picture and upload the picture to Showbie
41
‘x’ axis‘y’ axis
Interactive 5.3 Graph check-list
Use the checklist to tick off when you have assigned each label to the correct place on the graph
y axis label
x axis label
Title
x axis units
Data points
Interactive 5.2 Drag and match the labels to the graph
Use the app to drag the names of each label to the correct part of the graph and see if you’re correct.
y axis units
Independent variableDependent variable
Labeling your axis

What is Biodiversity?
42
Spot the mistake/s. Identify what is wrong and why? How can it be corrected?
Inde
pend
ent
variab
le
Dependent variable
‘x’ axis
‘y’ axisy
axis la
bel
x axis label
Title
x axis units
Data points
y ax
is u
nits
CHAPTER 5

CHAPTER 5, SECTION 3 - HOW CAN I SHOW BEE-O-DIVERSITY?
Key tasks & activities
2.Plot your data on paper and create step by step instructions describing what you did.
Take a picture of your graph and upload to Showbie.
Plotting your data
43
Describe each of the steps for making your graph on pages and upload to Showbie

CHAPTER 5, SECTION 4 - HOW CAN I SHOW BEE-O-DIVERSITY?
Key tasks & activities
3.Choose a relevant format and display your data in a different way.
Choose from one of the types of formats in the gallery on the right.
Using your results put the data into that type of format, using one of the apps on the next page, or sketching it accurately.
Displaying your results differently
44
Bar Chart
Gallery 5.1 Different types of graphs/ charts
45
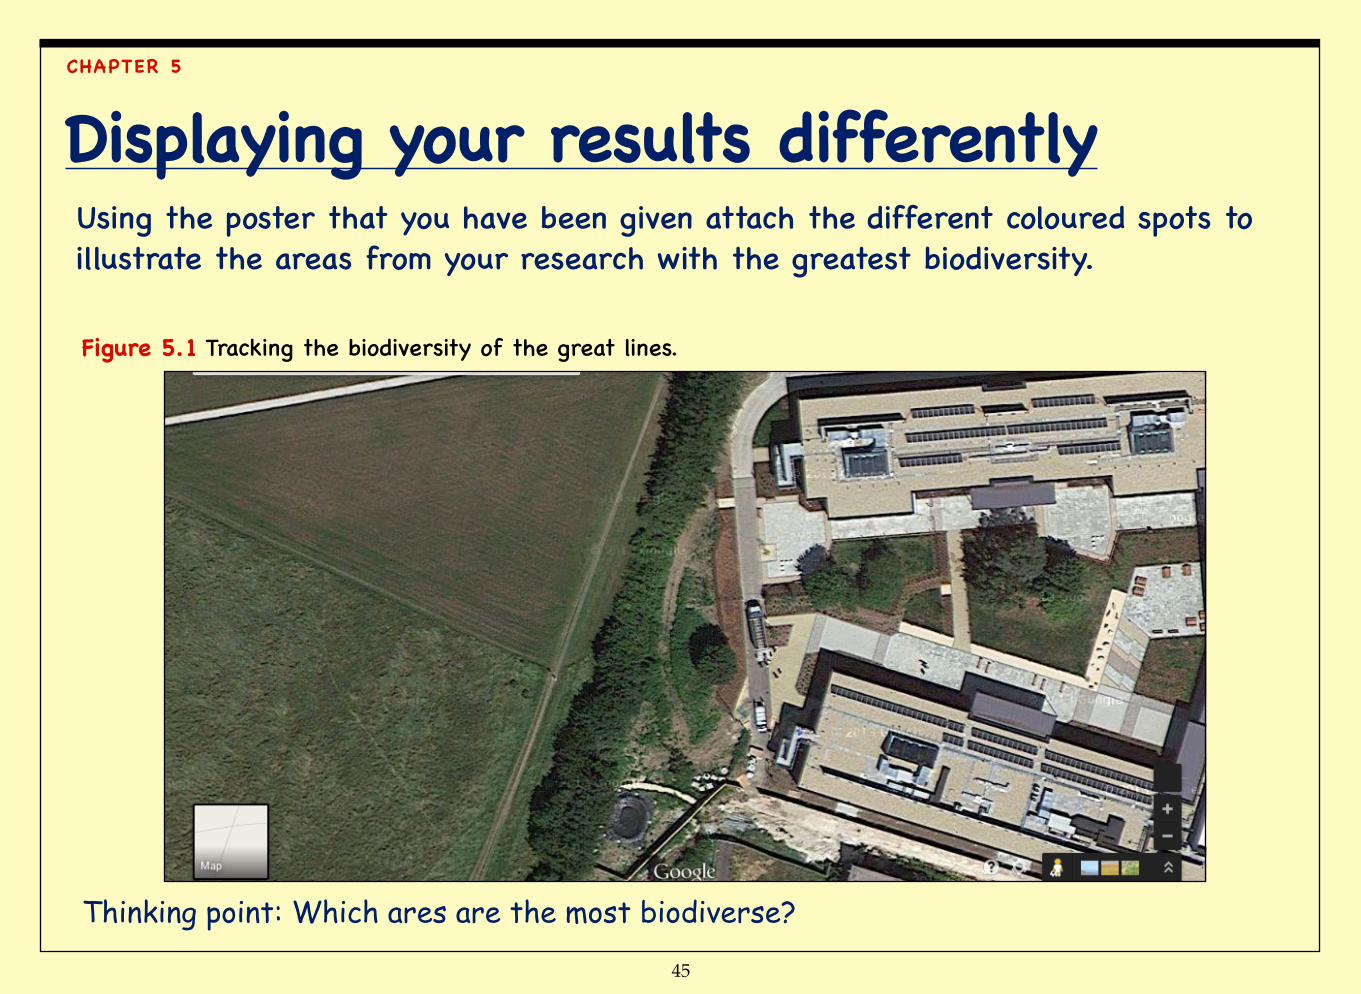
Displaying your results differentlyUsing the poster that you have been given attach the different coloured spots to illustrate the areas from your research with the greatest biodiversity.
Figure 5.1 Tracking the biodiversity of the great lines.
Thinking point: Which ares are the most biodiverse?
CHAPTER 5

CHAPTER 5, SECTION 5 - HOW CAN I SHOW BEE-O-DIVERSITY?
Key tasks & activities
4. Use the ‘Numbers’ or ‘iChartMaker’ app to create your graph.
After deciding the graph you would like to use, start inputting your data to create a new graph/ chart. Upload your work to Showbie.
Digital graph making
46

CHAPTER 6 - ANALYSING OUR RESULTS
47
What is the Bee-o-diversity like in our What is the Bee-o-diversity like in our environment?

CHAPTER 6, SECTION 1 - HOW CAN I MEASURE BEE-O-DIVERSITY?
Key tasks & activities
1.Write a conclusion for your results.
2.Create a poster that describes how the biodiversity of the local area might have been changed recently.
Learning objectives
• State what your results show.• Describe any patterns in your results.
• Explain what might have caused the biodiversity patterns.
What is the biodiversity like in our local environment?
48
Figure 6.1 The Biodiversity of the UK
Thinking point: Which ares are the most biodi-verse?

CHAPTER 6, SECTION 2 - HOW CAN I MEASURE BEE-O-DIVERSITY?
Key tasks & activities
1.Write a conclusion for your results.
Using the presentation support create your conclusion.
Once you have done this mark your conclusion using the presentation success criteria.
Upload your conclusion to Showbie.
What do your results show?
49
Challenge: Are the differences between your different results really (significantly) different?
Interactive 6.1 Guide to writing a scientific conclusion

Why are your results this way?
50
Give scientific reasons for why your results are the way they are.
Use the IDEAL level ladder to help you (see below).
Once you have completed this peer assess another student’s conclusions. The lower down the level ladder you got the hotter (more
high level) your answer)
Interactive 6.2 Conclusion - Scientific reasons
CHAPTER 6

CHAPTER 6, SECTION 3 - HOW CAN I MEASURE BEE-O-DIVERSITY?
Key tasks & activities
2.Create a poster that describes how the biodiversity of the local area might have been changed recently.
Using an app of your choice or A3 paper, create a poster that summarises your research findings.
What is Bee-o-diversity?
51
Thinking point: Do we agree with the above statement? If so why?
Gallery 6.1 Biodiversity poster examples

CHAPTER 7 - COMMUNICATING RESULTS
52
How can we spread the Bee-o-diversity How can we spread the Bee-o-diversity message?

CHAPTER 7, SECTION 1 - HOW CAN WE SPREAD THE BEE-O-DIVERSITY MESSAGE?
Key tasks & activities
1.Create a poster that summarises your findings.
2.Present your findings to the audience.
3.Complete your CREST form.
Learning objectives
• State what you have found out.• Describe what you have found out.
• Explain how biodiversity might be increased.
How can we spread our message of Bee-o-diversity?
53
Interactive 7.1 Amy Toole - Science is for Kids
Using the above video for inspiration try to think about how you might present your results.

CHAPTER 7, SECTION 2 - HOW CAN I MEASURE BEE-O-DIVERSITY?
Key tasks & activities
1.Create a poster that summarises your findings.
Use the template on the right to help you make a poster that shows your experiment.
Poster Presnentation: Biodiversity
54
Use the photos that you have collected to help you complete the poster.
Interactive 7.2 Bee-diversity poster template

How can we spread the Bee-o-diversity message?
55
Use the example biodiversity poster on the right for inspiration!
Figure 7.1 Example biodiversity Poster
Thinking point: How have they displayed their results?

CHAPTER 7, SECTION 3 - CREST PRESENTATION?
Key tasks & activities
1.Present your findings to an audience
Use the guidance on the right to help you make a presentation.
Mark each others presentation using the success criteria on the next page.
CREST Presentation
56

CREST - Success Criteria
57
Presentation success criteria:
CHAPTER 7, SECTION 3 - SUCCESS CRITERIA
CONTENT DETAILS MARKS
IntroductionOverview of the project and research title
mentioned. Importance of biodiversity mentioned.
1-3
Methods Method described. 1-3
Results and Conclusion
Results are described and conclusions about the local biodiversity are mentioned. Reasons
for differences are explained.1-5

CHAPTER 8 - EVALUATION OF THE CREST PROJECT
58
Did we measure the Bee-o-diversity Did we measure the Bee-o-diversity correctly?
CHAPTER 8, SECTION 1 - DID WE MEASURE BIODIVERSITY CORRECTLY
Key tasks & activities
1.Create a table that shows the strengths and weaknesses of your project.
2.Complete the evaluation survey.
3.Make a keynote that explains what you would do next time.
Learning objectives
• State the strengths and weaknesses of your project.
• Describe the strengths and weaknesses of your project.
• Evaluate what you could do to improve.
Did we measure Bee-o-diversity correctly?
59
Figure 8.1 Identifying strengths and weaknesses
Make sure that you are clear with what you need to do.

60
CHAPTER 7, SECTION 1 - WHAT WAS INCLUDED IN OUT INVESTIGATION?
What did we cover?Create a list of the main stages of our investigation.

CHAPTER 8, SECTION 2 -IDENTIFY ING YOUR STRENGTHS AND WEAKNESSES?
Key tasks & activities
1.Create a table that highlights the strengths and weaknesses of your project.
Brainstorm as many ideas as you can!
Use the project success criteria (click here).
Stengths and Weaknesses
61
Figure 8.2 Identifying strengths and weaknesses
Identifying strengths and weakness help you to improve!.

CHAPTER 8, SECTION 3 - PROJECT EVALUATION
Key tasks & activities
2.Complete the evaluation survey.
Completing your evaluation survey will help you identify areas for improvement next time.
Find the survey here.
Evaluation Survey
62
Figure 8.3 Simple survey example
Make sure that you complete all the different sections!

CHAPTER 8, SECTION 4 - HOW CAN I MEASURE BEE-O-DIVERSITY?
Key tasks & activities
3.Make a keynote that explains what you would do next time.
Write a guide to a year 7 student about common mistakes to avoid.
For example: Forgetting to measure out your sampling area.
Investigation Improvements
63
Figure 8.4 Advice to a young scientist
Thinking point: What would you do differently next time?

Accuracy
How close a measurement is to the ‘true value’. Accuracy can be effected by the equip-ment that is used to measure the variable and who does the measuring.
Related Glossary Terms
Index
Reliable
Find Term
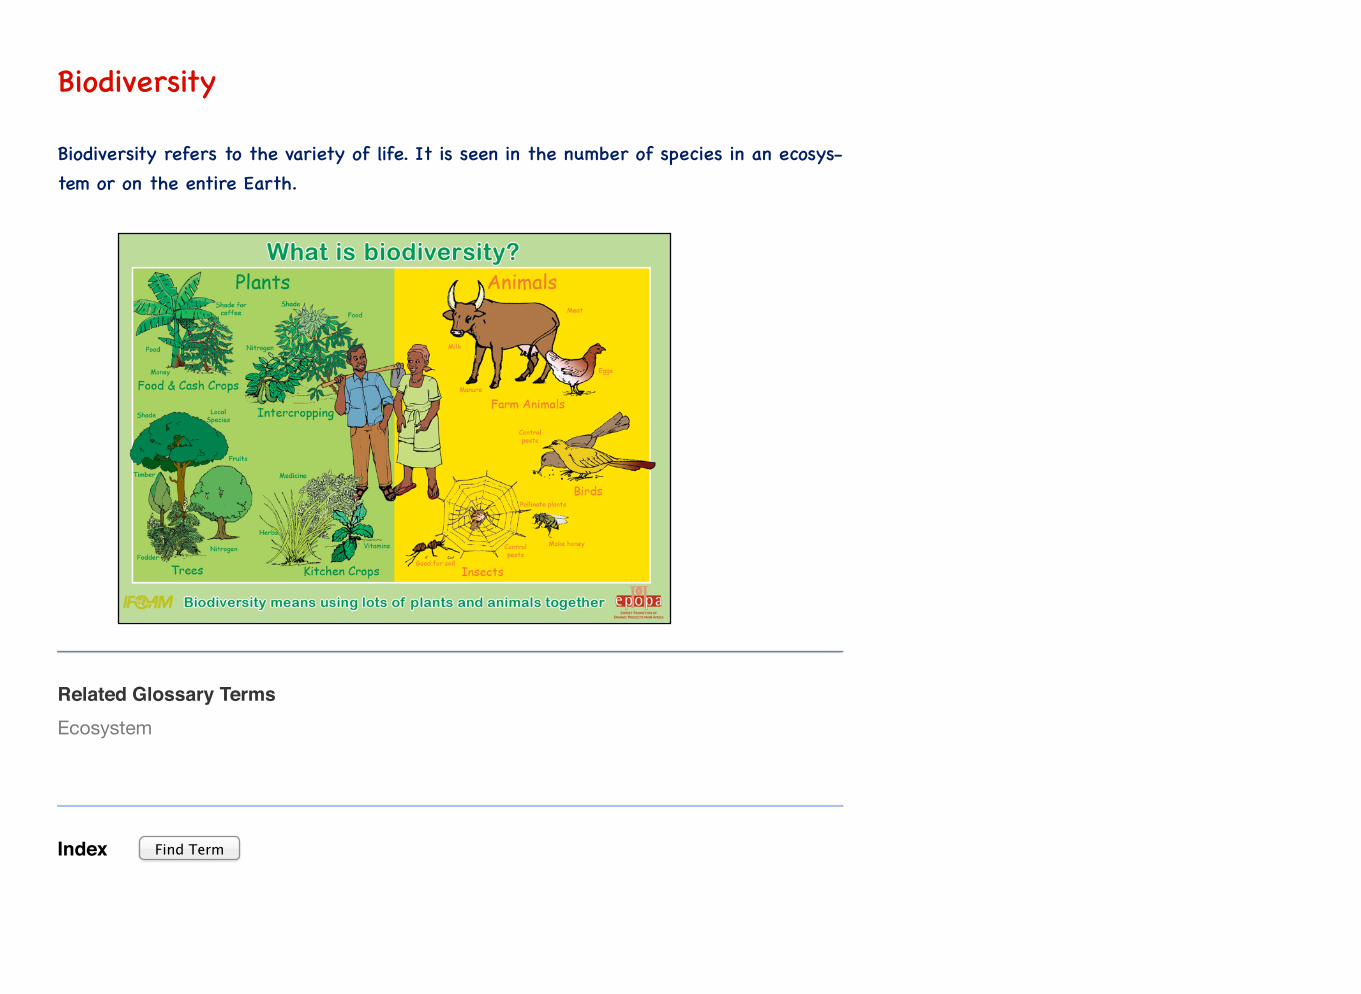
Biodiversity
Biodiversity refers to the variety of life. It is seen in the number of species in an ecosys-tem or on the entire Earth.
Related Glossary Terms
Index
Ecosystem
Find Term

CREST awards
The British Science Association's range of science, technology, engineering and maths (STEM) enrichment activities aim to inspire and engage 5-19 year olds.
Related Glossary Terms
Index
Drag related terms here
Find Term

Distribution
How organisms are spread out in an ecosystem or habitat.
Related Glossary Terms
Index
Drag related terms here
Find Term

Ecosystem
An ecosystem is made up of all living and non-living things in a given area that interact with one another. For example a rainforest ecosystem contains many different plants and animals.
Related Glossary Terms
Index
Biodiversity
Find Term

Hypothesis
A Scientific hypothesis describes the result of an investigation and the scientific reason-ing behind the predicted result.
For example: “I think that there will be a greater biodiversity of animals in an area where humans have not done any landscaping. I think this because during the process of landscaping food chains could be altered by killing too many of one species” Also during the landscaping process pesticides might be used which kill small important insects.”
Related Glossary Terms
Index
Prediction
Find Term

Method
The series of steps that you have to do to complete a scientific investigation. It normally includes a list of equipment, a diagram and a list of steps.
Related Glossary Terms
Index
Drag related terms here
Find Term

Prediction
A Scientific prediction describes what you think the result of an experiment will be.
For example: “I think that if I make the boat have more mass it will sink more quickly”
Related Glossary Terms
Index
Hypothesis
Find Term
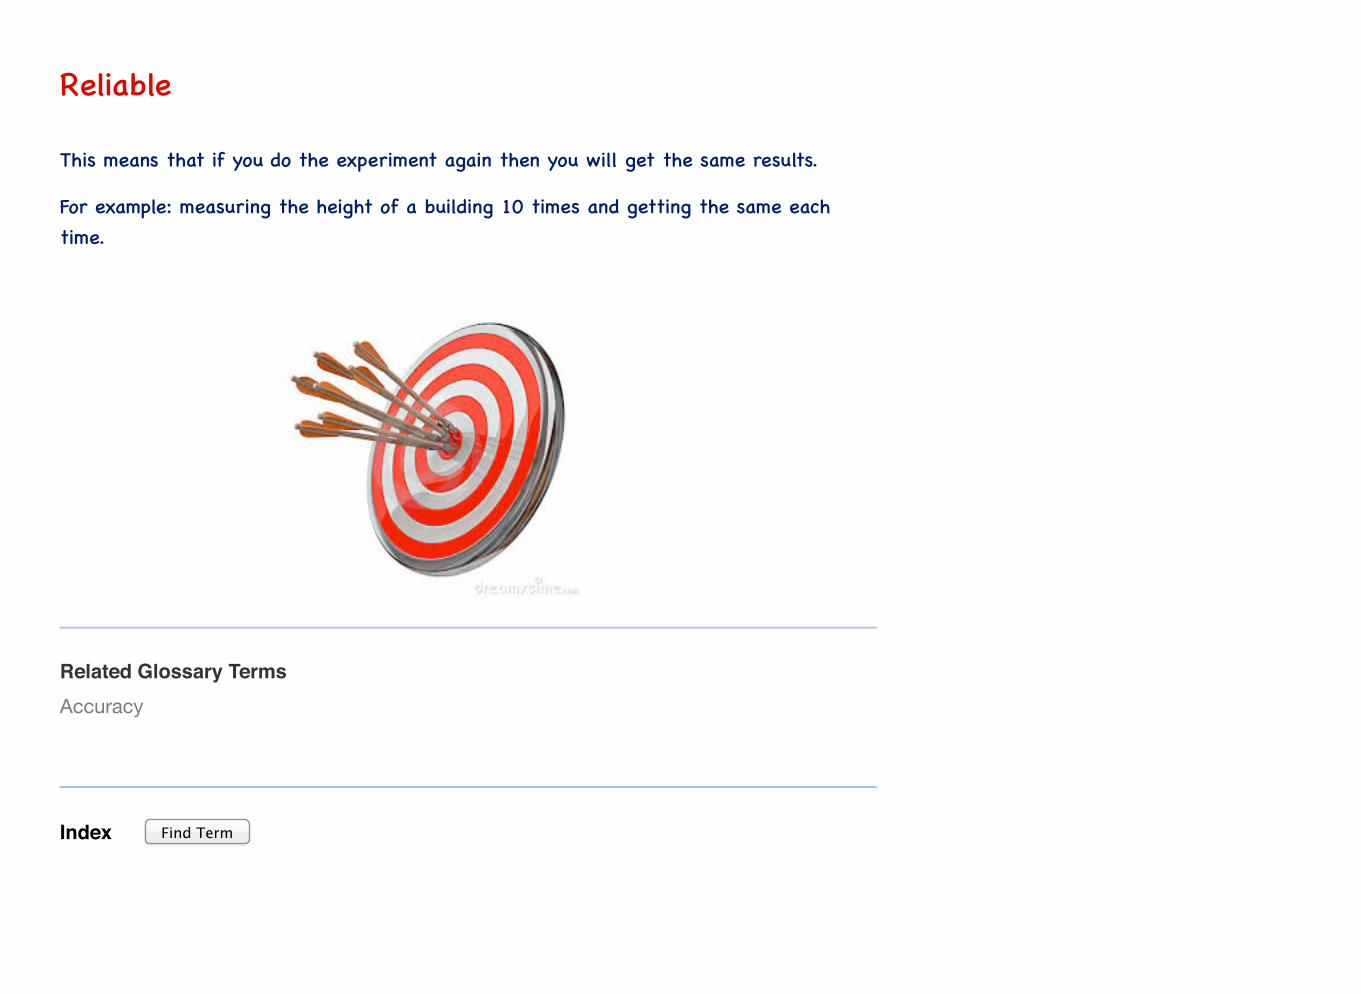
Reliable
This means that if you do the experiment again then you will get the same results.
For example: measuring the height of a building 10 times and getting the same each time.
Related Glossary Terms
Index
Accuracy
Find Term
Research
A process where you find out new information. This can be through looking up facts on the internet, in books or by doing a scientific investigation.
Related Glossary Terms
Index
Drag related terms here
Find Term

Species
The type of animal. For example a horse is an example of a species.
Related Glossary Terms
Index
Drag related terms here
Find Term