credit market conditions and the determinants and...
TRANSCRIPT

Credit Market Conditions and the Determinants and Value ofBank Lines of Credit for Private Firms
Cem DemirogluCollege of Administrative Sciences and Economics
Koc UniversityIstanbul, TURKEY 34450
[email protected] (90-212) 338-3103
Christopher JamesWarrington College of Business
University of FloridaGainesville, FL 32611-7168
[email protected] (352) 392-3486
Atay KizilaslanWarrington College of Business
University of FloridaGainesville, FL [email protected]
(352) 392-6386
First draft: March 15, 2009This draft: October 25, 2009
Corresponding author and Visiting Scholar, Federal Reserve Bank of San Francisco. Thanks to seminarparticipants at the Federal Reserve Bank of San Francisco, Tilburg, and Erasmus for helpful comments.

Credit Market Conditions and the Determinants and Value ofBank Lines of Credit for Private Firms
Abstract
This paper examines the effect of credit market conditions and changes in bank lending standards on the
availability and value of bank lines of credit for private firms. Overall, we find that tight credit conditions
and bank lending standards are associated with declines in firms’ access to bank credit but more so for
private than for publicly traded firms. We also find private but not public firms hold more cash and
substitute trade credit for bank loans when banks tighten lending standards. These two findings are
consistent with private firms being rationed in tight markets. In addition, we find that bank lines of credit
are associated with significantly higher private firm valuation multiples. Moreover, we find that the
higher valuations of firms with bank lines of credit varies with bank lending standards—with
relationships being associated with greater value when banks are more selective in their lending decisions.
Overall, the evidence suggests that credit crunches like the one that began in 2007 are likely to have a
disproportionate impact on firms with limited access to capital markets.

1
I. Introduction
While banks are important conduits of funds for firms that have limited access to capital markets,
dependence on bank financing may leave these firms vulnerable to reductions in the supply of bank
credit.1 This vulnerability may be exacerbated if, when credit is tight, banks raise lending standards
disproportionately more to informationally opaque firms. This may occur if, for example, the same shocks
that lead banks to reduce loan supply also adversely affect borrowers’ credit risk and thus aggravates the
types of agency and adverse selection problems that can lead to equilibrium credit rationing (see Stiglitz
and Weiss (1981)).2 A potentially offsetting factor is that bank-dependent private firms may develop close
borrowing relationships with a few banks, which creates greater incentives for their bankers to generate
proprietary non-public (or “soft”) information that may partially compensates for the lack of publicly
available information.3 If borrowing relationships buffer firms from shocks to the supply of bank credit,
then changes in lending standards should have a greater impact on access to lines of credit than on the
amount of credit conditional on having a line.
The question of how changes in bank lending standards effects corporate liquidity and whether
the effects vary with access to capital markets have important public policy implications.4 Indeed, the
large and exogenous shock to the supply bank credit caused by the sub-prime mortgage crisis that began
in 2007 has focused attention on how disruptions in the financial sector affect liquidity management of
firms with limited sources of external financing. However, direct evidence on how access to capital
markets and credit market conditions affect the availability of bank credit, liquidity management, and the
value of banking relationships is limited. This is due in large part to the lack of readily available
1 Banks may reduce loan supply due to tighter monetary policy (e.g., Bernanke and Blinder (1988) and Kashyap andStein (1990)), negative shocks to bank capital (e.g., Peek and Rosengren (2001), Chava and Purnanandam (2008)),or declines in bank liquidity (e.g., Paravisini (2008), Khwaja and Mian (2008), Loutskina and Strahan (2008)).2 This mechanism is referred to in the credit channel literature on the transmission of monetary policy as the balancesheet channel which predicts that monetary policy changes will have the greatest impact on smaller and lesstransparent firms where agency problems are the most severe (see Black and Rosen (2008) for a review of thisliterature).3 Consistent with this conjecture, Petersen and Rajan (1995) find that banks are more likely to provide relationship-based loans to constrained firms in concentrated credit markets where it is easier for banks to internalize the benefitsof investing in firm-specific “soft” information. See also Rice and Strahan (2009) who find that increasedcompetition in the banking sector due to changes in interstate branching legislation increased credit rationing and theuse of expensive trade credit.4 For example, Commercial Paper Funding Facility (CPFF) begun in 2008 was designed to improve market liquiditythrough the direct purchase of commercial paper by the Federal Reserve. This program may help public firms avoidreductions in the supply of bank credit but is likely to have little direct effect on the availability of credit to bankdependent private firms. In 2009, as the TARP funding is winding down focus is shifting towards policies designedto increase the supply of bank credit. See,http://www.reuters.com/article/smallBusinessNews/idUSTRE59N0SJ20091024

2
information on the lending relationships, financial characteristics, and most importantly, value of private
firms.
Previous studies of private firm banking relationships typically use survey data. For example,
several previous studies use National Survey of Small Business Finance (NSSBF) data to examine the
benefits of banking relationships in terms of access to credit (see for example Peterson and Rajan (1994)).
While these studies provide valuable insights into the benefits of banking relationships for very small
firms (with less than 500 employees), the surveys are conducted at a single point in time and lack
information on firm value and thus cannot be used to examine how changes in credit market conditions
affect the availability and value of bank credit. Moreover, data on the financial characteristics of private
firms from these surveys are limited. This is a concern because without good controls for the credit risk
and operating performance of firms it is difficult to isolate the effect of access to credit markets from
other factors that may influence the availability of credit.
Our goal in this paper is to investigate how credit market conditions affect the availability and the
value associated with bank lines of credit for private firms. Specifically, we examine four related
questions. First, how do changes in bank lending standards and credit market conditions affect the
availability and use of bank lines for private firms? Second, how do credit market conditions affect
liquidity management at private firms in terms of their cash holdings and use of trade credit? Third, do
credit market conditions affect private and public firms differently? Finally, does the value associated
with banking relationships vary with access to capital markets and credit market conditions?
We address these questions using a unique hand collected data set that includes information on
the financial characteristics and the availability and use of lines of credit for a large set of private and
public firms. Our private firm sample consists of private firms that were either acquired by a public firm
(i.e., acquired firms) or completed an initial public offering (i.e., IPO firms) during the 1995 through 2004
period. In particular, the sample consists of 2,166 privately held firms (1,350 IPOs and 816 acquired
firms) of which 64% had banking relationships prior to when they were acquired or when public.
We use this sample of private firms for two reasons. First, we are able to obtain information on
their bank credits and financial statements from publicly available sources. In particular, for acquired
firms, we hand-collect pre-transaction accounting information as well as information concerning the
existence and size of banking relationships from proxy statements filed at the SEC by the acquiring public
firms. For IPO firms, we hand-collect information on banking relationships from the IPO prospectuses
and firm financial characteristics from Compustat. These data allow us to examine in detail how (large)
private firms manage their liquidity and how, after controlling for firm characteristics, credit market
conditions affect private firms’ liquidity management. Also, by focusing on large private firms whose
financial characteristics are similar to those of publicly traded firms, we are able to obtain a cleaner

3
estimate of the affect of access to capital markets on access to bank credit and liquidity management.
Second, we can examine the relationship between firm value and the existence of banking relationships
using the valuation multiples associated with the IPOs or acquisitions. We are therefore able to examine
the value of private firms’ banking relationships and more importantly whether the value of these
relationships varies with firm characteristics and credit market conditions.
A sample consisting of private firms that are acquired or go public raises obvious concerns about
selection bias and generalizing to the population of all private firms. For example, our sample of private
firms is likely to be much larger than the typical private firm. Moreover, because IPO and M&A activity
vary with credit market conditions, the types of firms that enter our sample may vary with credit market
conditions. In the next section, we discuss in detail sample selection issues and potential biases these
issues may create.
To compare the determinants of lines of credit of our private firms to public firms we use Amir
Sufi’s data on bank lines of credit for publicly traded firms for the period 1996 to 2003.5 Since our private
firm sample is conditioned on an acquisition or an IPO transaction, we compare our private firm findings
to a subset of public firms in Sufi’s database that were delisted from CRSP due to a merger (CRSP
delisting codes 200-299) during the sample period. We refer to these firms as public acquired firms.
When relevant, we also compare our private firms to Sufi’s entire panel of public firms.
Since lines of credit are a formalization of a banking relationship and are therefore unlikely to be
transaction driven or reflect bridge lending (Berger and Udell (1995)), we assume in this paper that firms
have banking relationships if they have access to a bank line of credit. A practical advantage of using this
definition is that we can compare the determinants of banking relationships for private and public firms
using Sufi’s data set on public firm lines of credit. However, it is important to note that our results are
similar when we use a broader definition of banking relationships that includes, for example, access to
any kind of bank loan.
We begin our analysis by examining the relationship between credit market conditions and
private firms’ access to and use of bank lines of credit. We use three measures of credit market
conditions. First, following Officer (2007), we define commercial and industrial (C&I) loan spreads as 4-
quarter moving average of the difference between the C&I loan rate and federal funds rate at the time of
the transaction. We assume that higher C&I loan spreads reflect tighter credit market conditions. Second,
we examine the net percentage of banks tightening lending standards (according to the Federal Reserve
Bank’s Loan Officer Surveys) in the transaction year.6 Our third measure is the average spread between
5 For comparison, Sufi (2009) reports that 82% of public firms have bank lines of credit (although, as Sufi pointsout, this estimate may be upward biased).6 Lown and Morgan (2006) use the loan officers’ response to the question regarding tightening lending standards inthe Federal Reserve’s survey of the terms of bank lending as a measure of credit standards. They find that net

4
AA-grade 3-month non-financial commercial paper rates and 3-month T-bill rates (i.e., paper-bill spread).
Gatev and Strahan (2006) argue that changes in the paper-bill spread reflect changes in the availability of
liquidity provided by capital markets.7 We expect bank borrowing of private firms to be relatively more
sensitive to changes in the cost and availability of bank provided liquidity than the cost of funding in the
commercial paper market since none of the private firms in our sample issued commercial paper.
The opacity of private firms may lead changes in bank lending standards to have a
disproportionate impact on the availability of credit for private firms relative to public firms. The basic
idea is that the lack of transparency aggravates agency problems that give rise to the type of equilibrium
credit rationing examined in Stiglitz and Weiss (19881). Bank generated proprietary “soft” information
may potentially offset the lack of public information, but this effect is likely to be limited to firms with
pre-existing banking relationships (where transparency is enhanced through the existence of soft
information). This argument suggests that the effect of changes in bank lending standards should be the
greatest where transparency matters the most—on the availability of a bank line of credit as opposed to
the use of preexisting lines. In particular, to the extent that bank generated soft information substitutes for
public information (generated through, for example, public securities filings, rating agencies, and
analysts), the effects of changes in lending standards should have less of an effect on the availability of
credit for private firms with pre-existing lines. Indeed, one rationale for the existence of lines of credit is
that they can limit the disruptive effects of the types of liquidity shocks analyzed in Holmstrom and Tirole
(1997) and Boot, Thakor, and Udell (1987).8
Overall, we find that, controlling for observable risk characteristics and operating performance,
private firms’ access to lines of credit is significantly related bank lending standards. For private firms,
we also find that the fraction of total liquidity provided through bank lines of credit declines significantly
when bank lending standards tighten. Consistent with lines of credit providing insurance against liquidity
shocks, the decline in bank supplied liquidity for private firms is driven entirely by a reduction in access
to lines of credit as opposed to a reduction in the usage or size of credit lines.
At least a portion of the reduction in availability of credit to private firms in tight credit markets
appears to be the result of a decrease in the supply of bank credit (rather than a decrease in demand). In
particular, when bank credit conditions are tight private firms rely more heavily on trade credit and hold
percentage of loan officers tightening standards is more informative of changes in future bank lending than arechanges in Fed Funds rates or changes in loan rates.7 Gatev and Strahan (2006) show that when market provided liquidity dries up and paper-bill spreads widen banksexperience an inflow of funds allowing them to meet increased loan demand as public firms switch from market tobank provided liquidity.8 The basic idea behind these models is that moral hazard problems create the need for entrepreneurs to postcollateral to ensure sufficient effort is expended on the projects. Shocks to collateral values cause credit rationing,which in turn, can cause borrowers to pass up valuable investment Kashyap, Rajan, and Stein (2002) argue thatsynergies in deposit taking and lending make banks the most efficient liquidity providers.

5
significantly more cash on their balance sheets, suggesting that private firms experience (or anticipate)
credit rationing.9 Thus, the inability of private firms to smooth out liquidity shocks (see for example
Gertler and Gilchrist (1994)) appears to be at least partially explained by limits on the supply of bank
credit.
In contrast, for publicly traded firms we find very little relationship between bank lending
standards and access to bank lines of credit or trade credit use, although there is some evidence that public
firms reduce the usage of bank lines in tight markets and draw on alternative sources of liquidity
including cash. However, we find that public firms significantly increase their use of bank lines of credit
when the paper-bill spread (a measure of market provided liquidity) widens. This is consistent with public
firms exploiting relative differences in the cost of intermediated versus capital market liquidity.
Our results suggest that, during our sample period, direct access to credit markets insulates public
firms from changes in the supply of bank credit. Whether these empirical relationships apply to the credit
crisis that began in 2007 is unclear. While our sample period covers the 2001 recession, there was no
major shock to the banking sector during the time period covered by our sample. Moreover, current credit
crisis is characterized by a decline in bank lending combined with a massive decline in short term funding
provided by capital markets.10 That said, our finding that private firms access to lines of credit is more
sensitive to credit market conditions, is consistent with recent survey findings of Campello, Giambona,
Graham and Harvey (2009, hereafter CGGH). In particular, based on a survey of CFOs conducted in
February 2009, CGGH find that during the height of the crisis, private firms were much more likely to
encounter problems renewing or initiating credit lines than publicly traded firms.
We also examine the relationship between firm value, access to bank credit, and credit market
conditions. Bank lending to privately held firms is likely to depend more on “soft” proprietary
information and much less on “hard” verifiable information such as accounting information and credit
ratings (see Berger et al. (2005)). The greater the weight placed on “soft” information in bank lending, the
greater the potential for bank lending to signal or certify firm quality. While “soft” information may be
important for very small private firms, it is unclear whether loans to larger private firms will rely heavily
on “soft” information. As Berger et al. (2005) and Berger and Udell (2002) point out, “soft” information
is difficult to transfer and verify within a large banking organization. As a result, while small banks may
have a comparative advantage in making these types of loans, regulatory lending limits may make lending
9 Petersen and Rajan (1994) also find that small private businesses use more trade credit when credit from financialinstitutions is unavailable.10 According to the Federal Reserve Survey of the Terms of Bank Lending (April 2009), aggregate C&I lendingdeclined from November 2008 through March of 2009. Also, non-financial commercial paper outstanding declinedfrom August 2007 through March of 2009.

6
by small banks to larger private firms infeasible. Given that our sample consists of larger private firms we
are able to address the importance of soft information among larger private firms.
The association between banking relationships and firm value is likely to be the strongest when
bankers are more selective in their lending decisions. In short, for less transparent firms, the certification
effect of bank lending decisions is more valuable when loans are hard to get.
While several previous studies find that banking relationships improve access to funding for
small firms, direct evidence of an association between banking relationships and private firm valuations is
limited—in large part due to the lack of information about the values and banking relationships of private
firms.11 For example, since the shares of privately held firms are not actively traded, an analysis of the
valuation effects of bank loan announcements along the lines of James (1987) and Lummer and
McConnell (1989) is not possible. We circumvent this problem by comparing valuation multiples of
acquired firms and IPO firms with and without banking relationships.
Simple univariate comparisons of raw valuation multiples are difficult to interpret for several
reasons. First, valuation multiples of private firms tend to be very noisy (see Kim and Ritter (1999)).
Second, the observable factors that positively influence the likelihood of obtaining a bank commitment
are likely to be negatively correlated with valuation multiples (e.g., mature firms with relatively limited
growth options are more likely to obtain bank lines of credit but also sell at lower multiples). Third,
whether or not a firm has banking relationships may be based on the lending bank’s “soft” information
concerning firm value and we observe only the outcome of the lending decision. To the extent that the
private “soft” information is correlated with firm value and given that we observe only the outcome of the
lending decision (i.e., whether the firm received a line of credit), we need to correct for potential
selectivity bias in the valuation analysis. Selectivity bias is of particular concern for younger and smaller
private firms, given the widely held view that “soft” information is a more important component of the
lending decision for these firms than for larger public firms (see Berger et al. (2005)).
We address these issues in two ways. First, we match private firms with banking relationships
with comparable private firms without banking relationships but with similar sales, within the same
industry that engaged in a similar transaction at roughly the same point in time. We then estimate a line of
credit premium by subtracting the median valuation multiple for the comparable firms from the valuation
multiple for the firm with a banking relationship. This is similar to the approach taken by Officer (2007)
in his analysis of the acquisition discounts for private companies. Second, we employ a selectivity model
11 See for example, Petersen and Rajan (1994, 1995) and Berger and Udell (1995). The focus of these studies is onwhether close banking relationships affect the availability and cost of funds. Petersen and Rajan (1994, 1995) findthat close banking relationships increase the availability of funds and enable firms to avoid using costly trade credit.However, they find no relationship between the cost of funding and the duration of banking relationships. Bergerand Udell (1995), on the other hand, find that the cost of borrowing on lines of credit declines with the strength ofbanking relationships.

7
described in Greene (2000) to estimate the cross-sectional determinants of firm value. A positive
coefficient on the Inverse Mills ratio in the second stage of the selectivity regressions indicates that banks
on average make lending decisions based on positive “soft” information concerning firm quality. While
the first approach has the advantage that it avoids concerns regarding the sensitivity of selection models to
identification assumptions (see Johnston and DiNardo (1997)), it has the disadvantage of reducing our
sample size considerably because of the limited number of firms with suitable comparables.
Overall, we find that private firms with banking relationships have significantly higher valuation
multiples than private firms without banking relationships. For example, based on our matching analysis,
the average valuation premium associated with the presence of banking relationships is 26.5% for private
acquired firms and 1.4% for IPO firms. The coefficient estimates from the sample selection models also
confirm this finding. In particular, for private firms, the coefficient estimate on the inverse Mills ratio is
positive and significant regardless of the valuation multiple used. The evidence is consistent with the
notion that banks use private (“soft”) information in the loan approval process. Consistent with this
interpretation, we also find the value of soft information is greatest for the smallest and youngest private
firms in our sample. In addition, and perhaps most interestingly, we find that the value of banking
relationships varies significantly with credit market conditions. For example, when lending standards are
tight (i.e., when the net percentage of banks tightening standards is above the sample median), the
valuation premiums are 40% higher than when credit standards are loose. Higher valuation premiums for
private firms during tight credit market conditions are consistent with banks being more selective in their
lending decisions during tight credit market conditions. Finally, while we find a positive and significant
coefficient on the inverse Mills ratio in the valuation regressions for private firms, we find no evidence of
selectivity bias for public firms. This finding is consistent with the conventional view that lending to
public firms is based primarily on “hard” rather than on “soft” information.
Our findings suggest that “credit crunches” (i.e., more stringent bank lending standards), have a
disproportionate impact on privately held firms. Not only are private firms more likely to lose access to
bank liquidity when lending standards tighten, they are also more likely to lose the valuable certification
provided through the bank lending process. As a result policies designed to increase the availability of
bank credit are likely to be particularly beneficial to private firms.
The remainder of the paper is organized as follows. In section II, we describe our sample
selection procedure and data sources. In section III, we provide summary statistics. In section IV, we
examine the cross sectional determinants of banking relationships and factors that govern the use of bank
lines as a source of liquidity for private firms. In section V, we examine the relationship between
valuation multiples and banking relationships. In the final section, we provide some conclusions.

8
II. Sample
Private firms are generally not subject to the SEC’s disclosure requirements. Therefore,
information on their financials and the nature of their banking relationships is limited, making it difficult
to conduct an analysis on the determinants of banking relationships and liquidity management for a large
sample of private firms.
In this paper, we circumvent these data limitations by focusing on two major corporate events
around which SEC requires private firms (or their acquirers) to publicly disclose their financial statements
and (in most cases) sources of liquidity. First, SEC requires public acquirers file a proxy statement that
discloses detailed information about their target firms if the transaction value is more than 10 percent of
the acquirer’s assets (if the transaction is material by SEC standards). Using these filings we obtain
information on private acquired firm’s bank relationships and financial characteristics. Second, SEC
requires private firms going public to file a prospectus that includes all material information that may
affect the valuation of the IPO. Those proxy statements and IPO prospectuses serve as our main source of
information on the financials, valuations, and banking relationships of private firms. In other words, our
private firm sample consists of private firms that either were acquired by a public firm (i.e., private
acquired or M&A firms) or completed an initial public offering (i.e., IPO firms).
II. A. Private Acquired Firm Sample
We begin the construction of our private acquired firm sample by downloading a list of
acquisitions of stand-alone private industrial U.S. firms by public U.S. firms during the period 1995 to
2004 from the Security Data Company’s Domestic Mergers & Acquisitions database.12 We refer to these
firms as private acquired or M&A firms. We focus only on stand-alone private firms because bank
lending to subsidiaries may be based on the parents’ guarantees rather than the financial strength of the
subsidiaries. Then, we exclude acquired firms where the transaction value is less than 10 percent of the
bidder’s assets (i.e., immaterial transactions with no SEC disclosure requirements). Also, in order to avoid
dealing with issues about control premiums, we exclude deals if the bidder purchases less than 50 percent
of the target firm and if the bidder’s post-deal ownership stake is less than 100 percent. For the remaining
acquisitions, we search the SEC’s Electronic Data Gathering and Retrieval (EDGAR) system for the
bidder’s S-4, 8-K, 10-K, and 10-Q filings. If the bidder fails to report the historical financial statements of
the target or information about the target’s debt structure prior to the acquisition, we drop the transaction
from our sample. The final private acquisition sample consists of 816 deals.
12 We start the sample in 1995 because electronic copies of proxy statements from which we obtain informationabout target firm’s financials have become available on EDGAR since 1995.

9
For private acquired firms, we collect information on deal values from SDC. Also, using proxy
statements filed by the acquirers we obtain information on the age and historical financials of the target
firms as well as the type (e.g., bank lines of credit) and the amount of debt securities held by each target
firm at the time of the transaction. Finally, we use VentureXpert to identify target firms backed by a
venture capital firm.
II. B. IPO Sample
We use Jay Ritter’s IPO database to identify IPOs completed by industrial U.S. firms between
1996 and 2004. As is standard in the IPO literature, we exclude unit offers, spinoffs, and IPOs of firms
with pre-IPO sales less than a million dollars. The final IPO sample consists of 1,350 deals. Information
on IPO date, offer price, venture capital backing, and firm age are from Jay Ritter’s IPO database.
We obtain pre-IPO firm financials from Compustat. Also, for each IPO firm we search the final
IPO prospectus (form 424B) to hand collect information on the type and amount (both principal and
outstanding) of bank credit.
II. C. Public Firm Sample
We use Amir Sufi’s bank line of credit data for public firms (that we refer to as Sufi’s panel data)
to examine the determinants and value of banking relationships for public firms and compare our results
to the results based on the private firm sample. In order to identify non-financial U.S. public firms with a
line of credit, Sufi (2009) searches the annual 10-K SEC filings of Compustat firms that have non-missing
information on key financial characteristics (such as assets, cash flows, share prices etc.) and have
leverage between 0 and 1 for at least 4 consecutive years. Sufi focuses on the 1995 to 2003 period. His
final sample consists of 4,503 firms (28,447 firm-year observations).
We also match Sufi’s sample to CRSP to identify firms that were delisted from CRSP files due to
a merger (delisting codes 200-299). We call this sample public acquired firms and use it as one
benchmark to private acquired firms to examine the differences between the determinants and value of
banking relationships for private and public firms. Since our private firm sample is cross-sectional (i.e.,
one observation per firm), using the cross-sectional public acquisition sample facilitates the comparison
of coefficients of interest for public and private firms. Note that in some of our analysis we also use Sufi’s
entire panel data and a subset of the panel that consists of 300 firms with non-missing information on the
unused portion of line of credit. As discussed later, whether we based our comparisons on the public
acquired firm sample, Sufi’s sample of 4503 public firms or his panel of 300 public firms makes very
little difference for our main findings.

10
II.D. Sample Selection Issues
In this paper we examine the banking relationships of IPO and private acquired firms to draw
general conclusions, where possible, about the determinants and value of banking relationships for all
private firms. As stated before, we focus on this sub-sample as it allows us to circumvent data limitations
on the financial characteristics, banking relationships, and perhaps most importantly valuation of privately
held firms. Nevertheless, using this sample may raise several concerns about the generality of our
findings.
First, private firms in our sample are larger than the average firm in the broader private firm
universe and larger firms are typically less credit constrained. Therefore, relative to other private firms,
our sample firms are more likely to have access to a bank line of credit and arguably their banking
relationships are less sensitive to changes in credit conditions. Consequently, results based on this sample
may provide a lower bound estimate for the credit market sensitivities of the broader universe of private
firms. Nevertheless, one advantage of focusing on larger private firms that look a lot more like publicly
traded firms, as we do, is that we are able partial out an important portion of the credit quality differences
between public and private firms and thus obtain a cleaner estimate of the affect of access to capital
markets on access to bank credit and the value of banking relationships.
Second, banks may provide a bridge financing to IPO and acquired firms by relying on
transaction proceeds rather than operating cash flows as the primary source of repayment. To address this
concern, we focus on access to bank lines of credit rather than any bank credit, since lines of credit are
formalization of banking relationships and less likely to be transaction driven or reflect bridge lending.
Also, we present evidence later in the paper that access to bank credit is positively related to measures of
firm credit quality and in fact the relationship is stronger for our private firms than for public firms, which
suggests that bank lending to our sample private firms is not entirely transaction driven. Finally, in order
to explore whether bridge lending in the form of lines of credit is an important phenomenon for our
private firms, we examine a sub-sample of 766 IPO firms for which we have information on banking
relationships two years before their IPO. Using this sample, we find that only 11.2 percent of IPO firms
without a line of credit two years before the IPO obtained a line immediately before the completion of the
IPO. This suggests that bridge lending via lines of credit is not an important phenomenon for our private
firms.
Third, the volume of IPOs and acquisitions varies inversely with the tightness of credit market
conditions and consequently the types of firms that enter the sample in tight vs. loose credit markets may
be different. For example as shown in Figure 1, the volume of IPO and acquisition activity declines when
credit market conditions tighten (as measured by credit spreads). Therefore, to the extent that we measure
credit risk and other factors that affect access to bank lines with error, and those characteristics are

11
correlated with the timing of the transaction and credit conditions, our regression models will be subject
to an identification problem. As we discuss in detail later, this identification problem is likely to lead to
an underestimate of sensitivity of private firms’ access to bank credit to credit conditions (since younger
less profitable firms are less likely to have banking relationships but are more likely to go public or be
acquired in Hot M&A and IPO markets). We address this issue and obtain cleaner identification by
including in our regressions year dummies.13 Moreover, as discussed below, to minimize the impact of
unobserved heterogeneities in firm characteristics when estimating the value of banking relationships, we
match private firms with banking relationships to private firms without relationships that undertake IPOs
or are acquired at roughly the same point in time.
Finally, sample selection may be an important concern when examining the value of banking
relationships for private firms. In particular, while banking relationships may be valuable to private firms
generally, purchasers of private companies or investors in IPOs may place little value on the existence of
banking relationships because the acquisition or IPO transaction reduces the need for bank provided
liquidity. In other words, purchasers or investors may not pay for what they might not need—the selling
firm’s banking relationships. Therefore, our data might not be suitable to examine the liquidity benefits of
banking relationships for private firms. Arguably, our sample is more suitable for examining the
certification value of bank lending. The idea is if bank lending to private firms is based on “soft”
proprietary information, then having a line of credit should be associated with higher transaction values.
III. Summary Statistics
Before describing our findings, several explanations about variable definitions are in order. First,
because our focus is on bank provided liquidity, we scale cash flows, tangible assets, net worth, and
market value of assets by non-cash book assets. We do this because firms are likely to determine their
cash holdings and line of credit usage jointly (see Sufi (2009)). As we show later in the paper, firms
without a line of credit tend to hold more cash. This joint determination leads to a mechanical negative
correlation between any measure scaled by total assets and the availability and use of lines of credit. A
disadvantage of using non-cash assets instead of total assets to scale financial variables is that it can lead
to extreme outliers. Therefore, we winsorize all financial ratios (as well as Altman’s z-score and cash
flow volatility measure) at the 1st and 99th percentile to reduce the influence of outliers 14 Also, to reduce
the potential influence of thick left tails, if the ratio of cash flows or net worth to cash adjusted assets is
less than -1 we set these ratios equal to -1. Second, while we use the date of incorporation to compute the
13 We obtain similar results when we include controls for the volume of IPO and acquisition activity (not tabulated).14 We follow Sufi (2009) and calculate Altman’s z-score excluding leverage because leverage is mechanicallyrelated to the usage of lines of credit.

12
age of private firms, we use the first year with Compustat data to compute the age of public acquired
firms. Thus, the ages of public and private acquired firms are not comparable.
Table 1 provides summary statistics for the firms in our sample. Panel A of Table 1 contains
summary statistics for private acquired firms (left panel), IPOs (middle panel). For comparison the right
most panels includes summary statistics for public acquired firms. We compare our private acquired firms
to public acquired firms to mitigate concerns that differences in private and public firm characteristics
may be because we condition the private firm sample on an acquisition. However, the differences we
observe between private firms and public acquired firms are also present if we compare private firms to
all of the public firms in Sufi’s data, so conditioning the public firm sample on an acquisition does not
really matter.
Overall we find only about two-thirds of the IPO and private acquisition firms have access to a
bank line of credit. By comparison 84.2% of public acquired firms have a bank line of credit (which is
about the same frequency as 82% for all public firms in Sufi’s data). The difference (significant at the 1%
level) is not surprising because public acquired firms, on average, are older, have better operating
performance, and subject to the SEC’s disclosure requirements, making them less likely to suffer from
adverse selection problems than private acquired firms and IPO firms. Specifically, as shown in Table 1,
based on means, public acquired firms have higher cash flows, net worth, current ratio, and z-score than
private firms. Moreover, public acquired firms have fewer growth options (measured by industry median
market-to-book), lower leverage, and more stable cash flows. These differences suggest that when
examining how access to capital markets is related to the availability of bank credit it will be important to
control for the financial characteristics of borrowers.
We next examine whether private firms make up for the relatively limited availability of bank
lines of credit by holding more cash and using more extensively (presumably) expensive trade credit—
short-term financing that some suppliers provide for their goods and services. To measure the extent to
which firms use trade credit, we calculate how long it takes the firm to pay its suppliers. In particular,
following Petersen and Rajan (1994), we define the days payable outstanding (DPO) for each firm as 365
times the firm’s accounts payable over its cost of goods sold.15 The longer the DPO the more extensively
the firm uses trade credit. As shown in Panel A of Table 1, private firms rely more on (presumably)
expensive trade credit than public firms, as indicated by their higher average DPO. The evidence also
15 Smith (1987) notes that some firms in the retail business get a 2% discount if they make a payment to theirsuppliers within 10 days of the purchase, but they pay the full amount between days 10 and 30. Rajan and Petersen(1994) note that, by taking the early payment discount, the firm borrows at 2.04% (=2/98) per 20-day period. This isequivalent to an annual rate of 44.6% (= [1.0204] (365/20) – 1]). Of course, once the discount period expires theinterest cost of trade credit may be significantly lower. However, firms “riding the trade” for more than 30 days mayincur other costs such as delivery delays.

13
suggests that private acquired firms and especially IPO firms tend to hold more cash than their public
counterparts; however, the differences are not statistically significant at conventional levels.
We also examine the ways private firms manage their liquidity. We find that private acquired
firms are 5.4% less likely to have bank debt (64.1% vs. 69.5%) and 5.9% (60.8% vs. 66.7%) less likely to
have a bank line of credit than IPO firms. The differences are statistically significant at the 5% and 1%
levels, respectively. One reason why private acquired firms may be less likely to have banking
relationships is that they are younger and smaller than IPO firms. Also, IPO firms have higher growth
opportunities (as measured by the industry market-to-book) and capital expenditures but lower internal
cash flows than private acquisitions, and therefore they tend to rely more on external debt financing. In
fact, IPO firms are not only more likely to have bank lines of credit than private acquired firms, but they
also are significantly more likely to have VC financing and to use trade credit (based on median DPOs).
Moreover, IPO firms do not seem to use lines of credit as cash substitutes since they also hold more cash
relative to assets than private acquired firms.
To shed some light on the firm-specific factors that influence the existence of banking
relationships, we examine univariate differences in firm characteristics based on whether or not the firm
has a line of credit, as shown in panels B and C of Table 1. As discussed earlier, we focus on lines of
credit rather than the existence of any bank lending because lines of credit are more likely to represent
relationship based lending. Moreover, lines of credit are a potential source of ongoing liquidity while term
lending is likely to be associated with a one-off transaction. However, given the degree of overlap (of the
1,461 firms with any banking relationship 87.3% have a line of credit), our results are not sensitive to
whether we define relationships broadly to include any bank loan outstanding.
As shown, the differences between firms with and without banking relationships are similar
among private and public firms. In particular, we find that both private and public firms with banking
relationships are older, larger, have higher z-scores (indicating lower default likelihood) as well as higher
and more stable cash flows, hold less cash, and are less likely to rely on trade credit. We also find that
firms in high growth industries are less likely to have banking relationships. These findings are consistent
with the findings of Sufi (2009) and Gonzales and James (2007) that examine the determinants of banking
relationships for public firms and IPO firms, respectively. Overall, the evidence suggests that firms with
better credit quality and those that are less likely to suffer from agency and adverse selection problems are
more likely to use bank credit as a source of liquidity. The evidence also suggests that firms without
banking relationships utilize alternative sources of liquidity such as cash holdings, trade credit, and VC
financing (in the case of private firms).16
16 This finding is consistent with the Carey, Post, and Sharpe’s (1998) argument that less creditworthy private firmsborrow from non-bank financial intermediaries such as finance companies or rely on trade credit.

14
Our finding that firms without banking relationships use more trade credit is consistent with
Petersen and Rajan’s (1994) findings for very small private firms. They argue that the more extensive use
of trade credit is evidence of credit rationing that limits small firms’ ability to exploit investment
opportunities. We examine this issue in more detail as well as its potential impact on valuation multiples
later in the paper.
We also examine whether credit market conditions are related to the likelihood of having a bank
line of credit, line usage, cash holdings, and trade credit use. We use three measures of credit market
conditions. First, following Officer (2007), we define commercial and industrial (C&I) loan spreads as 4-
quarter moving average of the difference between the C&I loan rate and federal funds rate at the time of
the transaction. We assume that the higher the C&I loan spreads the tighter the credit market conditions.
Second, we examine the net percentage of banks tightening lending standards (according to the Federal
Reserve Bank’s Loan Officer Surveys) in the transaction year. Finally, following Gatev and Strahan
(2006) we use the 3-month paper-bill spread to measure the cost of market provided liquidity. Gatev and
Strahan argue that the paper-bill spread is a measure of market provided liquidity. They show that
historically, bank funding costs decrease when market liquidity becomes scarce (due to re-intermediation
caused by a flight to quality). Thus higher paper-bill spreads may result in public firms relying more on
their lines of credit as a source of liquidity.
Table 2 provides summary statistics concerning cash holdings, access to lines of credit, line
usage, and trade credit for firms in our sample grouped by whether credit conditions are tight or loose. We
define tight and loose by whether in a given year the credit market measure is above or below its sample
median. Since the results are similar whether we use C&I loan spreads or bank lending standards to
measure credit market conditions we only report statistics based on lending standards. As shown in panel
A, private firms hold significantly more cash and rely less on lines of credit when lending standards are
tight. The decline in reliance on lines of credit arises, in part, from a smaller percentage of private firms
having access to bank lines of credit. As shown, the proportion of private firms with lines of credit
declines from 69% to 59% when bank lending standards are tight (the difference is statistically significant
at the 1% level). As mentioned earlier, this finding is consistent with the survey findings of CGGH that
during the current crisis private firms were more likely to have difficulty renewing or initiating lines of
credit.
As shown, the ratio of unused line amount to the total line amount does not change significantly
between tight and loose credit market conditions—suggesting that the firms with lines of credit do not
increase their use when credit market conditions are tight.

15
While fewer private firms have lines of credit when bank lending standards are stringent, trade
credit use is positively related to bank lending standards. For example, the average DPO increases from
just under 90 days when lending standards are loose to over 140 days when lending standards are tight.
The increase in the use of relatively expensive trade credit is consistent with the argument that reduction
in the availability of bank credit is due to reduction in bank loan supply to private firms rather than a
decrease in the demand for credit. One potential explanation for the reduction in the availability of bank
credit is that the credit risk of private firms is disproportionately affected by the same economic factors
that lead bankers to tighten lending standards. Moreover, since a firm’s suppliers may, in the event of
default, have an advantage salvaging value from borrowing firms assets (see Petersen and Rajan (1997)),
the shift to trade credit may reflect an increase in the credit risk (and trade creditors comparative
advantage in lending to high risk customers). We examine this issue in the next section by analyzing the
determinants of lines of credit in a multivariate context.
While changes in bank lending standards and loan spreads have a significant impact on the
sources of liquidity used by private firms, changes in the relative cost of market provided liquidity (as
measured by the paper-bill spread) have no significant impact on their cash holdings, line of credit or
trade credit use. This result is perhaps not surprising given that none of the private firms in our sample
have commercial paper outstanding.
Turning to public acquired firms, we find no significant differences in cash holdings, line of
credit or trade credit use between periods of tight and loose bank lending standards. In contrast to private
firms, however, we find that public firms slightly reduce their trade credit use when lending standards are
tighter.
Note that for both the private and public M&A samples, we have only cross-sectional data. As a
result, we cannot observe, for a fixed set of firms, how access and use of lines of credit varies with credit
market conditions.17 However, for 300 public firms in Sufi’s panel we have information on used, unused,
and total amount of bank lines of credit for the 1996 to 2003 period. As shown in Panel C, we find that
public firms rely more heavily on bank lines of credit as a source of liquidity when paper-bill spreads
widen. Consistent with public firms substituting bank lending for direct market borrowing, the proportion
of lines of credit that are unused declines significantly when paper-bill spreads are higher. Public firms
also draw down their cash balances when market liquidity is relatively expensive. As shown in Panel B,
we observe a similar pattern for the sub-sample of public acquired firms (though only the cash holdings
vary significantly with credit market conditions). Overall, these findings are consistent with those of
17 This is a problem that arises in other studies of banking relationships of private firms based on survey data (suchas NBSSF data). One advantage of our data over NBSSF data is that our data is not limited to a particular point intime, so that we can observe how banking relationships vary with credit market conditions.

16
Gatev and Strahan (2006) who find that aggregate borrowing under lines of credit increases when paper-
bill spreads widen.
A univariate comparison of the proportion of firms with access to bank credit by the tightness of
credit market conditions may be misleading. For example, if tight credit conditions coincide with “cold”
IPO and M&A markets and firms that go public or are acquired in cold markets have characteristics that
make them less likely to have banking relationships, we might be overstating the effect of credit market
conditions on access to bank lines of credit. However, differences in the types of firms undertaking IPOs
and M&As is likely to lead us to understate the effect of credit market conditions on the availability of
lines of credit to private firms. For example, in the “hot” IPO market of the late 1990s and of 2000 (that
coincided with loose credit market conditions), the average firm going public was younger and had lower
cash flows than firms that went public in the “cold” IPO market of the 2001 to 2004 period. For example,
the average age of firms going public during 2000 was 5.3 years, while in 2003 the average firm going
public was 10.1 years old. Similar patterns exist in the private M&A sample. As discussed in more detail
later, when we control for firm characteristics and the liquidity of IPO and M&A markets, we still find
significant differences in private firms’ cash holdings, access to lines of credit, and trade credit use in
tight versus loose credit markets.
The differences in the impact of changes in bank lending standards on private versus public firms
coupled with private firms’ increased use of trade credit when bank lending standards are more stringent
suggests a decrease in the supply of bank credit to private firms when lending standards are tight. Access
to public markets and transparency (and perhaps other factors that are correlated with public ownership)
appear to insulate public firms from changes in bank lending standards. To examine whether these
differences result from observable differences in the credit risk of public versus private firms, we conduct,
in the next section, a multivariate analysis of the determinants of lines of credit.
IV. How Do Private Firms Manage Their Liquidity?
IV.A. Determinants of Line of Credits
In a recent paper, Sufi (2009) finds that firm cash flows are a critical determinant of whether
firms use lines of credit (as opposed to cash) to absorb liquidity shocks. The contingent nature of bank
credit lines, which arise from the use of cash flow based covenants, make them a poor source of liquidity
for firms with low current or expected future cash flows.18 One potential explanation for our finding that
private firms are more sensitive to changes in bank lending standards is that changes in bank lending
standards are correlated with borrower cash flows (and credit risk generally) and private firms have, on
average, lower cash flows. In addition, to the extent that private borrowers are viewed as riskier, they may
18 Shockley and Thakor (1997) make a similar point.

17
be subject to more restrictive covenants, which, in turn, makes lines of credit a more contingent source of
liquidity that for private firms.
Covenant information from the Dealscan database suggests that private firms have on average
more restrictive covenants associated with their loan agreements. In particular, for the 1995 to 2004
period, we obtained from Dealscan information on the covenant structure for 13,900 loan agreements
involving public firms and 2,713 loan agreements involving privately held firms. We divide financial
covenants into three groups: (1) coverage covenants (i.e., covenants limiting fixed charge or interest
expense relative to cash flows), (2) debt to cash flow covenants, and (3) liquidity covenants (i.e., current
ratio or quick ratio covenants). The percentage of loan agreements with at least one of these financial
covenants is 89% for private firms versus 84% for public firms (the difference is significant at the 1%
level). We also find that loans to private firms are more likely to contain covenants that restrict coverage
and debt to cash flows than loans to public firms.19
To investigate whether private firms are more sensitive to changes in bank lending standards due
to lower cash flows and greater credit risk we use a multivariate regression analysis. We estimate two sets
of regressions. First, we examine the likelihood of obtaining a line of credit using Probit regressions
where the dependent variable is an indicator variable that is equal to one if the firm has a line of credit;
and zero otherwise. Second, using OLS and Tobit regressions, we examine the cross-sectional variation in
the bank liquidity to total liquidity ratio. Bank liquidity equals the unused amount on the line of credit (or
total size of the line), while total liquidity equals bank liquidity plus cash. In addition to the explanatory
variables used in Sufi (2009), we also include measures of bank lending standards and credit market
conditions.
Our first set of findings, based on Probit regressions, are presented in Table 3. We present the
marginal effects of the coefficients and t-statistics based on robust standard errors (in parentheses) in the
table. Each model is estimated with a constant as well as industry fixed effects (not reported in the table).
Specifications (1) to (3) are estimated using a pooled sample of private firms, and (4) to (6) are estimated
using public acquired firms.20 We present results based on public acquired firms for comparison purposes.
19 We do not have financial information for the private firms in the Dealscan sample, so we are unable to determinewhether the difference in covenant structure arises from differences in observable risk characteristics or because ofdifferences in ownerships status.20 In unreported regressions we compare the coefficient estimates for IPO and private acquisition firms and find nodifferences. We also include in the probit estimates dummy variables for “hot” M&A and IPO markets. Hot IPOmarket equals to one if the number of firms going public relative to the number of CRSP listed firms in the dealquarter is above sample median for IPO market. Hot M &A liquidity is one if the industry’s M&A liquidity isgreater than the industry’s time series median liquidity. Industry M&A liquidity is calculated as the ratio of the sumof the market value of deals announced in the industry (defined by 2-digit SIC) in a year to the sum of the bookvalues of the firms in the industry in the same year. Including these controls has do not affect the sign orsignificance of the credit market proxies.

18
Later, we examine the relationship between bank provided liquidity and credit market conditions for
Sufi’s entire sample of public firms.
As shown in columns (1) and (2), controlling for firm financial characteristics, we find a negative
and statistically significant relationship between the likelihood of private firms having a line of credit and
C&I loan spreads or the net fraction of banks that tighten credit standards. The relationships are both
statistically and economically significant (since we obtain similar results using the C&I loan spread and
bank lending standards from now on we report only results based on lending standards). For example, a
one standard deviation increase in the tightness of bank lending standards is associated with 3.1
percentage points decline in access to bank lines of credit. Relative to the sample mean of 64.5%, this is
equivalent to a 5 percent decrease in access to bank lines of credit. Consistent with the results reported in
Table 2, we find no statistically significant relationship between the likelihood of private firms’ access to
a line of credit and the paper-bill spread.
In the regressions reported in Table 3 we control for cross-sectional differences in operating
performance and financial characteristics. As a result, the negative relationship between private firms’
access to lines of credit and bank lending standards cannot be explained by a negative correlation between
private firm operating performance or credit risk and bank lending standards. Obviously, to the extent that
our operating performance controls do not completely capture differences in credit risk, we cannot rule
out the fact that the decline in the availability of bank credit when credit standards tighten is due to an
increase in credit risk. However, as we discuss later, since bank lending standards affect private and
public firms differently, this explanation requires the omitted variables problem to be more severe for
private than for public firms.
Consistent with the univariate evidence presented in Panel B of Table 1, we find that larger and
more profitable private firms as well as private firms with larger equity cushions and fewer growth
opportunities are more likely to obtain a bank line of credit.21 Overall, the evidence is consistent with the
notion that firms with better observable credit quality and those that are less likely to suffer from adverse
selection problems are more likely to obtain bank commitments. The positive relationship between the
existence of a line of credit and measures of credit quality, and especially cash flows, suggest that banks’
decision to lend to private firms in our sample is not entirely based on expected proceeds from an IPO or
a acquisition transaction.
21 In unreported regressions, we also include firm age as an explanatory variable to examine whether mature firmsare more likely to have banking relationships. We find that firm age is positively and significantly related to theexistence of a line of credit. Since we lack information on the age of one-third of the private firms in our sample, wedo not report those regressions. Note that including age in the regressions does not affect the sign or significance ofthe other explanatory variables.

19
There are two noteworthy differences in the determinants of bank provided liquidity for private
and public firms. First, as shown in columns (4) to (6) in Table 3, the likelihood of obtaining a line of
credit is unrelated to credit market conditions for public firms. Also, the estimated coefficients for C&I
loan spreads and bank lending standards are significantly larger (at the 5 percent level) for private firms
than for public firms. One explanation for these findings is that when credit market conditions deteriorate,
banks are less interested in lending to informationally opaque firms. In particular, if the severity of moral
hazard and adverse selection problems increase as the financial condition of the borrower deteriorates,
and tighter credit standards are a response to the increase in the severity of these problems, one would
expect a decline in the availability of credit for marginal borrowers. Given that we control for operating
performance and financial characteristics, this explanation requires that these controls fail to capture
systematic differences between the credit risk of public and private firms. This might occur if a
combination of disclosure requirements, exchange listing requirements, analyst following or governance
differences leads bankers to have more confidence in the “hard” accounting information of publicly
traded firms.
An additional explanation for the results in columns (4) and (6) is that lending to private firms
relies more heavily on “soft” information and loans based on “soft” information are subject to greater
regulatory scrutiny during credit downturns. For example, Berger and Udell (2002) argue that to the
extent that relationship loans are based on “soft” information they cannot be easily justified to regulators.
As support for this argument they cite to significantly greater decline in small business lending during the
1989 to 1992 “credit crunch”. The results reported in Table 3 indicate the effect of tighter credit standards
is not limited to very small private firms (since the average assets size for private firms in our sample is
over $90 million).
A second noteworthy difference between private and public firms is that the availability of credit
is much less contingent on the level of cash flows for public firms. In particular, notice that the coefficient
estimates from regressions (4) to (6) indicate that in the sample of public acquired firms there is no
relationship between the existence of a line of credit and firm cash flows. We investigate this issue by
dividing the public M&A sample into two based on median z-score. We find, consistent with Sufi (2009),
that having a line of credit is positively related to cash flows for firms with high distress likelihood (i.e.,
below median z-scores) but unrelated to cash flows for firms with low distress likelihood. In the private
firm sample, however, both low and high z-score firms are more likely to obtain a bank line when their
cash flows are high. These findings (not reported) indicate that bank lending is a cash flow contingent
source of liquidity even among private firms with low distress likelihood.
We also estimate regressions (4) and (6) using Sufi’s entire sample of public firms, clustering
standard errors by firm. While we do not present those results in a table to conserve space, we find that

20
the likelihood of having a bank line is negatively (positively) and significantly related to bank lending
standards (the paper-bill spread). While the point estimates for the credit condition variables are almost
identical in the public acquisition and the panel samples, the estimates are statistically significant in the
panel but not in the cross-section. This is arguably because panel regressions provide more precise
estimates of time series variables such as lending standards and the paper-bill spread.22
Regardless of the significance levels in various public firm samples, the coefficient estimate for
lending standards is significantly larger for private firms than for public firms, suggesting private firms’
access to bank credit is more sensitive to bank lending standards. In contrast, public firm access to lines of
credit appears to be more sensitive to the paper bill-spread than private firm access, which suggests that
public firms are better able to exploit pricing differences in intermediated vs. market lending.
Alternatively, of course, banks expand credit supply when the paper-bill spread increases (as suggested by
Gatev and Strahan (2006), due to increases in bank deposits) and public firms benefit more from this
expansion since they are more transparent and have better credit quality, on average, than their private
counterparts.
IV.B. Line of Credit vs. Cash Utilization
In this section we investigate whether credit conditions affect the utilization of credit lines for
firms with bank lines of credit. In particular, we examine whether the proportion of bank provided
liquidity to total liquidity (which we refer to as the bank liquidity ratio) is related to changes in credit
conditions. Bank liquidity equals either the unused or total amount on the line of credit, while total
liquidity equals bank provided liquidity plus cash. We do not have information on the unused portion of
bank lines of credit for public acquired firms, but for 300 public firms in Sufi’s panel we have
information on used, unused, and total amount of bank lines of credit for the 1996 to 2003 period.
Therefore, in this section, we compare the results for the private firm sample to this public firm panel
rather than the public M&A sample.
Bank liquidity ratio equals zero for firms with no bank lines of credit. Therefore, the variable is
left truncated. To deal with the truncation of the dependent variable, we estimate one-sided Tobit
regressions when using all firms and OLS regressions when using only firms with a line of credit. Our
findings are presented in Table 4. Note that while we estimate the regressions in Table 4 using all of the
explanatory variables used in Table 3, we only report coefficient estimates and t-statistics for credit
condition variables.
22 We also randomly draw a cross-sectional sample with 4,503 observations (one observation per firm) from Sufi’spanel data, and estimate regressions (4) and (6). We find that having a bank line is positively and significantlyrelated to the paper-bill spread but unrelated to bank lending standards.

21
As shown in Panel A, we find that private firms rely more on cash and less on unused bank
commitments when bank lending standards are tight. However, for the sample of private firms with
lending relationships, the ratio of bank liquidity to the total liquidity does not change significantly
between tight and loose credit market conditions. Thus, the decline in bank supplied liquidity for private
firms in tight markets appears to be driven entirely by a reduction in access to lines of credit as opposed to
a reduction in the usage or size of credit lines.
The opposite story seems to be true for public firms. As shown in Panel B, for public firms, the
unused amount of the line of credit and the total line relative to total liquidity declines when bank lending
standards are tight (although the t statistic is only around -1.60). However, lending standards are unrelated
to the availability of a line of credit for the same group of firms (not reported). The two pieces of
evidence taken together suggest that either banks limit the size of the credit facilities to public firms rather
than entirely denying credit during tight credit conditions or alternatively when bank lending standards
become too stringent, public firms turn to other external financing options and reduce the size of their
lines. For example, Gilson and Warner (1998) argue that to preserve financial flexibility public firms
issue junk bonds and use the proceeds to pay down their bank debt.
Table 4 also presents evidence on the relationship between the utilization of bank lines and the
paper-bill spread. As shown, for both private and public firms, bank liquidity is positively related to the
spread, consistent with the finding in Gatev and Strahan (2006) that banks expand credit supply when the
spread increases. Note that the relationship is statistically and economically much stronger in the public
firm sample. One reason for this may be that the demand for bank credit is positively related to CP
spreads. This may occur if public firms switch from borrowing in the commercial paper market to
borrowing from banks when CP spreads widen (Gatev and Strahan (2006)). Since none of our private
firms use the commercial paper market, the positive relationship between their bank line usage and the
spread is unlikely to have this demand component.
IV.C. Trade Credit Use
Trade credit is generally viewed as an expensive substitute for bank credit (see, for example,
Petersen and Rajan (1994) and more recently Nilsen (2002)). When banks tighten their lending standards,
private firms may have to switch to less attractive trade credit because private firms have more limited
alternative funding sources. Greater reliance on trade credit during tight credit market conditions may also
arise from a firm’s vendors having a comparative advantage in lending to riskier more opaque firms. As
Petersen and Rajan (1997) this advantage may arise because vendors are better positioned to spot industry
trends or because vendors may better able liquidate assets (such as inventory) in the event of default.
These arguments suggest that for private firms the use of trade credit will be more sensitive to bank

22
lending standards than for public firms. We investigate this issue by examining the determinants of DPO,
our measure of trade credit used.
In this analysis, we examine the relationship between DPO and the same firm characteristics and
credit market conditions proxies we used to explain the use of bank lines of credit.23 To account for the
skewness of DPO, we use its natural logarithm as our dependent variable. Our findings are reported in
Table 5. Note that, in contrast to our finding concerning the availability of bank lines of credit, we find
that DPO is negatively related to firm cash flows. More importantly, we find that when banks tighten
credit standards the use of trade credit increases significantly. Furthermore, we find that only private
firms without access to a line of credit increase trade credit use in tight credit markets. This result
suggests that trade credit use increases when banks are likely to be rationing credit. Finally, the increase
in cash holdings (as shown in Table 2) together with the increase use of trade credit suggests that firms
without lines of credit use trade credit as a way of raising cash to hoard.
For public firms (not reported) we find that the use of trade credit is also negatively related to
cash flows. However, for public firms we find no significant relationship between trade credit use and
bank lending standards. Also, there is no evidence that public firms without lines of credit during tight
credit markets increase their trade credit use (in fact, we find just the opposite). Overall these results
together with those reported in Table 5 suggest a differential impact of changes in lending standards on
the financial policies of public and private firms.
V. Banking Relationships and Firm Value
V.A. Theoretical Background
In this section we examine the relationship between capital market access, credit market
conditions, and the value of banking relationships. There are several reasons to suspect that banking
relationships are associated with higher valuations for private firms. First, banks make lending decisions
partly based on “soft” proprietary information on the riskiness and future prospects of potential
borrowers. Therefore, bank lending may provide a signal of or serve to certify firm quality.24 In other
words, outside investors may not be able to observe the “soft” information, but given observable firm
characteristics, observing that a firm has a line of credit they may infer that the bank’s proprietary
information is favorable. To the extent that the importance of “soft” information in lending decisions
depends on the size and maturity of the firm, the certification effect of bank lending will be more
23 Our results remain unchanged when we include cash/assets as an explanatory variable.24 James and Wier (1990) provide a model that illustrates how the existence of a banking relationship can reduceinvestor uncertainty concerning firm value, which in turn leads to less IPO underpricing. Consistent with thisargument, they find that underpricing is significantly less for firms with prior banking relationships.

23
important for relatively small and young firms. An observationally equivalent story is that firms with
banking relationships may fetch higher valuation multiples because acquirers or investment bankers,
during their due diligence, may observe the same information the bankers observed when making lending
decisions. Thus it’s not the banking relationship per se, but the information that the bankers observed
when sorting borrowers that is associated with higher valuations.
Second, bank lines of credit may be positively related to private firm valuations if bank-provided
liquidity helps limit the disruptive effects of negative cash flow shocks (see Holmstrom and Tirole (1997)
and Boot, Thakor, and Udell (1987)). However, to the extent that borrowing under the line of credit is
made contingent on cash flows by the use of cash flow based covenants (see Sufi (2009)), bank lines may
have limited value as insurance against liquidity shocks. Moreover, even if bank provided liquidity is
valuable to a private firm before a acquisition or an IPO transaction, investors may not pay for the firm’s
banking relationships if the transaction reduces the need for bank financing by providing the firm access
to alternative sources of financing.
Petersen and Rajan (1994) suggest a third way through which access to lines of credit may affect
private firm valuations. They argue that, when deciding how to finance their investment projects, private
firms follow a pecking order based on the relative costs of alternative sources of funding. In particular,
firms first use internally generated cash, then institutional (e.g., bank) credit, and finally trade credit.
Therefore, by increasing available institutional credit and lowering the firm’s cost of capital, bank lines of
credit may allow the firm to move further down the investment opportunity set than a comparable firm
without access to a bank line of credit. Consequently, by reducing the availability and value of unrealized
growth options, bank lines may be associated with lower transaction multiples. However, bank lines of
credit may be positively related to valuation multiples since firms with bank lines are likely to have
relatively higher operating profit margins and lower cost of capital than firms without bank lines, as
findings in Tables 1 and 2 suggest. As a result, the net impact on valuation multiples of access to lines of
credit is uncertain.
To see these potentially conflicting effects, consider the determinants of the enterprise value-to-
sales multiple for a stable growth firm with fixed investment of I.25 It is easy to show that:
grIg
SP
o
)1(
25 The assumptions of stable growth and fixed investment spending are for illustration purposes. Obviously, IPO andacquisition firms are not likely to be stable growth firms. In this case, the enterprise value to sales ratio will alsodepend on near-term growth in operating earnings as well as investment spending. However, it is easy to show thatthe same potentially conflicting effects of access to bank provided liquidity exist when these assumptions arerelaxed.

24
Where P is price per share, So is sales per share, ∏ is after-tax operating profit margin, r is the cost of
capital, and g is the growth rate of free cash flows.
Note that since our sample is limited to firms engaged in capital market transactions, valuation
ratios may not reflect differences in the cost of capital based on whether or not the firm had a banking
relationship in the past. However, to the extent that banking relationships affect the cost and availability
of credit in the past, we should expect differences in expected future growth rates in free cash flows,
operating profit margins, and investment spending. While we can use information from the firm’s
financials to control for differences in operating margins and investment spending, future expected
growth is unobservable and likely to be negatively correlated with whether the firm has a banking
relationship.
V.B. Raw Valuation Multiples
Our approach is to investigate whether acquirers of private firms and IPO investors pay more
(i.e., higher enterprise value multiples) for firms with bank lines of credit. We analyze three different
valuation multiples: enterprise value-to-sales, enterprise value-to-operating cash flows, and enterprise
value-to-book value. Enterprise value equals the market value of equity (calculated based on the final
offer price of either the acquisition or the IPO transaction) plus the book value of debt, minus cash. Sales,
operating cash flows, and book value are based on the last annual financials reported before the
completion of the transaction. We set the value of a multiple to missing if the denominator is negative or
zero. To reduce the effect of outliers, similar to Kim and Ritter (1999), we set the value of sales and book
value (operating cash flow) multiples to 10 (100) if greater than 10 (100).
Valuation multiples for the private firms in our sample are presented in Table 6. Raw multiples
are difficult to interpret because multiples reflect value relevant differences in the characteristics of firms
with and without banking relationships. For example, we find that both IPO and acquisition firms without
banking relationships obtain higher sales and cash flow multiples than firms with banking relationships.
This is potentially because the observable factors that negatively influence the likelihood of obtaining a
bank line of credit are likely to be positively correlated with valuation multiples. In particular, small,
young, and high growth firms are less likely to have banking relationships, as shown in Tables 1 and 2,
but generally obtain higher valuation multiples because of high expected growth in their current sales and
earnings. Therefore, in order to calculate the effect of banking relationships on valuation multiples, we
need to control for other value relevant factors that are correlated with the existence of banking
relationships. We describe our empirical approach in the next section.
V. C. Empirical Approach

25
V.C.1 Comparable Industry Transaction Approach
We first examine the valuation effect of banking relationships by comparing the valuation
multiples of private firms with banking relationships to the multiples of comparable private firms without
banking relationships. Specifically, for each private firm with a line of credit (i.e., sample firm) we find a
portfolio of comparable private firms that (1) do not have a line of credit; (2) complete a similar
transaction (an IPO or are acquired) within the three-calendar year window centered on the effective
transaction date of the sample firm; (3) are in the same industry (based on three-digit SIC code) as the
sample firm; and (4) have sales within 25% of that of the sample firm. The choice of industry, size and
timing criteria used in the matching algorithm is somewhat arbitrary and reflects our attempts to find the
best possible comparable firms while maintaining a reasonable sample size. We discuss later how sample
size and valuations vary with different matching criteria.
Our comparable firm methodology relies on the assumption that the only systematic value
relevant difference between the sample and comparable firms is the existence of banking relationships.
Also, a disadvantage of this approach is that our sample is reduced substantially because the number of
firms with suitable comparables is limited. To overcome this problem, we allow a control firm to match
with multiple sample firms, or in other words, we match with replacement of comparable firms. For
example, in matching sample firms to control firms using the enterprise value-to-sales multiple, the
median control firm is matched with four sample firms, with the 10th percentile being one match and the
90th percentile being thirteen matches. Thus, the matching algorithm that we use does not pick up a small
subsample of firms without a line of credit as comparables. There are 544 sample firms with at least one
comparable firm, and the median comparable firm portfolio contains four comparables.
We compute a line of credit premium for each firm with a line of credit by subtracting the natural
logarithm of the median valuation multiple for the comparable firm portfolio from the natural logarithm
of the valuation multiple for the sample firm. Table 7 reports descriptive statistics for the line of credit
premium. As in Officer (2007), we calculate the equal-weighted average of the premiums based on sales,
operating cash flow, and book value multiples. Because valuation multiples are significantly higher for
IPO firms, we report the premiums separately for private acquisition and IPO firms. As shown in Table 7,
we find that the mean and median line of credit premiums for the private acquisition (IPO) firms are
26.5% (1.4%) and 16.2% (2.5%), respectively. The premiums are significantly different from zero for the
private acquired firms but indistinguishable from zero for IPO firms.26 The evidence suggests that private
acquisition firms that have a line of credit are more highly valued by outside investors but IPO firms with
26 We also compute the line of credit premiums based on sales, operating cash flows, and book value multiplesseparately. The mean line of credit premiums based on sales, operating cash flows, and book value multiples for theprivate acquisition (IPO) firms are 15.5%, 30.0%, and 28.2% (-6.2%, 9.3%, and -3.9%), respectively. Thepremiums are significantly different from zero only for acquisition firms.

26
lines of credit are not. As discussed later, this may be because IPO firms are on average older and larger
than firms in the acquired firm sample.
We tried several alternative algorithms to see if the size and significance of the valuation
premium associated with the existence of line of credit is sensitive to our matching algorithm. For
example we tried matching firms based on 2- or 4-digit SIC codes rather than 3-digit. In the acquisition
sample, the mean premium increases when we use finer industry classifications. As shown in Table 8, the
mean premium increases from 22.8% to 36.7% when we match based on 4- instead of 2-digit SIC codes.
In the IPO sample, the premium is not sensitive to using alternative industry classifications.
Given the concern, discussed earlier, that credit market conditions may affect the type of firm that
enters our sample we also restricted matches to be within one year of the sample firm. This restriction
obviously reduces sample size substantially. However, as shown in Table 8, when we match based on
three digit SIC code, with sales within 25% and transactions within one year of the sample firm we find
valuation premiums that are similar to using broader matching criterion. Overall our results are not very
sensitive to the matching criteria that we employ.
We also investigate the cross-sectional determinants of the line of credit valuation premium using
OLS regressions. We model the line of credit premium as function of firm age, size, cash flows as well as
credit market conditions. We use a pooled sample of IPO and acquired firms; however, since, as shown in
Table 6, the magnitude of the premium is significantly smaller in the IPO sample, we also include an IPO
firm indicator as an explanatory variable in all regressions. The results of this analysis are presented in
Table 9.
We first examine whether bank lines of credit are associated with higher valuation multiples. The
certification story predicts that the premium associated with banking relationships will be larger for small
and young firms whose lending decisions are more likely based on “soft” proprietary information rather
than “hard” accounting information and/or credit ratings. Consistent with this conjecture, we find that the
line of credit premium is approximately 15% higher for private firms that are below the sample median
age or sales. Moreover, we find that the premium is 25% lower (significant at the 1% level) for IPO firms.
One explanation for the lack of a significant valuation premium among IPO firms is that they are on
average larger and more mature than private acquired firms and thus bank certification is less important,
on average. Consistent with this explanation, as discussed below, we find a significant and positive
valuation premium for smaller and younger IPO firms.
We next examine whether the value of banking relationships vary with bank lending standards
when lending standards are stricter, banks may be more selective in lending and cut credit to their least
valuable clients. Thus, having a bank line of credit in tight credit markets may be interpreted a positive
signal of firm quality. Consistent with this conjecture, we find that the premium associated with bank

27
lines of credit is 15% higher when the net percentage of banks tighten their lending standards is above the
sample median.
Finally, we examine whether firm cash flows are related to the line of credit premium. Lines of
credit may allow low cash flow firms alleviate liquidity constraints and bargain more effectively for
higher transaction prices. Moreover, banks may lend to low cash flow firms only when the bank’s private
information is particularly favorable. While we find that firms with relatively low operating cash flows
have larger valuation premiums, the relationship between firm cash flows and the line of credit premium
becomes insignificant when other firm characteristics are controlled for.
A potential problem with the regressions reported in Table 9 is that the characteristics of
comparable firms without lines of credit are also likely to affect the magnitude of the line of credit
premium. However, in a regression framework, it is not possible to control for the characteristics of a
portfolio of comparable firms (since each observation is a difference between a firm and the portfolio of
matches). To address this concern, we calculate line of credit valuation premiums for subgroups of firms.
We calculate the line of credit valuation premium using the matching algorithm described above and then
create the subgroups using the sample medians. One drawback of this approach is that the number of
firms with suitable matches is low and thus our analysis is based on relatively small subsamples.
Our findings are presented in Table 10. We first compare the line of credit premiums for small vs.
large and young vs. old private firms. As shown, we find that the valuation premium associated with a
line of credit is both statistically and economically significantly higher for younger and smaller private
firms. For example, based on medians, young (small) private acquired firms receive a 68% (30%) higher
line of credit premium than old (large) private M&A firms. The differences among young vs. old and
small vs. large firms are smaller in magnitude but still statistically significant in the IPO sample as well.
Specifically, based on medians, we find that young and small IPO firms receive approximately 15% and
20% higher line of credit premiums than old and large IPO firms, respectively. Finally, we find that the
median line of credit premium is indistinguishable from zero in the sample of old and large private
acquired firms. Overall, the evidence provides strong support to the notion that bank lines serve as
certification of firm quality.
Another prediction of the certification story is that in tight credit markets where banks are more
selective and bank credit is available to relatively better quality firms, the valuation premium associated
with having a line of credit is likely to be higher. Consistent with this prediction, we find that private
acquisition and IPO firms receive approximately 46% and 6% valuation premiums, respectively, when
they have a line of credit in tight credit markets.
Besides serving as certification of quality, banking relationships may be related to firm value if
bank lines of credit protect the firm against liquidity shocks. In particular, the liquidity story predicts that

28
banking relationships will be particularly valuable for firms that have relatively lower cash flows, since
bank provided liquidity is more important when the firm is in need of liquidity. As shown in Table 10, we
find that, based on medians, the premium associated with having a banking relationship is 36% (13%)
higher for firms with low cash flows relative to firm with high cash flows in the private M&A (IPO)
sample. The differences are economically important although we find statistical significance only in the
IPO sample. Finally, we find that banking relationships are unrelated to valuation multiples in the sample
of high cash flow private firms. Overall, the evidence provides weak support to the liquidity story.
V.C.2 Instrumental Variable Regressions
One drawback of the comparable transactions methodology is that we can identify comparable
firms based only on a limited number of dimensions because of concerns about sample size. Therefore, if
the sample and comparable firms are systematically different on an uncontrolled but value relevant
dimension, the line of credit premium that we estimate will be biased. One way to deal with this problem
is to estimate multivariate regressions as described below.
In order to estimate the valuation effect of banking relationships, we need to account for
heterogeneities in the characteristics of firms with and without banking relationships. One approach to
estimate the causal effect of a selection variable (e.g., having a banking relationship) on an outcome (e.g.,
valuation) is to regress the outcome on the selection variable and all other variables that might be related
to the outcome. However, this helps the identification of the selection variable only if selection is entirely
based on observables. If the selection variable is based on some unobservable factors that are also
correlated with the outcome, then the empirical model suffers from an omitted variables problem. In such
cases, identification is possible via the use of instrumental variables estimation and quasi-natural
experiments.
In our context, the theory suggests that when lending to private firms banks are likely to rely on
both “soft” and “hard” information. Buyers of private companies observe the outcome of banks’ lending
decisions and may base their offer prices partly on the “soft” information inferred from the bank’s
decision to lend the seller.27 Therefore, “soft” information that banks use to make the lending decision is
likely to be correlated with firm value. This suggests that in OLS regressions estimating the effect of the
presence of a banking relationship on valuation, the coefficient of the banking relationship dummy is
likely to be biased since the dummy variable is likely to be correlated with the error term of the valuation
27 We cannot rule out the explanation that buyers of private companies discover “soft” positively correlated with thebank’s “soft” information during the due diligence or appraisal process rather than inferring it from the outcome ofbanks’ lending decisions.

29
equation even if other observable determinants of firm value are controlled for. Therefore, we need to
correct for potential selectivity bias in the valuation analysis.
Our approach to deal with this selectivity problem is to estimate instrumental variables
regressions (see Greene (2000)). In the first step, we estimate a Probit regression relating the likelihood of
having a bank line of credit to firm characteristics and credit market conditions. Then, we use the linear
predictors of the first step Probit model to compute the inverse Mills ratio as φ (ψ) / Φ (ψ), where φ is the
standard normal density function, Φ is the standard normal cumulative distribution function, and ψ is the
estimated linear predictor from the Probit model. The second step involves estimating (via OLS) the
determinants of enterprise value multiples. We include in the second stage regressions the Inverse Mills
ratio as a selectivity variable. Intuitively, the inverse Mills ratio provides a measure, conditional on firm
characteristics and whether the firm has a line of credit, of the lender’s “soft” information regarding firm
quality. A positive coefficient on the inverse Mills ratio implies that firms with a line of credit, on the
margin, obtain greater transaction multiples because buyers of the firm, either through their own
discovery or inferring from the firm’s banking relationships, have positive “soft” information about the
firm’s quality. 28
Table 11 provides estimates of selectivity corrected regressions for three distinct valuation
multiples. The first three regressions in the table are estimated using private acquisitions and
specifications (4) to (6) are estimated using IPO firms. We estimate selection models separately for IPO
and acquired private firms because, as shown in Table 6, IPO firms appear to be valued much higher than
acquired firms. Admittedly, it is difficult to find good instruments correlated with the likelihood of having
banking relationships and uncorrelated with firm value. Therefore, we use the non-linearity of the first
step Probit model and credit market conditions for identification of the second step valuation
regressions.29 Also, note that we estimate the second step valuation regressions with industry (one-digit
SIC codes) fixed effects to account for cross-industry variations in firm values.30
We find that the inverse Mills ratio is positive and statistically significant for all three valuation
multiples and in both the IPO and acquisition samples. The evidence suggests that private firms that have
a line of credit despite a low likelihood of obtaining one based on observable characteristics also have
28 Bharadwaj and Shivdasani (2003) use a similar approach when examining the valuation effects of bank financingin acquisitions.29 A potential problem with selectivity models in general is that the estimation results are sensitive to identificationassumptions (see Johnston and DiNardo (1997)).30 An alternative approach is to include annual industry median valuation multiples for public firms as explanatoryvariables in the second stage regressions. Using this approach, we obtain results very similar to those reported inTable 11.

30
high valuation multiples, consistent with the notion that banks make lending decisions based on “soft”
information.31
As shown in Table 11, we find no consistent pattern in the coefficient estimate for the line of
credit dummy variable. In the case of the enterprise-to-sales multiple, the coefficient is negative and
marginally significant for both the acquired firm and IPO samples. However the line of credit dummy is
insignificant or positive and significant when the other valuation multiples are used. One explanation for
the failure to find a consistent relationship between firm value and line of credit variable is, as discussed
earlier, that banking relationship may have conflicting effect on valuation multiples. For example, the
negative relationship between enterprise value-to-sales and the line of credit dummy variable may reflect
that firms with lines of credit have fewer growth options. Note that the firms are included in the enterprise
value-to-operating cash flows and enterprise value-to-book value samples only if they have either positive
earnings or positive book values. Thus, these samples have less diverse growth options (consistent with
this argument the mean enterprise value-to-sales multiple for firms with negative operating cash flows is
269.6 versus 7.1 for firms with positive operating cash flows). Overall, despite the ambiguous impact of
past banking relationships on firm value, the positive and significant coefficient on the inverse mills ratio
in all specifications suggests a positive certification effect of banking relationships on firm value.
Note that selectivity bias is of particular concern for younger and smaller private firms since soft
information is likely to be a more important component of the lending decision for these firms. Therefore,
we estimate the selectivity regressions separately for small vs. large firms using classifications based on
sample median sales (not tabulated). We find that the inverse Mills ratio is positive for all firms but
statistically significant only for small firms. The evidence supports the idea that “soft” information is
more important in lending to smaller firms in our sample.
We also investigate whether the presence of banking relationships is related to the value of public
acquired. Most public acquisitions are relatively large and mature. Therefore, lending to public sacquired
is more likely to be based on “hard” than on “soft” information. In other words, banks likely make
transaction-based rather than relationship-based lending to public acquisitions. If this contention is true
then we should find an insignificant coefficient on the inverse Mills ratio in selectivity regressions based
on the public acquisition sample. As shown in Table 12, this is exactly what we find.
VI. Conclusions
In this paper, we examine the determinants and value of banking relationships for private firms.
Overall, we find that private firms’ access to bank supplied liquidity is significantly related to credit
31 Note that we use credit market conditions as a conditioning variable in the first step regression. As a result, to theextent banks are more selective during tight credit market conditions. this is reflected in the estimated mills ratio.

31
market conditions. Moreover, we find that private firms increase their reliance on trade credit when
lending standards tighten, suggesting that that the decline in the frequency of banking relationships is not
the result of a decline in the demand for liquidity among private firms. Indeed, the significant increase in
cash holdings when credit is tight suggests that private firms’ demand for liquidity increases. Unlike most
previous studies of private firms, we are able to control for changes in firm risk characteristics thus
mitigating concerns that the decline in bank credit reflects changes in firm risk characteristics.
Our findings provide empirical support for the credit channel theory of monetary policy
transmission. Proponents of the credit channel argue that external financing frictions arising from adverse
selection and moral hazard problems give rise to an external financing premium (i.e., a difference
between the cost of raising funds externally and the cost of internally generated funds). Monetary policy
affects real activity by affecting not only the demand for credit (through changes in real interest rates) but
also through affecting the supply of credit. One way monetary policy affects the supply of credit is
through affecting the agency costs of lending. This argument suggests that credit market conditions will
have the greatest impact on less transparent and less creditworthy borrowers (where agency problems are
the most severe). Our finding concerning the differential impact of credit market conditions on private
versus public firms is consistent with the existence of a credit channel. Moreover, our results suggest that
the current credit crisis is likely to have a disproportionate effect on privately held firms.
We also investigate the valuation effect of having lending relationships for private firms using
both an instrumental variables approach and a comparable private firm transactions methodology. We
find that firms that have bank commitments have higher enterprise value multiples based on sales,
operating cash flows, and book values. The premium associated with bank lines of credit is significantly
important for young and small firms and in tight credit markets. The evidence is consistent with the
notion that banks make lending decisions based on “soft” proprietary information about firm quality.
Moreover, our results suggest that tight credit market conditions may affect private firms’ access to
funding directly (through reducing loan supply) as well as indirectly though reducing bank quality
certification.

32
References
Berger, Allen and Gregory Udell, 1995, Relationship lending and lines of credit in small firms, Journal of
Business 68, 351-382.
Berger, Allen and Gregory Udell, 2002, Small business credit availability and relationship lending: The
importance of bank organizational structure, Economic Journal 112, F32-F53.
Berger, Allen, Nathan Miller, Raghuram G. Rajan, and Jeremy Stein, 2005, Does function follow
organizational form? Evidence from the lending practices of large and small banks, Journal of
Financial Economics 76, 237–269.
Bernanke, Ben S., and Alan Blinder, 1988, Credit, money and aggregate demand, American Economic
Review 82, 901-21.
Bernanke, Ben S., and Mark L. Gertler, 1995, Inside the black box: The credit channel of monetary policy
transmission, Journal of Economic Perspectives 9, 27-48.
Bharadwaj, Anu and Anil Shivdasani, 2003, Valuation effects of bank financing in acquisitions, Journal
of Financial Economics, 67,113-148.
Black, Lamont, and Richard Rosen, 2008, The effect of monetary policy on the availability of credit: How
the credit channel works, Federal Reserve Bank of Chicago working paper.
Boot, Arnoud W., 2000, Relationship banking: what do we know?, Journal of Financial Intermediation 9,
7–25.
Boot, Arnoud W., Anjan V. Thakor, and Gregory Udell, 1987, Competition, risk neutrality and loan
commitments, Journal of Banking and Finance 11, 449-471
Carey, Mark, Mitch Post, and Steven A. Sharpe, 1998, Does corporate lending by banks and finance
companies differ? Evidence on specialization in private debt contracting, Journal of Finance 53,
845–878.
Chava, Sudheer and Amiyatosh Purananadam, 2008, The effect of banking crisis on bank dependent
borrowers, Texas A&M University working paper.
Campello, Murillo, Erasmo Giambona, John Graham and Campbell Harvey, 2009, Liquidity management
and Corporate Investment during the Crisis, Duke University working paper.
Diamond, Douglas, 1989, Reputation Acquisition in Debt Markets, Journal of Political Economy 97, 828-
862.
Diamond, Douglas, 1991, Monitoring and reputation: The choice between bank loans and directly placed
debt, Journal of Political Economy 99, 688-721.
Fama, Eugene, 1985, What’s different about banks? Journal of Monetary Economics 17, 239-249.
Gatev, Evan and Philip E. Strahan, 2006, Banks advantage in hedging liquidity risk: Theory and
evidence from the commercial paper market,” Journal of Finance 61, 867-892.

33
Gertler, Mark and Simon Gilchrist, 1994, Monetary policy, business cycles and the behavior of small
manufacturing firms, and the behavior of small manufacturing firms, Quarterly Journal of
Economics 109, 209-340.
Gilchrist, Simon G., and Charles Himmelberg, 1995, The role of cash flow in reduced-form
investment equations, Journal of Monetary Economics 36, 541-572.
Gilson, Stuart C., and Jerold Warner, 1997, Junk bonds, bank debt, and financing corporate
growth, Harvard Business School working paper.Gorton, Gary and Andrew Winton, 2003, Financial intermediation. In: G. Constantinides, M. Harris and
R. Stulz, Editors, The Handbook on the Economics of Finance, New Holland, Amsterdam.
Gonzales, Laura, and Christopher James, 2007, Banks and bubbles: How good are bankers at spotting
winners?, Journal of Financial Economics 86, 40-70.
Greene, William H., Econometric Analysis, 2000, Prentice-Hall
Holmstrom, Bengt, and Jean Tirole, 1997, Financial intermediation, loanable funds and the real sector,
Quarterly Journal of Economics 112, 663-691.
Houston, Joel, and Christopher James, 1996, Bank information monopolies and the mix of private and
public debt claims, Journal of Finance 28, 149–171.
James, Christopher, 1987, Some evidence on the uniqueness of bank loans, Journal of Financial
Economics 19, 217–235.
James, Christopher, and Peggy Wier, 1990, Borrowing relationships, intermediation, and the cost of
issuing public securities, Journal of Financial Economics 28, 149-171.
Johnston Jack and John DiNardo, Econometric Methods, 1996, McGraw-Hill
Kashyap, Anil, Raghuram Rajan, and Jeremy Stein, 2000, Banks as liquidity providers: An explanation
for the co-existence of lending and deposit taking, Journal of Finance 57, 33-74.
Kashyap, Anil K, and Jeremy Stein, 2000, What do a million observations on banks say about the
transmission of monetary policy?, American Economic Review 90, 407-428.
Khwaja, Asim I., and Atif Mian, 2008, Tracing the impact of bank liquidity shocks: Evidence from an
emerging market,” American Economic Review 98(4): 1413-1442.
Kim, Moonchul, and Jay Ritter, 1999, Valuing IPOs, Journal of Financial Economics 53, 409-437.
Loutskina, Elena, and Philip E. Strahan, 2009, Securitization and the declining impact of bank finance onloan supply: Evidence from mortgage originations, Journal of Finance 64, 861-889.
Lown, Cara, and Donald Morgan, 2006, The Credit Cycle and the Business Cycle: New Findings Using
the Loan Officer Opinion Survey, Journal of Money Credit and Banking 38, 1575-1597.

34
Lummer, Scott, and John McConnell, 1989, Further evidence on the bank lending process and the capital
market response to bank loan agreements, Journal of Financial Economics 25, 99-122.
Nilsen, Jeffery, 2002, Trade credit and bank lending channel, Journal of Money Credit and Banking 34,
26-253.
Officer, Micah, 2007, The price of corporate liquidity: Acquisition discounts for unlisted targets, Journal
of Financial Economics 83, 571-598.
Paravisini, Daniel, 2008, Local Bank financial, constraints and firm access to external finance, Journal of
Finance 63, 2161-2193.
Peek, Joseph, and Eric S. Rosengren, 2000, Collateral damage: Effects of the Japanese bank crisis on real
activity in the US, American Economic Review 90, 30-45.
Petersen, Mitchell, and Raghuram Rajan, 1994, The benefits of lending relationships: Evidence from
small business data, Journal of Finance 49, 3-37.
Petersen, Mitchell, and Raghuram Rajan, 1995, The effects of credit market competition on lending
relationships, Quarterly Journal of Economics 110, 407-444.
Petersen, Mitchell, and Raghuram Rajan, 1997, Trade credit: theories and evidence, Review of Financial
Studies, 10, 661-691.
Rajan, Raghuram, 1992, Insiders and outsiders: the choice between informed and arm’s length debt,
Journal of Finance 47, 1367-1400.
Ramakrishan, Ram, and Anjan V. Thakor, 1984, Information reliability and security design, Review
of Economic Studies 51, 415-432.
Rice, Tara and Philip E. Strahan, 2009, Does credit competition affect small-firm finance?, Journal of
Finance, forthcoming
Schenone, Carola, 2009, Lending relationships and information rents: Do banks exploit their information
advantages?, Review of Financial Studies, forthcoming
Shockley, Richard L., and Anjan V. Thakor, 1997, Bank loan commitment contracts: Data, theory and
tests, Journal of Money, Credit and Banking 29, 517-534.
Sharpe, Steven, 1990, Asymmetric information, bank lending and implicit contracts: A stylized model of
customer relationships, Journal of Finance 45, 1069-1087.
Smith, Janet K., 1987, Trade credit and information asymmetries, Journal of Finance 42, 863-872.
Stiglitz, Joseph and Andrew Weiss, 1981, Credit rationing in market with imperfect information,
American Economic Review 71, 393-410.
Sufi, Amir, 2009, Bank lines of credit in corporate finance: An empirical analysis, Review of Financial
Studies 22, 1057-1088.

35
0
50
100
150
200
250
0
50
100
150
200
250
300
350
1996
1997
1998
1999
2000
2001
2002
2003
2004
Number of deals
IPOs Private acquisitions C&I loan spreads
Spread (bps)
Fig. 1. C&I loan spreads and the volume of IPOs and private firm acquisitions. We define commercial and industrial (C&I) loan spreads as 4-quarter moving averageof the difference between the C&I loan rate and federal funds rate at the time of the transaction. We assume that higher C&I loan spreads reflect tighter credit marketconditions.

36
Table 1Summary Statistics
This table presents summary statistics for private acquisitions, IPO firms, and public acquisitions. Information on the financials and debt structure of private acquisitions is handcollected from the proxy statements of the acquiring public firms. The financials of the other two samples are obtained from Compustat. Information on the debt structure of IPOfirms and public acquisitions are from the final IPO prospectus and Amir Sufi’s line of credit database, respectively. Also, information on VC backing for private acquisition firmsis from VenturExpert and for IPO firms is from Jay Ritter’s IPO database. The period of analysis is from 1995 to 2004. We test the null that the means (medians) for each groupare equal to those for the other groups using t-tests (Wilcoxon rank sum tests). We assume unequal variances for t-tests. We use a, b, and c to denote that the null is rejected at the1%, 5%, and 10% levels, respectively. In Panel A, the findings from hypothesis tests comparing means (or medians) for private acquisition sample to those for the other twosamples are presented in the Private acquisitions panel. For example, a,b to the right of a mean value in the private acquisitions panel denotes that the mean for the privateacquisition sample is significantly different from the means for the IPO and public acquisition samples at the 1% and 5% levels, respectively. The findings from hypothesis testscomparing the means (or medians) for the IPO sample to those for the public acquisition sample are presented in the IPOs panel. In Panels B and C, we use a, b, and c to denotethat the mean and median difference between the line of credit and the no line of credit samples is significant at the 1%, 5% and 10% levels (two-tailed), respectively.
Panel A. Summary statistics for private acquisitions, IPOs, and public acquisitions
Private acquisitions IPOs Public acquisitionsN=816 N=1315 N=918
Mean Median Mean Median Mean MedianAssets (millions) 39.6 a,a 10.0 a,a 145.3 a 24.0 a 1264 168.4Transaction value (millions) 137.5 a,a 52.0 a,a 469.5 a 213.7 a 1567.2 203.8Age (years) 7.5 a,a 5.0 a,a 11.9 a 7.0 a 14.5 10.0Book debt/Assets (%) 35.7 --,a 23.2 --,a 33.7 a 24.2 a 20.7 16.8Net worth / (Assets – Cash) (%) -3.8 a,a 13.6 --,a 3.3 a 14.4 a 38.8 41.6Cash flows / (Assets – Cash) (%) -3.6 a,a 13.2 a,-- -14.0 a 7.7 a 6.0 12.1Cash flow volatility (industry median) (%) 12.1 --,a 11.4 --,a 11.8 b 11.8 a 11.0 9.3Market-to-book, cash adjusted (industry median) 2.2 a,a 1.9 a,a 2.5 a 2.2 a 1.8 1.7Tangible assets / (Assets – Cash) (%) 36.0 24.4 31.7 25.0 32.3 25.5Capital expenditures / (Assets – Cash) (%) 16.1 a,a 7.8 b,a 14.4 a 9.4 a 7.5 5.1Cash /Assets (%) 20.9 a,-- 10.6 b,-- 25.1 14.8 19.6 9.5Current ratio 2.3 --,a 1.4 c,a 2.2 a 1.5 a 2.8 2.0Days payable outstanding 111.3 --,a 36.8 a,-- 116.3 a 56.9 a 59.4 38.8Altman’s z-score -0.3 a,a 1.9 a,b 0.5 a 1.0 b 1.2 1.6Fraction VC-backed (%) 23.0 a,-- -- 52.2 -- -- --Fraction with bank debt (%) 64.1 b,-- -- 69.5 -- -- --Bank debt/Assets (%) 17.3 2.9 16.7 3.0 -- --Fraction with line of credit (LC) (%) 60.8 a,a -- 66.7 -- 84.2 --Unused bank LC / (Unused bank LC + Cash) (%) 37.2 21.6 35.3 19.9 -- --

37
Panel B. Summary statistics for private firms by the existence of a line of credit
Firms with a line of creditN=1397
Firms without a line of creditN=769
Mean Median Mean MedianAssets (millions) 127.8 a 22.8 a 65.0 12.3Transaction value (millions) 357.1 149.3 a 315.9 118.0Age (years) 12.4 a 7.0 a 7.8 5.0Book debt/Assets (%) 37.0 a 30.3 a 29.9 10.7Net worth / (Assets – Cash) (%) 7.5 a 18.6 a -11.9 1.4Cash flows / (Assets – Cash) (%) -1.8 a 13.1 a -25.2 -23.6Cash flow volatility (industry median) (%) 11.2 a 10.6 a 13.0 13.5Market-to-book, cash adjusted (industry median) 2.3 a 1.9 a 2.6 2.3Tangible assets / (Assets – Cash) (%) 31.5 a 22.5 a 36.7 30.1Capital expenditures / (Assets-Cash) (%) 12.5 a 7.4 a 19.7 12.4Cash /Assets (%) 16.9 a 6.7 a 35.5 30.5Current ratio 1.9 a 1.4 a 3.0 1.7Days payable outstanding 95.9 a 45.8 a 149.1 57.2Altman’s z-score 1.1 a 1.7 a -1.4 -0.3Fraction VC-backed (%) 38.5 a -- 46.2 --
Panel C. Summary statistics for public acquisitions by the existence of a line of credit
Firms with a line of creditN=773
Firms without a line of creditN=145
Mean Median Mean MedianAssets (millions) 1437.9 a 184.0 a 337.3 78.2Transaction value (millions) 1705.2 a 209.2 830.7 161.3Age (years) 15.4 a 11.0 a 9.8 8.0Book debt/Assets (%) 22.9 a 21.3 a 8.6 0.3Net worth / (Assets – Cash) (%) 40.5 a 41.5 29.4 43.0Cash flows / (Assets – Cash) (%) 8.0 a 12.6 b -4.5 8.9Cash flow volatility (industry median) (%) 9.8 a 7.7 a 17.4 16.3Market-to-book, cash adjusted (industry median) 1.8 a 1.6 a 2.3 2.2Tangible assets / (Assets – Cash) (%) 33.7 a 27 a 24.7 19.4Capital expenditures / (Assets-Cash) (%) 7.4 5.1 8.3 5.6Cash /Assets (%) 14.9 a 6.7 a 45.1 46.8Current ratio 2.4 a 1.8 a 4.8 3.3Days payable outstanding 56.3 b 38.1 73.8 40.1Altman’s z-score 1.4 a 1.7 a 0.2 1.0

38
Table 2Credit Market Conditions and Firm Liquidity
The table below presents whether firms’ use of alternative liquidity sources such as cash holdings, bank lines of credit, and trade credit differ under tight vs. loose credit marketconditions, using three distinct samples of firms. We measure the tightness of credit market conditions in two ways: (i) percentage of banks tightening lending standards, and (ii)the spread between three-month AA-rated commercial paper rate for non-financial firms and three-month T-Bills. In Panel A, we examine IPO firms and private firms acquired bypublic firms (i.e., private acquisitions). In Panel B, we examine the 918 public firms in Sufi’s broader bank line of credit database that later got acquired (i.e., public acquisitions).In Panel C, we examine 300 public firms that Sufi (2009) randomly selected from Compustat to examine in detail public firms’ utilization of lines of credit . Notice that for firms inPanel C, we have information on the existence but not the utilization of bank lines of credit. The period of our analysis is from 1995 to 2004. Information on the financials and debtstructure of private acquisitions is hand collected from the proxy statements of the acquiring public firms. The financials of the other two samples are obtained from Compustat.Information on the debt structure of IPO firms and public acquisitions are from the final IPO prospectus and Amir Sufi’s line of credit database, respectively. We define dayspayables outstanding, our measure of trade credit use, as 365 times the firm’s accounts payable over its cost of goods sold. We test the null that the means (medians) for tight andloose credit market conditions are equal groups using t-tests (Wilcoxon rank sum tests). We assume unequal variances for t-tests. We use a, b, and c to denote that the null isrejected at the 1%, 5%, and 10% levels, respectively.
Panel A. Private Acquisition and IPO Firms (N=2,166 firms)
% of banks that tighten lending standards Paper-bill spreadHigh Low High Low
Mean Median Mean Median Mean Median Mean MedianCash / (Assets - Cash) (%) 80.2 a 28.9 a 39.7 8.6 59.6 15.0 56.8 14.3Fraction of firms with a line of credit (%) 58.9 a -- 69.2 -- 64.8 -- 64.2 --Total line / (Total line + Cash) (%) 36.6 a 22.3 a 49.7 56.4 43.7 40.0 43.7 37.9Unused line / (Unused line + Cash) (%) 29.9 a 6.4 a 41.1 35.3 36.1 18.6 35.9 21.4Unused line / Total line (%) 61.4 66.7 60.1 64.0 60.9 66.7 60.4 64.6Days payables outstanding 143.3 a 62.2 a 87.6 40.7 122.5 c 50.2 103.9 47.6
Panel B. Public Acquisitions (N=918 firms)
% of banks that tighten lending standards Paper-bill spreadHigh Low High Low
Mean Median Mean Median Mean Median Mean MedianCash / (Assets - Cash) (%) 35.2 9.9 40.6 10.8 31.3 a 7.2 a 44.3 15.5Fraction of firms with a line of credit (%) 84.0 -- 84.4 -- 85.3 -- 83.2 --Days payables outstanding 54.5 c 37.0 c 63.8 40.9 60.9 40.5 58.1 36.8

39
Panel C. Sufi (2009) Panel of Public Firms (N=300 firms and 1,908 firm-years)
% of banks that tighten lending standards Paper-bill spreadHigh Low High Low
Mean Median Mean Median Mean Median Mean MedianCash / (Assets - Cash) (%) 37.0 9.0 40.0 9.0 37.0 c 7.4 a 40.7 11.3Fraction of firms with a line of credit (%) 74.5 -- 75.1 -- 76.4 c -- 72.9 --Total line / (Total line + Cash) (%) 51.0 56.8 51.4 57.0 54.0 a 63.8 a 47.6 49.7Unused line / (Unused line + Cash) (%) 44.1 45.0 45.6 45.9 47.4 a 48.8 b 41.9 41.7Unused line / Total line (%) 68.5 77.4 71.3 85.0 68.6 c 76.3 b 71.9 84.7Days payables outstanding 55.6 35.5 59.7 37.1 58.3 37.0 57.4 35.8

40
Table 3The Determinants of Having a Bank Line of Credit
We estimate the determinants of the existence of a line of credit for private acquisition and IPO firms (regressions 1 to 3) and public acquisition firms (regressions 4 to 6) usingProbit regressions. Marginal effects of the coefficient estimates and t-statistics based on robust standard errors (in parentheses) are reported in the table. We use a, b, and c todenote that the coefficient estimate is different from zero at the 1%, 5%, and 10% levels (two-tailed), respectively. Regressions are estimated with an intercept as well as industryand year fixed effects (not reported). Information on private acquisitions is hand collected from the proxy statements of the acquiring public firms. The financials of the other twosamples are obtained from Compustat. Information on the banking relationships of IPO firms and public acquisitions are from the final IPO prospectus and Amir Sufi’s line ofcredit database, respectively. Also, information on VC backing for private acquisition firms is from VenturExpert and for IPO firms is from Jay Ritter’s IPO database. The periodof analysis is from 1995 to 2004.
Dependent variable: Probability(Line of crediti=1) Sample: Private firms Public acquisitions
(1) (2) (3) (4) (5) (6)Commercial & industrial loan spread -0.15 a -- -- -0.02 -- --
(-3.11) -- -- (-0.25) -- --Net % of banks that tighten standards -- -0.22 a -- -- -0.01 --
-- (-2.70) -- -- (-0.17) --Paper-bill spread -- -- 0.07 -- -- 0.06
-- -- (1.22) -- -- (1.12)Cash flows/(Assets – Cash) 0.06 b 0.06 b 0.07 a -0.02 -0.02 -0.02
(2.38) (2.50) (2.96) (-0.52) (-0.52) (-0.58)LN(Assets - Cash) 0.09 a 0.09 a 0.09 a 0.03 a 0.03 a 0.03 a
(11.47) (11.09) (11.09) (5.08) (5.06) (5.05)Tangible assets/(Assets – Cash) -0.01 -0.01 -0.01 0.07 0.07 0.07
(-0.68) (-0.68) (-0.67) (1.28) (1.32) (1.25)Net worth /(Assets – Cash) 0.05 b 0.05 b 0.05 b 0.05 c 0.05 c 0.05 c
(2.02) (2.15) (2.15) (1.73) (1.80) (1.69)Cash flow volatility (industry median) 0.22 0.14 -0.01 -0.99 a -0.99 a -0.96 a
(0.89) (0.57) (-0.03) (-5.44) (-5.41) (-5.33)Market-to-book (industry median) -0.02 c -0.02 -0.01 -0.03 a -0.03 a -0.04 a
(-1.75) (-1.38) (-1.01) (-2.98) (-2.95) (-3.12)Dummy: Venture capital backed 0.02 0.01 0.01 -- -- --
(0.59) (0.53) (0.41) -- -- --Dummy: IPO firm -0.04 -0.03 -0.02 -- -- --
(-1.41) (-1.25) (-0.87) -- -- --Number of observations 2,152 2,152 2,152 913 913 913Pseudo R2 11.0% 11.0% 11.0% 21.3% 21.3% 21.4%

41
Table 4Sensitivity of Line of Credit Utilization to Credit Conditions
The table below presents how private and public firms’ utilization of bank lines of credit are related to credit market conditions. In Panel A, we present resultsbased on IPOs and private acquisitions and in Panel B we present those for the 300 firms in Amir Sufi’s line of credit database with information on line of creditutilization. While regressions are estimated with additional variables including EBITDA/(assets-cash), natural logarithm of assets, tangible assets/(asset-cash), networth/(assets-cash), market-to-book, cash flow volatility, and industry and year fixed effects, we report only coefficient estimates and t-statistics (based on robuststandard errors, and clustered by firm in the public firm sample) for credit condition variables. Regressions for the private firm sample also include VC-backedand IPO dummies. We use a, b, and c to denote that the coefficient estimate is different from zero at the 1%, 5%, and 10% levels (two-tailed), respectively.
Dependent variable: Unused line/(Unused line + Cash)
Total line/(Total line + Cash)
Sample: All firms Firms w/ bank line All firms Firms w/ bank line Estimation method: TOBIT OLS TOBIT OLS
Panel A. Private Firms (Acquisitions & IPOs)
Net % of banks that tighten standards -0.21 b 0.02 -0.19 c 0.06(-2.06) (0.24) (-1.87) (0.92)
Paper-bill spread 0.11 0.03 0.13 c 0.03(1.53) (0.64) (1.78) (0.76)
Panel B. Sufi’s Panel of 300 Firms with Information on Line of Credit Utilization
Net % of banks that tighten standards -0.14 b -0.08 -0.13 b -0.08(-2.42) (-1.62) (-2.28) (-1.61)
Paper-bill spread 0.19 a 0.15 a 0.24 a 0.20 a(4.10) (3.72) (5.51) (5.21)

42
Table 5Determinants of Trade Credit Use for Private Firms
We estimate the determinants of trade credit use for private firms (IPOs and acquisitions) using OLS regressions. The dependent variable is the natural logarithm of days payableoutstanding, defined as 365 times firm’s accounts payable over cost of goods sold. The coefficient estimates and t-statistics based on robust standard errors (in parentheses) arereported in the table. We use a, b, and c to denote that the coefficient estimate is different from zero at the 1%, 5%, and 10% levels (two-tailed), respectively. Regressions areestimated with an intercept as well as industry and year fixed effects (not reported). Information on the financials and debt structure of private acquisitions is hand collected fromthe proxy statements of the acquiring public firms. The financials of the IPO sample are obtained from Compustat. Information on the debt structure of IPO are from the final IPOprospectus. Also, information on VC backing for private acquisition firms is from VenturExpert and for IPO firms is from Jay Ritter’s IPO database. The period of analysis is from1995 to 2004.
Model: LN(Days payables are outstanding)
Sample: Private firms
All firmsFirms withbank lines
Firms with nobank lines
Net % of banks that tighten standards 0.39 b 0.17 0. 71 b
(2.19) (0.89) (2.01)Cash flows/(Assets – Cash) -0.58 a -0.58 a -0.62 a
(-10.61) (-7.49) (-7.94)LN(Assets - Cash) -0.01 -0.02 0.03
(-0.58) (-1.15) -0.81Tangible assets/(Assets – Cash) 0.04 a 0.06 b -0.2
(2.84) (2.34) (-1.03)Net worth /(Assets – Cash) -0.13 b -0.14 b -0.13
(-2.36) (-2.01) (-1.52)Cash flow volatility (industry median) 1.89 a 2.15 a 1.33
(4.16) (4.09) (1.56)Market-to-book (industry median) 0.02 -0.01 0.06
(0.64) (-0.38) (1.27)Dummy: Venture capital backed 0.03 0.15 b -0.18 c
(0.56) (2.27) (-1.74)Dummy: IPO firm 0.35 a 0.39 a 0.27 a
(6.61) (6.44) (2.65)Number of observations 2,119 1,381 738
Adjusted R2 17.40% 20.40% 13.40%

43
Table 6Raw Valuation Multiples
The table presents summary statistics on three valuation multiples (enterprise value-to-sales, enterprise value-to-operating cash flows, enterprise value-to-bookvalue) for private acquisition and IPO firms by the existence of a bank line of credit. Enterprise value equals the market value of equity (calculated based on thefinal offer price of either the acquisition or the IPO transaction) plus the book value of debt, minus cash. Sales, operating cash flows, and book value are based onthe last annual financials reported before the completion of the acquisition or IPO transaction. We set the value of a multiple to missing if the denominator isnegative or zero. To reduce the effect of outliers, we set the value of sales and book value (operating cash flow) multiples to 10 (100) if greater than 10 (100).Information on the financials and debt structure of private acquisitions is hand collected from the proxy statements of the acquiring public firms. The financialsof the IPO firms is obtained from Compustat. Information on the debt structure of IPO firms is from the final IPO prospectus. The period of analysis is from 1995to 2004. We use a, b, and c to denote that the mean and median difference between the line of credit and the no line of credit samples is significant at the 1%, 5%and 10% levels (two-tailed), respectively.
Firms with a line of credit Firms without a line of creditValuation multiples: N Mean Median N Mean Median
Panel A. Private acquisition firms
Enterprise value-to-sales 492 3.3 a 1.7 a 297 5.8 5.5Enterprise value-to-operating cash flows 367 21.6 b 12.9 150 29.1 13.8Enterprise value-to-book value 398 7.5 b 8.8 a 240 7.9 10.0
Panel B. IPO firms
Enterprise value-to-sales 859 5.0 a 3.8 a 433 7.3 10.0Enterprise value-to-operating cash flows 458 27.9 a 16.7 a 133 38.1 24.8Enterprise value-to-book value 799 4.6 4.0 406 4.5 3.9
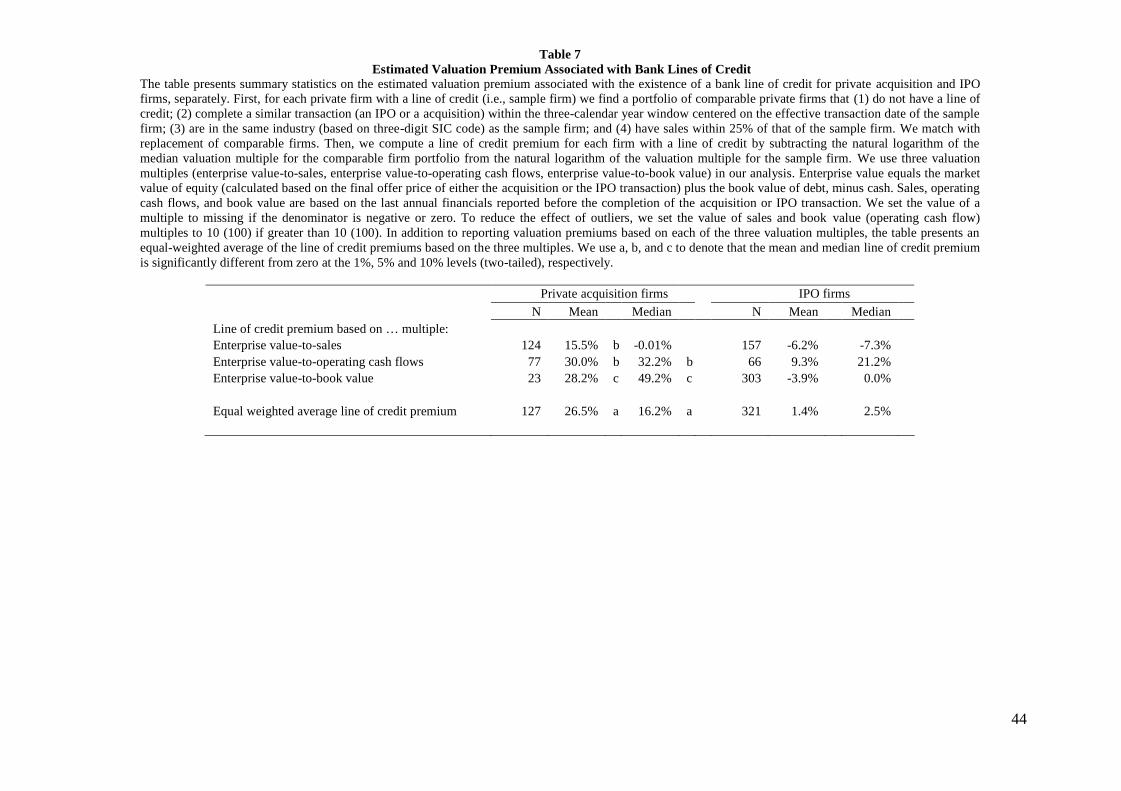
44
Table 7Estimated Valuation Premium Associated with Bank Lines of Credit
The table presents summary statistics on the estimated valuation premium associated with the existence of a bank line of credit for private acquisition and IPOfirms, separately. First, for each private firm with a line of credit (i.e., sample firm) we find a portfolio of comparable private firms that (1) do not have a line ofcredit; (2) complete a similar transaction (an IPO or a acquisition) within the three-calendar year window centered on the effective transaction date of the samplefirm; (3) are in the same industry (based on three-digit SIC code) as the sample firm; and (4) have sales within 25% of that of the sample firm. We match withreplacement of comparable firms. Then, we compute a line of credit premium for each firm with a line of credit by subtracting the natural logarithm of themedian valuation multiple for the comparable firm portfolio from the natural logarithm of the valuation multiple for the sample firm. We use three valuationmultiples (enterprise value-to-sales, enterprise value-to-operating cash flows, enterprise value-to-book value) in our analysis. Enterprise value equals the marketvalue of equity (calculated based on the final offer price of either the acquisition or the IPO transaction) plus the book value of debt, minus cash. Sales, operatingcash flows, and book value are based on the last annual financials reported before the completion of the acquisition or IPO transaction. We set the value of amultiple to missing if the denominator is negative or zero. To reduce the effect of outliers, we set the value of sales and book value (operating cash flow)multiples to 10 (100) if greater than 10 (100). In addition to reporting valuation premiums based on each of the three valuation multiples, the table presents anequal-weighted average of the line of credit premiums based on the three multiples. We use a, b, and c to denote that the mean and median line of credit premiumis significantly different from zero at the 1%, 5% and 10% levels (two-tailed), respectively.
Private acquisition firms IPO firmsN Mean Median N Mean Median
Line of credit premium based on … multiple:Enterprise value-to-sales 124 15.5% b -0.01% 157 -6.2% -7.3%Enterprise value-to-operating cash flows 77 30.0% b 32.2% b 66 9.3% 21.2%Enterprise value-to-book value 23 28.2% c 49.2% c 303 -3.9% 0.0%
Equal weighted average line of credit premium 127 26.5% a 16.2% a 321 1.4% 2.5%

45
Table 8The Sensitivity of Estimated Line of Credit Valuation Premium to Matching Criteria
This table shows the sensitivity of equal-weighted average estimated line of credit valuation premium to using alternative industry and size matching criteria foridentifying matching firms. We use a, b, and c to denote that the mean and median line of credit premium is significantly different from zero at the 1%, 5% and10% levels (two-tailed), respectively.
Private acquisition firms IPO firms
Industry WithinSales
within… N Mean Median N Mean Median2-digit SIC 3 years 25% 184 22.8% a 20.3% a 436 2.6% 1.6%2-digit SIC 3 years 50% 223 18.1% a 7.8% a 500 1.4% 0.4%3-digit SIC 3 years 25% 127 26.5% a 16.2% a 321 1.4% 2.5%3-digit SIC 3 years 50% 155 21.0% a 6.1% b 375 1.9% 3.6%4-digit SIC 3 years 25% 68 36.7% a 21.8% a 234 1.3% 2.1%4-digit SIC 3 years 50% 88 31.1% a 13.9% a 277 0.8% 4.3%
2-digit SIC 1 year 25% 117 25.9% a 19.6% a 390 2.4% 2.3%2-digit SIC 1 year 50% 149 24.0% a 5.2% a 450 2.4% 0.8%3-digit SIC 1 year 25% 74 21.6% b 17.0% c 292 1.0% 3.3%3-digit SIC 1 year 50% 93 14.4% c 6.4% b 339 1.6% 3.6%4-digit SIC 1 year 25% 36 41.2% b 24.0% b 193 0.0% 1.5%4-digit SIC 1 year 50% 52 22.1% b 8.2% b 237 -0.1% 6.1%

46
Table 9Cross Sectional Determinants of the Estimated Line of Credit Premium
We estimate OLS regressions to examine the cross-sectional determinants of estimated valuation premium (in decimals) associated with bank lines of credit forprivate acquisition and IPO firms. We estimate the line of credit premium using a comparable transaction methodology. First, for each private firm with a line ofcredit (i.e., sample firm) we find a portfolio of comparable private firms that (1) do not have a line of credit; (2) complete a similar transaction (an IPO or aacquisition) within the three-calendar year window centered on the effective transaction date of the sample firm; (3) are in the same industry (based on three-digitSIC code) as the sample firm; and (4) have sales within 25% of that of the sample firm. We match with replacement of comparable firms. Then, we compute aline of credit premium for each firm with a line of credit by subtracting the natural logarithm of the median valuation multiple for the comparable firm portfoliofrom the natural logarithm of the valuation multiple for the sample firm. We use three valuation multiples (enterprise value-to-sales, enterprise value-to-operatingcash flows, enterprise value-to-book value) in our analysis. Enterprise value equals the market value of equity (calculated based on the final offer price of eitherthe acquisition or the IPO transaction) plus the book value of debt, minus cash. Sales, operating cash flows, and book value are based on the last annual financialsreported before the completion of the acquisition or IPO transaction. The dependent variable in the regressions is the equal-weighted average of the line of creditpremiums based on the three multiples. Coefficient estimates and t-statistics based on robust standard errors (in parentheses) are reported in the table. We use a,b, and c to denote that the coefficient estimate is different from zero at the 1%, 5%, and 10% levels (two-tailed), respectively.
(1) (2) (3) (4) (5) (6)
Dummy: Above median # of banks tighten lending standards 0.15 a -- -- -- 0.13 c 0.16 b(2.61) -- -- -- (1.91) (2.11)
Dummy: Sales above sample median -- -0.17 a -- -- -0.16 b -0.11-- (-2.82) -- -- (-2.38) (-1.56)
Dummy: Cash flows above sample median -- -- -0.10 c -- -0.01 0.10-- -- (-1.67) -- (-0.09) (1.12)
Dummy: Age above sample median -- -- -- -0.16 b -- -0.12 c
-- -- -- (-2.48) -- (-1.86)Dummy: IPO firm -0.25 a -0.24 a -0.28 a -0.39 a -0.24 a -0.34 a
(-3.27) (-3.19) (-3.51) (-3.31) (-3.19) (-2.97)Number of observations 448 448 448 368 448 368Adjusted R2 4.3% 4.6% 3.4% 6.4% 5.3% 7.6%

47
Table 10Estimated Line of Credit Premium in Subsamples
The table presents summary statistics on the valuation premium associated with the existence of a bank line of credit for subsamples of private acquisition firms(left panel) and IPO firms (right panel). We estimate the line of credit premium using a comparable transaction methodology. First, for each private firm with aline of credit (i.e., sample firm) we find a portfolio of comparable private firms that (1) do not have a line of credit; (2) complete a similar transaction (an IPO ora acquisition) within the three-calendar year window centered on the effective transaction date of the sample firm; (3) are in the same industry (based on three-digit SIC code) as the sample firm; and (4) have sales within 25% of that of the sample firm. We match with replacement of comparable firms. We compute aline of credit premium by subtracting the natural logarithm of the median valuation multiple for the matching firm portfolio from the natural logarithm of thevaluation multiple for the firm with a line of credit. We present the mean and median equal-weighted average line of credit premium that is calculated by usingenterprise value-to-sales, enterprise value-to-operating cash flows, enterprise value-to-book value multiples. We determine the old vs. young, small vs. big, highvs. low cash flows, high vs. low credit spreads, and tight vs. loose credit market subsamples by dividing the private acquisition (or IPO) sample into two based onmedian age, sales, operating cash flows-to-assets, credit spreads, and percentage of banks tightening lending standards, respectively. We test the null that themean (median) premiums are equal to zero within each subgroup. We also test the null hypothesis that means (medians) for subgroups are equal and report p-values from the tests on the p-diff row. We use a,b, and c to denote that the null is rejected at 1%,5 % and 10 % levels, respectively.
Acquisition Sample IPO Sample
N Mean Median N Mean MedianOld 37 23.0% 2.0% 119 -5.20% -4.60% c
Young 23 70.6% a 69.6% a 189 7.80% b 10.50% a
p-diff 0.05 b 0.07 c 0.05 b 0.00 a
Big 62 13.40% 3.30% 111 -6.60% -12.10% b
Small 65 38.90% a 32.90% a 210 5.60% c 7.80% a
p-diff 0.07 c 0.09 c 0.09 c 0.00 a
High cash flows 75 20.90% a 0.50% a 132 -4.30% -6.60%Low cash flows 52 34.40% b 36.10% 187 5.10% 5.60% b
p-diff 0.34 0.25 0.15 0.08 c
High C&I spread 69 32.50% a 39.70% a 166 5.80% 4.50%Low C&I spread 58 19.30% b 1.90% 155 -3.40% -1.30%p-diff 0.35 0.09 c 0.12 0.24Tight credit market 61 38.10% a 46.00% a 152 7.90% c 5.90% c
Loose credit market 66 15.70% c 1.90% 169 -4.60% -1.50%p-diff 0.12 0.09 c 0.04 b 0.11

48
Table 11Bank Lines of Credit and Private Firm Valuation Multiples
The table below presents the coefficient estimates and t-statistics based on robust standard errors (in parentheses) from the second stage oftwo-stage selectivity regressions examining the relationship between bank lines of credit and private firm (private acquisition or IPO firm)valuation multiples. In the first step (not reported), we estimate via Probit regressions the determinants of the existence of a bank line ofcredit. The linear predictor from the first-stage is used to compute the Inverse Mills ratio, which is defined as: φ (ψ) / Φ (ψ). Here φ is thestandard normal density function, Φ is the standard normal cumulative distribution function and ψ is the estimated linear predictor fromthe first stage regressions. In the second stage (presented below), we estimate selectivity corrected linear valuation regressions where thedependent variable equals one of the following three valuation multiples: enterprise value-to-sales, enterprise value-to-operating cashflows, enterprise value-to-book value. Enterprise value equals the market value of equity (calculated based on the final offer price ofeither the acquisition or the IPO transaction) plus the book value of debt, minus cash. Sales, operating cash flows, and book value arebased on the last annual financials reported before the completion of the acquisition or IPO transaction. We set the value of a multiple tomissing if the denominator is negative or zero. To reduce the effect of outliers, we set the values of sales and book value (operating cashflow) multiples to 10 (100) if greater than 10 (100). Information on the financials and debt structure of private acquisitions is handcollected from the proxy statements of the acquiring public firms. The financials of the IPO firms is obtained from Compustat.Information on the debt structure of IPO firms is from the final IPO prospectus. The period of analysis is from 1995 to 2004. Regressionsare estimated with an intercept as well as year and industry dummies (not reported). We use a, b, and c to denote that the coefficientestimate is different from zero at the 1%, 5%, and 10% levels (two-tailed), respectively.
Private acquisition firms IPO firmsEnterprise value-to- … Enterprise value-to- …
SalesCashflows
Bookvalue Sales
Cashflows
Bookvalue
Inverse Mills ratio 14.08 a 140.13 a 7.85 c 11.55 a 96.50 a 10.04 a(3.60) (2.92) (1.77) (3.60) (2.98) (2.72)
Dummy: Line of credit -0.51 b -3.26 0.54 b -0.66 a 0.31 -0.03(-2.46) (-1.19) (2.18) (-4.08) (0.11) (-0.18)
Cash flows/(Assets – Cash) -1.38 a -62.14 a -0.16 -1.24 a -37.59 a 0.04(-5.61) (-6.38) (-0.60) (-5.61) (-6.70) (0.18)
LN(Assets - Cash) 0.09 -3.94 c -0.18 -0.19 c -4.74 a 0.46 a(0.47) (-1.94) (-0.77) (-1.75) (-4.78) (3.87)
Tangible assets/Assets 0.23 a 2.40 a -0.43 -0.21 -8.54 c -1.87 a(3.07) (2.86) (-0.86) (-0.44) (-1.85) (-3.69)
Net worth /(Assets – Cash) -0.15 -3.70 -0.52 a 0.04 1.29 -0.32 a(-1.16) (-1.59) (-3.31) (0.58) (0.49) (-3.76)
Dummy: Venture capital backed 0.33 4.24 0.03 0.59 a 2.58 0.30 c(1.29) (1.40) (0.12) (3.13) (1.07) (1.74)
Dummy: Above median Altman’s z-score -1.03 b 1.30 0.40 -1.80 a -11.83 a 0.18(-2.20) (0.24) (0.68) (-8.47) (-4.88) (0.89)
Cash flow volatility (industry median) 11.52 a 118.09 a 6.90 a 9.28 a 62.18 b -1.71(4.70) (3.93) (2.67) (5.60) (2.48) (-1.15)
Market-to-book (industry median) -0.07 -1.31 0.09 0.12 c 3.54 a 0.24 a(-0.60) (-1.02) (0.77) (1.75) (2.93) (3.59)
Number of observations 740 475 602 1,221 546 1,139
Adjusted R2 62.1% 40.0% 24.9% 60.0% 39.6% 7.4%

49
Table 12Bank Lines of Credit and Public Acquisition Firm Valuation Multiples
The table below presents the coefficient estimates and t-statistics based on robust standard errors (in parentheses)from the second stage of two-stage selectivity regressions examining the relationship between bank lines of creditand public acquisition firm valuation multiples. In the first step (not reported), we estimate via Probit regressions thedeterminants of the existence of a bank line of credit. The linear predictor from the first-stage is used to compute theInverse Mills ratio, which is defined as: φ (ψ) / Φ (ψ). Here φ is the standard normal density function, Φ is thestandard normal cumulative distribution function and ψ is the estimated linear predictor from the first-stageregressions. In the second stage (presented below), we estimate selectivity corrected linear valuation regressionswhere the dependent variable equals one of the following three valuation multiples: enterprise value-to-sales,enterprise value-to-operating cash flows, enterprise value-to-book value. Enterprise value is obtained from SDC. Wemerge public acquisition sample with SDC and obtain enterprise value for 704 deals. We set the value of a multipleto missing if the denominator is negative or zero. To reduce the effect of outliers, we set the values of sales and bookvalue (operating cash flow) multiples to 10 (100) if greater than 10 (100). The financials of the public acquisitionfirms is obtained from Compustat. Information on debt structure is from Amir Sufi’s line of credit database. Theperiod of analysis is from 1995 to 2004. Regressions are estimated with an intercept as well as year and industrydummies (not reported). We use a, b, and c to denote that the coefficient estimate is different from zero at the 1%,5%, and 10% levels (two-tailed), respectively.
Enterprise value-to- …
Sales Cash flowsBookvalue
Inverse Mill’s ratio -1.75 -44.20 14.30 a(-0.39) (-1.11) (2.82)
Dummy: Line of credit -0.66 b -2.11 -0.01(-2.31) (-0.67) (-0.04)
Cash flows/(Assets – Cash) -0.95 b -62.74 a -0.06(-2.03) (-5.55) (-0.12)
LN(Assets - Cash) 0.18 a -1.67 a -0.01(3.22) (-3.29) (-0.16)
Tangible assets/Assets 0.82 c -4.22 1.51 a(1.89) (-1.11) (3.14)
Net worth /(Assets – Cash) 0.84 a 8.95 a -1.43 a(3.03) (3.05) (-4.74)
Dummy: Above median Altman’s z-score -0.51 a -3.55 b 0.22(-2.90) (-1.98) (0.92)
Cash flow volatility (industry median) 4.68 b 58.54 a -2.63(2.06) (2.88) (-0.97)
Market-to-book (industry median) 0.91 a 5.89 a 0.89 a(7.89) (5.05) (6.52)
Number of observations 616 489 611
Adjusted R2 42.3% 33.2% 19.7%