creative nation - nesta · creative nation: how the creative industries are powering the uk’s...
TRANSCRIPT

Creative NationHow the creative industries are powering the UK's nations and regions
Juan Mateos Garcia, Joel Klinger and Konstantinos Stathoulopoulos
February 2018

About Nesta
Nesta is a global innovation foundation. We back new ideas to tackle the big challenges of our time.
We use our knowledge, networks, funding and skills - working in partnership with others, including governments, businesses and charities. We are a UK charity but work all over the world, supported by a financial endowment.
To find out more visit www.nesta.org.uk
Acknowledgements
This report benefited greatly from comments and feedback from Hasan Bakhshi and Eliza Easton. Federico Cilauro at Frontier Economics supported our work with the ONS micro-data, and Sergi Martorell and Iain McLaren at GlassAI helped with the GlassAI data. This report’s title is also a nod to Paul Keating’s seminal 1994 report which first alerted national policymakers to the economic significance of the creative industries.
This work contains statistical data from ONS which is Crown Copyright. The use of the ONS statistical data in this work does not imply the endorsement of the ONS in relation to the interpretation or analysis of the statistical data. This work uses research datasets which may not exactly reproduce National Statistics aggregates.

Creative Nation How the creative industries are powering the UK’s nations and regions
Foreword 4
Executive summary 5
Introduction 9
Eight facts about a creative nation 13 Fact 1 The creative industries are a motor of growth in local economies across the UK 13
Fact 2 The creative industries concentrate in a small number of locations – but not 21 just in London and the South East
Fact 3 Although the creative industries are more productive than comparable 27 businesses in regional economies, they will do little to address the productivity crisis unless they scale up significantly
Fact 4 Creative neighbours appear to grow together, not at each other’s expense 33
Fact 5 Creative growth follows a plurality of models 35
Fact 6 The wider creative economy is also stronger in creative clusters 42
Fact 7 Creative research collaborations are taking place locally and nationally 48
Fact 8 Creative communities are interconnected and the diversity of connections 53 increases over time
Conclusion 57
Appendices 59Appendix 1: Data sources 59
Appendix 2: Clustering analysis 60
Appendix 3: Gateway to Research analysis 61
Appendix 4: Meetup analysis 61
Endnotes 63
February 2018
III
I
II

Creative Nation: How the creative industries are powering the UK’s nations and regions
4
Foreword
It is a huge honour to champion the fantastic talent in the UK’s creative industries. They produce cutting-edge music, design, film and more - all of it loved the world over.
We may only have 1 per cent of the world’s population, but British artists accounted for seven of 2016’s top ten best-selling albums around the globe, and an incredible one in every eight album sales.
British creative industries influence global culture for the better, but that’s not all they do. They are an engine of growth across the UK, setting records for investment and output. In January this year new figures showed the amount spent on film production rose 12 per cent year-on-year to a record £1.9 billion, with four of the top five at the box office – The Last Jedi, Beauty and the Beast, Dunkirk and Paddington 2 – based in the UK.
In 2016, almost £92 billion was added to the UK’s economy thanks to the creative industries. They provide two million jobs and are growing at double the average rate of the whole economy. Its strength is spread across the country - from London’s Pinewood studios to Dundee’s thriving video games scene.
I am pleased to see the publication of this report reiterating the importance of the sector. The data will be a valuable resource for policymakers, industry and universities. It will help them inform their initiatives, investment priorities and evaluate the performance of their work.
In government we are working tirelessly to support our creative industries, helping to make a Britain that is fit for the future. We have stepped up our commitment to growing creative clusters in the Industrial Strategy by investing £39 million in eight regional research and development partnerships between academia and business.
I welcome Nesta and the Creative Industries Council’s efforts in producing the Creative Nation mapping report and look forward to working together to keep these industries booming.
Margot James, Minister for Digital and the Creative Industries

Creative Nation: How the creative industries are powering the UK’s nations and regions
5
Executive summary
Context: Creative opportunity...
Digitalisation, competition and automation favour those whose work is easy to scale but hard to imitate and routinise. The creative industries are such an example: they create stories and experiences that can be distributed across multiple media and easily exported; they supply services that enable their clients to stand out in crowded markets, and they rely on talent performing creative and artistic tasks that are hard to replace with robots and algorithms.
The sector is already a vital part of the UK’s economy, growing twice as fast as other sectors and employing over two million people. Technological developments like 5G connectivity, augmented reality and widespread artificial intelligence create further opportunities. This is why the Government has acknowledged the creative industries as a strategically important sector in its Industrial Strategy.
...but will it be realised?
But do all regions in the UK stand to benefit from future creative growth, or will the rewards be reaped by just a few locations in London and the South East of England? Policymakers are rightly concerned about geographical imbalances in the UK economy: might these be exacerbated by growth in creative industries that have tended to concentrate in a small number of places? There are also questions about the sector’s contribution to productivity, another big challenge for UK policymakers. Intangible creative outputs may be easy to scale, but that same intangibility makes it harder for firms to appropriate the benefits and raise finance, thereby constraining the sector’s productivity growth.
UK policymakers have recognised these opportunities and challenges: initiatives like the AHRC’s Creative Clusters Programme, supported by the Government’s Industrial Strategy Challenge Fund, seek to address them by investing in the development of strong creative clusters outside London and the South East. In order to be successful, however, policies to support growth in the creative industries across the UK must be built on evidence – and this is what Creative Nation sets out to provide.
About this report
Creative Nation uses official, open and web data to map the creative industries in the UK: their evolution, contribution to local economic development, the strength of their support ecosystems – including research and networking – and their connections with each other. The report presents eight key findings based on our analysis of the data, and is accompanied by an open dataset and interactive visualisations to help users explore the data.

Creative Nation: How the creative industries are powering the UK’s nations and regions
6
Eight key findings
The creative industries are a motor of growth in local economies across the UK, and not just in London and the South East of England. Regions from the South West, to Yorkshire and the Humber, to the West Midlands are also experiencing the benefits. Between 2011-2014 and 2015-2016, the creative industries in the average local economy increased by 11 per cent, twice as fast as in the rest of the economy. There has also been an explosion of creative entrepreneurship: almost nine in ten local economies grew their creative business population over this period, and 83 per cent grew it faster than in other sectors.
The creative industries concentrate in a small number of locations: 53 per cent of employment and 44 per cent of businesses are found in the top five locations (the equivalent percentages in other sectors are 32 per cent and 30 per cent respectively). Overall, creative industries employment has become more concentrated over time, mirroring developments in the wider economy. We detect a similar pattern when we look at the creative industries within UK regions and nations, showing that leading cities attract most of the activity, from Manchester in the North West of England to Bristol in the South West, Cardiff in Wales, and Glasgow and Edinburgh in Scotland.
Although creative businesses are more productive than comparably sized businesses, they will not materially contribute to addressing the UK’s productivity problems unless they scale-up significantly. When we control for size, creative businesses tend to be more productive than companies in other sectors in almost all parts of the country. For example, creative businesses with fewer than ten employees have a Gross Value Added (GVA) per worker of £46,000, 20 per cent higher than similarly sized businesses in other sectors. Ninety-four per cent of the companies in the sector are, however, micro-businesses (10 per cent more than in other sectors), which limits the sector’s ability to lift regional productivity. Growth in the sector will have the biggest economic impact if it is accompanied by an increase in the number of scale-up businesses with higher productivity growth.
Regional rivals should work together to grow their creative industries: Regional creative growth appears not to be a zero-sum game, particularly when it comes to business numbers. For example, locations that saw their neighbours become more specialised in IT, software and computer services were almost 80 per cent more likely to become more specialised in that sub-sector too. Local policymakers may need to coordinate their support actions to maximise their impact on the UK’s creative industries.
1
2
3
4

Creative Nation: How the creative industries are powering the UK’s nations and regions
7
Not all creative clusters grow in the same way: Creative business growth is not just about high-growth firms, and creative cluster development follows a variety of models. New firms, it turns out, are more important for net job creation in the creative industries than in other sectors. Although high-growth firms in the creative industries account for a larger share of businesses with more than ten employees than in other sectors (8.5 per cent versus 5 per cent), they tend to create proportionately fewer jobs, consistent with there being barriers to growth.
When we segment creative clusters into different development models, we identify five types:
I. Incipient clusters, such as Liverpool and Middlesbrough, with lots of new entrants, but low creative business survival rates.
II. Creative Conurbations, such as Cambridge and Guildford, that are specialised in fewer sub-sectors and with more stable trajectories, including strong business creation by high-growth firms.
III. Creative Districts, primarily in the South East of England, with many different sub-sectors and micro-businesses, high survival rates and fewer high-growth businesses.
IV. Creative capitals, some of the biggest creative cities in the UK including London, Manchester and Reading, with more large businesses and high-growth businesses.
V. Creative challengers outside London and the South East, including large cities such as Birmingham, Sheffield, Newcastle, Edinburgh and Cardiff, which have experienced fast creative growth in recent years and are on track to become central nodes within the UK’s creative geography.
The wider creative economy is also stronger in creative clusters: Our analysis of website data scraped by GlassAI, a big data startup, suggests that companies in non-creative industry sectors operating in creative clusters tend to be more creative too. More than two-thirds of the locations specialising in the creative industries also have a tendency to embed creativity more widely in other sectors. By contrast, only 13 per cent of places without a creative specialisation do the same. We find that Brighton is the creative cluster with the most widely embedded creativity in non-creative industries.
UK universities connect with creative industries locally and nationally: Research collaborations between universities and creative industries supported by Research Councils UK and Innovate UK are growing over time, with funding levels more than doubling between 2006 and 2017. Universities are collaborating with creative industries in their locality, in neighbouring areas and in other parts of the UK, suggesting that UK universities have a role not only in helping develop creative clusters around them, but also linking up others farther apart.
5
6
7

Creative Nation: How the creative industries are powering the UK’s nations and regions
8
Creative communities are interconnected and the diversity of connections increases over time: We have identified 1,700 creative meetups in the UK with participation of over 180,000 unique individuals. These communities interact locally and with those around them forming hubs of activity in Advertising and Marketing in the West Midlands, Crafts and Making in the North West, and Design across the South West and Wales. In general terms, creative communities in different sub-sectors are becoming more interconnected, something which bodes well for unexpected ‘crossover’ innovations.
Implications
Our results confirm that the creative industries have a good deal of potential to further support employment growth and entrepreneurialism right across the UK. The sector has expanded faster than others in most local economies, beyond London and the South East, and there are locations with strong critical masses of employment and business activity in every region and nation. The fact that creative growth in a location appears to benefit its neighbours is consistent with the idea that investments in these creative hubs might also pull up the local economies around them, while the relation between creative industries clustering and wider adoption of creative practices in businesses suggests that those investments might also make other sectors more productive too.
Notwithstanding these opportunities, the creative industries are unlikely to make a dent in the UK’s productivity problem unless policymakers can increase the number of high productivity growth scale-up businesses.
But to do this, they will need to pay critical attention to local context. Different locations across the UK follow a multitude of cluster development models, and what works in one location might not necessarily work elsewhere. The analysis, data and interactive visualisations we are releasing together with Creative Nation serve as a resource to design, target and monitor such spatially aware policies.
8
Creative Nation: How the creative industries are powering the UK’s nations and regions
9
I
Introduction
1. The challenge: to realise the growth potential of the UK’s creative industries for the benefit of more people and places
The UK’s creative industries keep growing at breakneck pace. According to the latest statistics from the Department for Digital, Culture, Media and Sport (DCMS), the number of jobs in the sector grew 4.5 per cent times faster than in the economy overall between 2011 and 2016, while their contribution to value added growth grew twice as fast between 2010 and 2015.1
This is good news for the UK: the creative industries produce intangibles – new stories, ideas and code – that can be rapidly scaled-up and widely diffused.2 Their creativity helps businesses in other sectors differentiate their products through design and advertising.3 The focus on creating something new and unpredictable makes creative talent harder to replace with robots and algorithms. As a result, creative jobs are more resilient to automation.4 The sector is export intensive, an important consideration in the context of Brexit.5 All this explains why the UK government identified the creative industries as a strategically important sector in its Industrial Strategy.6
But the growth the creative industries has experienced is not without its problems: the same properties of creativity that make it hard to automate also act to keep creative businesses small and unproductive. In particular, the open-ended nature of creative projects and intangible nature of their outputs hinders access to finance and puts a premium on adaptability - an attribute more often found in smaller organisations.7 High levels of uncertainty and knowledge spillovers favour places that already have a critical mass of businesses learning from each other and favourable support ecosystems, and this leads to concentration in creative activity. The risk, increasingly recognised by policymakers, is that a handful of the most developed creative clusters leave the rest of the country further behind.8
How can we avoid a creative divide, and realise the growth potential of the UK’s creative industries for the benefit of more people and places?
Policymakers at the national, regional and local levels are all looking for answers. In the UK, the Creative Industries Council, which brings together government and industry leaders, has a Working Group dedicated to this issue.9 The Arts and Humanities Research Council (AHRC), with support from the Government’s Industrial Strategy Challenge Fund, has introduced a Creative Clusters Programme to strengthen creative clusters across the UK.10 Many other organisations, such as Creative England, the British Film Institute, Ukie, the Crafts Council and Design Council, Local Enterprise Partnerships, universities, cluster networks and trade bodies are helping to shape creative industries policy, supporting creative businesses that are adopting new technologies and business models, learning from each other and seeking finance to scale-up.
All these organisations need good data to do their jobs.

Creative Nation: How the creative industries are powering the UK’s nations and regions
10
2. Our approach: address the practical data needs of creative industries and policymakers
In recent years, Nesta has undertaken a number of research projects which map the UK’s creativity and innovation. In these projects, we have made the most of new data sources, analytics and data science tools and interactive visualisations to map and monitor industrial activity and inform policy. Some examples of this work include Creative Clusters and Innovation (2010), A Map of the UK Games Industry (2014), The Geography of the UK’s Creative and High-Tech Economies (2015), The Geography of Creativity (GoC) (2016) and our 2017 interactive maps of museums in England and London’s clubbing scene.
This work has been of use to a diverse group of audiences working nationally, regionally and locally. In Creative Nation, we further seek to address their needs through three outputs:
• This report, which presents eight facts about the UK as a creative nation that we think are particularly pertinent to ongoing policy debates. It gives the ‘big picture’.
• A prototype dashboard, where local stakeholders can interact with the data about their own locations. This gives the ‘local picture’ in a way that can be benchmarked against other areas.11
• An open dataset, where anyone can explore their own questions, and mix and match it with other data to create new knowledge about the UK’s creative industries and their geography.12
All the code we have written for data processing, analysis and visualisation is available on GitHub.13

Creative Nation: How the creative industries are powering the UK’s nations and regions
11
3. Our method: Embrace data diversity to gain a holistic view of a creative nation
What data do we use?
We combine official, open and web data to characterise the UK’s geography of creativity (see the Appendix and relevant sections of the report for more detail).
• Official data sources provide estimates of important economic variables such as employment, the number of businesses and Gross Value Added in the creative industries and their constituent sub-sectors, based on the DCMS creative industries classification.14 We also use these data to analyse the growth dynamics of the creative industries: their survival rates, and how growth differs across sub-sectors and different company sizes. A caveat is that anonymised official data are subject to strict disclosure rules to prevent the identification of individual companies. This means that sometimes they are not available for smaller sub-sectors and/or locations.
• Academic research in universities and its diffusion into industry is important for the success of the creative industries. We use the Gateway to Research, an open dataset of Research Councils UK and Innovate UK-funded projects, to map research collaborations between academia and creative businesses.15
• The wider creative economy (which includes in its scope creative workers working outside of the creative industries) is hard to study with official business data that classifies companies into a single sector. We have therefore partnered with GlassAI, a big data startup that collects web data on hundreds of thousands of UK businesses in all sectors, to overcome this challenge. We have also analysed data from Meetup.com, a website used to organise networking events, to look at connections between creative communities in different parts of the UK, and to measure the diversity of different creative ecosystems.
At what level of analysis?
Wherever possible, we analyse the geography of the UK’s creative industries using Travel To Work Areas (TTWAs), an official geography capturing local labour markets – the locations where people live and work.16 While they have their own limitations – not least that they do not capture innovation clusters at the hyperlocal level – these geographies are often used for the analysis of industrial clusters because their definition is based on economic rather than administrative or policy factors.17 They balance detail (there are 228 of them, enabling the analysis of locally specific situations inside large regions) and aggregation (they tend to be large enough to avoid disclosing the identities of individual companies inside them).18
However, not all our data are available at the TTWA level. In particular, the Annual Business Survey, which we use to analyse labour productivity, is too small to be representative at that level of geographical resolution. In this case, we report our findings at the level of English Regions and Devolved National Administrations.

Creative Nation: How the creative industries are powering the UK’s nations and regions
12
Who do we study?
In our analysis of official data, we focus on business enterprises to maintain consistency with our previous analysis in The Geography of Creativity. The picture is very similar when measuring activity with local business units, however.
In some instances, we pay particular attention to the 48 creative clusters identified in The Geography of Creativity based on their levels of creative specialisation and growth.19 These clusters capture 82 per cent of the UK’s creative industries employment and 75 per cent of creative businesses. Since they concern large locations, they have more data to them which are also expected to be more robust (as the sample sizes of the surveys used to collect them tend to be bigger).
Caveats
This report does not do everything, and the analysis that we present is not without its limitations.
• The official data we use does not capture freelancers and self-employed workers which we know are very important in the UK’s creative industries and are included in the national jobs figures about the sector. The reason for this is that the Annual Population Survey, one of the main official sources of data about freelancers in the UK and the basis of the DCMS’s employment estimates, has sample sizes which are too small for reporting TTWA-level statistics in most locations.
• The data we use captures business organisations. It does not include the activities of not-for-profits, charities and public sector organisations which we know are a vital component of the UK’s creative clusters.20
• The Interdepartmental Business Register (IDBR), the dataset we use to measure creative industries employment and number of businesses, is an administrative dataset, and is not therefore expressly collected for economic analysis. We have not used the Office for National Statistics’ Business Register Employment Survey (BRES) in the report, due to a change in its sampling frame in 2015 that introduces a break in the series which makes it difficult to look at longer run trends, nor can we straightforwardly average data across years. The latter is an important limitation as averaging across years helps to remove noise in sample survey-based estimates, especially in local situations and at the sub-sectoral level. Consistent with this, we have averaged our IDBR-based estimates across multiple years. Reassuringly, our main findings are unchanged when we replicate the mapping using BRES data for 2015 and 2016.
• As previously mentioned, for reasons of disclosure at the TTWA level in some of our datasets we have had to exclude from our analysis some important smaller locations and creative sub-sectors such as Crafts and Museums & Libraries. We recognise the significance of these sub-sectors in many creative clusters, however, and include data about their numbers of businesses and employment available from BRES (where disclosure rules do not preclude publication) in the open datasets we are publishing alongside this report.
• As we have already suggested, our analysis of local activity at the TTWA level could mask significant levels of variation inside TTWAs. A high priority for our future research is to use datasets that allow us to map the micro-geography of the creative industries in the UK.
More generally, before we present our findings, we want to emphasise that Creative Nation is a resource for the creative industries that is in continuous development, and we intend to develop and extend it as we explore new data sources and undertake new analysis, including addressing the limitations we discuss above. In the conclusion, we indicate some priorities for future work which we are especially keen to tackle.

Creative Nation: How the creative industries are powering the UK’s nations and regions
13
II
Eight facts about a creative nation The data we have collated allow us to characterise the UK’s geography of creativity along a large number of dimensions. In this report, we focus on a small number of questions which, experience suggests, are particularly important to consider when understanding creative clusters.21 We use the data to present eight key facts.
Fact 1
The creative industries are a motor of growth in local economies across the UK
Why does this matter?
Are the UK creative industries expanding in only a small number of locations, or is their growth more broad-based? Answering this question can help us determine if the creative industries represent a growth opportunity for many local economies, or just for a few.
Creative growth trends: the local picture
The UK’s creative industries are growing rapidly, the public seemingly having an insatiable appetite for consuming creative content across an expanding range of media, and businesses increasingly seeking to differentiate their offerings through better design and advertising.
But what is the picture at the local level? Will growth in household and business demand at the aggregate level translate into new jobs and value added across the UK, or only in London and the South of England?
Creative Nation shows that the creative industries present an economic opportunity for all of the UK. To make this point in quantitative terms, we have looked at changes in creative industries employment and number of businesses between 2011-2014 inclusive and 2015-2016 for each TTWA, and compared this with the performance of the rest of the local economy. In Figure 1, the yellow bars represent creative industries rates of growth or decline over this period, and the blue and red bars show what happened in other sectors (we use blue in situations where they grew more slowly than the creative industries, and red if it was the other way around). The green horizontal lines show mean creative industries employment and business growth.

Creative Nation: How the creative industries are powering the UK’s nations and regions
14
Figure 1 confirms that the creative industries are a motor for growth for many local economies across the UK. For example:
• Creative industries employment in the median TTWA increased by 11 per cent (twice as fast as in the rest of the economy). Eighty-two per cent of TTWAs experienced growth in creative industries employment, and in 67 per cent of TTWAs it grew faster than did employment in other sectors.
• The number of creative businesses in the median TTWA increased by 12 per cent (compared with 7.4 per cent in the wider economy). Eighty-nine per cent of TTWAs experienced growth in creative business counts, and in 83 per cent of TTWAs they grew faster than in other sectors.
Figure 1: Creative employment and business counts have grown faster than the local economy in most locations
Source: ONS, Interdepartmental Business Register; Nesta analysis.
Employment% growth2011-2014between
2015-2016
Business count% growth2011-2014between
2015-2016
80
60
40
20
0
-20
-40
40
30
20
10
0
-10
-20
-30
-40
Creative growth Creative growth (mean)
Other sector growth (slower than creative) Other sector growth (faster than creative)

Creative Nation: How the creative industries are powering the UK’s nations and regions
15
In Figure 2, we present the same data but grouped in English regions or Devolved National Administrations, and consider growth in absolute terms. In this case, the red bars denote if creative industries employment or the number of creative businesses increased by more than the UK average, orange if they increased but by less than the UK average, and blue if they
decreased. We have arranged the regions and devolved administrations by the total levels of employment jobs they created – London and the South East are, as might be expected given their size, first, followed by Yorkshire and the Humber, the North West of England and the West Midlands.
Figure 2: Employment and business growth by TTWAS in region/nation (2011-2014 to 2015-2016)
UK mean creative growth
Creative growth above UK mean
Creative growth below UK meanbut above 0
Creative growthnegative
Employmentgrowth
London South East North West West Midlands South West East of England Scotland East Midlands North East Wales Northern IrelandYorkshire andThe Humber
Businessgrowth
80,000
70,000
60,000
50,000
40,000
30,000
20,000
10,000
0
17,500
15,000
12,500
10,000
7,500
5,000
2,500
0
800
700
600
500
400
300
200
100
0
700
600
500
400
300
200
100
0
600
500
400
300
200
100
0
500
400
300
200
100
0
350
300
250
200
150
100
50
0
350
300
250
200
150
100
50
0
200
150
100
50
0
1,000
800
600
400
200
0
500
400
300
200
100
0
1,600
1,400
1,200
1,000
800
600
400
200
0
1,000
800
600
400
200
0
5,000
4,000
3,000
2,000
1,000
0
3,500
3,000
2,500
2,000
1,000
500
0
3,500
3,000
2,500
2,000
1,000
500
0
4,000
2,000
0
-2,000
-4,000
-6,000
3,000
2,500
2,000
1,500
1,000
500
0
1,600
1,400
1,000
800
600
400
200
0
1,000
800
600
400
200
0
700
600
500
400
300
200
100
0
1,250
1,000
750
500
250
0
-250
7,000
6,000
5,000
4,000
3,000
2,000
1,000
0
14,000
12,000
10,000
8,000
6,000
4,000
2,000
0
Source: ONS, Interdepartmental Business Register; Nesta analysis.

Creative Nation: How the creative industries are powering the UK’s nations and regions
16
Consistent with Figure 1, Figure 2 shows that most TTWAs experienced positive growth in terms of creative industries employment and the number of businesses. Interestingly, most regions and Devolved National Administrations had a handful of ‘creative leaders’ experiencing very fast growth, and the rest of the TTWAs grew more slowly (we revisit this issue when talking about creative concentration in Fact 2 (concentration)). Strong declines in activity have been rare, with the exception of Peterborough, a creative cluster with a strong specialisation in Publishing and concentration of activity in a small number of large businesses.
Table 1 below identifies TTWAs growing faster than the UK average in terms of creative industries employment and businesses in each region and Devolved National Administration.
Table 1: Changes in employment and growth in TTWAs growing faster than the UK average (2011-2014 to 2015-2016)
TTWA Region/Nation Employment change Business count change
London London 77962 17330.5
Reading South East 13264 787.5
Manchester North West 7474.75 1617.5
Leeds Yorkshire and The Humber 4984.5 512.5
Luton East of England 4658.5 1005.5
High Wycombe and Aylesbury South East 3555 436
Birmingham West Midlands 3434 1052.5
Bristol South West 3366.75 685
Edinburgh Scotland 2878.25 651
Cambridge East of England 1967.25 492.5
Southend East of England 1872.25 351.5
Newcastle North East 1554.25 375
Oxford South East 1368.75 318
Brighton South East 1328.75 465
Glasgow Scotland 1319.5 644.5
Leicester East Midlands 1298.25 550.5
Eastbourne South East 1257.5 212
York Yorkshire and The Humber 1165.75 217.5
Portsmouth South East 1067.5 211.5
Crewe North West 1043.5 213
Coventry West Midlands 1016 305.5
Nottingham East Midlands 996.5 343
Cardiff Wales 965.25 374
Liverpool North West 963.75 302.5
Milton Keynes South East 878.25 781.5
Medway South East 839.25 270.5
Crawley South East 822.25 595
Sheffield Yorkshire and The Humber 809.25 271.5
Source: ONS, Interdepartmental Business Register; Nesta analysis.

Creative Nation: How the creative industries are powering the UK’s nations and regions
17
The violin plots in Figure 3 display the share of creative employment and number of businesses by region or nation in 2015-2016. They show that the creative industries represent a bigger share of local businesses than employment almost everywhere (this is consistent with the fact that creative businesses tend to be smaller than those in other sectors, an issue we explore further in Fact 3 (productivity and size)).
They also show that creative industries tend to be relatively larger in London’s economy, the South East and the East of England than in other regions and nations – although there is (sometimes wide) variation inside regions and nations. For example, although the median creative industry shares in Scotland are lower, there are outliers with large shares of creative activity like Glasgow and Edinburgh, where the shares of creative employment in the local economy are 2.9 per cent and 2.5 per cent respectively compared with a Scottish median of 1.4 per cent, and the shares of creative businesses are 8.4 per cent and 11.3 per cent compared with a Scottish median of 3.3 per cent). We see the same thing in the South West of England in Bristol and Bath, where the shares of creative employment are 3.8 per cent and 3.6 per cent versus a South West median of 2.2 per cent, and creative business shares are 10.2 per cent and 11.6 per cent compared with a South West median of 6.2 per cent).
Figure 3: Share of creative employment and business activity by region or devolved national administration
Share of employment
(%)
10
8
6
4
2
012.5
10
7.5
5
2.5
Share of businesses
(%)
Lond
on
South East
East of E
ngland
South W
est
York
shire
and
The H
umber
East M
idlands
Wes
t Midland
s
North W
est
Scotla
nd
Wales
North East
North East
Source: ONS, Interdepartmental Business Register; Nesta analysis.
Regional and national differences are also visible in Table 2, where we present experimental estimates of local creative industries GVA based on a combination of regional Annual Business Survey data and information about the size distribution of creative businesses locally (see the Appendix for more detail on how we have calculated these estimates and why they are experimental in nature). In addition to showing the importance of the sector in London (with a contribution to the economy of almost £30 billion), we also see the creative

Creative Nation: How the creative industries are powering the UK’s nations and regions
18
industries making substantial value added contributions to other local economies outside of the South East such as Manchester and Birmingham, although in both cases the share of total GVA accounted for by creative businesses is lower.22
Table 2: Experimental creative industries GVA estimates (top 20 TTWAs by £GVA)
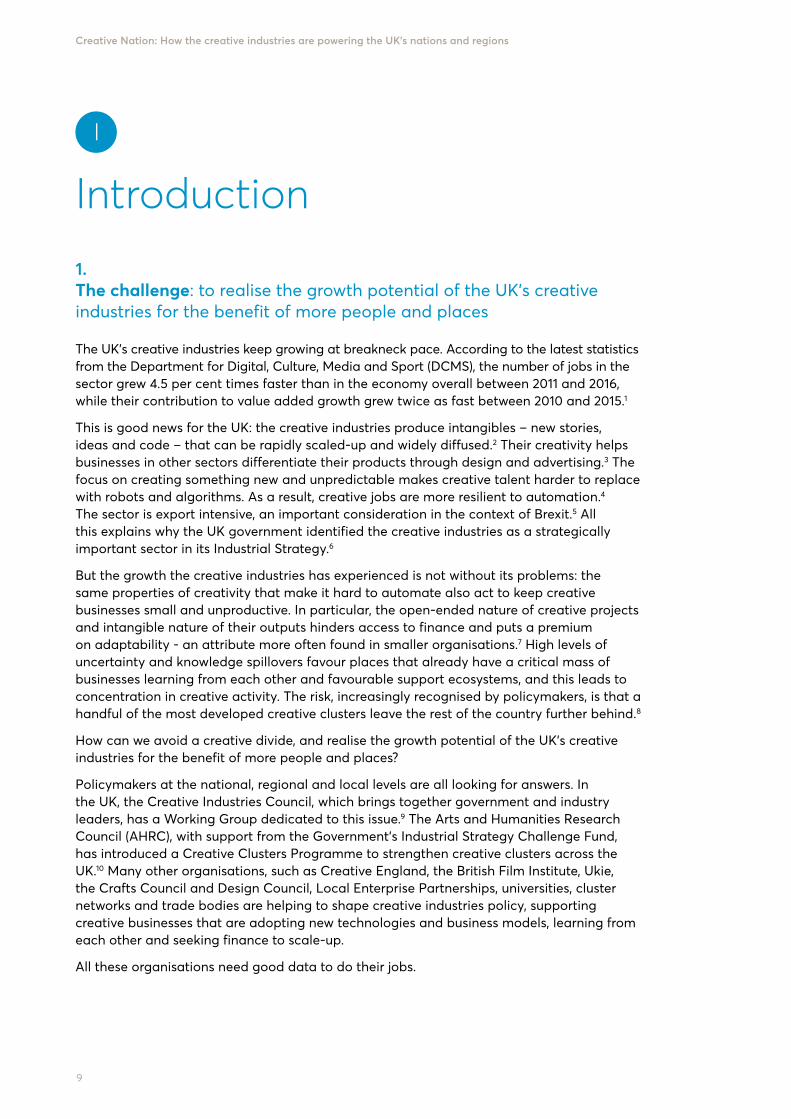
Finally, in Figure 4 we present employment and business growth by creative sub-sector and by English region/nation. We use the colour and size of the circles to denote if a TTWA in a region grew or declined and by how much (we categorise absolute growth in deciles over the distribution of growth in all TTWAs for the variable to prevent the scale of growth in London from dominating all the charts). For example, when we look at all creative industries employment in the South East, we see that the majority of TTWAs there have grown (most of the circles are above one, and red), and that this growth has been relatively strong in absolute numbers (the size of the circles is big). Compare this with the East of England, where several TTWAs have seen a decline in employment, or Wales, where there has been general growth, but the absolute numbers of jobs created are lower (the circles are smaller). The green line at the bottom of each chart shows the mean TTWA growth in each variable and sub-sector. The chart suggests that creative services sub-sectors such as IT, software and computer services, Design, and Advertising have been more dynamic in terms of employment growth. Average employment growth has been lower in sub-sectors such as Film, radio and TV and, particularly, Publishing (although even in these sub-sectors there are examples of TTWAs experiencing rapid growth, such as Bury St Edmunds in Radio and TV, and Worcester and Kidderminster in Publishing).
Creative GVA Creative GVA Region/Nation (Million £) (per cent of total)
London 29,102.23 11.69 London
Slough and Heathrow 3,236.37 8.07 London
Manchester 1,459.40 3.74 North West
Reading 1,051.07 10.38 South East
Birmingham 1,004.60 4.48 West Midlands
Guildford and Aldershot 995.68 8.11 South East
Oxford 739.82 6.92 South East
Crawley 602.30 5.04 South East
Southampton 522.70 4.23 South East
Glasgow 508.33 3.37 Scotland
Bristol 496.36 4.94 South West
High Wycombe and Aylesbury 490.95 6.89 South East
Leeds 490.05 5.17 Yorkshire and The Humber
Edinburgh 488.83 5.37 Scotland
Cambridge 473.56 5.71 East of England
Brighton 433.54 7.64 South East
Milton Keynes 432.56 6.51 South East
Luton 396.79 5.4 East of England
Medway 328.63 3.7 South East
Tunbridge Wells 313.41 5.92 South East
Source: ABS (2017)
Creative Nation: How the creative industries are powering the UK’s nations and regions
19
Figure 4: Creative sub-sector growth, 2011/2014-2015/2016
London
South East
Yorkshire and The Humber
North West
West Midlands
South West
East of England
Scotland
East Midlands
North East
Wales
Northern Ireland
London
South East
Yorkshire and The Humber
North West
West Midlands
South West
East of England
Scotland
East Midlands
North East
Wales
Northern Ireland
All creative industries IT, software and computer services
Film, TV, video, radio and photography
Advertising and marketing
Publishing Music, performingand visual arts
Architecture Design: product, graphicand fashion design
Employment change
Business count change
Decile 1 in employment/business number
Decile 5 in employment/business number
Top decile in employment/business number
Growth in variable
Decline in variable
Mean growth
Mean growth
Mean growth
Mean growth
Mean growth
Mean growth
Mean growth
Mean growth
Mean growth
Mean growth
Mean growth
Mean growth
Mean growth
Mean growth
Mean growth
Mean growth
0.5 1.51
0.75 1.251 0.75 1.25 1.51 0.75 1.25 1.51 0.75 1.25 1.510.75 1.251 0.75 1.251 1.511.25 1.51
1.51 2.5 7.550 0 1 2 0 2 4 6 1 2 3 4 1 2 3 4 1 1.5 2
Source: ONS, Interdepartmental Business Register; Nesta analysis.

Creative Nation: How the creative industries are powering the UK’s nations and regions
20
What’s the takeaway?
The creative industries present a real opportunity for local economic development across the UK, and not just in London and the South of England – we identify fast-growing creative leaders in all regions and nations. Creative services sub-sectors like IT, software and computer services, Advertising and marketing and Design have been particularly adept at growing employment, while the expansion in creative business activity is broad-based in terms of sub-sectors.
Having said this, the creative industries are smaller in relative terms outside London and the South of England. Transforming the sector into a sustainable source of employment growth will likely be that much harder in locations where they currently account for a small share of the local economy.
Creative Nation: How the creative industries are powering the UK’s nations and regions
21
Fact 2
The creative industries concentrate in a small number of locations – but not just in London and the South East
Why does this matter?
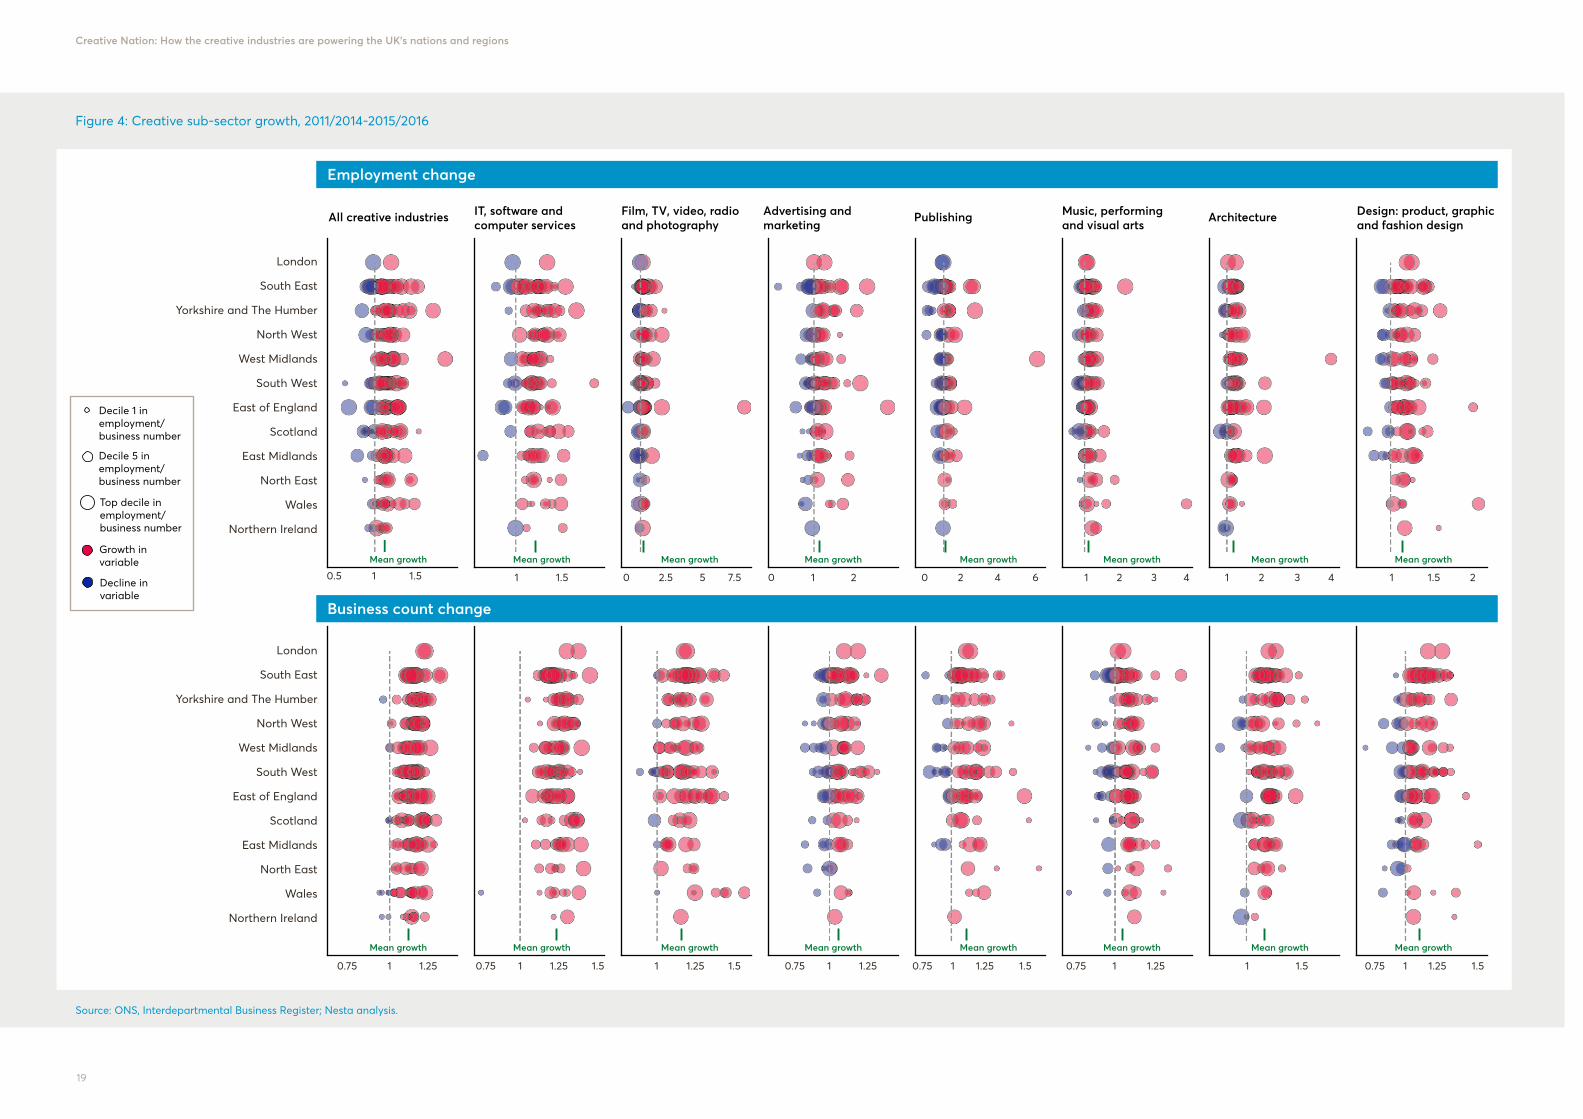
Many worry that growth in the UK’s creative industries comes at the expense of greater geographical inequality. It is important to understand if this has been the experience and, if so, in what sub-sectors, to inform policies to help counteract this tendency.
The geography of creativity is spiky
In their Atlas of British Industry, researchers at the Centre of Economic Performance (CEP) at the London School of Economics report that the creative industries are highly geographically concentrated, even more so than financial services.23 This result should not be so surprising: many factors lead creative businesses to congregate in a small number of creative clusters, including that creative talent tends to insure itself against market uncertainties by locating in places with high levels of creative activity. Furthermore, co-location facilitates collaboration and knowledge exchange, making businesses in creative clusters more competitive, and proximity to clients and audiences helps firms gauge changes in demand and secure new business more easily.
To examine this phenomenon, we calculate for each TTWA and creative sub-sector, as well as the creative industries in aggregate, location quotients that compare the level of creative activity in a TTWA compared with the UK average, therefore capturing if the location is relatively specialised or not in that sub-sector.24 Figures 5 and 6 present findings for TTWAs that are above the UK median in terms of creative industries employment and business count, and have location quotients above one. We classify the latter into deciles (top 10 per cent, second 10 per cent etc.) to make the data easier to visualise in the face of extreme values.
The results are consistent with the Atlas of British Industry’s findings, although with some twists. When, like the CEP, we consider the creative industries as a whole, we find that most of the employment is concentrated in London, the South East and the South West (including Penzance in Cornwall, where creative industries concentration is driven by high levels of activity in Radio, TV and Film). The situation is similar when we look at number of businesses, with Edinburgh now also being prominent. However, if we focus on specific sub-sectors, we detect noticeable hotspots in other parts of the UK too, such as Advertising and marketing in the North West of England, Publishing in the Midlands and the East of England, and Design in the Midlands.
In Figure 7, we show what this means in terms of concentration levels and their evolution. The top panel displays the share of creative employment and businesses represented by the biggest locations. It shows that in 2015-2016, 53 per cent of the employment and 44 per cent of the business activity concentrated in the top five TTWAs (the equivalent figures for non-creative industries were 32 per cent and 30 per cent). The fact that creative business

Creative Nation: How the creative industries are powering the UK’s nations and regions
22
activity is less concentrated than employment is consistent with the tendency that larger creative employers tend to congregate in a small number of places while smaller employers are more geographically dispersed.
The lower panel considers changes in the share of creative employment and business activity accounted for by TTWAs in different points in the size distribution (e.g. how did the share of creative employment represented by the top five companies change between 2011-2014 and 2015-2016?). It shows that creative employment became even more concentrated between 2011-2014 and 2015-2016. For example, the share of creative employment accounted for by the top five areas increased by 1.5 per cent.
This increase in employment concentration matches what we see in other industries (see the overlap between the triangle we use to denote creative industries and the square which represents other industries). We also see increases in concentration in creative business counts, although spread over a wider number of locations. Interestingly, however, concentration in creative business activity has grown much more slowly than what we see in other sectors, possibly as a consequence of the widespread expansion in creative business activity we documented in Fact 1.
As before, we see striking differences in concentration across creative sub-sectors, with, for example, Advertising and marketing and Radio and TV much more geographically concentrated than IT and computer software services. Intuitively, this may reflect the fact that these sub-sectors thrive on their proximity to clients (including broadcasters) in larger cities. Sub-sectoral differences are also apparent when viewing changes in concentration across time: there have been rapid increases in employment (and to a lesser degree business count) concentration in IT, software and computer services (driven mainly by the growth in the sub-sector in London), while creative employment in Publishing has become less concentrated, potentially reflecting the comparative decline of large, established clusters like Peterborough.
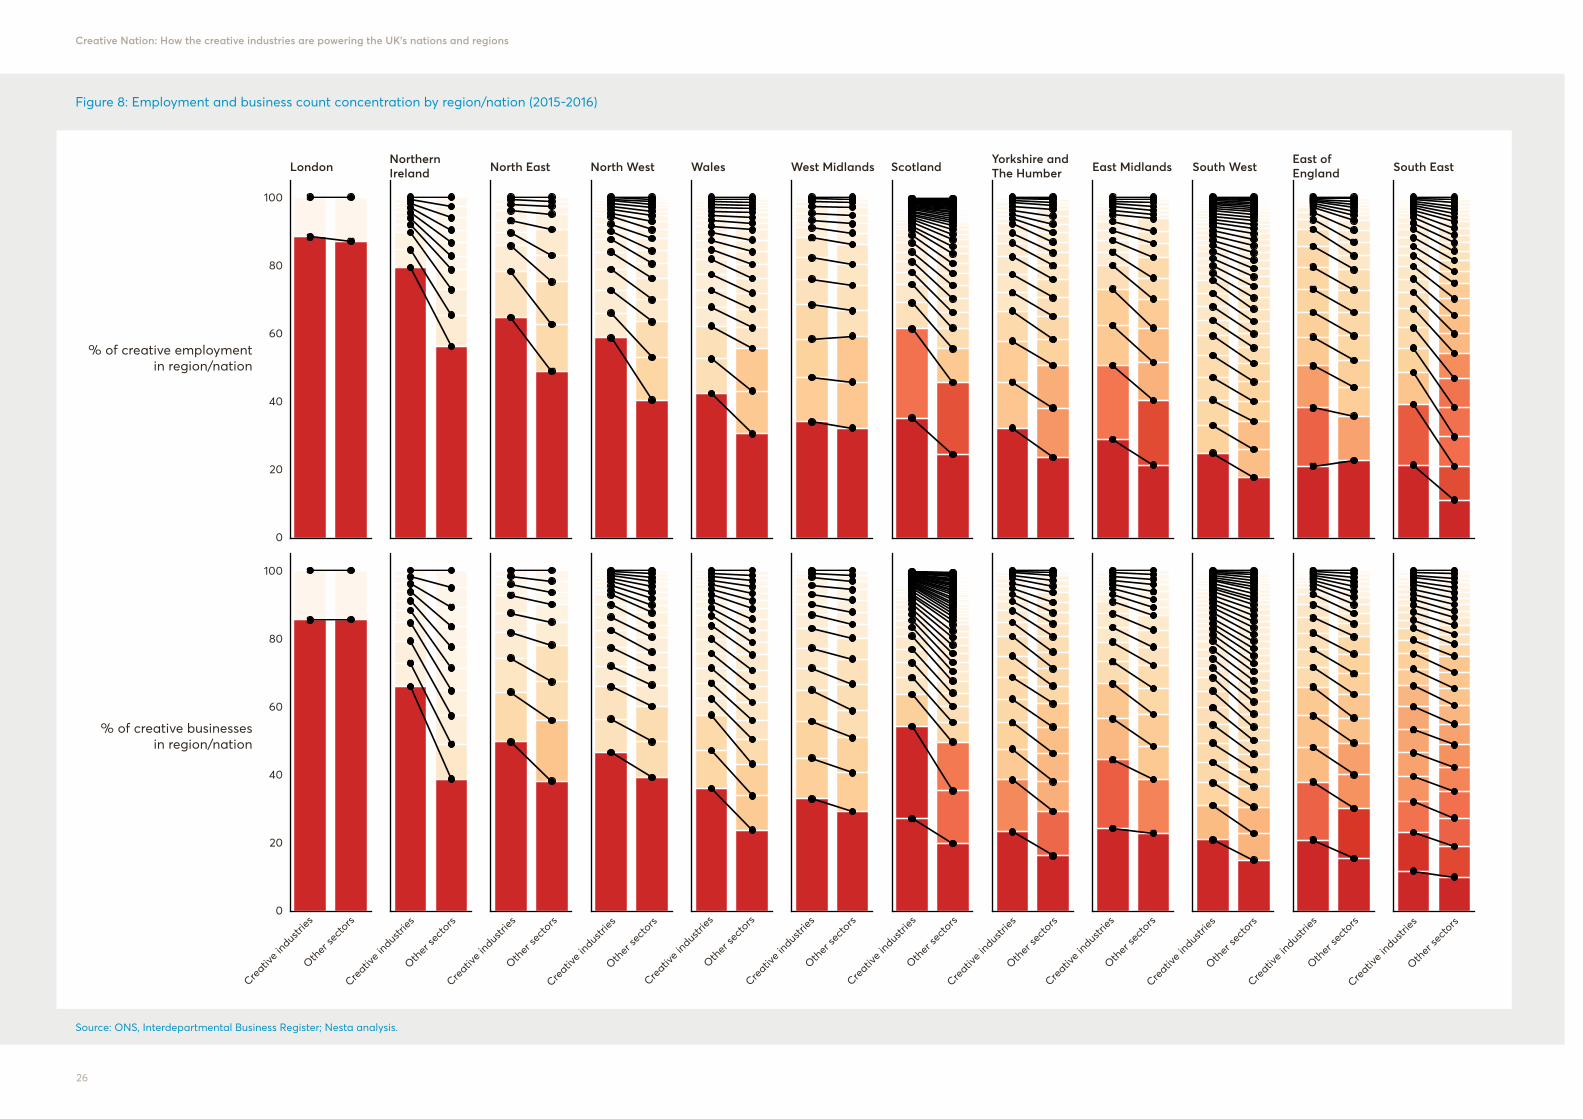
Creative concentration fractals
Strikingly, the tendency towards concentration that we witness nationally is also visible when we zoom into individual regions and nations. In Figure 8, we look at the distribution of creative industries employment and business counts inside each of these regions and Devolved National Administrations, and compare it with what we see in other industries. We see that generally, one (or, in the case of Scotland, two) TTWAs capture the lion’s share of creative industries employment and business activity in each region and nation. This is particularly visible in Northern Ireland (with Belfast), the North East (Newcastle), the North West (Manchester), Wales (Cardiff) and the West Midlands (Birmingham), some of the regions and nations where, as we saw in Fact 1, the creative industries, on average, account for a smaller share of the economy.25 The main exception to this pattern of concentration is the South East of England, where the geography of the sector is more evenly distributed. Have several clusters in the South East reached a critical mass preventing a single place from becoming dominant, or do its clusters specialise in different creative sub-sectors? We address these questions in Fact 4 (co-location of cluster growth) and Fact 5 (growth dynamics in clusters) below.

Creative Nation: How the creative industries are powering the UK’s nations and regions
23
Figure 5: Creative employment agglomeration (2015-2016)
Advertising andmarketing
Architecture
IT, software and computer services
Publishing
All creative industries
Design: product, graphic and fashion design
Film, TV, video, radioand photography
Music, performingand visual arts
1 2 3 4 5 6 7 8 9 10
Location quotient decile (only if LQ>1) and location above median of activity in sector
Source: ONS, Interdepartmental Business Register; Nesta analysis.

Creative Nation: How the creative industries are powering the UK’s nations and regions
24
Figure 6: Creative business agglomeration (2015-2016)
Advertising andmarketing
Architecture
IT, software and computer services
Publishing
All creative industries
Design: product, graphic and fashion design
Film, TV, video, radioand photography
Music, performingand visual arts
1 2 3 4 5 6 7 8 9 10
Location quotient decile (only if LQ>1) and location above median of activity in sector
Source: ONS, Interdepartmental Business Register; Nesta analysis.

Creative Nation: How the creative industries are powering the UK’s nations and regions
25
Figure 7: Levels and changes in creative industries (2015-2016)
What’s the takeaway?
The UK’s creative industries are more geographically concentrated than other sectors, and the trend seems to be towards more rather than less concentration, although the creative industries are not alone in this regard. The fact that we find strong creative concentration within regions too raises the possibility of developing regional creative champions, but also the risk of replicating the same creative inequalities inside regions that we see between them.
The challenge for policymakers is clear: to address regional imbalances without forgoing the economic benefits that stem from co-location.
Employment concentration Business concentration
Larg
est l
ocatio
n
5 larg
est
10 la
rges
t
25 la
rges
t
50 la
rges
t
100 la
rges
t
Larg
est l
ocatio
n
5 larg
est
10 la
rges
t
25 la
rges
t
50 la
rges
t
100 la
rges
t
% ofeconomicactivity bycompany
group
% changein share
of group
100
90
80
70
60
50
40
30
20
12.5
10
7.7
5
2.5
0
-2.5
All creative industries
IT, software and computer services
Film, TV, video, radio and photography
Advertising and marketing
Publishing
Music, performing and visual arts
Architecture
Design: product, graphic and fashion design
Not creative
Source: ONS, Interdepartmental Business Register; Nesta analysis.
Creative Nation: How the creative industries are powering the UK’s nations and regions
26
Figure 8: Employment and business count concentration by region/nation (2015-2016)
% of creative employmentin region/nation
% of creative businessesin region/nation
Creativ
e ind
ustri
es
Other
secto
rs
Creativ
e ind
ustri
es
Other
secto
rs
Creativ
e ind
ustri
es
Other
secto
rs
Creativ
e ind
ustri
es
Other
secto
rs
Creativ
e ind
ustri
es
Other
secto
rs
Creativ
e ind
ustri
es
Other
secto
rs
Creativ
e ind
ustri
es
Other
secto
rs
Creativ
e ind
ustri
es
Other
secto
rs
Creativ
e ind
ustri
es
Other
secto
rs
Creativ
e ind
ustri
es
Other
secto
rs
Creativ
e ind
ustri
es
Other
secto
rs
Creativ
e ind
ustri
es
Other
secto
rs
LondonNorthern Ireland North East North West Wales West Midlands Scotland East Midlands South West South East
Yorkshire and The Humber
East of England
100
80
60
40
20
0
100
80
60
40
20
0
Source: ONS, Interdepartmental Business Register; Nesta analysis.

Creative Nation: How the creative industries are powering the UK’s nations and regions
27
Fact 3
Although the creative industries are more productive than comparable businesses in regional economies, they will do little to address the productivity crisis unless they scale up significantly
Why does this matter?
The UK’s biggest economic problem is not lack of job growth but stagnant productivity, particularly outside London and the South East. Can the creative industries help tackle this challenge, or will their reliance on lower productivity micro-businesses and services only make things worse?
The creative industries and productivity: it’s complicated
There is widespread agreement that the UK is facing a productivity crisis: in 2016, the country suffered a productivity gap of 15.5 per cent with other advanced economies in the G7, and its slowdown in productivity growth after the financial crisis was more significant than in comparable economies.26 While it is clear that no sector can single-handedly solve this macroeconomic problem, there are some reasons why the UK’s creative industries could play a role in addressing it. Creative businesses specialise, after all, in the creation of new ideas – a film, a video game, a song, a design - where the first copy is expensive to produce and subsequent ones are much cheaper. In principle, this makes it easier for them to serve large markets efficiently: they have the potential to be highly productive.27
At the same time, the process of generating new ideas can be labour intensive, especially in services sub-sectors like Design and Advertising where every project is different, and the intangible outputs hard to capture using intellectual property. Uncertainty about whether a new idea will be successful and whether the benefits will in any case accrue to the originator also raises barriers to finance, which prevent creative businesses from growing, or favour smaller companies that are more nimble and can adapt to new market conditions, but do not enjoy economies of scale. All these factors could turn the creative industries into a low productivity sector.28
To complicate things further, geography matters. The creative industries’ particularly strong propensity to cluster (which we evidenced in Fact 2 above) suggests that they benefit from knowledge spillovers and other agglomeration economies to a greater degree than other sectors. We need to take into account spatial variations in their productivity to determine the extent to which creative businesses can contribute to improving local productivity wherever they are based.

Creative Nation: How the creative industries are powering the UK’s nations and regions
28
To get a handle on all these factors, we combine data about creative industry company sizes from the Interdepartmental Business Register, and value-added data from the ONS’s Annual Business Survey. Critically, we control for the fact that larger companies are generally more productive than smaller ones by comparing creative industries labour productivity with labour productivity in other sectors inside the same size-band (note, however, that this analysis does not include Northern Ireland because we have not been able to access the size-band data– we have, however, included the relevant GVA data in the Creative Nation open dataset).
Figure 9 brings all this analysis together. It shows that the creative businesses are on average less productive than other sectors (an issue highlighted by SQW (2016) but that this is driven by the fact they tend to be smaller.29 In particular, when we compare creative businesses with those in other sectors controlling for their sizes, we find them to be more productive in almost every region (consistent with Frontier Economics (2016)).30
We consider these findings in turn: the first three columns of Figure 9 reading from the right show the share of creative businesses by size-band in each region or nation, how these shares changed between 2015 and 2016, and a comparison between the size distribution of the creative industries and other sectors.31 It shows that creative micro-businesses (firms with fewer than ten employees) are over-represented in the creative industries: they comprise 94.5 per cent of the sector (a share 11 pp higher than in the rest of the economy). Large businesses (with more than 250 employees) are, by contrast, under-represented (0.088 per cent vs 0.26 per cent in other industries). This pattern is replicated at the regional level, although some regions like London, the South East and the North West have a bigger share of large creative businesses.
Between 2015 and 2016, there was a small (0.01 per cent) increase in the share of large creative businesses in the UK creative industries, driven by growth in London, the South East and the West Midlands.
When we compare productivity controlling for differences in sizes in the far right column, we confirm that the creative industries are more productive than firms in other sectors of equivalent size, with the median regional productivity of UK creative businesses below ten employees at £46,000, 20 per cent higher than in other sectors. The same figure for creative businesses with more than ten employees is £58,000 (26 per cent higher than in other sectors).
We also find big differences in creative industries productivity across UK regions and nations: large businesses are on average most productive in London, South East and West Midlands, where, as we showed in Fact 2, there are strong concentrations of IT, software and computer services, and Advertising and marketing (two creative sub-sectors that tend to be highly productive). In contrast, creative micro-businesses are on average comparatively more productive in the South West of England and Scotland, although this could of course also be linked to sub-sectoral differences that are not picked up by creative industries averages.

Creative Nation: How the creative industries are powering the UK’s nations and regions
29
Figure 9: Creative industries size distributions and productivity 2015-2016
London
South East
Yorkshire andThe Humber
North West
West Midlands
South West
East of England
Scotland
East Midlands
North East
Wales
Micro:93.9%
Micro:95.4%
Micro:94.2%
Micro:93.9%
Micro:94.7%
Micro:95.5%
Micro:95.9%
Micro:94.0%
Micro:94.6%
Micro:94.8%
Micro:95.3%
Micro-business (<10 employees)Small (10-50 employees)Medium (50-250 employees)Large (>250 employees)
Growth in category (1000 more businesses)Decline in category (50 less businesses)Mean creative industry share (as % of total)Non-micro (>250 employees)
GVA per worker (£100K)GVA per worker (£50K)Mean GVA per workerin category (all regions)
Sizeband asshare of total
Growth in sizeband share (% and total)
Sizeband share (creative relative to other sectors)
GVA per worker (creative relative to other sectors)
-50 50 1000 50 1000 100 2000
Source: ONS, Interdepartmental Business Register and Annual Business Survey; Nesta analysis.

Creative Nation: How the creative industries are powering the UK’s nations and regions
30
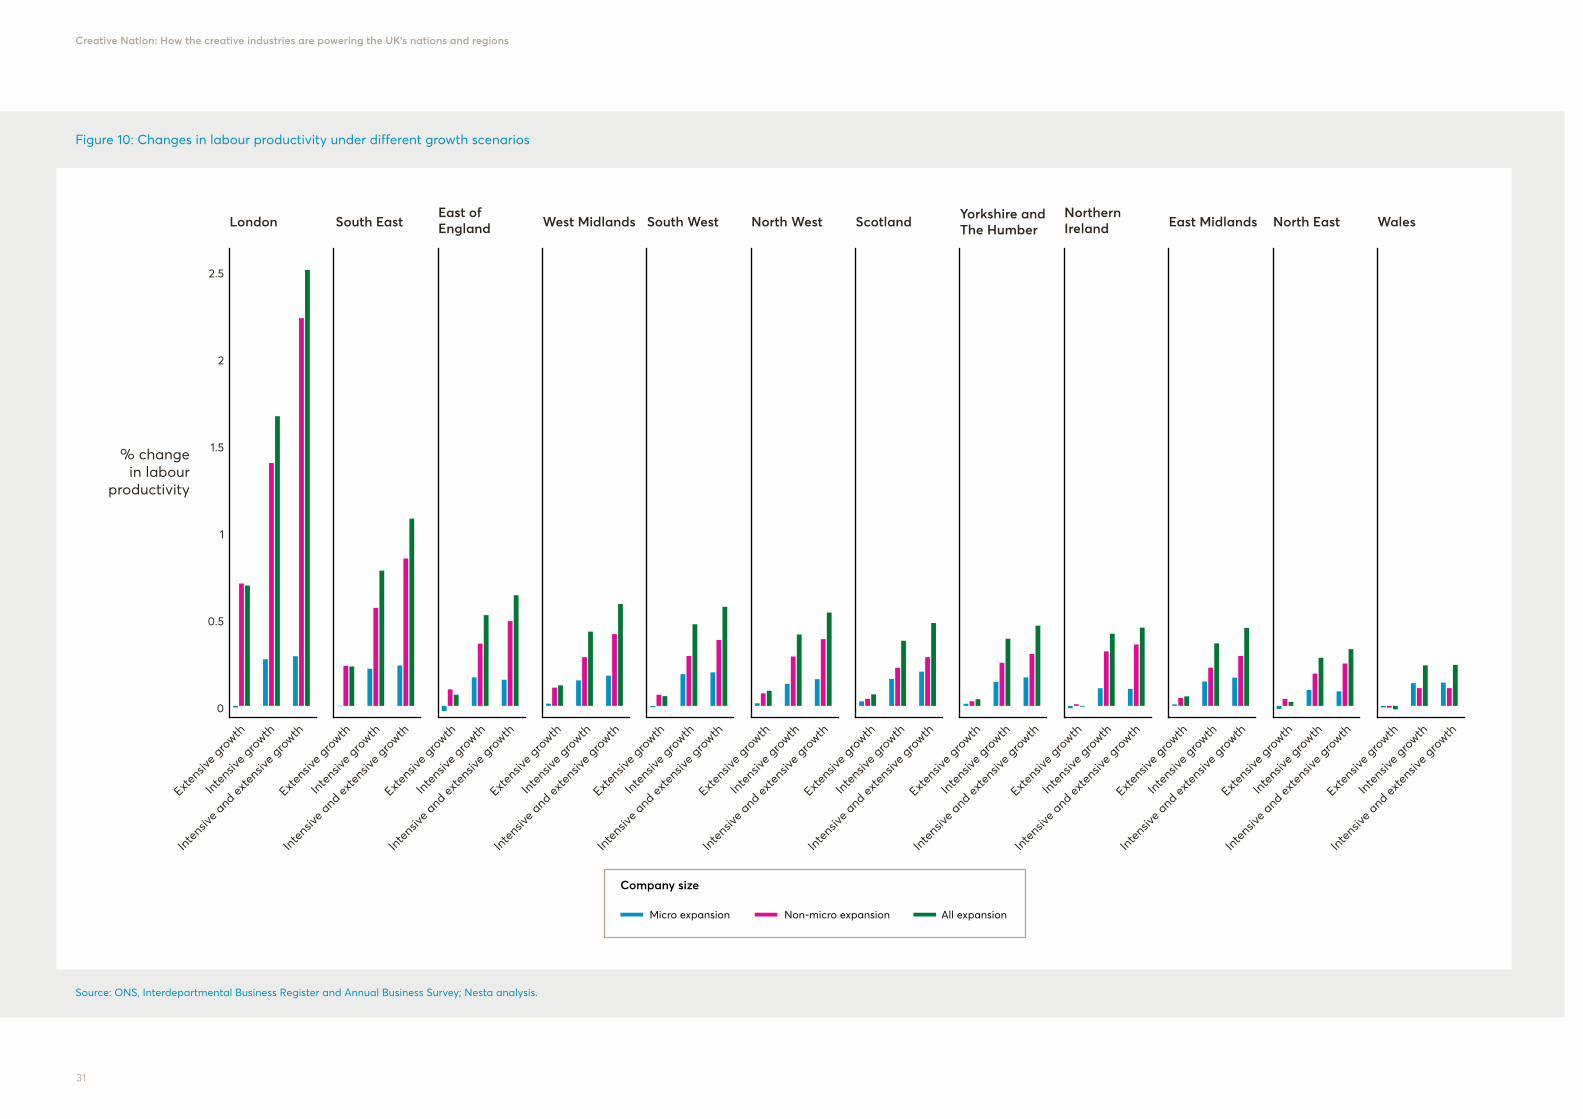
How the creative industries could contribute to regional labour productivity under different scenarios
We have estimated the potential impact of creative industries growth on regional productivity under different scenarios.
• An ‘extensive growth path’ assumes an increase of 10 per cent in the number of creative businesses in each region or nation, but no change in labour productivity,
• An ‘intensive growth path’ assumes an increase of 10 per cent in the labour productivity of creative businesses, but no increase in the number of creative businesses.
• There is also a part-extensive-part-intensive growth path based on a joint expansion in the number of creative businesses and productivity.
We consider separately the impact of each of these scenarios on productivity if they only alter the situation for creative micro-businesses, for non-micro businesses or for both types of firm. The results are presented in Figure 10. Before considering them, it is worth highlighting that the estimates are purely illustrative and based on simple calculations with strong assumptions, not least that it is equally feasible to increase business numbers and productivity in lagging regions like the North East of England and Wales as it is leading regions such as London and the South East of England.
What do we find?
First, simply promoting creative entrepreneurialism (that is, increasing the number of micro-businesses) will not make a dent in the productivity crisis. The reason for this is that creative micro-businesses are not more productive than the regional average, and in some regions they represent a miniscule share of employment. By contrast, however, ‘scale-up policies’ that increase the number of businesses with more than ten employees would be more beneficial because these businesses are more productive than firms in other sectors. The benefits of extensive growth are, however, outweighed by intensive growth which boosts creative business productivity, especially if the boost is in non-micro businesses.
Creative Nation: How the creative industries are powering the UK’s nations and regions
31
Figure 10: Changes in labour productivity under different growth scenarios
% changein labour
productivity
Extens
ive g
rowth
Inten
sive g
rowth
Inten
sive a
nd ex
tens
ive g
rowth
Extens
ive g
rowth
Inten
sive g
rowth
Inten
sive a
nd ex
tens
ive g
rowth
Extens
ive g
rowth
Inten
sive g
rowth
Inten
sive a
nd ex
tens
ive g
rowth
Extens
ive g
rowth
Inten
sive g
rowth
Inten
sive a
nd ex
tens
ive g
rowth
Extens
ive g
rowth
Inten
sive g
rowth
Inten
sive a
nd ex
tens
ive g
rowth
Extens
ive g
rowth
Inten
sive g
rowth
Inten
sive a
nd ex
tens
ive g
rowth
Extens
ive g
rowth
Inten
sive g
rowth
Inten
sive a
nd ex
tens
ive g
rowth
Extens
ive g
rowth
Inten
sive g
rowth
Inten
sive a
nd ex
tens
ive g
rowth
Extens
ive g
rowth
Inten
sive g
rowth
Inten
sive a
nd ex
tens
ive g
rowth
Extens
ive g
rowth
Inten
sive g
rowth
Inten
sive a
nd ex
tens
ive g
rowth
Extens
ive g
rowth
Inten
sive g
rowth
Inten
sive a
nd ex
tens
ive g
rowth
Extens
ive g
rowth
Inten
sive g
rowth
Inten
sive a
nd ex
tens
ive g
rowth
LondonNorthern Ireland North EastNorth West WalesWest Midlands Scotland East MidlandsSouth WestSouth East Yorkshire and
The HumberEast of England
2.5
2
1.5
1
0.5
0
Micro expansion Non-micro expansion
Company size
All expansion
Source: ONS, Interdepartmental Business Register and Annual Business Survey; Nesta analysis.

Creative Nation: How the creative industries are powering the UK’s nations and regions
32
Second, and perhaps unsurprisingly, London, the South East and East of England, which already have many highly productive creative businesses, stand to benefit more from an expansion in creative business activity and productivity. The impacts are not trivial. Labour productivity in London could be boosted by as much as 2.5 per cent in the most optimistic scenario (from £62,092 to £63,675), while the uplift in the South East is 1 per cent. While by no means negligible, the scope for labour productivity growth in other regions and nations is more modest.
These estimates represent another aspect of the ‘winner takes all’ dynamic that characterises creative growth and its geography, echoing an important point in the final report from the Industrial Strategy Commission published in 2017. Conventional impact assessments of policy interventions to enhance economic growth and productivity will tend to favour further investment in those locations and industries which are already ahead, which risks exacerbating the creative divide between different parts of the UK.32
What’s the takeaway?
The creative industries have a role to play in closing the UK’s productivity gap, but this will require them to become more productive, and to increase the number of people working in larger (non-micro) creative businesses. But the greatest potential for this is in those regions where the creative industries are already based.

Creative Nation: How the creative industries are powering the UK’s nations and regions
33
Fact 4
Creative neighbours appear to grow together, not at each other’s expense
Why does this matter?
Neighbouring creative communities can act as rivals if they feel that growth in the sector is a zero-sum game, where locations expand at the expense of those around them. Policymakers, for their part, may worry that their interventions to support creative industries in one location simply displace activity from another. What do we find when we compare gains over time in the performance of the creative industries in a given location with that of its neighbours?
Local economic growth cannot be considered in isolation: what happens in one location impacts on others. Consider neighbouring regions. On the one hand, if a region expands its creative industries, this can create demand for related or complementary services around it, or generate spin-outs to the benefit of others. On the other hand, expansion in an area may conceivably suck away the talent from neighbours, and steal business or lead companies to relocate from them. Determining which effect dominates could have important implications for policy. The ongoing debate about the impact of BBC Media City on the creative industries of the North West is in great part about whether this has resulted in new creative jobs or simply moved jobs across the UK.33
In order to get a handle on this, we calculate the average growth in creative employment and business count in an area’s direct neighbours and compare it with its own.
Figure 11 shows the results. It compares the proportion of TTWAs that grew when mean growth in their neighbouring areas from 2011-2014 to 2015-2016 was positive (red bar in the right of each chart) with the proportion that grew when mean growth in its neighbouring areas was negative (red bar on the left of every chart). If the performance of an area’s neighbours was unrelated to its own, we would expect the size of both bars to be the same. If, in contrast, growth in an area’s neighbours was detrimental to its own, the bar on the right should be lower. In Figure 11, we colour yellow those instances where there is a stronger (statistically significant) relationship between an area’s propensity to grow and its neighbours, and include a number to denote the ratio of TTWAs that grew when their neighbour grew (on average with those that grew when their neighbours did not grow, on average).
As it is, we find a generally positive relationship (the right red bar is bigger), although it is not always significant. In general, we find a stronger relationship between growth in an area and its neighbours for creative sub-sectors, possibly indicating value chain linkages across locations.
What’s the takeaway?
Creative clusters do not grow on their own: what happens in their neighbourhood is also important. Discrete interventions to support cluster development need to take into account the situation around it, and also consider potential growth spillovers which might benefit the creative industries nearby. There is a risk that these spillovers might not be given due attention even though they are a positive outcome for UK creative industries regionally and nationally.

Creative Nation: How the creative industries are powering the UK’s nations and regions
34
Figure 11: Growth propensity for locations in different ‘growth zones’
100%
50%
0
100%
50%
0
100%
50%
0
100%
50%
0
100%
50%
0
100%
50%
0
100%
50%
0
100%
50%
0
All creative industries employment
Advertising and marketing employment
Publishing employment
Architecture employment
IT, software and computer services employment
Film, TV, video, radio and photography employment
Music, performing and visual arts employment
Design: product, graphic and fashion design employment
Mean neighbourgrowth positive
Mean neighbourgrowth positive
Mean neighbourgrowth negative
Mean neighbourgrowth negative
All creative industries business count
Advertising and marketing business count
Publishing business count
Architecture business count
IT, software and computer services business count
Film, TV, video, radio and photography business count
Music, performing and visual arts business count
Design: product, graphic and fashion design business count
Source: ONS, Interdepartmental Business Register; Nesta analysis.

Creative Nation: How the creative industries are powering the UK’s nations and regions
35
Fact 5
Creative growth follows a plurality of models
Why does this matter?
For a long time, policymakers have pursued the model of the ‘Creative City’, and assumed that successful businesses in the creative industries grow in a similar way to ‘scale-ups’ in tech. But is this the case? Can we find a single growth model for the creative industries and its clusters, or are there many? We need to answer these questions in order to develop the right policies for the sector.
The ideal of the Creative City – a high density urban space where hyperconnected creative professionals work and play, benefit from knowledge spillovers and enjoy a bustling cultural and leisure scene – has long dominated policy thinking about creative cluster development.34 However, our analysis in 2016’s Geography of Creativity suggested that there may be other creative cluster models beyond the Creative City.35 In particular, we identified what we called successful Creative Conurbations with a strong presence of larger creative businesses, fewer creative SMEs and less evidence of creative networking.
On the business growth front, policymakers have been preoccupied with creating more high-growth firms (also referred to as gazelles, scale-ups and unicorns).36 However, as we pointed out in Fact 3, not all creative business models are associated with explosive growth, but this does not mean they are not valuable. Even the creative ‘lifestyle’ businesses, which have long worried some policymakers, could have an important role to play in the success of creative clusters.37
We have worked closely with Frontier Economics to understand these questions, analysing official micro data from the Interdepartmental Business Register.
Growth in the UK creative industries is not just about high-growth businesses
First, the national picture. We have studied business growth between 2013 and 2016 and measured the relative importance and contribution to net employment (jobs gained by companies that grew minus jobs lost by companies that declined or disappeared) of different creative company types (based on their size and growth profile). Figure 9 presents our findings, comparing the creative industries with the rest of the business population.

Creative Nation: How the creative industries are powering the UK’s nations and regions
36
Figure 12: Growth dynamics
Stable micro firms
New firms
Out of business firms
Growing micro firms
Declining micro firms
Stable non-micro firms
Decliningnon-micro firms
Growingnon-micro firms
Out of business large firms
New large firms
High-growth firms
Firm category as share of all
Share of all firms
0 0.1 0.2 0.3 -0.1 -0.5 0.5 1 1.5 20 -50 -25 25 50 750
Share of net job creation Number of jobs created/lostper firm in category
Firm category as share of employment growth or deline
Jobs created/lost per firm category
Creative Non-creative
Source: ONS, Interdepartmental Business Register; Nesta analysis.

Creative Nation: How the creative industries are powering the UK’s nations and regions
37
It shows that startups (businesses created at the beginning of the three-year interval we are considering, between 2013 and 2016) and micro-businesses are more important job creators in the creative industries than in the rest of the economy. For example, the number of jobs generated by new creative businesses was double the total net jobs created in the sector (by comparison, new businesses in the rest of the economy created 100 per cent of the net jobs).
At the same time, firm death and decline of creative micro-businesses are a bigger source of job loss in the creative industries than in the rest of the economy.
Business churn (jobs created by new companies and jobs destroyed by companies that go out of businesses) account for three times the net jobs created in the creative industries, almost twice what we see in other sectors.
In line with previous research by Nesta and others, we find that high-growth firms (defined as those that grew more than 20 per cent in three consecutive years) represent a small share of total businesses but make an important contribution to job creation both inside the creative industries and outside.38 When we consider only companies with over ten employees at the beginning of our considered period, we find that 8.5 per cent of creative businesses would classify as high-growth, which is bigger than 5 per cent of non-creative businesses. Yet even though the creative industries display an apparently stronger propensity to spawn high-growth firms when we control for size, we also find that the average creative high-growth firm created fewer jobs than those in other sectors between 2013 and 2016 (55, compared with 86 jobs created by high-growth firms outside of the creative industries).
This has several potential implications worth considering: first, non-micro creative businesses display a stronger propensity for fast growth than non-micro companies in the rest of the economy, but on average tend to create less employment – is this due to constraints set by their business models, or because they face barriers to accessing finance, skills and other inputs required for growth? This will be an important issue for future research.
Second, our findings suggest that although high-growth is important in the creative industries, focusing only on it risks leaving out of the picture many important sources of employment growth for the creative industries. For example, steadily growing micro-businesses represent a bigger share of the new jobs created by the sector.
In addition to the growth dynamics analysis presented in Figure 12, we have also analysed the survival rates of creative businesses. We find that in spite of the high rates of churn we mentioned, the survival rates of creative businesses in the sector are similar to those outside: 49 per cent of creative businesses active in 2010 were still in operation in 2016, compared with 51 per cent in other sectors.
Creative Nation: How the creative industries are powering the UK’s nations and regions
38
A taxonomy of clusters?
Is there one model for creative clustering, or more? A large body of research in the economic geography literature posits that there is a plurality of cluster models going beyond the ‘industrial districts’ of flexible SMEs, and the specialised clusters portrayed by US cluster expert Michael Porter. We have explored this question in a data-driven way by comparing TTWAs based on their similarities along many variables with information about their economic structure and growth dynamics. Since the data to do this are only available for larger locations, we have focused on a subset of the 48 creative clusters we identified in The Geography of Creativity (with the addition of Birmingham).
Our analysis identifies five robust ‘cluster growth models’ (see the Annex for an overview of what we have done in more detail), which we present in Figure 13.
• The map in Figure 13 shows where they are geographically.
• The central heatmap displays the similarities and differences between their constituent TTWAs (red cells indicate that two TTWAs are similar in their profiles, and blue cells indicate that they are different, and a square surrounding a group of cells bounds a cluster). We have arranged the clusters in the matrix in terms of their average similarities with each other, so the first (blue) group is more similar to the second (purple) group etc.
• The right-hand heatmap shows the median scores of each cluster model in the variables we used to cluster them. Red means a high median score compared to the other clusters, while blue represents a lower score.
Finally, Figure 13 displays individual growth dynamics of the TTWAs in each group.
These are the ‘cluster models’ revealed by our analysis:
• ‘Incipient clusters’ are younger and less stable creative clusters found generally in the North, including TTWAs such as Liverpool and Middleborough. They experience high levels of business and employment churn, and the lowest creative business survival rates
• ‘Creative districts’ are mostly in the South of England, such as Brighton, Slough or Bournemouth. These have many micro-businesses and stable firms from a wide range of creative sectors, and a smaller share of high-growth businesses than some other models.
• ‘Creative conurbations’ such as Cambridge, Guildford and Leamington Spa are relatively stable locations where creative firms have high survival rates. High-growth firms play a stronger role in job creation than in other clusters, and churn rates are generally low.
• ‘Creative capitals’ include larger locations in England such as London, Manchester, Reading and Leeds, and in Scotland, Glasgow. Large and medium creative businesses are more important here, and there is a bigger share of high-growth firms.
• ‘Creative challengers’ includes a sizeable group of large cities in most part outside of London and the South East, including Birmingham, Bristol, Newcastle or Sheffield, as well as Edinburgh in Scotland and Cardiff in Wales. These locations have gained creative specialisation recently, and have diverse ecosystems with some high-growth firm presence.

Creative Nation: How the creative industries are powering the UK’s nations and regions
39
Figure 13: Cluster growth models
Incipient clusters Creative conurbations
Cluster types
Cluster type locations City profile correlations Profile scores
Creative districts
Creative capitals Creative challengers
Medway
Liverpool
Middlesbrough and Stockton
Warrington and Wigan
Slough and Heathrow
Luton
Brighton
High Wycombe and Aylesbury
Milton Keynes
Crewe
Northampton
Bournemouth
Tunbridge Wells
Harrogate
Eastbourne
Chelmsford
Birmingham
Edinburgh
Bristol
Newcastle
Chester
Sheffield
Cardiff
Norwich
London
Manchester
Reading
Leeds
Glasgow
Oxford
Cambridge
Guildford and Aldershot
Colchester
Leamington Spa
Southampton
Newbury
Peterborough
Large firms (%)
Medium firms (%)
Micro firms (%)
Sector specialisation (jobs)
Sector diversity (jobs)
Sector specialisation (businesses)
Sector diversity (businesses)
Clustering growth (jobs)
Clustering growth (businesses)
New firms (% firms)
Micro growth (% firms)
Non-micro growth (% firms)
High growth (% firms)
Micro stable (% firms)
Micro decline (% firms)
Non-micro decline (% firms)
Out of business (% firms)
New firms (% new jobs)
Micro growth (% new jobs)
Non-micro growth (% new jobs)
High growth (% new jobs)
Non-micro decline (% lost jobs)
Micro decline (% lost jobs)
Out of businesses (% lost jobs)
Churn
Surv. rate (1 year)
Surv. rate (3 years)
Surv. rate (6 years)
Med
way
Live
rpoo
lM
iddl
esb
roug
h an
d St
ockt
onW
arrin
gton
and
Wig
anSl
ough
and
Hea
thro
wLu
ton
Brig
hton
Hig
h W
ycom
be
and
Ayl
esb
ury
Milt
on K
eyne
sC
rew
eN
orth
ampt
onB
ourn
emou
thTu
nbrid
ge W
ells
Har
roga
teEa
stb
ourn
eC
helm
sfor
dB
irmin
gham
Edin
bur
ghB
risto
lN
ewca
stle
Che
ster
Shef
field
Car
diff
Nor
wic
hLo
ndon
Man
ches
ter
Rea
ding
Leed
sG
lasg
owO
xfor
dC
amb
ridge
Gui
ldfo
rd a
nd A
lder
shot
Col
ches
ter
Leam
ingt
on S
paSo
utha
mpt
onN
ewb
ury
Pete
rbor
ough
Inci
pien
t cl
uste
rs
Cre
ativ
e di
stric
ts
Cre
ativ
e ch
alle
nger
s
Cre
ativ
e ca
pita
ls
Cre
ativ
e co
nurb
atio
ns
-0.75 0.75 1.00-1.00 -0.50 0.50-0.25 0 -0.25
Correlation in profile
1.5 4.5 51 2 42.5 3 3.5
Cluster type ranking
Source: ONS, Interdepartmental Business Register; Nesta analysis.

Creative Nation: How the creative industries are powering the UK’s nations and regions
40
Figure 14: Growth dynamics in selected locations
Out of business Micro decline
Cluster types
Non-micro decline Micro stable
High growth Micro growth
Non-micro growth New businessFailure rate (1 year, creative) Failure rate (3 year, creative) Failure rate (6 year, other)
PeterboroughNewbury
SouthamptonLeamington Spa
ColchesterGuildford and Aldershot
CambridgeOxford
GlasgowLeeds
ReadingManchester
LondonNorwich
CardiffSheffieldChester
NewcastleBristol
EdinburghBirminghamChelmsfordEastbourneHarrogate
Tunbridge WellsBournmouth
NorthamptonCrewe
Milton KeynesHigh Wycombe and Aylesbury
BrightonLuton
Slough and HeathrowWarrington and Wigan
Middlesbrough and StocktonLiverpoolMedway
80 100600 20 40 50 604010 20 3010050-100 -50 0 75-75 -25 25
Business type (% total creative businesses) Employment growth/decline by business type Failure rate after x years (creative vs other)
Source: ONS, Interdepartmental Business Register; Nesta analysis.

Creative Nation: How the creative industries are powering the UK’s nations and regions
41
These results emphasise that there is a plurality of cluster models in the UK with distinctive strengths and weaknesses. For example, the industrial composition of creative districts is more diversified (that is, they are strong in more creative sub-sectors at the same time), which could make them more resilient in the face of sector-specific downturns. Against this, the prevalence of micro-businesses in these clusters may contribute to sustained lower labour productivity as discussed earlier in Fact 3. Compounding this is the fact that high-growth firms are also less common. The situation in creative conurbations is almost the reverse: these locations tend to specialise in fewer sectors, and have bigger, as well as proportionately more high-growth businesses. Levels of churn are lower, suggesting more stable ecosystems – but perhaps more vulnerability to disruptive ideas which according to the ‘innovator’s dilemma’ concept are harder to adopt by larger, established businesses.
What’s the takeaway?
Growth dynamics in creative industries and their clusters are not as simple as policymakers sometimes assume: high-growth firms are important, but so are steadily growing micro-businesses; creative cities are accompanied by creative districts and creative conurbations among other models. The art that creative policymakers and practitioners need to master is to harness the opportunities opened up by their existing economic structures and growth models, while managing their risks. This requires awareness of the local context, and detailed, timely data.

Creative Nation: How the creative industries are powering the UK’s nations and regions
42
Fact 6
The wider creative economy is also stronger in creative clusters
Why does this matter?
Creativity is not just the preserve of the creative industries. Other sectors use creative inputs and services in their productive activities and produce novel and differentiated products too. Does the diffusion of creative capabilities into other sectors happen more easily in creative clusters where creativity is ‘in the air’ (to paraphrase classical economist Alfred Marshall)? If so, this would suggest a potentially important, indirect, channel through which creative clusters contribute to local economic development and productivity.
According to the concept of the Creative Economy, businesses outside of the creative industries increasingly incorporate creative inputs like design, advertising, software, visuals and storytelling into their offerings in order to engage consumers and stand out above their competitors. Formally, the creative economy comprises “those economic activities which involve the use of creative talent for commercial purposes”, which includes the creative industries, but also creative talent working in other sectors.39
Although studies based on labour force and innovation survey data have shown the importance of ‘embedded creative’ professionals and the business value of combining creative inputs with science and technology, there is less evidence about the geographical dimensions of this phenomenon (see 2016’s The Geography of the Creative and High Tech Economies in the UK for an exception).40 One reason for this is that the adoption of creative capabilities outside the creative industries is not easy to measure using official data that classify each company into a single sector.41
To overcome this limitation in the data, we have partnered with GlassAI, a big data start-up that scrapes and analyses the websites of hundreds of UK businesses with the goal of understanding what they do ‘in their own words’. With these data, we can pick up creative businesses that mention terms like design, digital technologies, video and music in their websites, and proxy the extent to which creativity is embedded in sectors outside the creative industries.42

Creative Nation: How the creative industries are powering the UK’s nations and regions
43
Measuring creative embeddedness in the GlassAI data
We define ‘specialised creative’ companies as those that should be characterised as creative businesses with a high probability based on the text on their website, and ‘embedded creative’ companies as those that also have a high probability of being engaged in creative business but less intensively so than those deemed ‘specialised creative’. GlassAI’s data are wholly sourced from the web and therefore are independent of SIC (Standard Industrial Classification) codes. The taxonomy we use to classify the businesses is modelled on the labels that companies use to describe what they do on platforms like LinkedIn. We allocate creative companies to ‘sub-sectors’ with a bespoke lookup table matching GlassAI sub-sectors to ‘creative’ ones.
This approach has limitations, not least the fact that the GlassAI data captures businesses with an online presence, rather than those which are economically active. We try and assess the quantitative implications of this limitation by triangulating our findings with economic activity estimates from the IDBR.
In total, we identify around 46,000 creative specialist companies and 40,000 creative embedded companies in the GlassAI data.
Figure 15 shows the level of embeddedness of different creative capabilities (based on the creative sub-sectors in the DCMS classification) in non-creative sectors (based on GlassAI’s taxonomy). In other words, we are counting how many businesses primarily classified in GlassAI sectors which are not matched to DCMS creative sub-sectors through our lookup also have a high probability of being in a creative sector – we think of them as ‘non-creative sectors’ with embedded creative capabilities in the creative sub-sectors where they had the biggest probability.
The size of each square represents the total number of businesses with that creative capability in the non-creative sector, and the colour is used to represent the share of companies in the sector which have that embedded capability. Intuitively, IT, Advertising and Design capabilities are more intensely embedded in non-creative sectors. Although creative content capabilities are less embedded generally, there are exceptions to this: we detect strong embedding of Music and performing arts in Not for Profit and Education, and of Radio, TV, film and photography in Leisure and Hospitality. Government is the non-creative sector with lowest levels of creative embeddedness.

Creative Nation: How the creative industries are powering the UK’s nations and regions
44
Figure 15: Creative embeddedness by non-creative sector
IT, software and computer services
Advertising and marketing
Design: product, graphic and fashion design
Architecture
Crafts
Music, performing and visual arts
Publishing
Film, TV, video, radio and photography
Museums, galleries and libraries
Profe
ssiona
l ser
vices
Tech
nology
Consum
er g
oods and
serv
ices
Real e
state
and
cons
rtuct
ion
Non pro
fit a
nd ed
ucatio
n
Leisu
re a
nd hosp
itality
Indus
trial a
nd a
gricult
ure
Supply
chain
and tr
ansport
Financ
ial ser
vices
Health
care
and
scien
tific
Energ
y and
envir
onmen
t
Govern
men
t
1 2 3 4 5 6 7 8 9 10
Creative embeddedness ranking
Number of businesses
8,000 businesses 1,000 businesses 100 businesses
The creative economy of creative clusters
We geo-located the businesses in the GlassAI data using the postcodes that appear on business website and estimate the relative specialisation of the largest TTWAs in specialist creative and embedded sub-sectors: that is, the extent to which creative specialist companies and creative embedded companies in a particular sub-sector tend to be overrepresented in a TTWA compared with the national average.
In Figure 16, we compare the resulting indices with each other by sub-sector, and also compare them with indices of sub-sectoral specialisation based on official data and the DCMS sub-sector SIC codes (each plot also includes a regression line of the relationship between both variables, and their goodness of fit (R2), which captures the share of the change in one variable that is explained by the other).
Source: GlassAI; Nesta analysis.

Creative Nation: How the creative industries are powering the UK’s nations and regions
45
Figure 16: Relationship between GlassAI specialisation and embeddedness indices and official creative statistics (IDBR) in creative clusters
GlassAI specialisation (x) - embeddedness (y)
GlassAI specialisation (x) - IDBR specialisation (y)
GlassAI embeddedness (x) - IDBR specialisation (y)
Creative industries
IT, software andcomputer services
Advertising and marketing
Design: product, graphic and fashion design
Architecture
Music, performingand visual arts
Publishing
Film, TV, video, radioand photography
1.5
1
0.5
2
1.5
1.0
0.5
2
1.5
1.0
0.5
2.5
2
1.5
1
0.5
2.5
2
1.5
1
0.5
0
2
1.5
1
0.5
2
1.5
1
0.5
1.5
1.25
1
0.75
0.5
0 21 3 0 21 3 0 10.5 1.5 2.52
x=0.28+0.71*yR2=0.91
x=0.46+0.55*yR2=0.63
x=0.4+0.62*yR2=0.55
x=0.39+0.6*yR2=0.82
x=0.36+0.72*yR2=0.64
x=0.23+0.86*yR2=0.57
x=0.51+0.52*yR2=0.54
x=0.54+0.49*yR2=0.64
x=0.71+0.33*yR2=0.41
x=0.64+0.35*yR2=0.54
x=0.47+0.52*yR2=0.77
x=0.37+0.64*yR2=0.63
x=0.4+0.56*yR2=0.5
x=0.79+0.31*yR2=0.5
x=0.93+0.17*yR2=0.32
x=0.45+0.54*yR2=0.63
x=0.28+0.66*yR2=0.66
x=0.29+0.65*yR2=0.54
x=0.11+0.9*yR2=0.91
x=0.85+0.24*yR2=0.34
x=0.7+0.38*yR2=0.54
x=0.48+0.46*yR2=0.66
x=0.21+0.68*yR2=0.68
x=0.13+0.81*yR2=0.57
Source: GlassAI; ONS, Interdepartmental Business Register; Nesta analysis.

Creative Nation: How the creative industries are powering the UK’s nations and regions
46
What’s the takeaway?
Our analysis suggests that those places with strong creative specialisms see those strengths spread into other industries, potentially making them more innovative and productive. This is an important lesson for the Industrial Strategy and for Local Enterprise Partnerships and other agencies charged with local economic development. Policymakers should take this into account and seek to enhance these creative spillovers when they develop new policies to strengthen creative clusters.
First, these charts show a strong correlation between a location’s creative specialisation based on GlassAI data, and official measures based on the IDBR. In other words, reassuringly, those locations with a strong presence of creative businesses in a sub-sector according to GlassAI data (and the GlassAI data-based classification) also tend to show a strong presence of creative businesses according to official data (and the DCMS SIC code-based classification).
Second, we find a strong association between creative specialisation – on either measure – and creative embeddedness by sub-sector: in other words, those locations with creative clustering in a creative sub-sector also tend to display embeddedness of those same creative capabilities in the wider economy. This is an important finding, and what we might expect were it the case that local creative capabilities find their way into other sectors. It adds to – though in the absence of further analysis does not demonstrate – the evidence that there are local positive spillovers from the creative industries into other industries.43
In Figure 17, we dig deeper into the nature of creative embeddedness in individual creative clusters. Our analysis highlights some interesting differences between locations: for example, Advertising and marketing is generally more important for creative embedded businesses in Professional Services, but in Cambridge, Cardiff and Newcastle, Design is more important for these sectors. Our analysis shows (unsurprisingly) that London is the TTWA with the largest number of creative embedded businesses, and that Brighton is the one where creative embedded intensity (ratio of creative embedded to non-creative) is biggest – consistent with the city’s reputation as one of the UK’s ‘creative hotspots’.

Creative Nation: How the creative industries are powering the UK’s nations and regions
47
Figure 17- Creative Embeddedness in Creative Clusters
Professional servicesTechnologyNon profit and educationReal estate and constructionConsumer goods and servicesLeisure and hospitalityIndustry and agricultureOther
Non creative sector Creative sector
IT, software and computer servicesAdvertising and marketingDesign: product, graphic and fashion designArchitectureCraftsMusic, performing and visual artsPublishingFilm, TV, video, radio and photographyMuseums, galleries and libraries
LondonBirminghamManchester
Slough and HeathrowBristol
CambridgeGuildford and Aldershot
LutonEdinburgh
GlasgowLeeds
BrightonReading
OxfordSouthampton
High Wycombe and AylesburyCardiff
ChelmsfordNewcastle
SheffieldBournemouth
LiverpoolMilton Keynes
MedwayWarrington and Wigan
NorwichLeamington SpaTunbridge Wells
ChesterColchester
EastbourneCrewe
NorthamptonHarrogate
NewburyMiddlesbrough and Stockton
Percentage of businesses Share of creativeembedded businesses
0 0.2 0.4 0.6 0.8 1 0 0.05 0.10
Source: GlassAI (2017)

Creative Nation: How the creative industries are powering the UK’s nations and regions
48
Fact 7
Creative research collaborations are taking place locally and nationally
Why does this matter?
Universities are a vital component of the UK’s creative landscape: they develop talent, provide support services and access to cultural infrastructure, and carry out research which is relevant for creative businesses and organisations. But how much do they collaborate with creative businesses? And how many of these collaborations take place locally or regionally as opposed to nationally? As new policy initiatives such as the AHRC’s Creative Clusters programme are developed to boost the impact of universities on creative clusters, it is more important than ever to understand universities’ current position within the UK creative innovation system.
In A Manifesto for the Creative Economy, we introduced the idea of the Creative Innovation System, the network of organisations that, together, enable the generation of new ideas that fuel the UK’s creative economy.44
Universities play many different roles in the Creative Innovation System. Here we focus on how they can enhance its connectivity, collaborating locally with creative businesses, and linking up wider networks to exploit potential synergies between creative clusters across the UK. We have explored both functions using the Gateway to Research, an open dataset with information about Research Council and Innovate UK-funded projects.
In an experimental analysis, we have used fuzzy matching methods to combine information about non-academic organisations participating in these projects with Companies House, and determined which of those companies are in the creative industries and in what sub-sectors, as defined according to SIC codes available in the Companies House data. The creative sub-sectors are defined as all those with a creative SIC code for Advertising and marketing, Architecture, Crafts, Design, Film, TV, video, radio and photography, IT, software and computer services, Museums, galleries and libraries, Music, performing and visual arts and Publishing. The list of academic institutions includes some public sector bodies, hospitals, schools and colleges, in addition to universities and research institutes.
We have identified 974 organisations in the Gateway to Research data as creative companies, which is between 3 per cent and 5 per cent of all private companies listed. This suggests that the creative industries are somewhat underrepresented in their Research Council and Innovate UK research collaboration with universities (something that might be linked to the large number of micro-businesses in the sector).45
However, when we look at the year in which the grant was awarded for the more than 11,000 unique academic-company-project collaborations in our data, we find that creative participation in research activities appears to be increasing over time. In particular, the total number of projects featuring at least one creative business has increased from 258 in the two-year period 2009-2010, to 438 projects in 2015-2016. As shown in Figure 18, total funding for projects in the creative industries has doubled between 2006 and 2017, which is faster than research funding overall. Consistent with this, the proportion of all RCUK funding going to projects involving creative organisations has increased over this period too, as illustrated by the size of the points in the top panel in Figure 18. As the bar at the bottom of Figure 18 shows, while the proportion of funding for individual creative sub-sectors has fluctuated considerably during this period, in general the proportion of funding allocated to IT-related creative projects has increased.

Creative Nation: How the creative industries are powering the UK’s nations and regions
49
Figure 18: Total project funding by creative sub-sector and year
Even though there are more projects in IT, software and computer services than any other creative sub-sector (45 per cent of all creative projects), there is a higher number of collaborators per project in other sub-sectors, with a median of six collaborators for non-creative IT sub-sector-related projects, compared with five collaborators per project in creative IT sub-sector.
We have mapped the networks of academic-private collaborations by creative sector, as shown in Figure 19. The maps show the connections between academic and private collaborators, such that regions of intense colour correspond to frequent connections or regions where collaboration lines frequently cross.
450
400
350
300
250
200
150
100
50
Total projectfunding to
projects with creative
organisations(£ million)
Fraction of totalcreative project
funding
2006 2007 2008 2009 2010 2011 2012 2013 2014 2015 2016 2017
IT, software and computer services
Music, performing and visual arts
Publishing
Film, TV, video, radio and photography
Design: product, graphic and fashion design
Museums, galleries and libraries
Architecture3% 7% 15%
Fraction of total RCUK and Innovate UK funding
Source: Gateway to Research (2017)

Creative Nation: How the creative industries are powering the UK’s nations and regions
50
London is generally found to be a significant hub, however certain organisations act as flagbearers for collaboration in their localities. For example, Visual Acuity, a company in Brighton has the most individual collaborations for Design, whilst Opera North (Yorkshire) and Adoreboard (Belfast) lead significant hubs in the Music, performing and visual arts and Advertising and marketing sectors, respectively. More generally, the graphs make it clear that creative research collaborations cut right across the UK, in many cases connecting creative communities in faraway locations. The median distance between collaborators is 100 miles, whereas the lower quartile of collaborations is only 44 miles: the picture is very varied.
Figure 19: Directional collaboration density, by creative subsector. Regions of intense colour correspond to frequent connections or regions where collaboration lines frequently cross
IT, software and computer services
Music, performingand visual arts
Museums, galleriesand libraries
Publishing
Film, TV, video, radioand photography
Design: product, graphic and fashion design
Architecture Advertising andmarketing
Increasing directional collaboration density
Source: Gateway to Research (2017)

Creative Nation: How the creative industries are powering the UK’s nations and regions
51
Figure 20: The number of collaborations, fraction of local creative collaborations, by the TTWA of academic collaborators
Number of connectionsbetween academic and
private institutions,per project
Fraction ofcollaborators
in local region
Creative industrysectors of private
sector collaborators
Travel-to-work area of academic collaborator
Lond
on
Oxford
Edinbur
gh
Manc
heste
r
Cambrid
ge
Southam
pton
Glasgow
Leed
s
Birming
hamBris
tol
Newca
stle
Sheffie
ld
Slough a
nd
Heath
row Bath
Exete
r
Liver
pool
Guildfo
rd a
nd
Aldersh
otBelf
ast
Cardiff
Reading
Chelmsfo
rd
Brighto
n
Norwich
Milton K
eyne
s
Canter
bury
Colches
ter
Northam
pton
Bourne
mout
h
Cheste
r
Middlesbro
ugh
and St
ockto
n Luto
n
Basingsto
ke
1
0.5
0
IT, software and computer services
Music, performing and visual arts
Publishing
Film, TV, video, radio and photography
Design: product, graphic and fashion design
Advertising and marketing
Architecture
10 100 1,000
Number of connectionsSame TTWA
Neighbouring TTWA
Rest of UK
Source: Gateway to Research (2017)

Creative Nation: How the creative industries are powering the UK’s nations and regions
52
Figure 20 shows the collaborations by the TTWA in which academic collaborators are based, with creative organisations. The top panel shows the total number of collaborations in each TTWA; the central panel shows the proportion of collaborations in each TTWA which take place locally, regionally and nationally; and the lower panel shows the make up of collaborations, in terms of the creative sub-sector of the creative business that the local research organisation is collaborating with.
It shows, for example, that London universities do not have an unusually high number of very local collaborations, when compared to other parts of the South East of England. In other words, the high levels of creative research activity in London might benefit creative industries elsewhere in the UK that researchers in the capital collaborate with, both in the South East and further afield. More generally, we find that South East-based universities such as those in the Slough and Heathrow TTWA (such as Brunel and Kingston), Luton, Guildford and Bournemouth engage in high levels of creative collaboration in their location and neighbouring TTWAs. This could be linked to the strong presence (as a share of the economy) of creative businesses around them (as evidenced in Fact 1), as well as the relatively higher presence of larger creative companies that we pointed out in Fact 2. We also note high levels of local collaboration in cities like Belfast, Birmingham, Sheffield, Newcastle and Cardiff, some of which we identified as creative challengers in our analysis of cluster models in Fact 7.
What’s the takeaway?
The growth, in real terms and controlling for increases in overall research funding, in research collaborations between universities and creative industries suggests an increasing role for universities in creative innovation systems. Critically, this is both about local creative collaborations and connecting creative organisations in locations far apart. Going forward, it will be important to monitor how this research activity is contributing to the sector’s innovation, productivity and growth, some of the challenges we have identified through this report.

Creative Nation: How the creative industries are powering the UK’s nations and regions
53
Fact 8
Creative communities are interconnected and the diversity of connections increases over time
Why does this matter?
Networking events provide spaces where businesses, researchers and practitioners can meet, exchange knowledge on a subject and share their ideas. Through this process, new collaborations are formed, some of which lead to innovation. It is important therefore to understand the structure of the networking landscape and examine how the interests of the communities are changing over time.
Here, we focus on the connectivity of creative communities and explore how this is changing over time. We use data from Meetup.com, a networking platform where users can create, register and attend events. We identify more than 1,700 creative tech Meetup groups which we allocate to creative sub-sectors based on their topics. These groups have organised almost 30,000 events that attracted 180,000 unique individuals since 2004 (this represents 92.99 per cent of total groups, 92.92 per cent of total events and 91.87 per cent of total unique participants in tech meetups in the UK).
As Figure 21 shows, the majority of organised events were related to IT, software and computer services, reaching almost 8,000 events in 2017. However, the activity in other creative sub-sectors is growing too. For example, the number of Design-related Meetups has tripled in the last five years.
Figure 21: Meetup events in creative topics
12,000
10,000
8,000
6,000
4,000
2,000
02012 2013 2014 2015 2016 2017
IT, software and computer services
Music, performing and visual arts
Crafts
Advertising and marketing
Design: product, graphic and fashion design
Publishing
Source: Meetup.com (2017)

Creative Nation: How the creative industries are powering the UK’s nations and regions
54
We also use the groups’ location and the unique member ID of the attendees to draw out the connections between TTWAs based on the areas that a person has visited to participate in Meetup events, echoing previous Nesta analyses in The Geography of Creativity and State of the Art. In Figure 22, we show the connectivity of creative communities by sub-sector. The interpretation is similar to the maps in Fact 7: regions of intense colour correspond to frequent connections or regions where collaboration lines frequently cross. Our analysis reveals hubs of connectivity that span several TTWAs, such as the West Midlands in Advertising, Publishing and IT, the South West and Wales in Design, and the North West of England in Crafts (which includes Maker communities).
Figure 22: Connectivity between creative communities in the UK
IT, software and computer services
Music, performingand visual arts
PublishingCrafts
Design: product, graphic and fashion design
Advertising andmarketing
Increasing directional collaboration density
Source: Meetup.com (2017)
Creative Nation: How the creative industries are powering the UK’s nations and regions
55
Previous research suggests that cognitive diversity is an important feature of networks that can help them perform more successfully, and particularly to generate breakthrough innovation.46 A community that has members interested in various domains is intuitively more likely to experience innovation spillovers, increase the economic output by adopting practices that have already been tried and successfully tested in other disciplines and be more resilient to changes in technologies and market. We have quantified this using the propensity for attendees in local events to participate in events related to a broad range of creative sub-sectors and measured its change from 2012 to 2017.
In Figure 23, we focus on those creative clusters identified in The Geography of Creativity which are highest when ranked by the number of unique Meetup users they attracted in the period 2012-2017. The red line shows how an area’s cognitive diversity has changed through the years, while the blue line presents the average of all the TTWAs in the chart.
We find that even though London is the most connected city in the UK, it does not have the most diverse networks on this measure because people tend to specialise on a single sector rather than attend a variety of them. The events in Cambridge, Manchester, Bristol and Sheffield might not have attracted the same volume of participants, but the audience is interested in topics across the full range of the creative sub-sectors – in other words, creative communities in different sub-sectors are relatively more interconnected there. Further, the cognitive diversity of London’s communities has seen some decline as the gap between the growth of IT, software and computer services and the rest of the topics becomes wider. Similarly, the networking communities in Milton Keynes, Bath and Southampton have a strong focus on software and computer services and therefore, they score lower on this measure.
What’s the takeaway?
Our analysis show that creative communities across the UK engage in high levels of networking to share skills and do business. Policymakers can usefully draw on these networks to identify the challenges for local creative industries, as well as growth opportunities. Our analysis also confirms previous findings about the importance of collaboration between creative clusters, also in line with the results from Fact 4. Coordination between creative industries collaborating across local economies will be important going forward.

Creative Nation: How the creative industries are powering the UK’s nations and regions
56
Figure 23: Evolution of cognitive diversity in various locations
1.4
1.2
1
0.8
0.6
0.4
0.2
0
1.4
1.2
1
0.8
0.6
0.4
0.2
0
1.4
1.2
1
0.8
0.6
0.4
0.2
0
1.4
1.2
1
0.8
0.6
0.4
0.2
0
1.4
1.2
1
0.8
0.6
0.4
0.2
0
London Manchester Bristol Cambridge
1.4
1.2
1
0.8
0.6
0.4
0.2
0
1.4
1.2
1
0.8
0.6
0.4
0.2
0
1.4
1.2
1
0.8
0.6
0.4
0.2
0
Birmingham Belfast Edinburgh Glasgow
1.4
1.2
1
0.8
0.6
0.4
0.2
0
1.4
1.2
1
0.8
0.6
0.4
0.2
0
1.4
1.2
1
0.8
0.6
0.4
0.2
0
1.4
1.2
1
0.8
0.6
0.4
0.2
0
1.4
1.2
1
0.8
0.6
0.4
0.2
0
Leeds
Cognitivediversitymeasure
2012 20172015 201620142013 2012 20172015 201620142013 2012 20172015 201620142013 2012 20172015 201620142013
Oxford Brighton Norwich
1.4
1.2
1
0.8
0.6
0.4
0.2
0
1.4
1.2
1
0.8
0.6
0.4
0.2
0
1.4
1.2
1
0.8
0.6
0.4
0.2
0
Reading Newcastle Cardiff Bath
1.4
1.2
1
0.8
0.6
0.4
0.2
0
1.4
1.2
1
0.8
0.6
0.4
0.2
0
1.4
1.2
1
0.8
0.6
0.4
0.2
0
1.4
1.2
1
0.8
0.6
0.4
0.2
0
Sheffield Milton Keynes Southampton Peterborough
Cognitive diversity measure in location
Average cognitive diversity
Source: Meetup.com (2017)

Creative Nation: How the creative industries are powering the UK’s nations and regions
57
III
Conclusion In Creative Nation, we have used official, open and web data to generate eight facts about the geography of the UK creative industries and creative economy.
Although our analysis supports the broad thesis that creative clusters present an important opportunity for local economic development across the UK (Fact 1), not only through their direct economic impacts but also by enabling the development of local creative economies (Fact 6), it also challenges naive assessments of their potential: the creative industries increasingly concentrate in a few places, potentially worsening geographical imbalances in the UK (Fact 2). The reality is that by simply supporting more creative entrepreneurialism without scaling-up businesses and improving productivity, will do little to address the productivity crisis in the UK’s regions and cities (Fact 3). As they develop policies to address these challenges, policymakers will need to pay attention to the complexity of growth in the sector; of the interdependencies between the growth outcomes of neighbouring creative clusters (Fact 4), the plurality of cluster growth models (Fact 5) and the potential role of universities not only as local anchors, but also as organisations that can connect creative innovators across the country (Fact 7).
It is encouraging that the design of the AHRC’s Creative Cluster programme, an important intervention to strengthen creative clusters going forward, is taking into account this plurality of local contexts, creating spaces for experimentation of different interventions, and putting in place a robust analytical infrastructure to support learning inside and between creative clusters. We hope that future editions of Creative Nation will provide the data to fuel this process on a more ongoing basis, informing policies that enhance the growth and benefits of the creative industries for more people and places across the UK.
Going forward
Our analysis is not without its limitations, and many of our findings raise follow-up questions and highlight interesting avenues for further research. Here are some examples:
First, our focus on TTWAs as the geographical unit of analysis prevents us from analysing the micro-geography of the creative industries, that is, the distribution of the sector inside town and cities, and makes it harder to identify creative clusters cutting across TTWA boundaries (although our analysis of Gateway to Research data and Meetup.com begins to address some of this). This could be addressed using ONS micro-data with more granular information about creative industries clustering, as well as Companies House data.47
Second, our analysis does not take into account freelancers, a critical component of the creative industries and the creative economy. We will try to address this limitation in the future. Some options include combining multiple Annual Population Surveys in order to boost sample frames enabling us to produce robust estimates for smaller areas, or combine official data with web data (for example from Meetup, which contains information about freelancer events) in order to proxy (‘nowcast’ and ‘placecast’) official freelancer statistics with more resolution and timeliness.48

Creative Nation: How the creative industries are powering the UK’s nations and regions
58
Third, throughout this report we have compared the performance of the UK’s creative industries with the rest of the economy. Going forward, we should use more sophisticated benchmarks for the evolution of the sector and its geography. Here, it would be particularly interesting to compare the creative industries with other strategically important sectors identified by the Government in its Industrial Strategy, which we could measure using web data sources that allow us to focus on emergent technology areas not captured by Standard Industrial Classification (SIC) codes.
Fourth, our analysis of the spatial dynamics of creative industries growth could be developed much further. We have only considered how growth in a sub-sector and measure of economic activity (employment or number of businesses) in an area’s neighbours is related to its own performance. One could envisage similar linkages across measures of activity and sub-sectors (e.g. does growth in Radio and TV employment influence the number of businesses in IT, software and computer services in neighbouring areas?). How are these dynamics moderated by the scale of activity in neighbouring areas, the physical geography and access to infrastructure – both physical and digital - in different parts of the UK etc.? Addressing those questions would help us understand better the mechanisms which link the performance of different locations.
Fifth, it is critical to get a better understanding of the drivers of creative business productivity and growth – this might require linking financial performance data from IDBR with other official surveys with information about company behaviours and activities, such as the UK Innovation Survey and the Small Business Survey.
Although we intend to address some of these questions ourselves, we hope that the open data we are publishing together with Creative Nation will enable other researchers to carry out such analysis, as well as addressing other interesting and important questions we have not thought about. Please contact us at [email protected] to tell us what you find.

Creative Nation: How the creative industries are powering the UK’s nations and regions
59
Appendices
Appendix 1: Data sources
1. Official data
We have used the following official data sources in our analysis:
• The Business Structure Database: An administrative dataset based on the Interdepartmental Business Register which includes SIC, location, employment and turnover data for all UK businesses registered for PAYE/VAT. In most of the report we have worked with Frontier Economics using BSD micro-data in the virtual micro-data lab. The exception is the size-band analysis, where we worked with data obtained directly form Nomis, the ONS labour market statistics portal.49
• The Annual Business Survey: A business survey with 2007 SIC, location and detailed financial data allowing the estimation of approximate GVA figures.50
• Companies House API: Data on profiles and addresses of private companies registered in the UK.
We queried these datasets with a list of official creative industries SIC and SOC codes based on the Dynamic Mapping methodology developed by Nesta and adopted by DCMS.51 Where possible, we used these datasets to produce estimates of creative industries business counts, employment and GVA at the TTWA level. One barrier to doing this with GVA is that ABS data is not available at the TTWA level. By contrast, we had GVA estimates for micro-businesses (businesses with fewer than ten employees) and non-micro businesses (businesses with more than ten employees). We scaled this, for the areas (TTWAs) inside a region, taking into account the size distribution of creative businesses in the TTWA based on the IDBR data. We advise caution in the interpretation of this proxy.
2. GlassAI
GlassAI track topics of interest across five hundred million web pages, watching over one million UK organisations. From these data, they produce structured market research and economic analysis at scale using machine learning and computational linguistics.
Their Semantic Crawl Engine systematically reads millions of domains and automatically determines how many domains are in the English language and related to UK-based companies. So far, they track over one million companies in the UK. These companies are automatically classified and sorted by sector, subsector and (for added granularity) companies are associated with ‘free’ topics from half a million candidate topics. This classification process generates probabilities that a company will be associated with a sector, making it possible to analyse overlaps between industries, as we have done in the analysis of creative embeddedness for this report.

Creative Nation: How the creative industries are powering the UK’s nations and regions
60
3. Gateway to Research
Gateway to Research data comes from two sources. Firstly, data has been acquired via the official Gateway to Research API, from which we have obtained all available data on organisations, projects and funds. Furthermore, Gateway to Research has been scraped directly from their website, as there is further information available for many organisations detailing their sector. The data is matched to Companies House by fuzzy string matching of names, addresses and postcodes. Latitudes and longitudes of organisations are acquired either through the postcodes.io API, or via the Bing Earth API.
4. Meetup
Meetup is a platform where users can organise and attend networking events. For the former, the user has to create a group that is then assigned to a thematic area. For the latter, the user has to join a group and register to its events. Meetup provides an Application Programming Interface (API) which we used to collect details on the platform’s tech groups. We narrowed our query to UK only results and collected information on the groups’ activities, location, organised events and member participation.
Appendix 2: Clustering analysisWe have identified different creative cluster models using an iterative strategy with the following stages:
1. Collect, rescale and reduce data about the creative industrial structure, composition and growth dynamics of creative clusters. We removed all observations with missing data, which explains why the number of TTWAs featured in this analysis is lower than the 48 creative clusters we focus on elsewhere. This step of the analysis involved some dimensionality reduction where we combined variables that were highly correlated with each other. This reduces the risk that the clustering is influenced by imbalances in the number of variables we use to capture different dimensions of cluster models.
2. Select the best performing clustering algorithm: the basic idea behind our clustering analysis is to find the best way to split the data into different groups composed of TTWAs which are more similar to each other (in the variables we are interested in) than to those in other groups. We ran a variety of algorithms 500 times each and selected the best performing one based on the silhouette score, a metric that compares intra-cluster distances with inter-cluster distances. This was a K-means cluster with six clusters.
3. Identify robust clusters: The allocation of TTWAs to clusters can change between different iterations of the algorithm for some of the edge cases. To obtain more robust clusters, we run the K-means algorithm 5,000 times and build a network connecting those TTWAs that tend to appear in the same clusters, and then decompose the network using community detection analysis methods in order to group those TTWAs that tend to fall in the same cluster more often. This gives us our final cluster model classification.
You can check our code in GitHub if you are interested in further detail.

Creative Nation: How the creative industries are powering the UK’s nations and regions
61
Appendix 3: Gateway to Research analysisAfter the data is acquired and matched as described in Appendix 1.3, academic institutes are primarily identified as those which are labelled accordingly on Gateway to Research’s website. Further labels are applied to Gateway to Research organisations based on whether they contain any of a list of key words.
All non-academic institutes (which collaborate with academic institutes) are matched to Companies House via their name, postcode, and address. If no good match is found then the organisation is removed from the analysis. The most highly connected organisations are generally found to be false matches to Companies House data, but the number of these is relatively small and so they have been pruned manually from the data.
Using SIC codes which correspond to the creative sector, a subset of the matches is produced for analysis. In the analysis, neighbouring TTWAs are defined as those which physically border one another. Analysis of funding is done per project, rather than funding allocated to individual organisations. The analysis of collaboration density is performed by generating a heat map of lines joining collaborators.
Appendix 4: Meetup analysisThe analysis of networking data was done in an iterative fashion and can be split into two main parts:
Clustering Meetup groups and assigning them to creative sectors.
Meetup groups use keywords, also known as tags, that characterise their activities. We preprocessed them using Natural Language Processing, reduced their dimensionality to 2D using a clustering algorithm called t-SNE and finally clustered that representation with Gaussian Mixtures. As a result, we created unlabelled collections of semantically similar keywords. We evaluated the produced clusters using silhouette score, manually labelled them and aggregated them to creative sectors. The table below shows some of the most used tags in them.

Creative Nation: How the creative industries are powering the UK’s nations and regions
62
Examining the diversity of local ecosystems.
To measure the diversity of the networking activity in a local ecosystem, we created a dataset that showed the user attendance in creative topics in the top 30 TTWAs for the time period 2012-2017. We used Brillouin index to examine how the attendance in these areas was distributed among the six creative sectors that were identified above. Another common metric to do the same work would be Shannon’s index, however Brillouin was preferred because the full composition of the community is known (we collected the total of the UK’s tech Meetups).
Software
Software architecture
Data warehousing
Cloud native computing
Android development
Javascript applications
Arts
Interactive art
Experimental art sound
Visual effects
Media arts
Animation
Crafts
Drones
Arduino
Raspberry pi
Makerspaces
DIY
Design
Creative design
Digital design
Design research
Experience design
Adobe indesign
Publishing
Cityblogging
Writing
Semantic seo
Wordpress workshops
Storytelling podcasts
Marketing
Youtube marketing
Digital marketing
Affiliate marketing
Digital marketing
Brand strategy

Creative Nation: How the creative industries are powering the UK’s nations and regions
63
Endnotes1. DCMS, 2017. DCMS Sectors Economic Estimates 2017:
Employment and Trade https://www.gov.uk/government/statistics/dcms-sectors-economic-estimates-2017-employment-and-trade DCMS, 2016. DCMS Sectors Economic Estimates. August 2016. https://www.gov.uk/government/uploads/system/uploads/attachment_data/file/544103/DCMS_Sectors_Economic_Estimates_-_August_2016.pdf
2. Haskell J. and Westlake, S. (2017) ‘Capitalism without Capital.’ Princeton NJ: Princeton University Press. Hawkins, J. (2001) ‘The Creative Economy.’ New York: Allen Lane.
3. Bakhshi, H., McVittie, E. and Simmie, J. (2008) ‘Creating Innovation: Do the creative industries support innovation in the wider economy?’ London: Nesta.
4. Bakhshi, H., Frey, C.B. and Osborne, M. (2015) ‘Creativity vs. Robots. The Creative Economy and The Future of Employment.’ Nesta, London.
5. Op cit. 1.
6. BEIS (2017) ‘Building our Industrial Strategy.’ London: BEIS. https://beisgovuk.citizenspace.com/strategy/industrial-strategy/supporting_documents/buildingourindustrialstrategygreenpaper.pdf
7. Caves, R.E. (2000) ‘Creative industries: Contracts between art and commerce.’ Cambridge MA: Harvard University Press.
8. Bernick, S., Davies, R. and Valero, A. (2017) ‘Industry in Britain – An Atlas. Centre for Economic Performance Special Paper, September 2017.’ http://cep.lse.ac.uk/pubs/download/special/cepsp34.pdf Florida, R. (2017) ‘The new urban crisis: How our cities are increasing inequality, deepening segregation, and failing the middle class and what we can do about it.’ London: Hachette UK.
9. Creative Industries Council (2016) ‘Create Together.’ http://www.thecreativeindustries.co.uk/media/243587/cic_report_final-hi-res-.pdf
10. http://www.ahrc.ac.uk/funding/opportunities/archived-opportunities/creative-industries-clusters-programme/
11. http://data-viz.nesta.org.uk/creative-nation
12. https://www.nesta.org.uk/blog/creative-nation-data
13. https://github.com/nestauk/creative_nation
14. Op cit. 1.
15. http://gtr.rcuk.ac.uk/
16. https://www.ons.gov.uk/employmentandlabourmarket/peopleinwork/employmentandemployeetypes/articles/traveltoworkareaanalysisingreatbritain/2016
17. By contrast with Local Authority Districts or Local Enterprise Partnerships.
18. In some cases we segment TTWAs by their region or nation. We allocate TTWAs into regions using their distribution of postcodes in the National Statistics Postcode Lookup.
19. We originally identified 47 clusters in the data, to which we have added Birmingham given the large size of this city.
20. Bakhshi, H., Lee, N. and Mateos-Garcia, J. (2014) ‘Capital of Culture?: An Econometric Analysis of the Relationship Between Arts and Cultural Clusters, Wages and the Creative Economy in English Cities.’ Working paper. London: Nesta.
21. This approach is inspired by what LSE researchers did in their Atlas of Industry. Op cit. 8.
22. Although estimate is smaller than the £40 billion estimated by GLA in its most recent update of creative industries GVA figures for the capital (also considering self-employed workers), it represents a similar share of the total. https://www.london.gov.uk/sites/default/files/working-paper-87.pdf https://www.london.gov.uk/sites/default/files/working_paper_89-creative-industries-2017.pdf
23. Op. cit 4. See also Mateos-Garcia, J. and Bakhshi, H. (2016) ‘The Geography of Creativity in the UK: Creative Clusters, Creative People and Creative Networks.’ London: Nesta; and Bakhshi, H., Davies, J., Freeman, A. and Higgs, P. (2015) ‘The geography of the UK’s creative and high–tech economies.’ London: Nesta.
24. Since location quotients, the metric we are mapping, can be distorted by noisy data in locations with low levels of overall activity, we only highlight those areas which are above the median of activity in the sector or sub-sector.
25. The situation in London is somewhat different because it contains only two TTWAs, London proper and Wycombe.
26. https://www.ons.gov.uk/economy/economicoutputandproductivity/productivitymeasures/bulletins/internationalcomparisonsofproductivityfirstestimates/2016
27. Op cit. 2. See also Shapiro, C. and Varian, H.R. (1998) ‘Information rules: a strategic guide to the network economy.’ Boston MA: Harvard Business Press.
28. Baumol, W.J. and Bowen, W.G. (1993) ‘Performing arts-the economic dilemma: a study of problems common to theater, opera, music and dance.’ Gregg Revivals.
29. Brighton, R., Gibbon, C., and Brown, S. (2016) ‘Understanding the future of productivity in the creative industries.’ London: SQW. http://www.sqw.co.uk/files/7814/7324/3296/SQW_2016_Creativity_sector_productivity_report-07.09.16.pdf
30. Maggs, P., and Hathaway, I. (2016) ‘Absorptive Capacity: Boosting productivity in the creative industries.’ London: Frontier Economics. https://www.frontier-economics.com/documents/2016/07/absorptive-capacity_frontier-report.pdf
31. Note that for this comparison we have used IDBR data available from the NOMIS online portal because sizeband data could not be extracted from the ONS Micro-data lab to avoid disclosure.
Creative Nation: How the creative industries are powering the UK’s nations and regions
64
32. The Industrial Strategy Commission (2017) ‘The Final Report of the Industrial Strategy Commission. Manchester: Industrial Strategy Commission.’ http://industrialstrategycommission.org.uk/wp-content/uploads/2017/10/The-Final-Report-of-the-Industrial-Strategy-Commission.pdf
33. Swinney, I., and Piazza, G. (2017) ‘Should we move public sector jobs out of London?’ London: Centre for Cities. http://www.centreforcities.org/publication/move-public-sector-jobs-london/
34. Florida, R. (2014) ‘The rise of the creative class - revisited: Revised and expanded.’ Basic Books (AZ). Glaeser, E.L., (2012) ‘Triumph of the city: How our greatest invention makes us richer, smarter, greener, healthier, and happier.’ London: Penguin.
35. Op. cit. 23.
36. Brown, R., Mason, C. and Mawson, S. (2014) ‘Increasing the Vital 6 Percent: Designing effective public policy to support high-growth firms.’ Working paper. London: Nesta.
37. Sapsed, J., Nightingale, P., Camerani, R., Mateos-Garcia, J., Voss, G., Coad, A. and Byford, J. (2013) ‘The Brighton Fuse.’ http://www.brightonfuse.com/wp-content/uploads/2013/10/The-Brighton-Fuse-Final-Report.pdf
38. We use the same definition of high-growth firms as the OECD: companies with more than ten employees at the beginning of the first period that on average experience 20 per cent or more growth in the next three periods.
39. By largest TTWAs we mean the creative clusters we identified in ‘The Geography of Creativity.’
40. Op cit. 23.
41. Hicks, D. (2011) Structural change and industrial classification. ‘Structural Change and Economic Dynamics.’ 22(2), pp.93-105.
42. This is similar to the approach taken in Nathan, M. and Rosso, A. (2015) Mapping digital businesses with big data: Some early findings from the UK. ‘Research Policy.’ 44(9), pp.1714-1733, and what we did in Tech City UK and Nesta (2016) ‘Tech Nation 2016.’ London: Nesta.
43. Bakhshi, H., Hargreaves, I. and Mateos-Garcia, J. (2013) ‘A manifesto for the creative economy.’ London: Nesta.
44. See op. cit. 20 for more evidence supporting creative spillovers, based on labour force survey data.
45. As Gateway to Research data does not explicitly list organisation type, there is some uncertainty on the total number of private companies. Therefore our lowest and highest possible estimate of the percentage of total companies is provided. In general, we consider our findings in this section to represent an upper estimate on the activity of creativity collaborations.
46. Op cit. 43.
47. As was done in Chapain, C., Cooke, P., De Propris, L., MacNeill, S. and Mateos-Garcia, J. (2010) ‘Creative clusters and innovation. Putting creativity on the map.’ London: NESTA.
48. Guzman, J. and Stern, S. (2016) ‘The state of American entrepreneurship: New estimates of the quantity and quality of entrepreneurship for 15 US states, 1988-2014 (No. w22095).’ National Bureau of Economic Research.
49. https://discover.ukdataservice.ac.uk/catalogue?sn=6697
50. https://discover.ukdataservice.ac.uk/catalogue?sn=6697
51. Op cit 1.

58 Victoria Embankment London EC4Y 0DS
+44 (0)20 7438 2500 [email protected] @nesta_uk www.facebook.com/nesta.ukwww.nesta.org.uk
Nesta is a registered charity in England and Wales with company number 7706036 and charity number 1144091. Registered as a charity in Scotland number SCO42833. Registered office: 58 Victoria Embankment, London, EC4Y 0DS.