creating value with homogeneous technology: electronic business
TRANSCRIPT

Creating Value with Homogeneous Technology:
Electronic Business Service Providers*
Shane Greenstein** and Sarit Markovich***
AUGUST 2006
Abstract
We study the determinants of market pricing for vendors providing “hosting and related services.” We propose a novel typology linking firm features and firm behavior to pricing. We test between two views about the creation of value in technology commodity markets, one affiliated with mobility of assets from old to new, and the other affiliated with business acumen and efficiency. We labeled these as origins and strategic behavior, respectively. Our analysis finds that both of these factors contribute to the variance of prices between contracts. However, the variance in prices between firms with different origins is much smaller than the variance in prices for firms pursuing different strategies. Overall, our findings stress that this market is far from homogeneous, because firms find a myriad of ways to differentiate themselves.
* We thank Chris Forman, Avi Goldfarb and Aviv Nevo for comments. All errors are our responsibility. ** Shane Greenstein is the Elinor and Wendell Hobbs Professor, Kellogg School of Management, Northwestern University, Evanston, IL 60208-2013. E-mail: [email protected] *** Sarit Markovich is an Assistant Professor, The Leon Recanati Graduate School of Business Administration, Tel Aviv University, Tel Aviv 69978 E-mail: [email protected].

1
1. INTRODUCTION The growth of commercial applications for the World Wide Web in the late 1990s
spawned a number of markets for Internet infrastructure services. A Web presence became a
necessity for businesses of all sizes—either as a source of information or as a selling channel. By
one estimate, seventy percent of small businesses in the United States had such a channel by
2005.1 This enormous growth in demand induced a large supply response. We study the
determinants of market value for one set of these new entrants, namely, those providing “hosting
and related services.”
We present a case study rich in detail about this market’s organization. Although
technically advanced, the basic elements of the service—such as memory for hosting a
catalogue—are seemingly homogeneous and common. The open question is whether differences
between firms, such as their branding efforts or investment in customer service, contribute much
to preventing market prices from tending towards incremental cost. More generally, this paper
asks, what factors allow vendors to construct private value in the face of commonalities in a
technically intensive market place? The answers inform an old and unsettled debate about the
sources of value during the early phases of a technology markets’ development.
Our approach frames this question in terms of a statistical analysis about pricing
behavior. This turns out to be easier to say than do. During our study period, which is 2001, this
market had only a handful of firms with more than a couple years’ experience. It had few
normalized procedures for measuring inputs or outputs, and in the eyes of the participants, the
hosting and related services market had only recently become stable. There was no widely
acknowledged industry norm for analyzing why some businesses had higher prices than others.
We propose a novel typology linking valuable firm features and firm behavior to pricing.
Supplemented with novel data, we examine different hypotheses about which factors command
higher or lower prices in spite of apparent commonalities. The first broad category of the
typology highlights features that firms developed prior to entering the hosting market. We label
these “origins.” For example, some firms developed brands prior to entering this market. Others
already had a customer base in a concentrated region. The second broad category highlights
1 According to a survey conducted in April 2005, by Harris Interactive.

2
behavior of firms after entry. We label these “strategic behavior.” For example, some firms offer
only high quality designs and expensive high-quality services. Such a choice is expensive to
design but not very costly to manage once it is designed. We also examine the strategic behavior
of firms of different origins. For example, the value from offering phone support might be higher
for an unknown firm without a reputation than for a branded firm. Finally, we examine some
strategic choices that are not as costly to alter, such as how much a hosting site discounts the
entry-level contract.
We apply this framework to the menu of prices and characteristics for 433 contracts
offered by 145 firms based in the United States in 2001. The data draw on several sources, which
we describe subsequently. Assembling this data is novel, so our descriptive statistics are the first
striking findings. There is a notable heterogeneity in firms and their strategies, especially given
the expectation that this is a homogeneous commodity market. Specifically, there is a remarkably
large combination of possible origins and strategic behaviors. Firms approach this market with
three different origins, four different strategic behaviors to arranging portfolio upgrades, and
more than five qualities of services ranging from basic to very advanced. Yet the variety does not
end there: Within those broad differences are even finer-grained differences. In addition, we also
observe a wide variance in the competitive conditions for a specific type of contract—some firms
offer services for which there are many close substitutes and some do not.
Such variety begs a question: Do these differences affect price levels? If so, by how
much? Addressing this question forms the second set of our findings. We estimate a price
regression for each contract as a function of a firm’s origin, strategic behavior, and degree of
competition. This approach allows us to address whether high prices arise from origins or
strategic behavior. As is well known, this type of approach cannot identify the profitability of
contracting features when firms can trade-off higher (lower) mark-ups for lower (higher) market
share. However, hosting has a number of special features that allow a researcher to identify the
separate contributions of costs and demand in some instances; in that latter case, we can also
make inferences about which choice is more profitable.
We demonstrate that neither origins nor strategic behavior alone explains pricing
outcomes. Both of these factors contribute to the variance of prices between contracts. However,
the variance in prices between firms with different origins is much smaller than the variance in
prices for firms pursuing different strategies. Of variance in strategies, the variance of value

3
affiliated with quality of service matters most for variance in prices. Strategic pricing of an
“entry-level” contract also shapes the variance in pricing, but not as much.
We reach two types of conclusions. One type of conclusion is about particular actions.
For example, the open source software for structuring electronic retailing is both high quality and
low variable cost, so it has strategic advantages for those firms who are able to deploy it.
Related, the low mark-up affiliated with origins suggest that origins cannot support high
profitability unless it translates into large market share, which – based on trade press reports of
industry events – we doubt occurred in this market at this time. The second type of conclusion is
the broad pattern of behavior in this market. These findings suggest that, when examined at close
range, there is much less homogeneity in the supply of services than is usually assumed.
Moreover, it arises because firms create a multitude of ways to differentiate from each other
through strategic behavior, which can and does produce large differences in the market price.
Such behavior could support profitability for firms with targeted user communities with inelastic
demand, which – based on trade press reports – appears quite plausible at this time.
We perform a wide set of checks for statistical robustness. We provide and test different
specifications for the pricing equation. We also attempt a second less straightforward statistical
approach, which examines the determinants of the range of prices offered by a firm, again as a
function of the same determinants. This statistical test largely confirms the findings of the prices
regressions.
Our paper unfolds in the following manner: The rest of Section I provides a literature
review. In Section II, we provide a review of the marketplace. Then, in Section III, we discuss
our data and provide a review of our key hypotheses. In Section IV, we discuss the key results,
and finally in Section V we present our conclusions.
1.1. Literature review How do vendors construct viable and valuable on-going economic entities in a young and
evolving and technically intensive market place? Our study informs an old and unsettled debate
about the sources of value in newly formed technology markets.
In one set of theories, rents accrue to those firms that successfully redirect assets
inherited or developed in prior market episodes. These firms differentiate from others by
investing in services and operations that build on a history others cannot imitate. In another set

4
of theories, the rents accrue to firms that develop savvy strategies, or possess business acumen
and efficient execution. These firms can be either newly founded or established firms. They
differentiate from others by investing more cleverly than others, leading their organizations to
perform unique services at lower costs. In our typology, the first argument is represented by
origins while the second is represented by strategic behavior. In other words, if we find that
origins creates substantial value among hosting firms then we infer that the history of these firms
conferred advantages, as the first argument asserts. If we find that strategic behavior is
associated with value then we infer the latter argument has merit.
Related issues arose in a recent debate about the factors shaping the value chain in the
“new economy.” This debate reached a fever pitch during the late 1990s and early 2000s, during
and after the frenzy of financial investment in dot-com businesses. One view interpreted this
market opportunity in terms of the strategic choices facing established firms, foreseeing
economic value arising primarily from investments and actions with strong links to existing
organizational goals and historically developed assets – particularly those that could not be easily
imitated. An alternative view emphasized the ability of the new firms to build organizations that
displaced incumbent firms with a new value chain.2 In our typology we would support the first
argument if origins shape a substantial portion of market value, while we would support the
second if strategic behavior does.
These prior debates also distinguish between strategic behavior that requires a firm to
commit to a sunk investment, and those that take recurring (fixed or variable) expense. Typically
the former applies to all the organization’s products, such as the quality of the design of its
product line. The latter applies to facets that are easily changed during regular operations, such
as the number of units sold, potentially at a licensing cost per contract if the hosting firm resells
the software of another firm.
These and related issues have motivated prior investigations into the sources of value at
organizations serving Internet markets. This literature has not focused on the sources of value for
the type of upstream hosting we examine. This service is sold to retailers who want an electronic
web presence, but do not want to build and manage their own retail operation. The most closely
2 This first view was articulated earliest by Porter (2001), and expanded on by Forman, Goldfarb and Greenstein (2005). For a review of these types of arguments and different assessments about which ones have held up to further scrutiny, see, e.g., Norton (2003), Hanson (1999), Kenney (2003), or Ehrmann (2003).

5
related literature about hosting activities has tended to be case-based. It has focused on
identifying the needs of managers or entrepreneurs by helping them both achieve operational
excellence and recognize the factors that shape their market position without repeating errors of
the recent past.3 Another related literature has provided insight into the pricing behavior of other
on-line participants, such as retailers and intermediaries – though not the hosting firms we
study.4
Our approach is related to the small body of statistical studies of the sources of value
from differentiation among computing and Internet firms serving evolving markets. As with
these studies we closely examine a snapshot for an industry and relate features of firms to their
pricing. As in this work, we link firm decisions to differences between the market environments
facing firms.5 In comparison, in our study, we have greater information about the aspects and
sources of differentiation and its value than other studies, but our data about market share and
market demand will be weaker.
Our statistical approach resembles the few other empirical studies of contracting in
technology markets, i.e., we closely examine each contract’s features and classify these features.6
As in other research where contracting practices have never before been analyzed, we focus on
establishing the statistical regularities and identifying the underlying economic relationships
determining value. In this sense, we also resemble empirical studies of pricing of other high
technology firms.7
We know of only one paper examining pricing in related markets and firms, namely,
Thompson and Thompson (2005), in which the authors estimate a hedonic price equation for a
sample of hosting firms gathered from the FastFind Directory. We ask quite a different question
3 See e.g., Hanson (1999) and Kalakota and Whinston (1999). 4 See, e.g., Spulber (1999), Lucking-Reilly and Spulber (2001), Clay, Krishnan, and Wolff (2001), Brynjolffson and Smith (2000), Elfenbein and Lerner (2003), Friberg (2003), Scott-Morton, Silva-Russo, and Zettelmeyer (2001), and Ellison and Ellison (2005). 5 For example, Bresnahan, Stern, and Trajtenberg (1997) highlight two dimensions of differentiation, the technological frontier and branding, and link these to a demand model. Augereau and Greenstein (2001), and Greenstein (2000) focus on differences in the quality and breadth of services offered by Internet Services Providers (ISPs) in geographically local markets, highlighting whether such firms offer high-speed service, networking services, hosting, or Web design services. 6 See, e.g., Lerner and Merges’ (1998) study of contracts between venture capitalists and biotech firms or Elfenbein and Lerner’s (2003) study of contracts between Internet portals and their online partners. 7 Much of this dates to Griliches (1961). For recent work see, e.g, White, Abel, Berndt and Monroe (2004) on prices for operating systems, Berndt, Griliches and Rappaport (2005) on prices for personal computer hardware, or Berndt and Rappaport (2005) on pricing of mobile computers.

6
from their study, so our data sets differ considerably. We add additional information for the
market’s structure or strategic behavior, documenting the origins of firms, the role of local
geography, the firm’s approach to upgrade of contracts, etc'. We also analyze an essential
institutional practice, the propensity of some types of firms to resell third-party carts (which we
describe below) while others develop their own cart. This practice shapes observed quality. Such
data is hard to collect, so their data set has more observations than ours. We view this as a trade-
off between a rich description of a small data set and a narrow description of a large data set. We
chose the former because it suits our research goals.8
2. TOWARD A FRAMEWORK FOR THE ELECTRONIC BUSINESS SERVICE
PROVIDER MARKET We examine electronic business service providers (eBSPs) operating in 2001. In this section we
provide information about how the structure of this market shapes our study.
By 2001, the commercial Internet had diffused to over half the households in the United
States and to virtually all medium and large businesses—with estimates for retail electronic
commerce exceeding $32 billion a year in the United States.9 This demand grew from almost
nothing six years earlier, motivating a rapid build-out of the network infrastructure supporting
the commercial Internet, most of it in applications of the World Wide Web.
In the late 1990s, the growing demand for the commercial Internet motivated the entry of
a wave of many providers of infrastructure services to make the network operate efficiently. It
also motivated, more infamously, a large number of short-lived dot-com entrants, many of whom
formed part of the customer base for the hosting firms we study. Ultimately, hosting services
survived the dot-com boom and bust, becoming a durable upstream service in this market. Many
“brick and mortar” outlets demanded their services for on-line sales channels.10
8 We also think this does not cause misleading interpretations. For example, Thompson and Thomson argue that their data supports the hypothesis that large firms can charge a premium for their product. Yet, they use the number of contracts a provider offers as a proxy for the size of the provider. We too find that prices increase as firms offer more contracts, but we show that this has little to do with firm size. In our view it is an instrument for price-discrimination. 9 See e.g., Table 6, U.S. Electronic Shopping and Mail Order Houses (NAICS 454110) for total sales in 2002 in E-Stats, http://www.census.gov/eos/www/papers/2002/2002finaltables.pdf. 10 It is difficult to estimate the total value of this activity. The activity described in this study falls into several different areas: “Web-Site Hosting” by ISPs reached over $600 million in 2001 for NAICS 514191, which is On-

7
These few years can be characterized as a period of rapid “learning by trying” and
market-based experimentation (Cusumano and Rosenbloom 1987, Rosenberg 1994), where firms
explored a variety of service offerings and pricing strategies for those offerings, learning about
the fundamentals supporting costs and demand. We know from interviews that by 2001 most of
the larger and more experienced firms had grown out of their entrepreneurial origins, developing
professional sales staffs and routine administrative procedures.11
The eBSPs were the largest class of infrastructure firms that provided hosting services.
They offered solutions for businesses. These businesses users were interested in creating an on-
line store or in improving their already existing on-line storefront, but they were not interested in
or not capable of performing activities related to its maintenance and set up. That is, these
businesses users anticipated the value of an on-line outlet, but were small or medium-sized, and
without a large set of employees devoted to information systems operations. Hence, they
generally preferred to outsource development activity and operational tasks. Large business users
with in-house staff also may have preferred to hire an eBSP if the needs of the storefront
exceeded the capabilities of the staff (e.g., because its scale was large).
An eBSP offers a bundle of services, namely, disk space along with storefront software.
In the most common configuration, this software includes a store-builder and a store-manager.
The store-builder helps with creating the on-line store—designing the store’s layout—usually
within the limits of a predefined template. The store-builder also helps with recording the
products’ characteristics: name, price, picture, and quantity (most store-builders require a manual
entry of each and every product, while some offer automatic loading). Once the store has been
created, the store-manager accepts on-line transactions, calculates taxes, manages quantities, and
line Information Services (see Table 3.4.2 in of the U.S. Census Bureau 2001). However, many of the other related activities, such as consulting, Web-site design, and Web-site and maintenance, are in other subcategories throughout national statistical data, such as, for example, NAICS 5142, or Data Processing Services, so $600 million is an underestimate. 11 For example, in one colorful ad a few years later, Affinity used a slogan “You don’t have to pay your sister’s boyfriend’s neighbor’s cousin to design your web site anymore.” Then below it says in small type “Let the real experts at Affinity design, develop and host your web site—we even include monthly updates. Once that’s up and running, take a look at our marketing and optimization services to get the most out of the web. To speak to a professional, call….” (PC World September, 2005 ,p. 69).

8
produces reports. We refer to these storefront templates as carts, the industry label that is short
for electronic shopping cart.12
Carts include many features. We describe them in some detail because we subsequently
will use this detail to catalogue cart quality. Most carts have the following:
1. Templates: Different layouts, color schemes, and styles for the storefront display;
2. Inventory Controls: An inventory manager that prevents backorders and sets the quantity in
stock;
3. Shipping Calculators: A feature that automatically calculates the cost of shipping the
products to the customer, primarily on the basis of weight and location;
4. Tax Calculators: A feature that automatically calculates the tax on products shipped within
the United States;
5. Customer Reports and Trend Reports: Overviews of the activity on the store’s site, such as
a count of viewed pages, the average number of pages each visitor looked at, and which sites and
search engines referred the visitors to the site.
In addition, some carts contain the following:
6. Transaction Data Exporters: A feature that helps keep track of sales for accounting
purposes;
7. Catalogue Importers: A feature that enables the use of a database, such that the store data
can be uploaded from a file rather than added one by one;
8. Coupons/Discount Creators: Ways to create coupons for customers to use in the store;
9. Site Search: A search engine for items on the store’s site; and
10. Tools for Saving User Profiles.
The presence of the five latter features is a symptom of a high-quality cart. Their absence
normally signals shoddy or low-quality workmanship.
An eBSP charges a monthly fee that depends on the contract’s hosting level as well as on
the quality of the cart. Providers have the option to offer contracts with small disk space, large
disk space, or both. In some cases, eBSPs can offer a wide array of contracts so a potential
12 A closely related business line offers “application service provision,” where the hosting firm offers regular services associated with database maintenance or security. We confine our attention in this paper to services associated with maintaining an electronic retail outlet.

9
customer can start with the basic contracts, and if needed, can upgrade to a better contract with
more disk space and a higher-quality cart.
Switching costs for the buyer may arise after an initial transaction, depending on the
earlier transactions between the eBSP firm and the customer. The customer and supplier must
spend time on creating the store, uploading the data, and learning how to use the software. This
is a time-consuming learning process and costly set-up activity, some of which becomes sunk
once expended. These can be important costs when new customers are uncertain about the scale
of the on-line stores they want to build. That is, for some users the scalability of the contract in
the future can be a very important consideration. A forward-looking user considers the whole
product line offered by the eBSP before choosing a provider. Using industry parlance, we label
this as the upgrade path.
We observe a variety of approaches, or strategic behaviors, with regard to cart quality and
the design of upgrade paths. This empirical variance in the uncommon parts of the business, by
itself, is noteworthy because it has never been documented and it seems to be inconsistent with
the common belief that this market involves a homogeneous product. As preparation for
examining empirical data, we summarize our typology for analyzing this variety in Table 1, and
describe it in more detail below. We begin by describing the variety of origins of firms, then
continue with cart quality and upgrade paths.
In the first dimension of our framework, we observe entrants with three different origins.
We label them Brand, Local, and Specialist. Brand firms, like Microsoft and IBM, charge a
premium because of their name and other services users affiliate with their name. These firms
attempt to extract rents for their promises of reliability, continuity, and quality service in a
market with high turnover and uncertain supplier future.
Before entering the eBSP market, Local firms were in a related business, typically as an
ISP. Locals enjoy a pre-existing and often geographically local relationship with a set of
customers near their headquarters, to whom they now offer hosting services. In this situation, the
Local firm offers complimentary services that take advantage of close relationships between the
supplier and buyer or of other factors that underlie trust, which is a valuable factor to some
buyers in a market with as much uncertainty as this one.
The third set of entrants is a Specialist. Most of these firms are newly founded. They
specialize in all facets of being an eBSP and are typically small firms that develop all their own

10
software. Specialists and Local firms have headquarters in some location. That location may
affect the ability of the hosting services, either by shaping the set of customers in local markets
or by shaping the local labor market. In this sense, the location of the provider is also an
important element of its origin.
The second dimension of our framework is strategic behavior, which encompasses both
cart quality and upgrade path. Stating that the three firm identities coincide with distinct
approaches to offering quality is partly a statement about competitive forces. The vast majority
of specialists focus on offering high-quality solutions, typically programmed by their own
employees. When these firms provide only low-quality carts, they have little to distinguish
themselves from others. In contrast, since the storefront services are not the core business of the
Local firms, these firms buy a third-party cart and resell it to their customers. The quality of the
carts offered by Local and Brand firms varies considerably, depending on the firms’ reselling
choices.
The upgrade path highlights a firm’s portfolio of contracts. By definition, all firms offer
either a single product or a product line. Most firms do the latter. Often, there is a natural
sequence to the product line, one that suggests an upgrade path for an expanding user. That said,
not all firms offer the same potential upgrade paths. When a firm offers a product line, potential
buyers may place different valuations on the attributes of the contracts they do not purchase
today but may in the future.
Although we discuss the details of the upgrade path subsequently, we now offer a general
outline. Suppliers have two broad choices to make: (1) the number of different product varieties
offered along the product line, and (2) the "breadth" of the commodity and the advanced feature
spectrum. The upgrade path offered by firms generally only pertains to the homogeneous
features, while the advanced features apply to all potential goods from the firm. We further
define the homogeneous features along two-dimensions: memory size and number of product
slots. The advanced features spectrum is multidimensional.
Interviews with firms verified that suppliers have differing costs for producing the
homogeneous and advanced features. For example, some firms already employ skilled
programmers for other activities and can assign them to this activity for periodic needs. Or,
some firms are located in locales with a thick supply of talented programmers available for
contract hire and can readily and comparatively cheaply put together the team they need to

11
support high-quality service, even with employee turnover. Hence, while some firms find it
relatively cheap to offer high-quality homogeneous features (e.g., more storage or product slots),
others do not. Similarly, while some have relatively lower costs for offering high-quality
advanced features, others will not. Because firms face different costs for providing these
different options, there is no compelling reason for them to make similar choices. Altogether,
these factors lead to the potential for a wide variety of offerings. The open question is whether
this variety induces large or small differences in the ability of the firms to charge high or low
prices and margins over cost.
The data for this study comes from 2001. By then, market forces had already eliminated a
set of risky (or, perhaps, better characterized as intemperate) approaches to upgrades. For
example, during 2000, before the dot-com crash, many providers offered their basic contract for
free and charged a monthly fee only once the consumer chose to upgrade to a better contract.
This strategy was aimed at generating switching costs with users, with firms gaining revenue
later as long as the users remained with their existing provider. The crash of 2000 appears to
have rendered this pricing strategy ineffective or simply unpopular, as by 2001 the providers
who offered free contracts either went out of business or moved to charging a monthly fee for all
contracts.
3. HYPOTHESES DEVELOPMENT AND MEASUREMENT By 2001, the eBSP market contained a large number of providers offering a large variety of Web
solutions, from basic hosting to sophisticated store managers. In this section we describe the
data we collected about these firms.
To build a comparable set of services, we focus on custom Internet solutions offered to
small and mid-sized firms, which offer on-line transactions in addition to help with building and
managing the storefront. We include only those observations that (1) offer a store-builder, (2)
offer on-line credit card processing, and (3) do not require users to have any knowledge in
HTML/ XML or any other computer language.

12
The data collection process was as follows: We first searched Yahoo! and thelist13 for
listings of providers. We then looked at each provider Web site; and for each contract offered,
we collected information on monthly prices.14 We kept observations that were complete. In total,
we collected data on 433 contracts offered by 145 firms. As a further check, we randomly called
a number of providers to verify the on-line quotes; we found no discrepancies.
We now discuss the definitions of the variables that determine price. As before, our
discussion follows the framework in Table 1.
3.1. Origins Firm Identity before Entry. Does the provider’s origin shape its ability to mark up above cost
with a targeted customer base? If specialists have a set of custom services in their software, then
specialists may command a premium over locals who resell others software.
Firm origin was comparatively easy to assess. The few Brand firms that existed in 2001
were IBM, Microsoft, Yahoo!, and Ameritech. Another prominent branded firm, Intel, had
recently exited. All the Local firms were regional ISPs from a wide variety of locations across
the United States. There were also a significant number of Specialists. Overall, we have in our
data 11 contracts by Brand firms, 389 by Locals, and 33 by Specialists. In our regressions, we
define two dummy variables, Brand and Local, respectively. Specialist is omitted.
To save degrees of freedom in some specifications, we group Brand and Specialists under
the same group, and define it as Self-developers. We use the Self-developer group when
analyzing the extent to which different types of providers can charge a higher premium for any
of the services they offer and use the variable SelfDeveloped when doing so. Obviously, in this
case the omitted variable is Local.
Location of Firm: We expect firms headquartered in locations with more Internet-savvy
businesses to have access to thicker labor markets for talented programmers, which then lowers
13 This site, maintained by Meckler Media, provides ISPs the opportunity to advertise their services. The ISPs fill out a questionnaire where the answers are partially formatted, then the answers are displayed in a way that allows users to compare different ISP services. 14 Since, in some cases, the pricing quotations advertised on thelist were inaccurate, we disregarded these quotes and used only the quotations advertised on the providers' Web site.

13
costs. We also ask whether Specialist firms react differently to differences in labor market
conditions than the other types, who can move labor around multiple tasks.
Geographic location was defined as the city in which the firm locates its headquarters.15
We form an index of the thickness of the labor market based on several different attributes of a
location. We consulted an index of the Internet development of business establishments
compiled by Forman, Goldfarb, and Greenstein (2005). Two indices measure two distinct
features of a city: (1) the fraction of establishments that have advanced Internet infrastructure
and (2) the fraction of establishments that have any basic Internet technology. Following
Forman, Goldfarb, and Greenstein, we call these enhancement and participation, respectively.
We found that participation did not predict much, because business use of basic Internet
technologies did not vary much across locations, having reached saturation almost everywhere.
Hence, we dropped participation. As a measure of labor market thickness for technical talent,
Top25 is a dummy for whether the firm has a headquarters in one of the top 25 areas for
enhancement among the fifty areas in the United States with a population of one million or more;
enhance25 interacts Top25 with enhancement.
3.2. Strategic Behavior Commodity Technology Attribute: If incremental changes in common features are priced at their
variable cost, prices are an additive weighted sum of per-unit price. This additive hypothesis is
one null hypothesis. An alternative hypothesizes about the presence of economies of scale in the
operation and deployment of services. This would result in lower per-unit price at higher levels.
Standard contracts provide users (e.g., store owners) with server space. We define the
variables Storage and ProductSlots as the available disk space and the maximum number of
product slots allowed in the store, respectively. Some firms, however, offer contracts with an
unlimited, or infinite, amount of features in either one dimension or both. There were several
different but econometrically equivalent specifications for this feature of contracts. We employ
the following: In case of an infinite amount of storage or product slots, the variable is set to a
somewhat arbitrary number, at a level equal to a step above the highest level in the data. Then
15 Note that for the Brand firms this index might be meaningless, but following our standard procedures we give each the index for their headquarters (e.g., Redmond for Microsoft, Armonk for IBM, Santa Clara for Yahoo!, and Chicago for Ameritech). These are all major areas at the high end of our index for sophistication, so there is little variation between them and any other specialist in a similar area.

14
the corresponding dummy variable, that is, InfStorage or InfProdSlots, is set to one. These
arbitrary numbers are 5000 MB for storage and 200,000 for product slots. Note that since from
the store owner’s point of view, the variables ProductSlots and Storage are complements—a
store owner would not value a contract with unlimited disk space (or, conversely, product slots)
but a very small number of product slots (or disk space) as most of the offered disk space (or
product slots) cannot be used. We further discuss this point subsequently.
Quality of Cart Choice. A cart is a combination of a store builder and a store manager and its
quality is directly related to the quality of the store-builder and the store-manager software.
Higher quality, as measured by Qk, should command higher value across all contracts. In
addition, it is more important for Specialist firms to emphasize their quality to potential buyers
that might not otherwise know or trust them. Hence, we look for evidence that the quality of the
services from Specialist firms commands a different market value than similar quality from
Brand or Local hosting firms.
As was previously noted, we found 10 relevant features for an on-line store that are
indicative of the software’s quality. Each cart received one point for the availability of each of
these features. Hence, in practice, the variable Quality takes on values between four and ten. We
provide descriptive statistics on the carts’ quality in Table 2. We call this Quality in the
regression below. We also add one additional measure of quality. PhoneSupport is a dummy
variable that gets a value of one if the monthly price includes free phone support. Phone support,
which many providers charge extra for, is a very important service for the new on-line
storeowner. If the free phone support is given only for couple of months PhoneSupport gets the
relative fraction of these months within the first year. To test for different behavior of self-
developer we add SelfQual and SelfPhone, which interacts SelfDeveloped with Quality and
PhoneSupport, respectively.
Our data consists of eight different third-party carts and sixteen Specialist carts. It is
necessary to note here that we kept the Brand and Specialist firms separate in our analyses as
long as possible, but when we interacted the variables with each other we needed to combine
Brand and Specialist firms into the Self-developer group due to the small number of Brand firms
available. In Table 2, we still use the separate groups— while dividing the Locals into four

15
subgroups—and show the distribution of the most common carts16 along the storage, product
slots, price, and quality lines.
The results in Table 2 show that, on average, Local firms tend to offer more storage than
Specialists. This is consistent with the higher storage costs that Specialists have. Whereas there is
dispersion with the amount of storage offered, with product slots, each third-party firm tends to
offer only a specific range. Specifically, Miva and Akopia only offer an unlimited amount of
product slots, while AlaCart offers contracts with a comparatively low amount of product slots.
In terms of range of cart quality, Table 2 shows that AlaCart is at the low-end, Miva is in
the middle, and Kurant and Akopia are at the high end. The Specialists are found everywhere
along the quality line. Accordingly, we define Akopia, AlaCart, Kurant, and Miva as dummy
variables of the major carts and omit the four small carts. We treat these as “fringe” suppliers.
Upgrade Path: We also examine the availability of an upgrade path. We expect contracts to be
more valuable if they are part of larger portfolios. We also expect that the two homogeneous
features of hosting—memory and product slots—are complementary, so we expect pricing to
value upgrade paths that growth both features together without limitation.
With regard to contract position, we ask, Does the position of the contract within the
portfolio affect its price? There is no consensus prediction in the literature, so we make no
predictions. In the classic Mussa and Rosen (1978) model, mark-ups at the bottom of the product
line are distorted upward to induce purchase at the top of the product line, where there is
monopoly pricing. More recent generalizations by Rochet and Stole (2002) argue that this effect
depends on trade-offs between the participation constraint and valuation of vertical quality
dimension. The switching cost literature (e.g., Farrell and Klemperer forthcoming) or the more
recent literature on versioning of information goods (Shapiro and Varian 1998, Chen and Hitt
forthcoming) suggests a starker prediction. A firm’s price will be low at the bottom of the
product line to attract consumers who will purchase higher margin products later. In the spirit of
this variety of predictions, we test for any departure from pricing norms stemming from the order
and position of a contract in a portfolio of products.
In practice, firms offer two types of upgrades: (1) software upgrades with additional
features to better manage the on-line store, and (2) hosting upgrades with additional product
16 Constitute 90% of all observations. The other 10% involve four other uncommon third-party carts.

16
slots, storage, and e-mail accounts to expand the on-line store. While Self-developers are free to
choose their software upgrades, Locals are tied to the upgrades offered by the third-party cart.
That is, all Locals that offer the same third-party cart will offer exactly the same software
upgrades and can differentiate themselves only with the combined hosting contract.17 This,
however, does not set Locals apart from Self-developers in terms of the number of contracts
offered within a portfolio.
Since store owners value portfolios that offer contracts with a balance of product slots
and storage, we expect providers to offer portfolios of balanced contracts along which users
could grow; actual data, however, seem to defy this expectation.18 There are two ways to view
this: First, in Table 3, we show the storage–product slot offerings distribution. For each storage–
product slot range combination, the Table gives the number of contracts offered (top number)
and the average monthly price of these contracts (bottom number). The combinations are spread
all over the storage–product slot space. Second, the Table shows that providers tend to use a
limitation on one dimension of the space (storage or product slots) as a tool to also limit the other
dimension. Almost 60% of the contracts in our data limit either storage or product slot space, and
of these more than 80% offer an unlimited, or infinite amount of product slots. Note that 10% of
the available contracts offer an unlimited amount of product slots with a small amount of storage
(less than 50 megabytes, or MB), while there are no contracts that offer unlimited storage with
less than 25 product slots. In addition, note that there is plenty of variability in the pricing of the
contracts, without any notable trend.
As it turns out, a firm’s upgrading path strategy is highly correlated with its origins as
well as with the third-party cart the firm offers. In Table 4, we return to using the separate
variables of Local, Brand, and Specialist firms. Of the firms that offer more than one contract,
most tend to upgrade along the storage line, in which case the number of product slots stays the
same for all contracts within a portfolio. While high-quality carts like Akopia and Miva mostly
do not limit the number of product slots, lower-quality carts like AlaCart tend to fix the number
17 Kurant, the only exception, offers carts with two different quality levels. 18 One interpretation suggested to us was that this represented deliberate attempts at obfuscation by vendors—see, for example, Ellison and Ellison (2005). Another was that this represented a simple marketing strategy to “frame” middle choices, making them appear comparatively more attractive by making the end choices appear to be less attractive. We are agnostic between these and other explanations. As elsewhere, our approach is to characterize this behavior and identify whether it facilitates higher or lower prices, then we discuss the range of interpretations the estimates allow for.

17
of available product slots at a low level, in which case the marginal benefit from additional
storage decreases as the available storage increases. Note that when offering an infinite amount
of product slots while limiting the available storage, firms essentially use one dimension to limit
the storage–product slot space. Specialists use many different upgrading strategies; however,
they tend to use one specific dimension to limit the whole space. That is, they upgrade along one
dimension while not limiting the second one.
Given this behavior, we experimented with a variety of specifications for the portfolio
choice. Because it is the least common, the choice to fix storage levels is difficult to identify
from other behavior. We, therefore, define a dummy variable, Notfixed, to account for the
differences between contracts that are part of a portfolio where one feature is fixed and contracts
that are part of a portfolio in which both features grow. As can be seen from the data in Table 4,
29 firms offer contracts without fixing either storage or products along the upgrade path.
We also define a variable for the position of a contract inside this upgrade path. We
define three variables, Bottom, Top, and Position. Bottom is a dummy variable for the smallest
contract in a portfolio. Top is a dummy for the highest. Position is a variable number that equals
one for the lowest contract, two for the second, and so on. The variable Portfolio gives the
number of contracts the firm offers. PortBottom and PortTop interact Portfolio with Bottom and
Top, respectively.
3.3. Competition. If a firm has market power, then presence of competitors might not affect pricing. We consider
two versions of this hypothesis. In one view, market power arises from firm characteristics, so
the presence of competitors has no effect anywhere. In another, firms have little market power at
the “entry level” end of their portfolios and more at the high end, which forecasts systematic
differences in the sensitivity of prices between the high and low end of a portfolio.
As it turns out, firms tend to offer their homogeneous features at a few modal levels or
ranges. Hence, it is straightforward to define competition at a practical level around scalar focal
points, such as “between 80 and 100 products.” We then define competition around supply
within each storage–product slot box as is shown in Table 3. In each segment, firms compete
both with contracts offering the same cart as well as with contracts offering different carts. That
is, in general, competition within segments depends on the total number of contracts within the

18
segment, the total number of firms, as well as the total number of different carts. We define the
following additional variables: marketSize is the total number of contracts offered within the
segment and the overall number of carts competing within a segment; numCarts is the number
of different carts offered within a segment.
Though each firms treats its rival’s decisions as exogenous, we still face an endogeneity
issue related to an omitted variable. For example, Table 3 shows that the high end of the space is
very crowded. Does the heavy competition on the high end of the product slot space limit the
firms' ability to extract high value? Or does high supply simply reflect the presence of more
users in these segments? The first (second) process supports a negative (positive) relationship
between more competition and prices. In light of these inherent ambiguities, we interpret the
coefficients for these variables with caution.
3.4. Interpreting Firm Heterogeniety Our descriptive statistics support a rather striking observation: There is a considerable
heterogeneity in firms and their strategies, contrary to the expectation that this is a homogeneous
commodity market. Specifically, our discussion above shows there is a large combination of
possible origins and strategic behaviors. Firms approach this market with three different origins,
four different strategic behaviors to arranging portfolio upgrades, and more than five qualities of
services ranging from basic to very advanced. Moreover, the variety does not end there: Within
those broad differences are even finer-grained differences. In addition, we also observe a wide
variance in the competitive conditions for a specific type of contract—some firms offer services
for which there are many close substitutes and some do not.
Such variety begs a question: Do these differences affect price levels? If so, by how
much? This is the question we turn to next in our regression analysis. In this section we discuss
the interpretation of these coefficients.
The unit of observation is the contract offered to potential customers. For each contract, i,
we observe a price offered to customers, as well as a vector, Xi, which represents the features of
each contracts. We will assume that there exists a function that maps features into prices. In
practice, we might consider a function such as Pi = f(Xiβ) + ei, where e is an error term, f is
chosen by a set of econometric procedures, and β must be estimated. Now we consider the
interpretation for estimates of β.

19
Pi is produced by firm of type f, where f can be Brand, Local, or Specialist. We observe
the vector of characteristics Mi, Si, Qi, where these are contract variety i's memory size, number
of product slots, and quality of features, respectively. In addition we observe the geographic
location of the firm, Gi, its choice of cart Ki as well as the specific upgrade path that the firm
offers, Ui. Finally, l is the position of the contract variety within the firm's portfolio, which we
define subsequently. It will be an ordinal category, such as lowest, highest, or middle contract
within a portfolio offered by an eBSP. We denote by Nc the total number of firms that offer a
contract variety with an overall similar level of homogeneous features. In general we write the
price function as f(f,l,Mi,Si,Qi,,Gi,Ki,Ui,Nc), where we have treat all these determinants as
exogenous. In practice, empirical data will violate this exogeneity assumption, especially for Nc,
which concerns us less because we treat it as a control. We defer a full discussion until later.
Now we discuss the interpretation of the coefficients. We imagine a two step entry
process, where firm first enter and then, second, they compete. From the viewpoint of a firm in
2001, most of these entry costs are sunk. We think of contract i's cost function as pertaining to
only its variable expenses, while the monetary component of entry costs are debts the firm tries
to pay through pricing above variable costs. For reasons will describe momentarily, we write the
costs function as C(Mi,Si,Qi,,Gf,Kf). Hence, we will think of f, l, Uf, and Nc as contributing to
contract i's margins above costs, but not costs levels. In some situations we can also interpret Qi
similarly.19
Some of this is straightforward. It is clear that increases in memory and product slots, Mi
and Si, raise both unit costs and prices for a contract. Hence, a positive coefficient on either
variable is uninformative about margins. In contrast, while it is clear that higher Qi, should raise
prices. Some qualitative improvements involve regular operational expenses that affect unit
costs, such as phone support, while other qualitative differences among firm arose from costs
incurred at entry, such as software design. We can attribute margins to quality when those
qualitative improvements involve little operational cost or the costs are largely sunk, as they are
19 Note that there was almost no new entry into this market after the dot-com crash. As a result, we do not observe any firms who entered around the time of our survey. Most firms expended the vast majority of their entry costs before we observe them.

20
for self-developers.20 However, for a local firm the cart choice, Kf, shapes a firm’s prices as well
as variable costs, since cart owners may charge licensing fees (except when it is open source).
Hence, a coefficient on carts informs us about price, but not margins.
By a similar line of reasoning, upgrades strategies involve few operational expenses, so
we interpret differences in price levels affiliated with a firms upgrade strategy, Ui, and a
contract’s position, l, as indicating differences in margins. By similar reasoning, the level of
competition for each contract, Nc, affects margins, not costs.
Finally, when interpreting the firm type, f, we also bring one historical trend to our
interpretation. Most of these firms were not mass market providers. Most local firms and
specialists attempted to target user communities with inelastic demand. In these cases we
associate higher prices for a type of firm with greater margins. We do not expect low mark-up to
support high profitability unless it translates into large market share, which – based on trade
press reports of industry events – few, if any, of these firms achieved. Judging from news
reports, even the branded firms did not realize such aspirations. 21
4. DETERMINANTS OF CONTRACT PRICING In Table 5, we present four specifications analyzing the effect of origins as well as strategic
behavior and competition on firms' pricing strategies. We follow statistical procedures
established by prior researchers (Berndt 1991). For each specification, we present the Ordinary
Least Squares estimators with clustered standard errors.22 The log of prices is the dependent
variable.23 In all our estimates we assume the right-hand-side variables are statistically
exogenous and discuss ways in which violation of this assumption might shape the interpretation
of coefficients.
20 While the coefficient tells us about which designs generated higher or lower margins for a self-develop, it will not tell us whether the total incremental improvement in revenues from increasing quality over the next highest level exceeded the cost of designing it. 21 As illustrated by Intel’s high profile exit prior to our data collection. 22 We also estimated a random-effect regression, which was superior to a fixed effect regression by standard tests; however it does not add much over the OLS regression with clustered standard errors. Sometimes the coefficients or standard errors change slightly, but not by much or not in qualitatively important ways. For the sake of parsimony and space, we show only the OLS with clustered standard errors results. 23 Box-cox tests strongly favor the log price specification.

21
The first two baseline specifications explain much of the variation in prices. The R2 is
high for a cross-sectional regression, exceeding 0.7 in every regression. As specifications III &
IV show, additional explanatory variables enable us to explain more of the variation in prices. In
addition, the results show that both origin and strategic behavior contribute to the variance of
prices between contracts. While both factors are important for explaining differences in prices,
strategic behavior seems to explain more of the variation than origin. For example, a price
regression with only the Commodity Technology Attributes explains about 33% of variation in
prices. Adding origins to this regression (Firm Identity before Entry and Location of Firms)
increases the R2 to 0.35, but an F-test rejects the hypothesis that all the origin variables (Brand,
Local, Enhancement and Top25) together equal zero.
We next divide the strategic behavior variables into two large subgroups: (1) decisions
made when entering the market; and are thus relatively hard to change and thus affect the
position of the provider in the market, and (2) decision made after entry; these are more flexible
decisions that are easier to change. We include Quality and Carts decision within the first
subgroup of strategic behavior, and include the Upgrade Path variables in the second subgroup.
Adding the first subgroup of variables to the Commodity Technology Attributes regression
pushes R2 up to almost 0.7. As before, the addition of the origin variables does not increase the
percent of variation explained by much. However, an F-test rejects the hypothesis that all origin
variables are zero. Finally, the second subgroup of strategic behavior variables increases the R2
to almost 0.8.
We organize our discussion by our previously defined categories of variables and we
summarize the results in Table 8.
4.1. Origins Firm Identity before Entry: In general, a firm’s identity before entry affects its ability to charge a
premium. In the first specification, the coefficient on Brand is positive and significant, while the
coefficient on Local is negative and significant. The coefficient on Brand is in line with our
hypothesis that Brand providers can leverage their reputation and charge a premium. In converse,
the negative coefficient on Local accepts our hypothesis that specialists (the omitted variable)
charge a premium for their custom software services. Most Locals need to discount their

22
contracts. The level of discount then depends on the third-party cart the Local firm chose to
offer. We will say more below about Specialists.
Location of Firm: In Specification II of Table 5, we examine the effect of the location of the
provider. The coefficients on enhancement and on Top25 are negative, and the coefficient on
enhance25 is positive. Since all three coefficients are not significant, we can not reject the
hypothesis that location did not affect pricing in this market.24
Specification II also adds some information on the ability of Self-developers to charge a
premium for cart quality (SelfQual) and customer services such as phone support (SelfPhone).
The results show that Self-developers tend to discount their quality but charge a premium for
phone support. After interviewing several companies, we believe this result can be explained by
the different labor markets Locals and Self-developers use. Self-developers hire highly skilled
programmers to develop and maintain the cart. Therefore, typically the phone-support provided
by Self-developers is given by these professional programmers. Locals, in converse, mostly hire
information technology professionals for a variety of tasks. They are not as familiar with the
software, and therefore probably offer "lower-quality" support. Consequently, we believe that the
premium Self-developers charge for phone support can be explained by the higher value but
more costly service they offer.
4.2. Strategic Behavior Commodity technology attributes: As we expected, in all specifications, prices increase when the
amount of offered storage and product slots increases. We tried specifying a series of higher-
order terms, and standard criteria suggested keeping the number of terms low. We tested multiple
specifications for these attributes and box-cox strongly favors logging these attributes. This is the
first of many estimates showing that price is not a linear sum of the cost of attributes, such as
memory and product slots. Rather, over the range of attributes we observe, there are strong
tendencies towards lower unit costs for incremental additions at higher volumes, consistent with
economies of scale. We cannot draw an unqualified conclusion yet, however, because other
factors affiliated with size, such as a contract’s position, also shape the price of a contract.
24 While some of the regressions we ran hint that location actually did affect firms' pricing, this finding was not robust. The results we obtained suggest that the effect of location may be observationally equivalent to higher or lower quality by a Self-developer, taking advantage of local labor market conditions.

23
We also considered a number of specifications for “unlimited” attributes. Given our
procedures, the estimates for InfProdSlots and InfStorage could have been positive or negative.
As it turned out, they are negative and significant in most estimates, and small in all the
estimates. More to the point, the estimates are meaningless by themselves, but the size of the
point estimate is suggestive. For example, the first set of estimates suggests that offering
unlimited product slots allows a firm to charge a price as if it were a little less than 5000 MB in
storage and 200,000 product slots. Because the actual point estimates differ with the
specification, we do not make a confident inference about the precise “value of unlimited” other
than that it is in the neighborhood of our educated guess. We conclude that our procedure for
measuring unlimited yields reasonable outcomes.
Quality of Cart Choice. There is a large variance in the quality of the cart that firms offer, and in
particular in the quality the different firms types offer. In our baseline specifications, prices are
increasing in quality, even controlling for cart dummies. Furthermore, providers can charge a
premium for services like phone support. At a general level, these results are plausible.
While the median quality of a cart offered by a Local firm is 8, the median quality of a
cart offered by a Brand firm is 4. We speculate that the large difference can be explained by the
return on investment in quality, and simple simulations are consistent with that speculation.
From Specification II in Table 5 we can see that increasing the quality of the cart by one unit
enables a Local firm that offers an uncommon third-party cart to increase its price by 16%. In
converse, a Brand firm can increase its price only by 7% for a quality increase of one unit. The
additional level of discount or premium from a Local firm that offers one of the four most
common carts varies from a discount of -152% to a premium of 71%.
Neither cart quality nor cost can solely explain this variation in estimates. While the
discounting of AlaCart and Miva might be explained by their lower quality, Akopia offers a very
high-quality cart.25 Akopia, however, is an open source and Local firms are not charged per unit
when they offer it.26 Thus, discounting Akopia might be a direct result of the low unit costs
providers face. Kurant is the only cart that commands a premium, probably because of the third-
25 The third column in Table 6 presents the discount/premium a Local firm can charge due to quality. 26 Nevertheless, this also means that the providers cannot as easily give support for the operation of the cart. There is a basic reason for this. The ISPs often do not understand all the source code well enough to be able to solve all problems for their users. Firms like Kurant or Miva offer support to the ISPs that use them, which enables the ISPs to help its customers solve complex problems.

24
party brand name the cart has among ISPs together with its high quality. We believe some of
this premium is shared with Kurant in licensing revenue.27
Our interpretation presumes these cart choices were made at some point in the past and
thus are difficult to change, even as the consequences for pricing become known later. To
facilitate understanding the importance of this choice, we imagine a counter-factual experiment:
how prices would change as an ISP altered its cart choice while not altering other features. This
exercise isolates the “brand/quality” effect, except in one case, as we describe below. To
illustrate this question, we take as a benchmark a Local firm that did not engage with one of the
more common third-party carts—Kurant, Miva, Akopia and AlaCart. The median quality offered
by such providers is 5. We take this benchmark and calculate the marginal premium or discount
Local firms can charge by switching to one of the common third-party carts. The forth column
in table 6 shows the results.
Kurant offers two carts with two different quality levels. While local firms that offer the
higher quality cart can charge a premium of about 150%, offering the lower-quality cart allows
for a premium of 120%. Local firms offering either of these carts are pursuing a “high-cost and
high-quality” strategy. Local firms offering AlaCart, in contrast, are taking a distinct tact,
offering a “low-cost and low-quality” strategy.
From this simulation the behavior of Local firms offering Akopia is intriguing. As noted
before, Akopia is open source and the discount on Akopia partially reflects the Local firm’s
lower costs that are derived from offering a cart for which it is not charged. Note, however, it
was high quality cart. Once we control for quality differences, the discount for Akopia is mildly
smaller than what we discussed before. This finding suggests that Local firms with the technical
skills to cooperate in an open source project like Akopia have a cost advantage if users value the
quality of Kurant and a quality advantage if they value the price of AlaCart.
We conclude that choice of cart and choice of quality can have a large effect on pricing.
The direction and size of the effect, however, depends on the specifics of the choice and the
strategic position the provider seeks to achieve. Overall, higher quality commands a high
premium over lower quality, except when the quality comes cheap, as it does, for example, in an
open source project or from a Specialist. Open source might, therefore, be quite a profitable
27 However, the cart vendors were reluctant to share information about their historical licensing practices with us, so we could not verify what fraction of this premium stayed with hosting firms who resold it.

25
strategy when providing hosting services to a targeted customer base. Based on industry
accounts, we are more skeptical that most Specialists were able to generate large market shares
from low cost and low quality software services. If that is so, then low cost and low premium
was not a profitable strategy to pursue.
We now make one more simulation on cart choice, simulating the overall effect from this
choice, not just its marginal affect. As table 2 shows, the choice of a third-party cart directly
affects the amount of storage and product-slots a Local firm offers, as well as the size of its
portfolio. That is, in order to calculate the overall effect of a cart choice, one should take into
account the effect of quality as well as the amount of commodity features (as well as the number
of contracts). The fifth column in table 6 presents the overall effect of cart choice. In general, the
results are qualitatively similar to the quality/brand choice results. The discount for Akopia is not
as large as it was before. This is because Locals offering Akopia tend to offer a larger portfolio
(see table 2) as well as high levels of storage.
Overall, we conclude that – among the many things that a cart choice determines – the
marginal contribution of cart quality is the biggest determinant of price levels. We also conclude
that firms who can offer open source software gain a pricing advantage over those vendors who
do not or can not offer open source, leaving them offering lower quality at the same price. We
cannot conclude which of these high quality choices – open source or Kurant – is most profitable
without knowing the precise licensing costs for Kurant and the relevant demand elasticities for
Kurant software and substitutes.
Upgrade Path. The third specification in Table 5 adds the effect of ordering and upgrading path
on a firms' pricing strategy. The basic pattern suggests the following: Prices increase with the
location of the contract within the firm's portfolio. The more contracts a firm offers, the lower
the initial price and the higher the top price. The discounts can reach more than 30% for
portfolios with four contracts, and the premium for the top contract in these portfolios is around
35%. That is, firms seem to be tilting the whole pricing line in a way that lowers prices for basic
contracts and raises prices of top contracts. This is consistent with “entry-level” pricing for small
contracts and premium pricing for upgrades.
PortSelf interacts Portfolio (the number of contracts the firm offers) with Self-
developers. The positive and significant coefficient suggests that Self-developers charge a
premium for offering large portfolios. As noted before, variables that capture the effect of the

26
upgrade path affect prices, but do not affect the firms’ costs and thus directly affect firms’
margins. Consequently, one can conclude from the results that adding one contract to a portfolio
of a Self-developer increases the provider’s margin by 26%. Notfixed is positive and significant,
supporting the hypothesis that consumers value an upgrading path that balances the amount of
storage and product slots. Consumers do not want to pay for storage or product slots they cannot
use because of other limitations; therefore, firms must discount such contracts.
To understand better the effect of different upgrade paths, we now analyze two different
changes in behavior within upgrade path: (1) changing the number of contracts and position
within the portfolio and (2) moving from a portfolio where both storage and the number of slots
are not fixed to a portfolio where storage is fixed. The interpretation of this simulation depends
on whether we view contract portfolios as statistically exogenous or endogenous. Because cart
choice also limits the number of contracts a firm can have, exogeneity for the number of
contracts is a plausible assumption, just as it was for cart quality. Hence, we view this simulation
as isolating a “portfolio effect” that is distinct from the cart quality/brand effect, though both
have been determined simultaneously in the past.
We start with a firm offering four contracts and study what happens if the firm increases
the number of contracts to seven. We assume that the firm adds a contract between any two
adjacent contracts, such that the bottom contract remains at the bottom; the second contract,
however, moves to be third, and the third contract moves to be fifth. The top contract remains top
but its position is now seven. Since we want to focus on the effect of a change in the number of
contracts, we assume that all other contract characteristics remain the same except for the change
in position. We set the level of products and the number of slots of the "added" contracts to be
the average of the contract above and below. Note, while adding contracts changes the position
of the contract within the portfolio, it also affects competition as there are now more contracts to
choose from.
Summarizing the position and competition effects shows the following: There is no
positional change for the bottom contract; thus, the price of the bottom contract will increase by
only 1%, reflecting the change in competition. The prices of the original second, third, and top
contracts increase by 12%, 23%, and 34% respectively. In all three cases, the main effect is the
positional effect. The prices of the added contracts (the new second, fourth, and sixth contracts)
are 43%, 64%, and 77%, relative to the bottom, third, and fifth contracts, respectively. These

27
price changes reflect the position of the added contracts as well as the additional storage and
product slots these contracts offer relative to the contract beneath them.
All the results so far suggest that firms can use larger portfolios to slice up the product
space and better price discriminate among their customers. Assuming that the price increase does
not affect the firm’s market share too much, we can conclude that larger portfolio would likely
increase the firms’ profitability. That begs the question about the effect of adding contracts to
small portfolios. Consequently, we consider a firm that offers only one contract. Once again, we
simulate the answer to this question using the coefficient estimates.
Specifically, the data has 29 observations of firms that offer only one contract; out of
which 26 fix storage levels while not limiting the number of product slots. The storage these
firms offer varies, starting at 40 MB. The median level of storage is 150 MB. We therefore take
for our analysis a one-contract firm that offers storage of 150 MB and does not limit the number
of product slots. We then look at two different cases. First, we add only one contract to the firm's
portfolio, where the added contract offers 75 MB (half of the original contract's storage). All
other contract characteristics are unchanged. Next, we add three contracts, increasing the
number of contracts in the firm's portfolio to four. As in the first exercise, we leave the original
contract as the top contract and assume the additional contracts offer lower levels of storage. We
assume that the storage levels the four contracts offer are 25 MB, 50 MB, 100 MB, and 150 MB.
Again, all other contracts characteristics are unchanged.
Our calculations show that when a firm moves from a one-contract to a two-contract
portfolio, the firm must discount the added contract by 53%, but can charge a premium of 19%
on the original contract. Moving to a four-contract portfolio, however, allows the firm to charge
a premium of 49% for the original contract, but the bottom contract must be discounted 75%.
The discounts on the second-lowest and third-lowest contracts are 25% and 9%, respectively.
Overall, there are high returns from expanding from one contract to many. That finding
further begs the question why 20% of the firms in our sample offer only one cart. Perhaps these
firms were not commercially savvy when they made these choice or do not possess the
managerial skills to manage the complex situations that a range of contracts might engender
among clients. In either case, we are watching a young market and this result seems destined to
change. We forecast that this behavior creates too many disadvantages and will not survive under
long-term competition.

28
We now examine the importance of changing the portfolio strategy from an angle
consistent with a modal situation, namely, when a firm has four contracts already in its portfolio.
But what type of situation should we examine? Although 28% of the contracts in our data are
derived from portfolios that offer other contracts with both additional storage and additional
product slots, there is no evident typical upgrade path. Hence, to illustrate what an alteration of
contracts would produce, we choose a random firm that offers such a portfolio, and analyze the
effect of fixing either the amount of storage or the number of product slots on the firm's pricing
strategy.
The firm we analyze offers four contracts with the following (storage, product slot)
offerings: (50, 50); (150,100); (400,500); (1000, 2000). To begin our analysis, we first fix the
available storage in each contract at 1000 MB so that the contracts in the portfolio would only
differ by the amount of product slots offered. It is important to note that even though the storage
offering is now higher, customers will not necessarily be able to take advantage of this additional
storage. The limitation on the number of product slots also limits the amount of storage they can
actually use, sometimes mildly and sometimes greatly. Our results show that in this case the
firm can increase the prices of the first three contracts it offers by 19%, 18%, and 15%,
respectively. Nevertheless, the firm must decrease the price of the top contract by 36%.
The results of the opposite exercise—fixing the number of slots and allowing for
differences only in the available storage—are qualitatively similar but the effect is larger. In this
case, the firm can increase the price of the first three contracts by 40%, 40%, and 37%,
respectively, but again must discount the top contract by 36%. Overall, it appears that restricting
the storage–product slot space by limiting just one of these variables is beneficial for firms where
the majority of users do not desire the top contract. This qualification is potentially binding; the
next results on competition will suggest that demand for top contracts is higher than demand for
any other type of contract. Furthermore, it is costly for firms to offer additional characteristics,
even if customers cannot take advantage of them at all, and thus it is not always the case that
more is better for the supplier.
We must be careful with generalizing these results. Although here the firms could
increase the price of most of the contracts they offer, this is not always the case. When a firm
limits one of the lines, whether it is storage or product slots, it can charge a premium for the
additional storage or product slots offered. Yet, as Table 5 shows, the firm must discount these

29
contracts by 36%, as customers are not willing to pay for additional characteristics they cannot
take advantage of.
Overall, as stated in Table 8, we conclude that the upgrade behavior of a provider can
have an enormous effect on the pricing of hosting services. We generally observe patterns
consistent with entry level pricing of contracts within a portfolio. Generally, the firms that offer a
wider range of contracts with a more balanced set of features are able to charge the highest unit
prices. Nevertheless, there also are several exceptions to this last generalization, so we do not
draw any broad conclusions other than the observation that such behavior matters a great deal to
the variance of observed prices.
4.3. Competition The fourth specification in Table 5 presents the results for adding the effect of
competition. Both measures of competition are significant—rejecting the hypothesis that the
presence of competitors does not affect a firm’s pricing behavior. The coefficient on numCarts
is negative, which suggests that prices decrease as the number of carts offered within a segment
increases. The coefficient for marketSize is positive and seems to capture an unmeasured
demand effect. The variables numCartsBottom and numCartsTop are the interactions of
numCarts with Bottom and Top, respectively. The coefficient on numCartsBottom is negative
but not significant. The coefficient on numCartsTop is positive and significant. At first blush, it
appears these results are in line with the hypothesis that firms have little market power at the low
end of their portfolios and more market power at the high end, if they have any.
There is a large variance in the level of competition in the different storage–product slots
boxes. The number of contracts within a box varies from only one contract to sixty-three
contracts; the number of competing carts within a box varies from one to five. To better
understand the effect of competition on a firm’s pricing we look at a "monopolistic market"—a
box with only one contract, and compare it to the other extreme—a box with sixty-three
contracts and five competing carts. The results show that prices in the more competitive box are
on average higher by 14% than the monopolistic market. While this result is very surprising on
the surface, it is consistent with our findings in the data description section. We speculate that
crowded product spaces are crowded because most users are there. The settings are competitive
to some degree, but we cannot tell how much difference this competition makes. Endogenous

30
entry means the statistics are more informative about the size of demand than the competitive
intensity of rivalry.
Overall, in our data, variance in other factors better predicts variance in prices.
Nevertheless, because of how endogeneity clouds interpretation, we conclude that there is
insufficient evidence to infer whether competitive rivalry shapes prices. In addition, many of the
other factors shaping pricing are much more important for explaining the observed variance in
prices.
4.4. Robustness: Pricing within a Portfolio Our focus in the previous section was on differences across firms. To better understand a firm’s
pricing strategy, we next study the difference of prices within a portfolio. For each firm i, we
define!!
"
#
$$
%
&=
i
Bottom
i
Topi
P
PpriceDiff log , where i
TopP and i
BottomP are the prices of the top contract and
bottom contract, respectively, offered by firm i. We run a regression with priceDiff as the
dependent variable. This is a robustness check for our inferences in the hedonic price equation.
This new equation has differenced out unobservables for two contracts coming from the same
firm. It is identified from differences between firms. We define the differences in the product
slots and storage offering in a similar way,!!
"
#
$$
%
&=
i
Bottom
i
Topi
tproductSlo
tproductSloprodDiff log ,
!!
"
#
$$
%
&=
i
Bottom
i
Topi
storage
storagestorDiff log . We use as many of the same variables as possible, dropping the
measurement of competition, which cannot be represented in any clean way in this specification.
Because we want to study price ranges, we look only at firms that offer portfolios with at least
two contracts. The resulting data set includes 116 observations of 116 firms. In Table 7, we
present the results.
There are no surprises. As expected, the results show that price ranges increase with both
the range of product slots and the range of storage the firm offers. In addition, price differences
increase with the number of contracts the firm offers. This effect is large and significant. Brand
firms seem to offer larger price differences, while Locals offer smaller price differences. Both of

31
these effects, however, are not significant. Local firms that offer AlaCart tend to have lower
price ranges.
In the second specification, the coefficients for Enhancement and Top25 are negative
and significant, suggesting that firms in dense locations and in locations with Internet-savvy
businesses offer smaller price difference. Yet, the coefficient on the interaction variable,
enhance25, is positive and significant. As before, enhancement and Top25 seem to capture a
cost effect. Self-developers as well as the upgrading path do not seem to affect the pricing ranges
that firms offer.
This robustness check is largely consistent with the earlier specifications, though with
less statistical significance due to the smaller number of observations. This result, along with the
lack of difference between OLS and random-effects estimates, leads us to infer that most
variation comes from variation between firms rather than within contracts at the same firm.
These additional estimates do not contradict our earlier conclusion.
5. CONCLUSION We examine the eBSP market in 2001. We summarize our results in Table 8. Our
analysis offered two levels of results. First, we offered a range of descriptive statistics describing
the degree of heterogeneity in firm contracting behavior. Second, we analyzed the determinants
of pricing outcomes.
We observe entrants with three different origins. Brand firms, like Microsoft and IBM,
manage to charge a premium for features of the service affiliated with their sponsorship. Local
firms that were in related business prior to entering hosting, such as ISPs, now offer hosting
services. The third set of entrants, Specialist firms, specializes in all facets of being an eBSP.
These differences are associated with different pricing outcomes. Overall, the origins of a
hosting firm can make a significant effect on price levels.
We also find that these origins partly correlate with one of the key choices of a firm, the
quality of the non-commodity services they offer, but we also found considerable heterogeneity
around these choices. Brand firms tend to develop their own services and these tend to be of
medium quality. Specialist firms also tend to develop their own services and these display a very
wide range of qualities. Local firms do not develop their own services, which they prefer to
procure from other providers. Their choice of quality comes with their choice of third-party

32
provider and it varies widely. This quality is an important determinant of variance in prices
between firms. Indeed, we found that the range of price differences between highest and lowest
quality could be quite large, and much greater than the variation attributable to any other factor.
We observe additional heterogeneous firm behavior layered on top of the origin and
choice of cart or quality. Every firm makes choices about how many and what types of contracts
to offer potential buyers. Each contract specifies the quality of the storefront software together
with the available disk space and number of product slots. Each set of contracts also provides a
natural “upgrade-path” from low- to high-end use. We identify four main upgrade-path strategies
offered by firms to users: (1) offering no upgrade path, (2) offering the potential to eventually
experience higher-quality software, (3) offering the potential to eventually use more disk space,
or (4) offering the potential to eventually have a larger catalogue. Each of these different upgrade
paths implies that the hosting facility will be able to handle different future needs at lower or
higher costs. We found that some firms choose to combine these upgrade paths and others
employ only one. Overall, we found that those who offer larger and more flexible upgrade paths
were able to command higher prices. We found a large difference in prices between those
offering the least and most flexibility, a difference almost as great as the variation attributable to
quality.
We began with a question about the source of rents in young technology markets. We
tested between two views about the source of rents, one affiliated with mobility of assets from
old to new, and the other affiliated with business acumen and efficiency. We labeled these as
origins and strategic behavior, respectively. Our analysis finds that both factors can shape price
levels. Generally, neither factor alone explains the variance of prices between contracts.
Moreover, the variance in prices between firms with different origins is much smaller than the
variance in prices for firms pursuing different strategies. These findings are striking, as most
observers expected this market to act like a homogeneous technology market. Instead, close
inspection reveals that this market is far from homogeneous, because firms find a myriad of ways
to differentiate themselves through use of strategic behavior — and those differences correlate
with large differences in pricing.
These findings provide a partial explanation for why all three types of firms can co-exist
with one another in the same market place. Many of them specialize in customers in a particular
location. Many specialize in particular parts of the product space. These differentiating strategies

33
are sufficient to support large differences between firms, even two firms with different origins in
the same location. This finding also provides a partial explanation for the comparative absence of
branded firms in this market. Value in this new market did not display strong links to the origins
of firms. Branded firms and ISPs gained some advantages from their histories, to be sure, but
these could be overwhelmed by the pricing advantages associated with appropriate strategic
behavior after entry. This market setting provided ample opportunities to newly founded firms to
compete with experienced firms if they executed on appropriate strategies. We observe such
behavior from new established specialists, but also from young firms, such as ISPs, who resold
third party carts and tailored their offerings to their customer base.
Such findings raise a number of questions about the rationale for the variety of strategic
behavior we observe. Some firms choose to offer large portfolios of contracts, while others
choose to offer small. Some firms fix the level of one product attribute, while others fix another
attribute, and still others do not fix any at all. While we find plenty of evidence that these choices
shape the value of different pricing strategies, we attribute all of that variety to a firm’s incentive
to differentiate from rivals. We did not assess which of the many strategic rationales for each
choice best fit actual circumstance.
More speculatively, as in other young technology markets, we expect value to change as
firms alter attributes of their service. We expect the rare and valuable attributes today will
become more common tomorrow, eliminating them as a source of differentiation. That leads us
to predict the disappearance of strategies that did not produce market value and the comparative
decline in the value of strategies that produce value within our sample. This change over time
will alter the comparative returns to origins and strategic behavior, but we could make forecasts
about its alteration in only a few instances, such as the use of open source and larger portfolios
(which has advantages). The eventual configuration depends on user willingness to substitute
between firms with distinct arrays of attributes, and cannot be predicted on the basis of our study.
We also expect normal procedures for price index construction to misinterpret these
changes. Such procedures tend to focus solely on the easily measurable technology attributes –
such as product slots and memory. Such procedures will omit important determinants of value,
generating an inaccurate or misleading picture at any point in time, as well as over time.

34
References Augereau, A., and S. Greenstein. 2001., “The Need for Speed in Emerging Communications
Markets: Upgrades to Advanced Technology at Internet Service Providers” International Journal of Industrial Organization 19: 1085–102.
Berndt, E. 1991. The Practice of Econometrics—Classic and Contemporary, Addison-
Wesley. Berndt, E.R., Z. Griliches, and N.J. Rappaport, 1995. “Econometric estimates of price
indexes for personal computers in the 1990’s.” Journal of Econometrics, 68, pp.243-268.
Berndt, E.R., and N.J. Rappaport, 2001. Price and Quality of Desktop and Mobile Personal
Computers: A Quarter Century Historical Overview, American Economic Review, Vol 91, 2, May, pp 268-273.
Bresnahan, T., S. Stern, and M. Trajtenberg. 1997. "Market Segmentation and the Sources
of Rents from Innovation: Personal Computers in the late 1980's" Rand Journal of Economics 28 (Special Issue ): S17–S44.
Brynjolfsson, Erik and Michael D. Smith. 2000. “Frictionless Commerce? A Comparison of
Internet and Conventional Retailers.” Management Science 46(4): 563–85. Clay, K., Krishnan, and E. Wolff. 2001. “Prices and Price Dispersion on the Web: Evidence
form the Online Book Industry,” Journal of Industrial Economics 49: 521–40. Chen, P. Y, and L. Hitt. forthcoming. “Information Technology and Switching Costs.” In
Handbook of Economics and Information Systems, T. Hendershott, ed. Elsevier. Cusumano, M., and R. Rosenblum. 1987. “Technological Pioneering and Competitive
Advantage: the Birth of the VCR Industry,” California Management Review, 29 (4). Daniel Elfenbein, and Lerner, Josh, 2003, Ownership and Control Rights in Internet Portal
Alliances,” Rand Journal of Economics. Ellison, G., and S. F. Ellison. 2005. “Learning about Markets from the Internet,” Journal of
Economic Perspectives 19 (2): 139–52. Ehrmann, T. 2003, “Business Models in the New Economy,” in D.C. Jones, Ed., New
Economy Handbook (San Diego: Academic Press/Elsevier). Pp. 699-722. Farrell, J. and P. Klemperer. forthcoming. “Coordination and Lock-In: Competition with
Switching Costs and Network Effects,” Handbook of Industrial Organization, 3.

35
Forman, C., A. Goldfarb, S. Greenstein. 2005. “How did Location Affect Adoption of the Internet by Commercial Establishments? Urban Density versus Global Village” Journal of Urban Economics: 389–420.
Friberg, R. 2003, “Internet and Pricing Issues: Relationship of Prices Charged by Fixed
Price Vendors in Cyberspace and Those in Brick and Mortar Stores,” in in D.C. Jones, Ed., New Economy Handbook (San Diego: Academic Press/Elsevier). Pp191- 212.
Greenstein, S. 2000. "Building and Developing the Virtual World: The Commercial Internet
Access Market," Journal of Industrial Economics (December). Griliches, Zvi (1961), "Hedonic Price Indexes for Automobiles: An Econometric Analysis
of Quality Change," originally in The Price Statistics of the Federal Government, New York: NBER, 1961. Pages
Hanson, W. 1999. Principles of Internet Marketing. South-Western College Publishing. Kalakota, R. and A. Whinston. 1999. Frontiers of Electronic Commerce. DIANE
Publishing Company. Kenney, Martin. 2003. The Growth and Development of the Internet in the United States. in
(ed) Bruce Kogut, The Global Internet Economy. Cambridge: MIT Press. Lerner, Josh, and Robert Merges, 1998, "The Control of Technology Alliances: An
Empirical Analysis of the Biotechnology Industry," Journal of Industrial Economics, June.
Lucking-Reiley, D. and D. Spulber. 2001. “Business-to-Business Electronic Commerce,”
Journal of Economic Perspectives 15(Winter): 55–68. Mussa, M. and S. Rosen. 1978. “Monopoly and Product Quality," Journal of Economic
Theory 18: 301–17. Norton, R. D. 2003, “The Regional Origins of the New Economy,” in D.C. Jones, Ed., New
Economy Handbook (San Diego: Academic Press/Elsevier). Pp. 645-670. Porter, Michael E. 2001. "Strategy & the Internet". Harvard Business Review. 79 (March): 62-78. Rochet, J. C. and L. Stole. 2002. “Nonlinear Pricing with Random Participation,'' Review of
Economic Studies, January, 69(1): 277-311. Rosenberg, N. 1994. “Economic Experiments.” In Exploring the Black Box, Cambridge:
Cambridge Press, pp 87–108.

36
Scott-Morton, F., J. Silva-Russo, and F. Zettelmeyer. 2001. “Internet Car Retailing,” Journal of Industrial Economics 49 (4).
Shapiro, C. and H.R. Varian. 1998. "Versioning: The Smart Way to Sell Information,"
Harvard Business Review, (November-December). Spulber, Daniel F. 1999. Market Microstructure: Intermediaries and the Theory of the Firm.
New York: Cambridge University Press. Thompson, Michael S. and Steve Thompson. Forthcoming. “Pricing in a Market without
Apparent Horizontal Differentiation” Economics of Innovation and New Technology. United States Census, Service Annual Survey, NAICS 51, Information, Industry Summary,
http://www.census.gov/svsd/www/services/sas/sas_summary/51summary.htm#data United States Census Bureau. 2001. Service Annual Survey. Washington, DC: Government
Printing Office. Varian, H. R. 1989. “Price Discrimination.” In The Handbook of Industrial Organization, R.
Schmalensee and R. D. Willig, eds. Amsterdam: North-Holland. White, Alan, Jaison Abel, Ernst Berndt, Cory Monroe, 2004, “Hedonic Price Indexes for
Personal Computer Operating Systems and Productivity Suites,” NBER Working Paper No. 10427.
“Definitions, Implementation, and Reporting Requirements Under the CAN-SPAM Act,”
Federal Register 70, no. (May 2005).
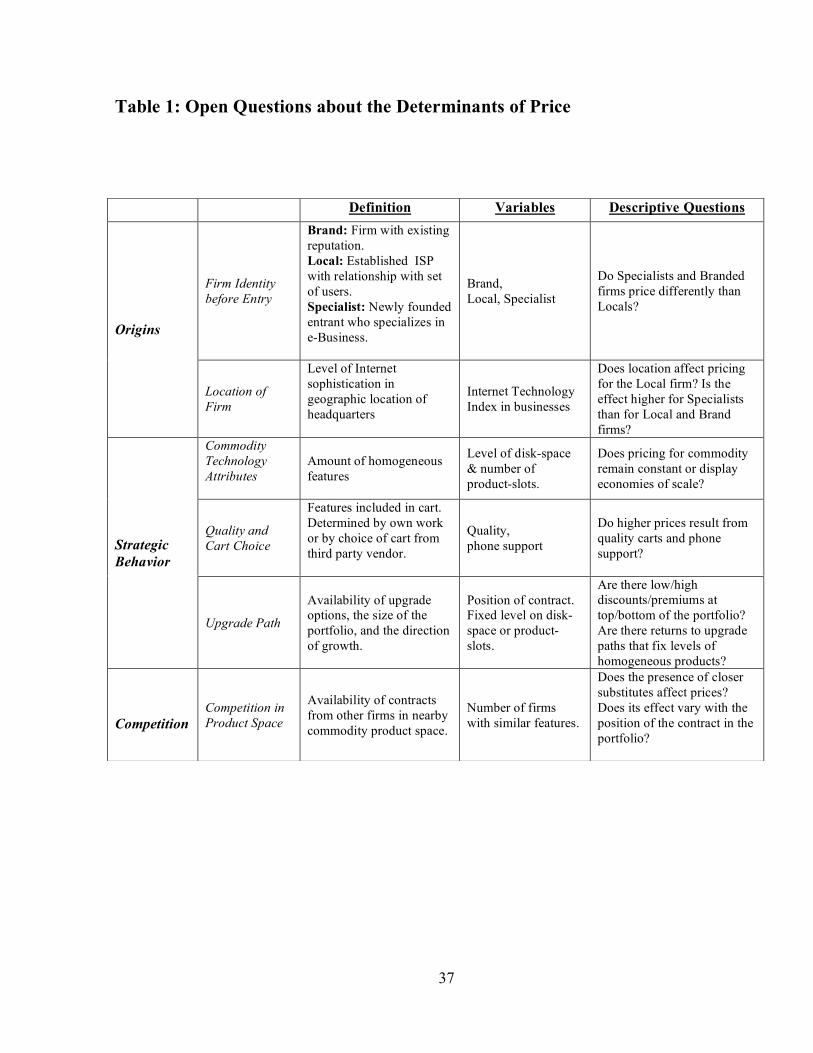
37
Table 1: Open Questions about the Determinants of Price
Definition Variables Descriptive Questions
Firm Identity before Entry
Brand: Firm with existing reputation. Local: Established ISP with relationship with set of users. Specialist: Newly founded entrant who specializes in e-Business.
Brand, Local, Specialist
Do Specialists and Branded firms price differently than Locals?
Origins
Location of Firm
Level of Internet sophistication in geographic location of headquarters
Internet Technology Index in businesses
Does location affect pricing for the Local firm? Is the effect higher for Specialists than for Local and Brand firms?
Commodity Technology Attributes
Amount of homogeneous features
Level of disk-space & number of product-slots.
Does pricing for commodity remain constant or display economies of scale?
Quality and Cart Choice
Features included in cart. Determined by own work or by choice of cart from third party vendor.
Quality, phone support
Do higher prices result from quality carts and phone support? Strategic
Behavior
Upgrade Path
Availability of upgrade options, the size of the portfolio, and the direction of growth.
Position of contract. Fixed level on disk-space or product-slots.
Are there low/high discounts/premiums at top/bottom of the portfolio? Are there returns to upgrade paths that fix levels of homogeneous products?
Competition
Competition in Product Space
Availability of contracts from other firms in nearby commodity product space.
Number of firms with similar features.
Does the presence of closer substitutes affect prices? Does its effect vary with the position of the contract in the portfolio?

38
Table 2: Descriptive statistics for carts
Median
Storage/Products Slots Median Quality
Median Portfolio
Size
Average Price
Locals: Akopia 200/Unlimit 10 5 29.5
Miva 250/Unlimit 7 3 82.8
Kurant 200/500 9 4 249
Alacart 200/25 5 4 37.9
Specialists 100/500 7 3 126.8
Brand 75/150 4 3 141.8

39
Table 3: Number of Contracts and Prices in the Products-Storage Space
Product Slots Storage
<25 26–100 101—500 501–10000 Unlimited Total
<=50 17 17.7
29 110.7
7 193.5
5 243.9
45 40.7
103 76.9
51–150 24 27.5
11 110.9
10 259.5
15 324.4
57 53.3
117 105.8
151–300 24 40.7
12 87.1
4 325
13 120.9
54 49.3
107 70.6
301–2000 6 43.1
1 64.95
2 325
12 259
64 102.6
85 125.3
Unlimited 16 134.5
11 285.9
13 416.8
7 55.3
47 236.2
Total 71 30.9
69 111.5
34 266
58 279
227 63.8
459 108
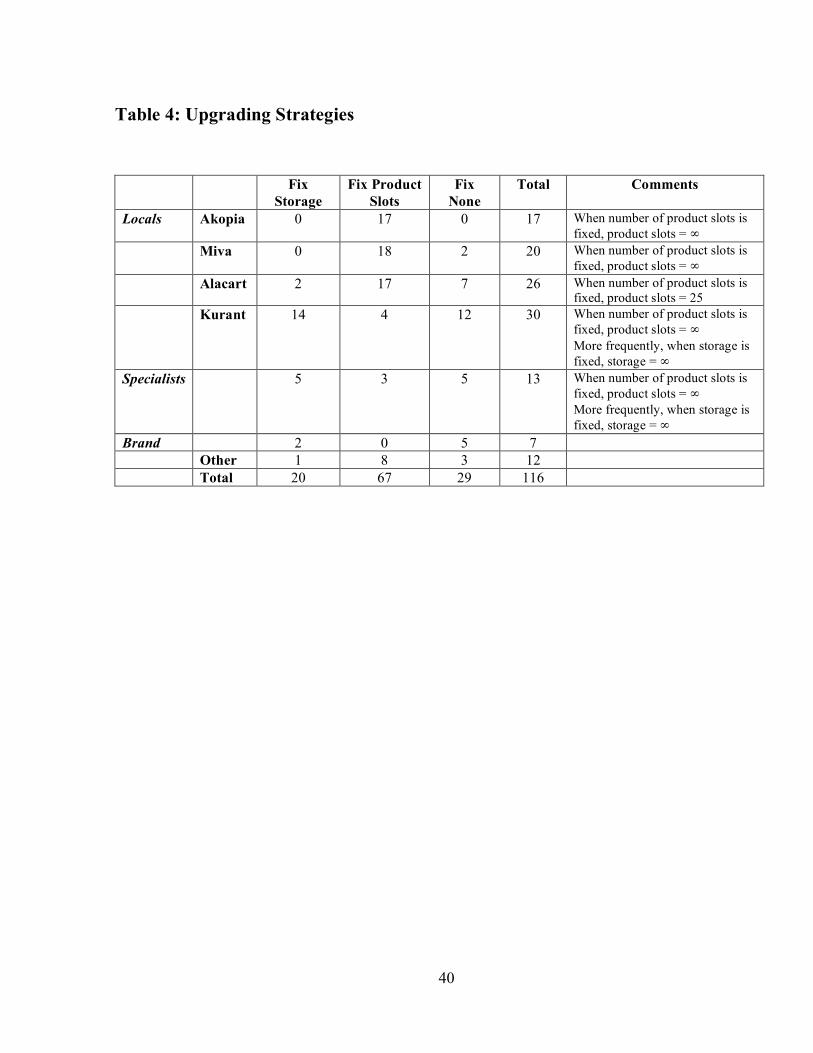
40
Table 4: Upgrading Strategies
Fix Storage
Fix Product Slots
Fix None
Total Comments
Locals Akopia 0 17 0 17 When number of product slots is fixed, product slots = ∞
Miva 0 18 2 20 When number of product slots is fixed, product slots = ∞
Alacart 2 17 7 26 When number of product slots is fixed, product slots = 25
Kurant 14 4 12 30 When number of product slots is fixed, product slots = ∞ More frequently, when storage is fixed, storage = ∞
Specialists 5 3 5 13 When number of product slots is fixed, product slots = ∞ More frequently, when storage is fixed, storage = ∞
Brand 2 0 5 7 Other 1 8 3 12 Total 20 67 29 116

41
Table 5: Price Regression Results
I II III IV Coef. SE Coef. SE Coef. SE Coef. SE Constant 1.69* 0.45 2.39* 0.69 1.90* 0.66 1.94* 0.67 Log(ProductSlot) 0.10* 0.04 0.11* 0.04 0.07* 0.03 0.10* 0.03 Log(Storage) 0.25* 0.05 0.25* 0.04 0.11* 0.04 0.08* 0.04 InfProdSlots -0.84* 0.36 -0.89* 0.32 -0.55* 0.24 -0.86* 0.32
Commodity Technology Attributes
InfStorage -0.91* 0.24 -0.82* 0.23 0.05 0.22 0.11 0.23 Quality 0.13* 0.04 0.16* 0.04 0.21* 0.04 0.21* 0.04 Phone support 0.14 0.1 0.10 0.1 0.14 0.1 0.15 0.1 SelfQual -0.09 0.08 -0.13* 0.05 -0.13* 0.05
Quality
SelfPhone 0.42 0.4 0.49* 0.24 0.46* 0.24 Akopia -1.39* 0.21 -1.52* 0.19 -1.65* 0.18 -1.61* 0.18 Kurant 0.85* 0.21 0.71* 0.17 0.44* 0.15 0.45* 0.15 Alacart -0.36** 0.20 -0.34** 0.21 -0.23 0.2 -0.27 0.20
Carts
Miva -0.08 0.18 -0.1 0.17 -0.01 0.17 -0.02 0.17 Brand 0.65* 0.26 0.51 0.46 0.15 0.25 0.15 0.25 Firm
Identity before Entry Local -0.27** 0.16 -0.77 0.57 -0.05 0.38 -0.01 0.38
Enhancement -0.03 0.03 -0.04 0.03 -0.03 0.03 Top25 -0.76 0.93 -1.51 0.95 -1.40 0.96
Location of Firms
Enhance25 0.06 0.06 0.11** 0.06 0.10 0.06 Position 0.10* 0.04 0.11* 0.04 portBottom -0.07* 0.02 -0.09* 0.03 portTop 0.09* 0.02 0.04 0.03 PortSelf 0.26* 0.09 0.26* 0.09
Upgrade Path
Notfixed 0.36* 0.11 0.36* 0.11 numCarts -0.12* 0.05 marketSize 0.01* 0.004 numCartsBottom 0.04 0.03
Competition
numCartsTop 0.05* 0.03
R2 = 0.7
F(12,420) =36.2 R2 = 0.71
F(18,414)=30.88 R2 = 0.79
F(22,410) =66.5 R2 = 0.8
F(26,406) =58.7

42
Table 6: Third-Party Carts' Pricing
Third-Party Cart
Cart Quality
Premium/Discount for Quality
Marginal Premium/Discount
Overall Premium/Discount
Kurant 10 80% 151% 102%
Kurant 8 48% 119% 70%
Miva 7 32% 21% 44%
Akopia 10 80% -72% -55%
Alacart 5 0% -35% -116%

43
Table 7: Price Differences Regression Results
I II III Coef. SE Coef. SE Coef. SE Constant 0.39* 0.19 1.03* 0.36 0.93* 0.46 prodDiff 0.04* 0.02 0.05* 0.02 0.04 0.02 storDiff 0.09* 0.05 0.11* 0.05 0.09* 0.05 InfProdSlots -0.35* 0.11 -0.34* 0.11 -0.31* 0.12 InfStorage 0.10 0.15 0.19 0.15 0.23 0.17
PhoneSupport 0.10 0.08 0.10 0.08 0.12 0.08
Akopia 0.16 0.15 0.11 0.15 0.10 0.15 Kurant 0.03 0.14 -0.05 0.14 -0.08 0.14 Alacart -0.43* 0.14 -0.42* 0.14 -0.44* 0.14 Miva 0.01 0.13 0.03 0.13 -0.01 0.14
Portfolio 0.20* 0.04 0.20* 0.04 0.21* 0.04
Brand 0.09 0.23 0.07 0.23 0.14 0.24 Local -0.04 0.14 0.01 0.14 0.08 0.30
enhancement -0.06* 0.02 -0.06* 0.02 top25 -1.59* 0.69 -1.64* 0.71 Enhance25 0.11* 0.05 0.12* 0.05
portSelf 0.04 0.09 phoneSelf -0.26 0.22
fixNon 0.10 0.14
R2 = 0.62
F(12,103)=14 R2 = 0.65
F(15,100)=12.2 R2 = 0.65
F(18,97)=10.2
SE = standard error
* = significant at the 5% level
** = significant at the 10% level

44
Table 8: Summary of findings
Descriptive Question Answer Source
Firm Identity before Entry
Do Specialists and Branded firms price differently than Locals?
Yes. Different types of firms choose different levels of quality, types of carts, and up grade strategies. Their identities also allow them to charge different premiums.
Tables 2, 4, 5 and 6.
Origins
Location of Firm
Does location affect pricing for the Local firm? Is the effect higher for Specialists than for Local and Brand firms?
Location does not affect pricing. The effect on Specialists is difficult to identify from the effect of quality on Specialists.
Table 5.
Commodity Technology Attributes
Does pricing for commodity remain constant or display economies of scale?
Pricing for commodities displays economies of scale.
Table 5.
Quality and Cart Choice
Do higher prices result from quality carts and phone support?
High quality carts have higher prices, except when the party resells the open source cart.
Tables 2, 4, 5, and 6.
Strategic Behavior
Upgrade Path
Are there low/high discounts/premiums at top/bottom of the portfolio? Are there returns to upgrade paths that fix levels of homogeneous products?
Firms act as if they offer entry level pricing. Many firms limit the options of users by fixing one dimension and varying the other.
Tables 4 and 5.
Competition
Competition in Product Space
Does the presence of closer substitutes affect prices? Does its effect vary with the position of the contract in the portfolio?
The evidence that competition affects prices is not identified separately from the evidence that firms enter product spaces with more anticipated demand.
Tables 3 and 5b.

45
Appendix
Descriptive statistics
Dummy Variables:
Description %of observations with dummy=1
InfProdSlots InfProdSlots=1 if the firm does not limit the number of Product Slots
50%
InfStorage InfStorage=1 if the firm does not limit the available memory
9%
Branded Branded=1 if the firm has a brand name outside the eBSP market
3%
Local Local=1 if the firm is an ISP 92%
Akopia Akopia=1 if the firm offer Akopia Cart 18%
Kurant Kurant=1 if the firm offers Kurant Cart 27%
Alacart Alacart=1 if the firm offers AlaCart Cart 19%
Miva Miva=1 if the firm offers Miva Cart 18%
NotFixed NotFixed=1 if the firm does not fix the number of product slots and the available storage
28%
Min Max Median ProductSlots 10 ∞ 200,000 Storage 5 ∞ 200 Quality 2 10 8 Enhancement 7.8 19.5 13.7 numCarts 1 5 5 marketSize 1 63 44