creating value for all stakeholders - asml value for all stakeholders peter wennink ... slide 3 ....
TRANSCRIPT

Creating value for all stakeholders
Peter Wennink President & Chief Executive Officer 24 November 2014

Forward looking statements
This document contains statements relating to certain projections and business trends that are forward-looking, including statements with respect to our
outlook, expected customer demand in specified market segments, expected sales levels and trends, our market share, customer orders and systems
backlog, IC unit demand, expected or indicative financial results or targets, including revenue, gross margin, expenses, gross margin percentage, opex
percentage of sales, tax percentage, cash conversion cycle, capex percentage of sales, credit rating and earnings per share, expected shipments of tools and
the timing thereof, including expected shipments of EUV and DUV tools, productivity of our tools and systems performance, including EUV system
performance (such as endurance tests), the development of EUV technology and timing of shipments, development in IC technology, including shrink
scenarios, NAND technology development and cost estimates, expectations on development of the shrink roadmap across all of our systems, upgradeability of
our tools, system orders, customer transition estimates, expected transition scaling, forecasted industry developments, including expected smartphone, tablet
and server use in future years, and expectations relating to new applications including wearable devices and connected devices, expected investment pay-
back time for foundries, expected construction of additional holistic lithography infrastructure, the continuation of Moore’s Law, and our dividend policy and
intention to repurchase shares. You can generally identify these statements by the use of words like “may”, “will”, “could”, “should”, “project”, “believe”,
“anticipate”, “expect”, “plan”, “estimate”, “forecast”, “potential”, “intend”, “continue” and variations of these words or comparable words. These statements are
not historical facts, but rather are based on current expectations, estimates, assumptions and projections about the business and our future financial results
and readers should not place undue reliance on them.
Forward-looking statements do not guarantee future performance and involve risks and uncertainties. These risks and uncertainties include, without limitation,
economic conditions, product demand and semiconductor equipment industry capacity, worldwide demand and manufacturing capacity utilization for
semiconductors (the principal product of our customer base), the impact of general economic conditions on consumer confidence and demand for our
customers’ products, competitive products and pricing, affordability of shrink, the continuation of Moore’s Law, the impact of manufacturing efficiencies and
capacity constraints, performance of our systems, the continuing success of technology advances and the related pace of new product development and
customer acceptance of new products and customers meeting their own development roadmaps, market demand for our existing products and for new
products and our ability to maintain or increase or market share, the development of and customer demand for multi-patterning technology and our ability to
meet overlay and patterning requirements, the number and timing of EUV systems expected to be shipped, our ability to enforce patents and protect
intellectual property rights, the risk of intellectual property litigation, EUV system performance and customer acceptance, availability of raw materials and
critical manufacturing equipment, trade environment, our ability to reduce costs, changes in exchange rates and tax rates, available cash, distributable
reserves for dividend payments and share repurchases, changes in our treasury policy, including our dividend and repurchase policy, completion of sales
orders, the risk that key assumptions underlying financial targets prove inaccurate, including assumptions relating to market share, lithography market growth
and our customers’ ability to reduce productions costs, risks associated with Cymer, which we acquired in 2013, and other risks indicated in the risk factors
included in ASML’s Annual Report on Form 20-F and other filings with the US Securities and Exchange Commission. These forward-looking statements are
made only as of the date of this document. We do not undertake to update or revise the forward-looking statements, whether as a result of new information,
future events or otherwise.
November 2014
Public
Slide 2

Summary: ASML’s positioning, opportunities and threats
• ASML’s prime responsibility is to provide value for our
customers, shareholders, employees, and supply chain
partners
• Our success is based on delivering Litho products with
superior performance at lowest cost of ownership and on our
flexible operating model required for an inherently volatile
market
• ASML models an annual total revenue opportunity of 10B€ by
2020 and subsequent growth beyond
• We have reviewed our most impactful threats and feel confident
about our approach to mitigate these
November 2014
Public
Slide 3
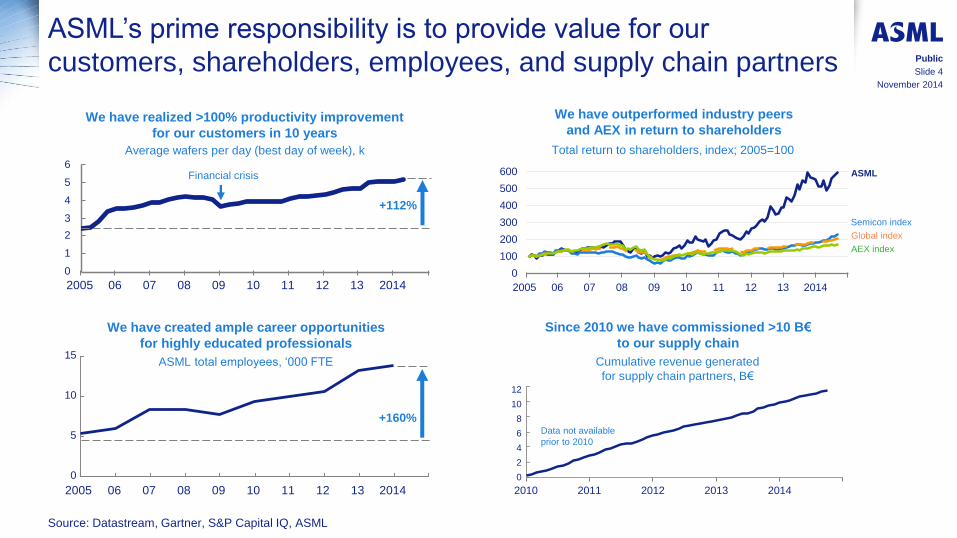
ASML’s prime responsibility is to provide value for our
customers, shareholders, employees, and supply chain partners
We have realized >100% productivity improvement
for our customers in 10 years
Since 2010 we have commissioned >10 B€
to our supply chain
We have outperformed industry peers
and AEX in return to shareholders
Cumulative revenue generated
for supply chain partners, B€
We have created ample career opportunities
for highly educated professionals
ASML total employees, ‘000 FTE
0
100
200
300
400
500
600
2014 13 12 11 10 09 08 07 06 2005
ASML
Global index
Semicon index
AEX index
0
15
10
5
08 09 12 2014 13 11 10 07 06 2005
8
12
10
0
2010 2013 2012
4
2011 2014
2
6
Total return to shareholders, index; 2005=100 Average wafers per day (best day of week), k
Source: Datastream, Gartner, S&P Capital IQ, ASML
5
6
0
2014 13
4
12
1
3
11
2
10 09 08 07 06 2005
Financial crisis
Data not available
prior to 2010
November 2014
Public
Slide 4
+112%
+160%

0
25
50
75
100
Our success is based on providing superior products
that enable Moore’s law
Our market is
growing as
Moore’s law
drives innovation
and investments
Our focused
strategy enabled
us to deliver
superior
products to the
market resulting
in a steady
increase of our
market share AS
ML
Lit
ho
mark
et
sh
are
%
Lit
ho
mark
et
B$
0
3
6
9
2013
85%
’10 ’08 ’06 ’04 ’02 2000 ’98 ’96 ’94 ’92 ’90 ’88 ’86 1984
Twinscan
EUV Stepper
Scanner
Source: Gartner, S&P Capital IQ, ASML
November 2014
Public
Slide 5
Immersion

+54% -10%
Historically our revenues have been volatile due to the
industry cyclicality and uncertainty …
0.8
1.8
2.0
0.4
1.2
0.6
1.0
0.2
1.4
1.6
0 2008 2009 2010 2011 2012 2013 2014
Ø 0.99 B€
2006 2005
Qu
art
erly r
eve
nu
es, B
€
2007
Source: ASML
November 2014
Public
Slide 6
-46% -82%
+87%

… therefore we have built a flexible operating model
that can deal with volatility and uncertainties
Flexible workforce Employees, x 1000
Indicators of flexibility
Additional flexibility through the hour
bank and other measures
Flexworkers
Own personnel
Source: ASML
November 2014
Public
Slide 7
85% 80%
15% 20%
2009 2014
100% = 8 14
Outsourced R&D R&D spend, M€
Flex labor and farm-out
D&E
65% 62%
35% 38%
2009 2014
100% = 450 1,066
Low share of Cost of Goods
COG, M€
Bill of material
ASML
14% 19%
86% 81%
2009 2014
100%

We expect Moore’s law to continue due to end-user
demand growth…
Further penetration of current applications
through new features and cost down
New applications are enabled by higher
performance and lower cost
1.4 1.2 1.1 0.9 1.5
0.21 0.20 0.19 0.17 0.14
Smartphones, B units
Tablets, B units
Servers, M units
Source: Euromonitor, Gartner, Yankee group, Profound Market intelligence, Machina Research's M2M forecasts
Wearables, B units
Connected devices, B units
10 11 11 12 12
2014 2013 2017 2016 2015
0.21 0.18
0.14
0.10
N/A
8.5
5.5 4.4
2013 2014
3.5
2015 2017 2016
6.9
November 2014
Public
Slide 8

2012 2013 2014 2015 2016 2017 2018 2019 2020 2021 2022
…enabled by continued customer investments
into shrink…
3nm 5nm 7nm 10nm 14/16nm 20nm 28nm
Lo
gic
HVM
Wo
rkin
g
Me
mo
ry
Sto
rag
e M
em
ory
1xL 1xM 1xH
1xL 1xM 1xH
2xL 2xM 2xH 3xL
FinFET III-V/Ge channel ? Gate All Around ? HiK Metal Gate Poly SiON
DRAM
MRAM
Production Research
Development Roadmap
Today’s status
Node x # of layers
1xVL 1xL
5x ≥ x96
Planar Floating Gate NAND
3D NAND
1xL x8 1xM x8 2x x8
X-Point: ReRAM, CBRAM, PC-RAM
1xM 1xH 2xL
5x x48 ~ x64 5x x32 5x x24
Source: ASML, Customer roadmaps
November 2014
Public
Slide 9

… in an ecosystem that has considerable financial
means and strong incentives to drive innovation … Top technology companies in our ecosystem (EBIT 2013, B$)
ASML Semi Peers Other
Software
and services
Hardware
manufacturers
Semi manufacturers
Semi design
Semi equipment
Total EBIT 2013 = ~250 B$
To
sh
iba (
3)
TSMC (7) D
ell
(3)
Ericsson (4)
(13)
(8)
(12)
(35)
(8)
(5)
eB
ay (
4)
Fa
ce
bo
ok (
3)
(27)
EMC
Te
nce
nt (3
)
(14)
(49)
(20) Yahoo
(1)
Hita
ch
i (4
)
TI (3)
(7) (14)
®
ASML (2) AMAT (1) TEL (1)
(4)
November 2014
Public
Slide 10

… and by compelling cost down and customer economics
Cost per function reductions are projected
to remain compelling
Investment pay-back time1 for foundries
are projected to remain in line with
historical trends
Cost per function for logic
N90 = 100%
N40 N65 N90 N2 N3 N5 N7 N10 N20 N28
Node investment payback time for foundry
Months
Source: ASML Patterning cost model, Layer stack model, Logic wafer price model, IBS
N90 N28 N20 N3 N16 N5 N2 N10 N65 N40 N7
100%
10%
1%
0.1%
Realized
Future
Realized Future
1 Time in months that it takes to pay back the CAPEX and Process R&D (NRE) costs
50
25
0
-45% NoN
-32% NoN
-41% NoN
No full shrink step,
mainly performance
benefits and EUV Delay
November 2014
Public
Slide 11

Continuation of Moore’s Law provides ASML with the
opportunity of 10B€ total revenue by 2020 and
subsequent growth beyond
Source: ASML marketing model Q2’14
>5.6
2014
Assumptions
• Full ASML roadmap is delivered
• Customers will continue to
deliver their shrink roadmap
• For prudent financial modelling a
3-year logic industry cadence is
assumed (while ASML prepares
for a 2 year cadence by R&D and
supply chain investments)
• End-market demand is based on
moderate growth of existing
application segments (e.g.,
mobile, tablet, cloud)
2020
~10
EUV 0.33
ArFi
Dry
November 2014
Public
Slide 12
ASML total revenue B€
Growth
opportunity
15+ B€
by next
decade

Litho growth is driven by an increased number of Litho
passes per wafer and higher cost per pass, in line with
trends to date
Total Logic litho revenues
B€
Source: ASML Patterning cost model, Layer stack model
Node capacity kWSPM1
Litho capex M€/kWSPM1
Average cost per pass M€/k passes per month
Passes # passes per wafer
300 270 178
N5 N20 N90
35 51
95 Dry
ArFi
EUV
19
76
6
N5
14
N20
5
N90
2
171 380
801
1) 1000 wafer starts per month: measure for wafer capacity - typical fab is 50-60 kWSPM
Growth due
to multiple
pattering and
higher number
of device
layers
The value of
Litho continues
to increase,
reflecting the
complexity of
the technology
and the value
it brings
End-market
decreases
moderately
due to higher
wafer/die
costs
3x & 4x
higher capex
delivers
13x & 10x
more
functions
per wafer
November 2014
Public
Slide 13
+169%
+159% N5 N20 N90
+199%
+293%
-10% -34%
N5 N20 N90
N5 N20 N90
+46%
+86%
+121%
+111%
LOGIC
EXAMPLE
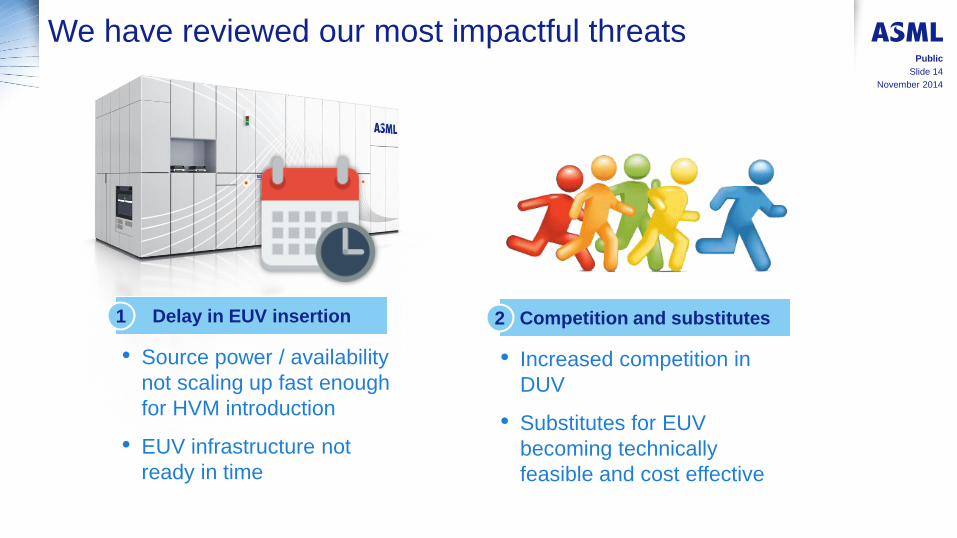
We have reviewed our most impactful threats
Delay in EUV insertion
• Source power / availability
not scaling up fast enough
for HVM introduction
• EUV infrastructure not
ready in time
• Increased competition in
DUV
• Substitutes for EUV
becoming technically
feasible and cost effective
1 Competition and substitutes 2
November 2014
Public
Slide 14

Even with delayed EUV delivery we will remain profitable and able to deliver significant value to our customers
1
Delay in EUV insertion
• Source power / availability
not scaling up fast enough
for HVM introduction
• We continuously monitor progress on EUV enablers
(resist, mask, etc.) and evaluate where our action
would be needed
• EUV infrastructure
not ready on time
ASML approach
• We have allocated massive resources to deliver our
EUV roadmap (incl. acquisition Cymer) to maintain our
customer’s roadmap
• Customers indicated, EUV will be introduced when we
meet a reliable 500 wafer per day threshold (which we
expect to realize soon)
• Economics of Moore’s law still hold in an 80W EUV world,
with 35% instead of 41% node-on-node cost decline
• The financial downside of potential later EUV adoption is
mitigated by additional DUV demand
November 2014
Public
Slide 15

We remain competitive in DUV and closely watch potential EUV substitutions
2
Competition
and substitutes
• Increased competition
in DUV
• Substitutes for EUV
becoming cost effective
(Multiple patterning and
Non-photo-litho
technologies)
ASML approach
• We continue executing our DUV and Apps roadmaps and
make material R&D commitments and therefore we will
maintain our competitive position as holistic Litho solution
provider
• Multiple patterning
• Next to cost, we believe EUV is more attractive than multiple
patterning because of reduced complexity resulting in better yield,
yield ramp-up and fab cycle time
• Additional DUV demand will mitigate the risk of multiple patterning
substitution
• Alternative technologies
• Currently there are no viable alternatives at scale. DSA (direct
self assembly) is not an alternative, but a complementary to Litho
• We continuously monitor progress and status of alternative
technologies
November 2014
Public
Slide 16

Summary: ASML’s positioning, opportunities and threats
• ASML’s prime responsibility is to provide value for our
customers, shareholders, employees, and supply chain
partners
• Our success is based on delivering Litho products with
superior performance at lowest cost of ownership and on our
flexible operating model required for an inherently volatile
market
• ASML models an annual total revenue opportunity of 10B€ by
2020 and subsequent growth beyond
• We have reviewed our most impactful threats and feel confident
about our approach to mitigate these
November 2014
Public
Slide 17
November 2014
Slide 18
Public