creating value … … delivering solutions modeling 72-miles of the mississippi on a 2-mile budget...
TRANSCRIPT

Creating Value …
… Delivering Solutions
Modeling 72-Miles of the Mississippi on a 2-Mile Budget
Mohamed A. Bagha, P.E., CFM Dong Nguyen, P.E., CFM Pradeepa Venigalla, EIT

Background
CF3R - Comprehensive Flood Risk Resources and Responses - ID/IQ JV for FEMA Region VI.
Baker - Managing Partner Multiple County DFIRM Task Order (2008)
Texas (7 Counties) Louisiana (3 counties) Arkansas (9 counties)

Arkansas Counties
Southern Arkansas Ashley Chicot Desha Drew

Major Rivers in South-East Arkansas
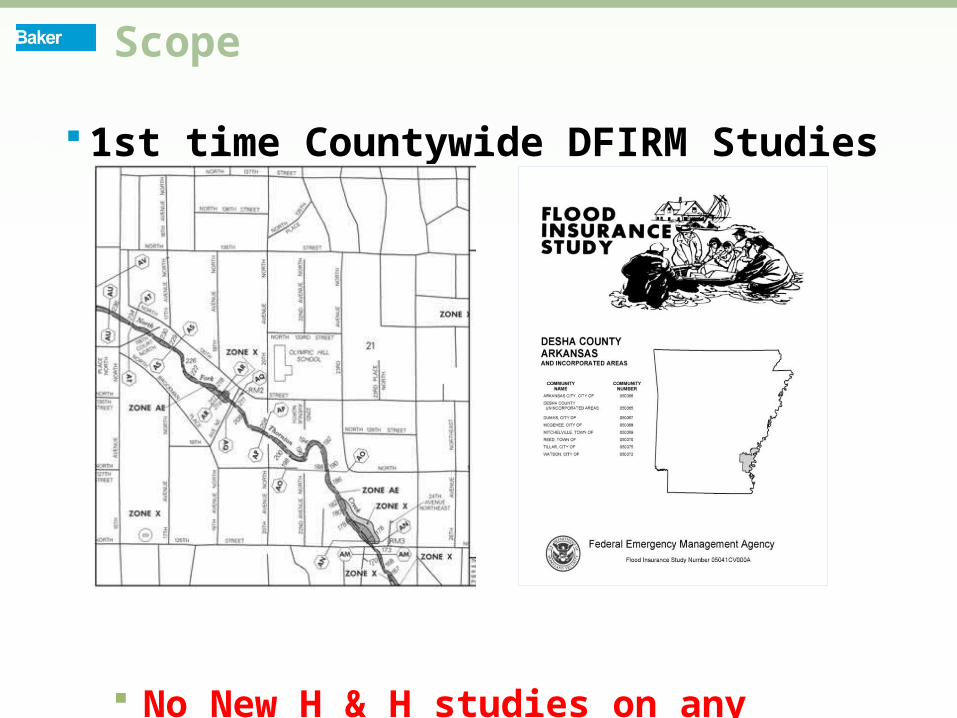
Scope
1st time Countywide DFIRM Studies
No New H & H studies on any streams

Areas of Moderate Flood Risk, Subject to 0.2% Annual Chance Flood
Includes Areas Subject to Shallow Flooding
Areas of Residual Risk Behind Accredited and Provisionally Accredited Levees
No BFEs or Flooding Depths Shown on FIRMs
What Does a Shaded Zone X Area Mean?
Purchase of Flood Insurance Not Mandatory
Statistically, a 0.2% Chance Flood has a 6% Chance of Occurring During a 30-Year Period

Levee Systems

Levee Guidelines & Specifications for Levees
FEMA G &S Appendix H Guidance for Mapping
of Areas Protected by Levee Systems (2003)
5 Memos since: 34, 43, 45, 51, 53 2005 - 2009

Create / Obtain Hydraulic Modeling along Levee’d Stream
Fail Entire Levee, not only localized breach
Delete entire embankment and levee identifiers from geometry
Extend Cross sections on overbanks
Ideal procedure – Mapping Residual Risk
Re-run model in without-levee mode
Map resulting residual risk floodplain

However…
Limited Modeling Available along Mississippi River in SE Arkansas.
1
1. Complete Hydraulic Model Not Available for Study Area
2
2. COE Memphis District Provided a HEC-RAS Model of the Mississippi River 1% chance Flood from RM 956.97 to RM 594
33. COE Vicksburg District Provided Cross Section
Geometry & Reach Lengths for HEC-2 Model from RM 621.03 to RM 321
4
4. No Peak Discharges or Manning’s ‘n’ Values Provided in Vicksburg District HEC-2 Model

Key Cross Sections

Maintain Quality of Product
Challenges
Limited FEMA Funding Per
Countywide Study
Compressed Schedule Delayed
by Certification Process
Follow Relevant FEMA Procedure
Guidelines
Create Model for Shaded X Floodplains
for all Levees

Conceptualization
Alternative Modeling
Defendable &
Reasonable
Consistent with and ties into previous Studies
Economical - a Detailed Study of the Mississippi Along this Reach May Prove Very Expensive
Concurrence on Approach from RMC 6 and FEMA Region VI Vital
Compressed Schedule - with delays due to PAL Requests, little time to complete task

Memphis & Vicksburg HEC Models
Cross sections located using USACE MVD Navigation Book www.mvd.usace.army.mil/Gis/navbook/html/corps.htm
Memphis HEC-RAS
• Flows and Manning’s ‘n’ calibrated for 1% event
• Start – RM 956.67• End – RM 592.00• Covers Northern Desha
County
Vicksburg HEC-2
• Cross Section Geometry Only
• Start- RM 594.21• End- RM 321.00• Chicot County Southern
Limit at RM 504.66

Geometry
• HEC-2 cross section geometry
• HEC-RAS Model Upstream
• Peak Discharges
Integrate
• 1:40,000 USACE MVD Navigation Maps
• Cross Section Stationing.
• GIS Base Mapping
Locate• USGS Topographic
Mapping.• 13 composite HEC-
RAS Sections• 42 composite HEC-2
Sections
Extend

HEC Geo-RAS Data Extracted from USGS DEM and Cross Sections
Overlay with Cross Section from HEC-RAS and HEC-2 Models
Use Surveyed Elevation Data in channels and on overbanks where Available
Supplement cross section overbanks with USGS Contour DEM Data
Geometry- Splicing Cross Sections
Extend Cross Sections across county boundaries
Determine appropriate Manning’s ‘n’ for overbanks.

Splicing Cross Sections
Vicksburg COE HEC-2 Cross Section 590.4.
0 10000 20000 30000 40000 5000060
80
100
120
140
160
180
ShadedZoneX-hec2 Plan: 1) NoLevee 5/22/2009
Station (ft)
Ele
vatio
n (ft
)
Legend
WS PF 1
Ground
Bank Sta
.14 .032 .14

Splicing Cross Sections
HEC-RAS channel data + USGS DEM @ XS 590.4
0 10000 20000 30000 40000 50000 60000
100
120
140
160
180
ShadedZoneX-hec2 Plan: Plan-NoLevee 5/22/2009
Station (f t)
Ele
vatio
n (ft
)
Legend
EG PF 1
WS PF 1
Crit PF 1
Ground
Ineff
Bank Sta
.15 .03 .15
0 20000 40000 60000 80000 100000 120000 140000 160000 18000060
80
100
120
140
160
180
ShadedZoneX-hec2 Plan: 1) Shaded X 2) Plan-Levee
Station (f t)
Ele
vatio
n (ft
)
Legend
WS PF 1 - Plan-Levee
WS PF 1 - Shaded X
- Plan-Levee
Ground - Plan-Levee
Levee - Plan-Levee
Bank Sta - Plan-Levee
- Shaded X
- Shaded X
Ground - Shaded X
Ineff - Shaded X
Bank Sta - Shaded X

Cross Section Layout

Chicot County Detailed Study
BFEs along Mississippi River in Chicot County COE, Vicksburg Study No Peak Discharges No Floodway Data 1979 FIS report.

Hydrology 101 1 + 1 + 1 ≠ 3
Efficiencies: Reverse Engineering
Sensitivity Analyses 2 variables- Manning’s ‘n’ and Q100
While holding the Channel ‘n’ values steady: Determine the % of flow addition that results in
computed W.S. Elevations at Chicot County limits matching 1979 BFEs.
Multiple Profiles set up, each profile with Incremental Discharges.
40% of Arkansas River & White River peak discharges added yield best match with 1979 BFEs on Mississippi River in Chicot Co.
Efficiencies: Reverse Engineering (Cont’d)
While holding peak discharges constant: Vary Manning’s ‘n’ values - ± 25%. Upstream cross sections in Memphis COE HEC-
RAS model show minimal WS Elevation change. Results: Variation in ‘n’ values did not cause
significant impact to W.S. Elevations along the Mississippi River.
Conclude that Model is sensitive to Q variation rather than ‘n’ variation.

Efficiencies: Reverse Engineering (Cont’d)
1000000 1100000 1200000 1300000 1400000
-100
-50
0
50
100
150
ShadedZoneX-hec2 Plan: Mississippi shaded zone X 5/29/2009 XS 594 - XS 507
Main Channel Distance (ft)
Ele
vatio
n (ft
)
Legend
WS PF 1
WS PF 2
WS PF 3
WS PF 4
WS PF 5
WS PF 6
WS PF 7
WS PF 8
WS PF 9
WS PF 10
WS PF 11
Ground
507.
29
509.
2
511.
01
512.
8
515.
03
516.
6
518.
21
521.
19
522.
76
524.
4
526
527.
8
529.
2
531
531.
7
533.
13
535.
17
537.
25
538.
56
540.
38
543.
21
544.
72
546.
83
549
551
553
554.
59
557.
21
560
562.
4
565.
19
567
569.
03
573.
15
574.
8
576.
21
578.
8
584.
86
589.
07
590.
4
RIVER-1 Reach-1
Chicot County (with 1979 BFEs)

Bayou Bartholomew
Longest Bayou in the world Flows ~375 miles Parallel to Mississippi River Conveys up to 7,500 cfs Drainage area: 1,110 sq. mi. Major conveyance system Shaded Zone X for Mississippi River West Bank
levee will not extend west beyond this bayou Levee-like features (railroad & highway
embankments) cannot be used as alternative.

Resulting Multi-County Shaded X floodplain

DFIRM – Desha County Panel 0250
Red Fork Bayou
Carter Bayou

Summary
HEC-RAS along Mississippi across two counties. Seamlessly integrated geometry (Vicksburg
COE) with Memphis COE HEC-RAS model . Cross sections extended on right overbank
using USGS Topographic data. Peak discharges estimated. Manning’s ‘n’ values determined. Shaded Zone X extents mapped. Future studies in Northern Louisiana impacted.

Conclusion
Creative Approach to resolve missing data issue. Quality End-Product - FEMA requirements. Residual Risk Mapping has solid technical basis. Short Schedule
2 week turnaround. Limited Budget
3 member team to conceptualize, coordinate, process and report on results
Effective Coordination Between Study contractor, RMC6, FEMA and
USACOE Districts (Memphis and Vicksburg)

Creating Value …
… Delivering Solutions
Questions?