creating shareholder value through increasing cash … · 1 creating shareholder value through...
TRANSCRIPT

1
Creating shareholder value through increasing cash flow, dividends and growing our business
January 2011
2
Market leading businesses, strong group synergies
#1£23bn assetsUK Annuities
#2£10bn mortgagesUK Housing
#7£250m premiumsUK General Insurance
#3£300m premiumsUK Group Protection
#1£800m premiumsUK Protection
Launched Nov 095,000 branchesIndia
Top 20€350m premiumsFrance
#7€350m premiumsNetherlands
Launched Dec 09JV across six Gulf States
Gulf States
#8$400bn sum assuredUSA
PositionScaleCountry
#3£6bn assetsWorkplace Pensions
#4£5bn assetsSIPPs
#2£21bn assetsUK With Profits
#3£7bn assetsUK Equity ISAs
#3£20bn assetsUnit Trusts
PositionScaleActivity
#179% of assets under managementExternal Clients
#13,200 clientsUK Corp Pensions
#155 out of 100 clientsFTSE 100 Clients
#2£342bn assets under management
Funds Under Management
PositionScaleActivity
H1 2010: IFRS Profits: £98m (+32%) Cash: £70m (+29%)
INVESTMENT MANAGEMENT SAVINGS
INTERNATIONALRISK
PositionScaleActivity
H1 2010: IFRS Profits: £54m (+217%) Cash: £38m (09: £(4m))
H1 2010: IFRS Profits: £310m (+39%) Cash: £202m (-12%)
H1 2010: IFRS Profits: £61m (-6%) Cash: £33m (09: £nil)

3
Strong performance against key objectives.
• Divergent and sustainable cash flows across multiple businesses which have market leading positions
• New sources of cash flow from international dividends and improvement in Savings performance. US capital management programme will produce more cash
• We continue to grow our “stock” of assets which drives profits and cash
• Substantial headroom for dividend increases
• Opportunities to deploy cash flow and capital in shareholder value creating transactions
• Nine months net cash* up 14% to £526m (9M09: £461m)
• LGIM assets under management up 10% to £342bn (30.09.09: £311bn)
• Savings assets under administration up 17% to £61bn (30.09.09: £52bn)
• US dividend H110: £33m
• Worldwide sales up 27% to £1,347m (9M09: £1,0588m)
• Final dividend 2009: +33%• Interim dividend 2010: +20%
* Net cash generation includes operational cash generated less new business strain for the UK non profit Risk and Savings businesses, plus the shareholders' share of bonuses on With-profits business, the post-tax IFRS operating profit of LGIM and other UK businesses, the expected investment return on Group capital and financing invested assets, and dividends remitted from International businesses.
4
Cash: massive increase in free cash flow
230320
526100
599
2007 2008 2009 9M10
Dividend: Interim £65m
Final £160m
Full £225m
Cash Cover: 3.1x
Interim £78m
2-3x
+20%
Net Cash Generation 2007 – 2010 (£m)
Dividend: “Underlying growth rate - comfortably double digit”

5
Multiple Levels of Synergy – LGIM at the centre of the Group
Investment Management
Annuities
USA and Europe
Emerging Markets
Protection Savings
General Insurance
Vesting annuities from pension policies
Annuity Funds
BPA Clients
International Distribution
International Distribution Bringing UK
expertise in savings to other
geographies
Bringing UK expertise in
protection to other geographies
Internal funds
Client funds – Unit Trusts, NP and WP
Completes ‘home purchase’ offering which is important for bancassurance partners and tied distribution
‘Hedge’ between mortality and longevity
6
Financial Model.
Risk £212m
Savings £72m
Investment Management £70m
International £33m
Other £15m
Operational Cash
Total £402m
New Business
Strain
£(44)m
Interim Dividend
£(78)m
Capital
StockNet Capital Movements
£(0.1)bn
31/12/09 £3.1bn
30/06/10 £3.3bn
Net Cash
£358m
Free Cash Flow
£280m£280m
Shareholders

7
Cash flow: strong prospects for sustained cash generation
(1) Management estimates. (2) Based on 2009 year end assumptions. (3) For illustration purposes only, not a management forecast
702011 UK new business cash flows3
50702010 UK new business cash flows3
730375037707,900UK VIF monetisation
5050707002009 UK new business cash flows
5606307007,200UK Business in-force at start of year2
201220112010TotalEstimated monetisation of worldwide VIF(undiscounted)1 (£m)
>80>90902,300International VIF monetisation
With Profit
Non Profit
706060900
>540>6207107,000
Modelled Capital release (to Capital stock)
Expected Risk and Savings cash release
190
520
8
Tax gross up
Modelling the business
Risk & Savings release
With-profits
Retail Investmentsand other savings
GI and other risk
LGIM
International dividends
Group capital & financing
Total
International(excl. dividends)
Operating profit
Variances and other
H1 2010
New bus strain (£m)
Net cash (£m)
239
23
12
10
70
33
15
(44) 195
23
12
10
70
33
15
402 358
7
542
27
150
(44)
Operational cash (£m)
FY 2009
New bus strain (£m)
Net cash (£m)
496
46
2
16
125
8
33
(27) 469
46
2
16
125
8
33
726 699
78
1,109
28
304
(27)
Operational cash (£m)
FY 2010
New bus strain (£m)
Net cash (£m)
520
> 600
Operational cash (£m)
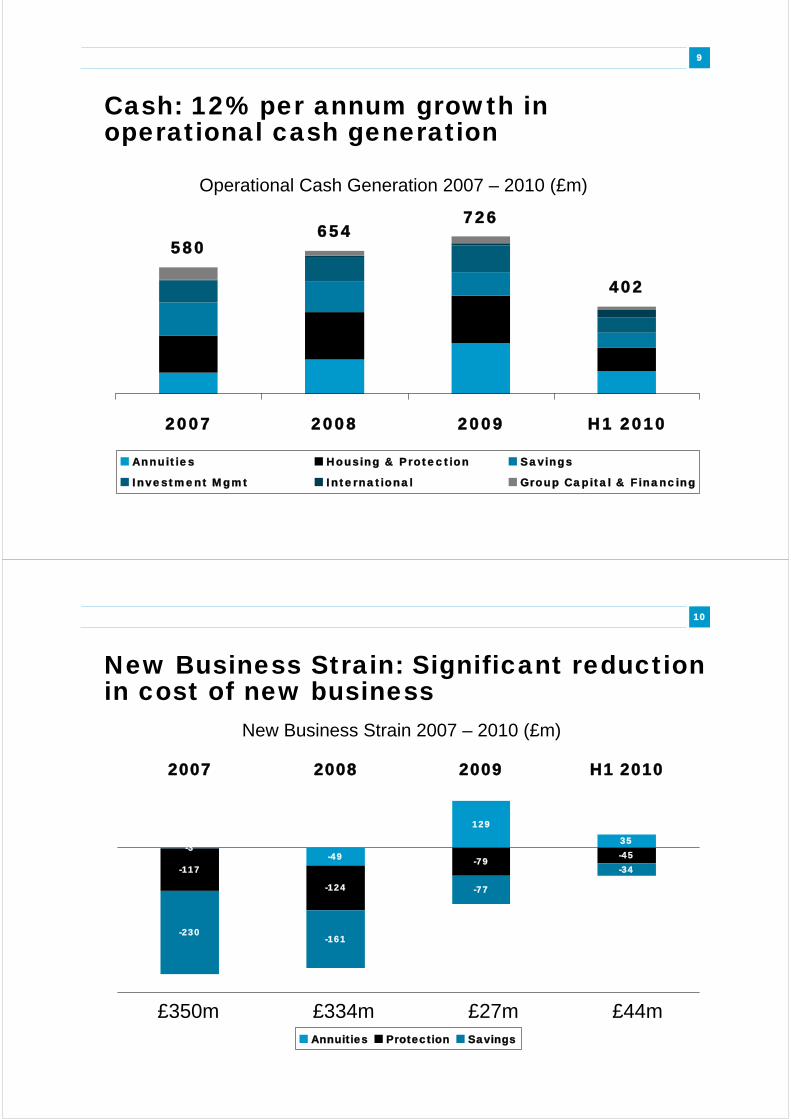
9
Cash: 12% per annum growth in operational cash generation
580654
726
402
2007 2008 2009 H1 2010
Annuities Housing & Protection Savings
Investment Mgmt International Group Capital & Financing
Operational Cash Generation 2007 – 2010 (£m)
10
New Business Strain: Significant reduction in cost of new business
-3-49
35
-117
-124
-79-45
-230-161
-77
-34
129
2007 2008 2009 H1 2010
Annuities Protection Savings
New Business Strain 2007 – 2010 (£m)
£350m £334m £27m £44m

11
Cash: massive increase in free cash flow
230320
526100
599
2007 2008 2009 9M10
Dividend: Interim £65m
Final £160m
Full £225m
Cash Cover: 3.1x
Interim £78m
2-3x
+20%
Net Cash Generation 2007 – 2010 (£m)
Dividend: “Underlying growth rate - comfortably double digit”
12
Multiple Sources of Sustainable Cashflow
UK In Force Business
£7.9bn across Risk, Savings and
With Profits
£24bn Annuities Business – 100bps
pa profit
£56bn Savings Business – 18bps
pa profit
£1.1bn Protection Premiums
H1 2010 £262m
International In Force
Business
£2.3bn across USA & Europe
$800m US Protection Premiums
$1.6bn capital in US
€700m European Premiums
Businesses in India, Gulf, Egypt
H1 2010 £33m
LGIM
£320bn Assets Under
Management
10.6bps revenue
5.5bps cost
6.1bps profit
£21.2bn gross new business in H110
Doubled profits in 5 years
H1 2010 £70m
Retail
Investments
£20bn Assets under
Administration
H109: £(5)m loss
H110: £14m profit
£3.5bn gross new business in H110
10% of all equity ISAs sold in the
UK
H1 2010 £12m
General Insurance
£250m Premiums in Force
H107 £(38)m loss
H108 £(4)m loss
H109: £6m profit
H110: £14m profit
Combined operating ratio
H110 90%
H1 2010 £10m

13
Asset businesses are the major contributor to profit and cash…
Asset businesses Insurance businesses
74% 26%
Net cash £358m
108Total Cash
(28%) 152Total Profit
38Savings
70
Net Cash
LGIM
94Total Cash
(33%) 177
33
10
51
Net Cash
Total Profit
International
GI
Protection
Spread
156Total Cash
(42%) 227
15
141
Net Cash
Total Profit
Group
Annuities1
Fee
1Annuities business includes longevity risk, Profit numbers excludes Investment projects of £(14m)
14
Deploying cash and capital…….RETURN TO SHAREHOLDERS IMPROVE RESERVES
GROW THE BUSINESSIMPROVE CAPITAL SURPLUS
“multiple opportunities to deploy capital in shareholder value creating transactions.
We would expect to benefit from UK life sector consolidation and exits.
we are not opposed to deploying capital selectively, through bolt-on purchases in selected growth
markets, new joint ventures in emerging markets, or where they bring distribution advantages. ”
“underlying growth rate in the dividend comfortably double digit
Final 09 dividend – up 33%, Interim 10 dividend – up 20%
We see substantial headroom for increases in the dividend”
“Group Capital reserves of £6.0 billion, some £3.3 billion more than Group Capital requirement.
IGD coverage ratio at the end of H1 10 remained very strong at a record 222%
the more meaningful future measure for us … will be the quantum of economic capital available after Solvency 2. We are working hard to influence the Solvency 2 process ….The direction of travel has
been broadly helpful ”
“we experienced no defaults in H1 but have retained the £1.5bn default reserve and we have
minimum exposure to riskier sovereign debt.
….our assumed reinvestment rates are prudent and well below current market rates and our mortality
experience is below assumed levels.
In the US we have over £900m of capital ……….more capital than the UK annuity business.”

15
Valuing the business - for generalist investors….
Total 6,695 114
Per Share (p)
EEV (£m)
31/12/09
6,958 119
Per Share (p)
EEV (£m)
30/06/10H1 Net
Cash (£m)Per Share
(p)Valuation
(£m)
LGIM
Retail Investments
General Insurance
305
100
120
5
2
2
IFR
S
Bu
sin
ess 370
107
137
6
2
2
70
14
10
UK
International
2,588
518
44
9EE
V
SN
W 2,988
496
51
9
UK
International
3,987
1,012
68
17Dis
-co
un
ted
V
IF
3,817
1,119
65
19
216
33
Net Debt (1,935) (33) (2,076) (35)
15
358
P/E
Notes: VIF: Value of In Force,. EEV SNW, European Embedded value Shareholder Net Worth. No of Shares: 5.8bn
16
Legal & General: Strategy
• Solid platform: cash generative, strong balance sheet– well placed to withstand heightened uncertainty
• Opportunities for profitable growth– capitalise on shift from public to private sector– net beneficiary from industry consolidation– strong momentum in Savings– annuity demand remains strong– export of LGIM and Bancassurance franchises– leverage multiple layers of synergy

17
Summary
• Divergent and sustainable cash flows across multiple businesses which have market leading positions
• New sources of cash flow from international dividends and improvement in Savings performance. US capital management programme will produce more cash
• We continue to grow our “stock” of assets which drives profits and cash
• Substantial headroom for dividend increases
• Opportunities to deploy cash flow and capital in shareholder value creating transactions
18
Key business numbers
6101,090Protection premiums £m
310735Operating profit £m
2422Annuity assets £bn
n/a52%RoC (pre tax)
(10)50New business strain £m
202504Net cash £m
H1 102009Risk
3833Net cash £m
5450Operating profit £m
5655AuM £bn
n/a8%RoC (pre tax)
(34)(77)New business strain £m
609907APE £m
H1 102009Savings
70121Net cash £m
98167Operating profit £m
320315AuM £bn
n/a49%RoC (pre tax)
10.69.8Ad valorem fee margin (bp)
21.231.5Gross new funds £bn
H1 102009Investment Man.
76No. of businesses
$800m$774mL&G America (GWP)
338Net cash £m
61127Operating profit £m
81115APE £m
n/a9%RoC (pre tax)
H1 102009International
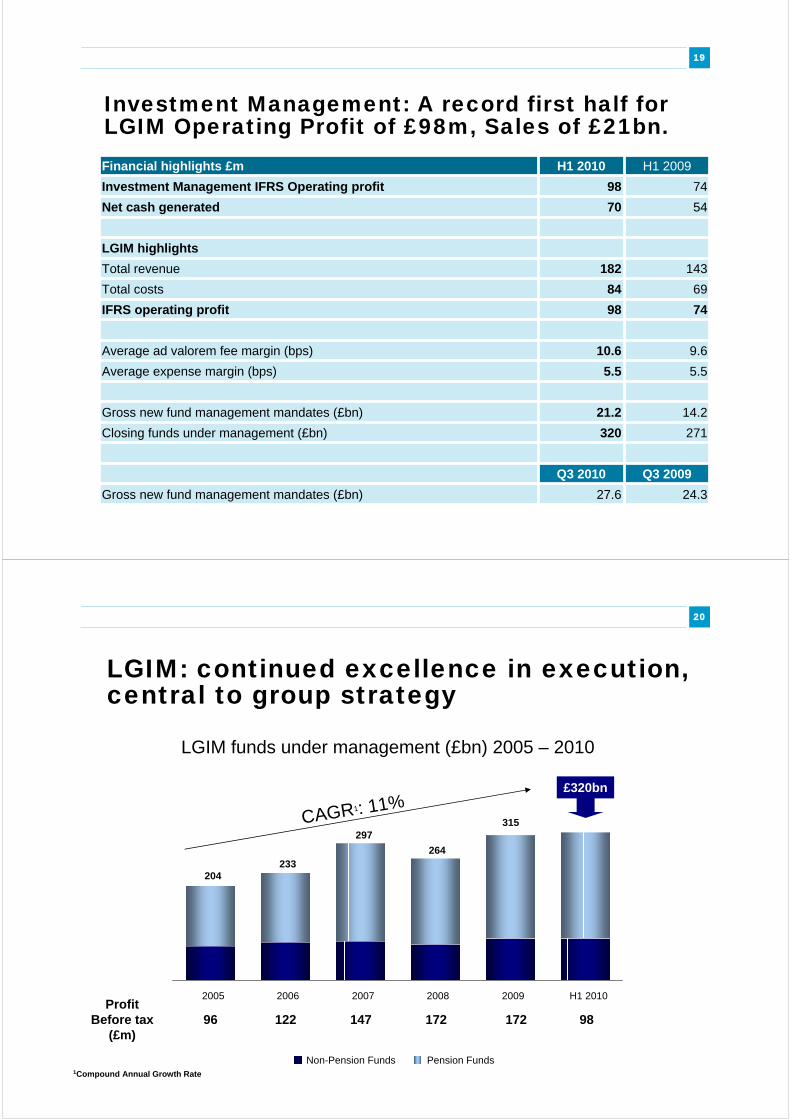
19
Investment Management: A record first half for LGIM Operating Profit of £98m, Sales of £21bn.
271320Closing funds under management (£bn)
Q3 2009Q3 2010
24.327.6Gross new fund management mandates (£bn)
14.221.2Gross new fund management mandates (£bn)
5.55.5Average expense margin (bps)
9.610.6 Average ad valorem fee margin (bps)
7498IFRS operating profit
6984Total costs
143182Total revenue
LGIM highlights
5470Net cash generated
7498Investment Management IFRS Operating profit
H1 2009H1 2010Financial highlights £m
20
LGIM: continued excellence in execution, central to group strategy
LGIM funds under management (£bn) 2005 – 2010
£320bn
CAGR1: 11%315
204233
297
264
2005 2006 2007 2008 2009 H1 2010
9817217214712296Profit
Before tax (£m)
Non-Pension Funds Pension Funds1Compound Annual Growth Rate

21
Investment Management: new business continues to grow strongly.
7.5
9.2
11.2 10.7
7.7
9.0
Q1 09 Q2 09 Q3 09 Q4 09 Q1 10 Q2 10
UK International
Quarterly New Business 2009 – 2010 (£bn)
LGIM Net new business H1 2010: £8.3bn
22
LGIM Funds: Diversified across passive and active asset classes
326.07.9Property & Other
1854.564.5Fixed Interest
12180.6202.0Total
1055.661.4UK Equities
90.3
22.5
7.3
68.3
56.7
30/06/09
31118.0Total
6737.6Structured solutions (incl LDI)
108.0Equities
Active
169.2Fixed Interest (incl cash)
2671.4International Equity
Index
% Change30/06/10£bn
Growth in index, international, fixed interest and LDI

23
Savings: Transformation story continues. Further growth in profits, cash, assets and margins.
448609New business APE
4656Assets under administration £bn
7259Cost to fund ratio (bps)*
7377Fee to fund ratio (bps)*
FY 2009H1 2010
(4)38Net cash generation
(44)(34)New business strain
4072Operational cash generation
1754IFRS operating profit
H1 2009H1 2010Financial highlights £m
*Annualised, excluding with-profits
24
Savings: the transformation in new business mix continues…….
2009£907m
2008£879m
2007£893m
Savings new business APE: product mix (£m) 2007-2010
23%
77%
49%
51%38%
62%
UL Bonds and NP PensionsHigh Commission, Long payback Capital in WP Estate Lower Commission, modern products
With Profit Pensions SIPPs, Unit Trusts, Workplace Pensions and WP Bonds
H1 2010£609m
6%
94%

25
Savings: Profit contribution across the business.
(4)
21
(20)
(5)
17
29
(4)
(8)
H1 2009
38Total
23With Profit Savings
1Non Profit Savings
14Non Insured Savings
Net cash generation
54Total
32With Profit Savings
6Non Profit Savings
16Non Insured Savings
IFRS operating profit
H1 2010Financial highlights £m
26
Savings deconstructed……L&G Savings
Assets £56bn
Profit £54m
Cash £38m
Non Insured
Assets £20bn
Profit £16m
Cash £14m
Non Profit
Assets £15bn
Profit £6m
Cash £1m
With Profit
Assets £21bn
Profit £32m
Cash £23m
Workplace Pensions £4bn
Individual Pensions £9bn
WP Bonds £4bn
Other WP £4bn
Workplace Pensions £2bn
Individual Pensions £3bn
NP Bonds £10bn
Unit Trusts £10bn
Structured & SIPPs £8bn
Platforms £2bn
Unit Trusts £13m
Structured & SIPPs £5m
Platforms £(2)m

27
Risk: Another strong six months. Healthy cash and profit contribution.
22.4
124
136
99
561
7.0
229
13
216
223
H1 2009
202Net cash generation
610Protection Gross Premiums (£m)
6.0Protection new business EEV margin (%)
134General Insurance Gross Premiums
90General Insurance Combined Operating Ratio (%)
212Operational cash generation
(10)New business strain
23.9Non profit annuity assets (£bn)
117Non profit annuity earned interest margin (bps)
310IFRS operating profit
H1 2010Financial Highlights £m
28
Annuities New Business: Q2 volumes significantly above previous four quarters.
3326 22
1727
34
50
24
59
15
30
Q1 09 Q2 09 Q3 09 Q4 09 Q1 10 Q2 10
Individual Bulk
83
42
50
64
27 26
Annuity Quarterly New Business APE 2009 – 2010 (£m)
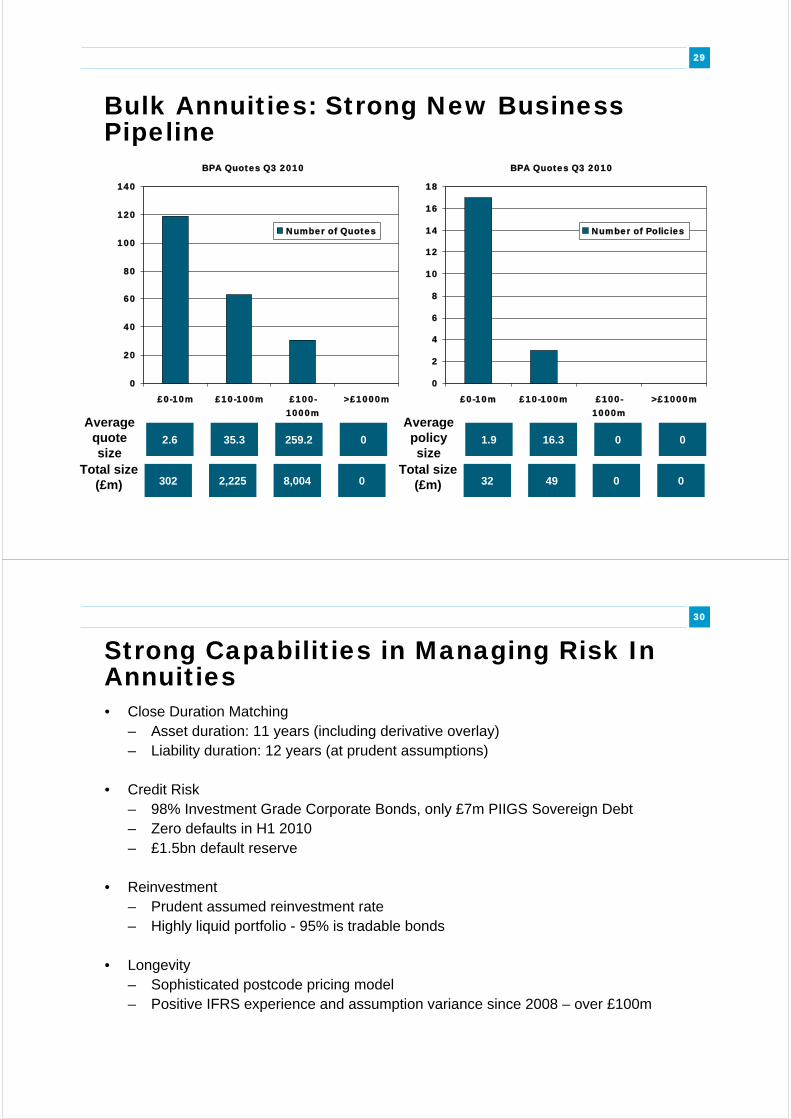
29
Bulk Annuities: Strong New Business Pipeline
BPA Quotes Q3 2010
0
20
40
60
80
100
120
140
£0-10m £10-100m £100-1000m
>£1000m
Number of Quotes
2.6 35.3 259.2 0
Average quote size
302 2,225 8,004 0Total size
(£m)
BPA Quotes Q3 2010
0
2
4
6
8
10
12
14
16
18
£0-10m £10-100m £100-1000m
>£1000m
Number of Policies
1.9 16.3 0 0
Average policy size
32 49 0 0Total size
(£m)
30
Strong Capabilities in Managing Risk In Annuities• Close Duration Matching
– Asset duration: 11 years (including derivative overlay) – Liability duration: 12 years (at prudent assumptions)
• Credit Risk– 98% Investment Grade Corporate Bonds, only £7m PIIGS Sovereign Debt– Zero defaults in H1 2010– £1.5bn default reserve
• Reinvestment– Prudent assumed reinvestment rate– Highly liquid portfolio - 95% is tradable bonds
• Longevity– Sophisticated postcode pricing model– Positive IFRS experience and assumption variance since 2008 – over £100m

31
Annuity Pricing.Modelled Prudent Reserves
4%
Typical BPA Scheme
Expense Reserve
Mortality Reserve
Default RiskReserve
Best Estimate Liability
Re-InvestmentReserve
Other Prudent Reserves
Solvency Capital
10
0%
Market Pricing Dynamics
Prudent Reserves
• Based on modelling of scheme liabilities
• Difference between Best Estimate and Prudent reserves equates to c.100bp pa cash flow
or
Attractive Pricing
Conditions. e.g. 2009
Less Attractive
Pricing Conditions. e.g. 2008
Positive New Business Strain i.e. Day 1 capital
release
Negative New Business Strain i.e. Day 1 capital
injection
Cus
tom
er P
rice
Cus
tom
er P
rice
Release of prudent reserves
generates c100bps of cash
each year for duration of
annuity
32
Protection: the UK’s leading protection business. A high scale, high quality franchise
Protection gross premiums (£m) 2005- 2010
435
175
894
1,0901,018
610
792
2005 2006 2007 2008 2009 H1 2010Individual Protection Group Protection
CAGR: 9%£1,109m
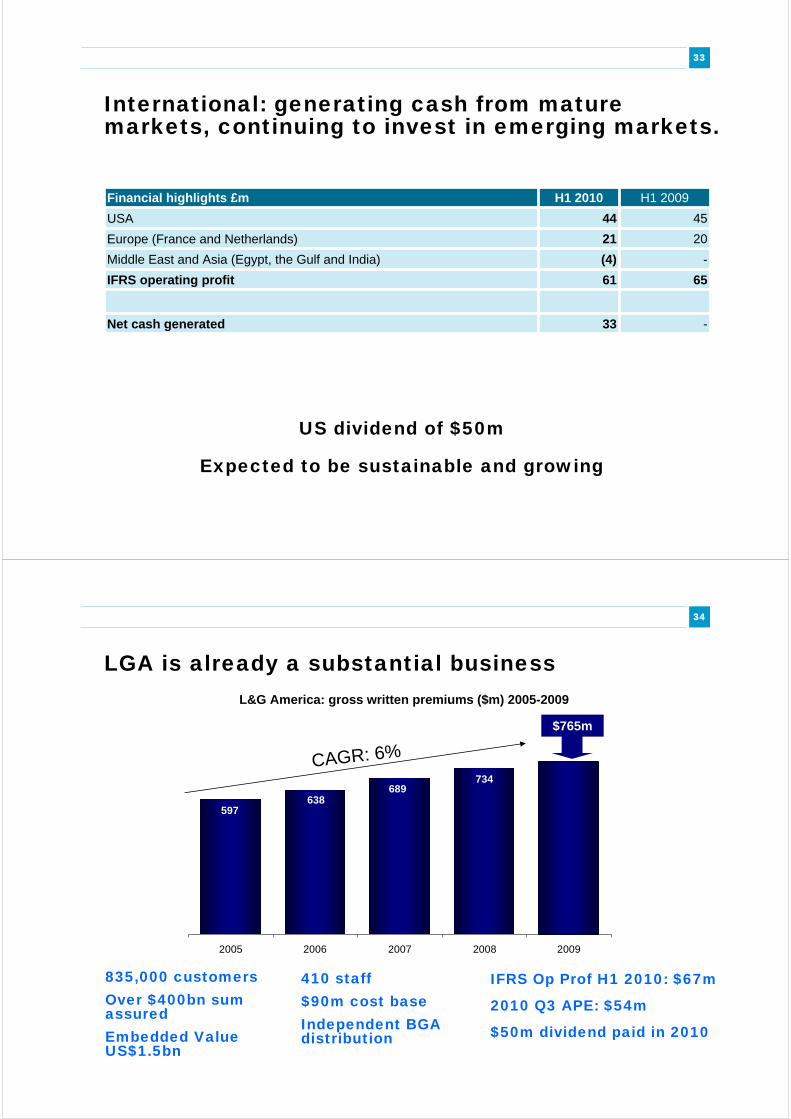
33
International: generating cash from mature markets, continuing to invest in emerging markets.
-33Net cash generated
6561IFRS operating profit
-(4)Middle East and Asia (Egypt, the Gulf and India)
2021Europe (France and Netherlands)
4544USA
H1 2009H1 2010Financial highlights £m
US dividend of $50m
Expected to be sustainable and growing
34
LGA is already a substantial business
835,000 customersOver $400bn sum assuredEmbedded Value US$1.5bn
410 staff$90m cost baseIndependent BGA distribution
IFRS Op Prof H1 2010: $67m
2010 Q3 APE: $54m
$50m dividend paid in 2010
689734
597638
2005 2006 2007 2008 2009
L&G America: gross written premiums ($m) 2005-2009
CAGR: 6%
$765m

35
Strong fit with strategy
Major emerging insurance market
Strong banking partners with nationwide distribution
Good ability for L&G to influence start up and ongoing oversight
Excellent first year
Successful launch, at speed - £43m APE in first nine months
Strong out performance of plan
Partnership working well
Future
Young market undergoing major changes
Product and distribution diversification key
36
Cash: Legal & General Definition.H1 10
Risk: In force release from Protection 96
In force release from Annuities 106
General Insurance post tax Profits 10
(Protection New Business Strain) (45)
(Annuity New Business Strain) 35
Savings: In force release from Non Profit Savings 37
With Profits transfer 23
Retail Investments post tax profits 14
(Savings new business strain) (34)
Investment Mgmt: LGIM post tax profits 70
International: Dividends received 33
GC&F: Investment return on shareholder funds 96
(Cost of debt) (63)
Net Cash Generated 358
37
Key events
2011
24-26th- January Germany/Scandinavia Roadshow
17th March Preliminary Results
21-24th March London/Scotland Roadshows
29 March Morgan Stanley Conference
4-8th April US Roadshow
4th May Interim Management Statement
38
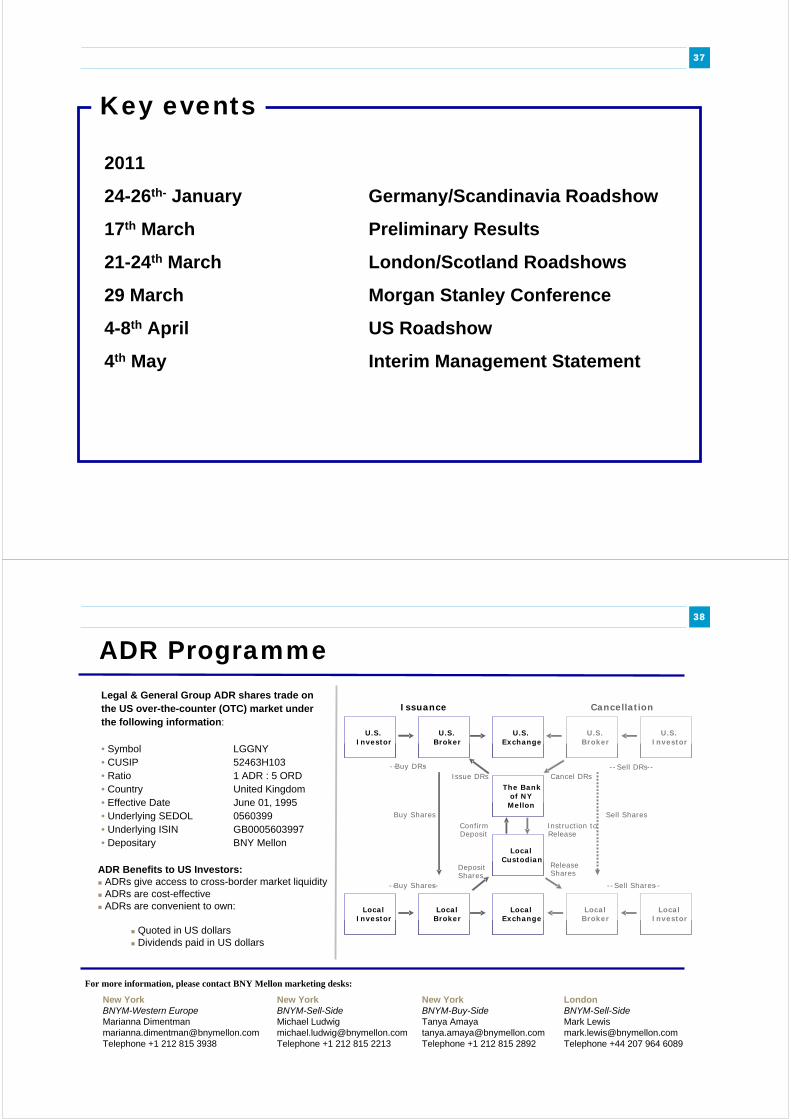
Legal & General Group ADR shares trade on the US over-the-counter (OTC) market under the following information:
• Symbol LGGNY• CUSIP 52463H103• Ratio 1 ADR : 5 ORD• Country United Kingdom• Effective Date June 01, 1995• Underlying SEDOL 0560399• Underlying ISIN GB0005603997• Depositary BNY Mellon
For more information, please contact BNY Mellon marketing desks:
New YorkBNYM-Buy-SideTanya [email protected] +1 212 815 2892
ADR Benefits to US Investors:ADRs give access to cross-border market liquidityADRs are cost-effectiveADRs are convenient to own:
Quoted in US dollars Dividends paid in US dollars
New YorkBNYM-Western EuropeMarianna [email protected] +1 212 815 3938
New YorkBNYM-Sell-SideMichael [email protected] +1 212 815 2213
U.S. Investor
Issuance Cancellation
--Buy Shares--
Issue DRs
Sell Shares Buy Shares
--Sell Shares --
U.S. Broker
Local Broker
U.S. Broker
Local Broker
Local Exchange
Local Custodian
The Bank of NY Mellon
U.S. Exchange
U.S. Investor
Local Investor
Local Investor
Cancel DRs--Buy DRs- --Sell DRs--
Deposit Shares
ReleaseShares
Confirm Deposit
Instruction to Release
LondonBNYM-Sell-SideMark [email protected] +44 207 964 6089
ADR Programme
39
Forward looking statementsThis document may contain certain forward-looking statements relating to Legal & General Group, its plans and its current goals and expectations relating to future financial condition, performance and results. By their nature forward-looking statements involve uncertainty because they relate to future events and circumstances which are beyond Legal & General’s control, including, among others, UK domestic and global economic and business conditions, market related risks such as fluctuations in interest rates and exchange rates, the policies and actions of regulatory and Governmental authorities, the impact of competition, the timing impact of these events and other uncertainties of future acquisition or combinations within relevant industries. As a result, Legal & General Group’s actual future condition, performance and results may differ materially from the plans, goals and expectations set out in these forward-looking statements and persons reading this announcement should not place reliance on forward-looking statements. These forward-looking statements are made only as at the date on which such statements are made and Legal & General Group Plc does not undertake to update forward-looking statements contained in this document or any other forward-looking statement it may make.