creating a service vision - apics service vision.pdf · creating a service vision aspirational case...
TRANSCRIPT

Creating a Service Vision Molly VandenHeuvel
Sr. Director Customer Value Stream
Kraft Foods

7 Brands with Annual Retail Sales Over $1bn
Kraft Overview
2 Source: Company filings and Nielsen.
98% Household Penetration in North America
#1 or #2 Position in 17 Top Categories (80% of Sales)
Products Average >2x the Share of the Nearest Branded Competitor

• Kraft has leading brands across 17 diverse core categories
Selected Kraft Brands Kraft Brand Development
Cheese (22% of Sales)
Meals & Desserts
(12% of Sales)
Refrigerated Meals
(19% of Sales)
Beverages (14% of Sales)
Enhancers & Snack Nuts
(11% of Sales)
Canada (11% of Sales)
Unmatched North America Brand Portfolio
Source: Company filings and Nielsen. Note: Foodservice and Exports together comprise 11% of Sales. 3
98% 10 43 or $107
% HouseholdPenetration
# Brands perHousehold
Purchases of KraftBrands per
Household (perYear)
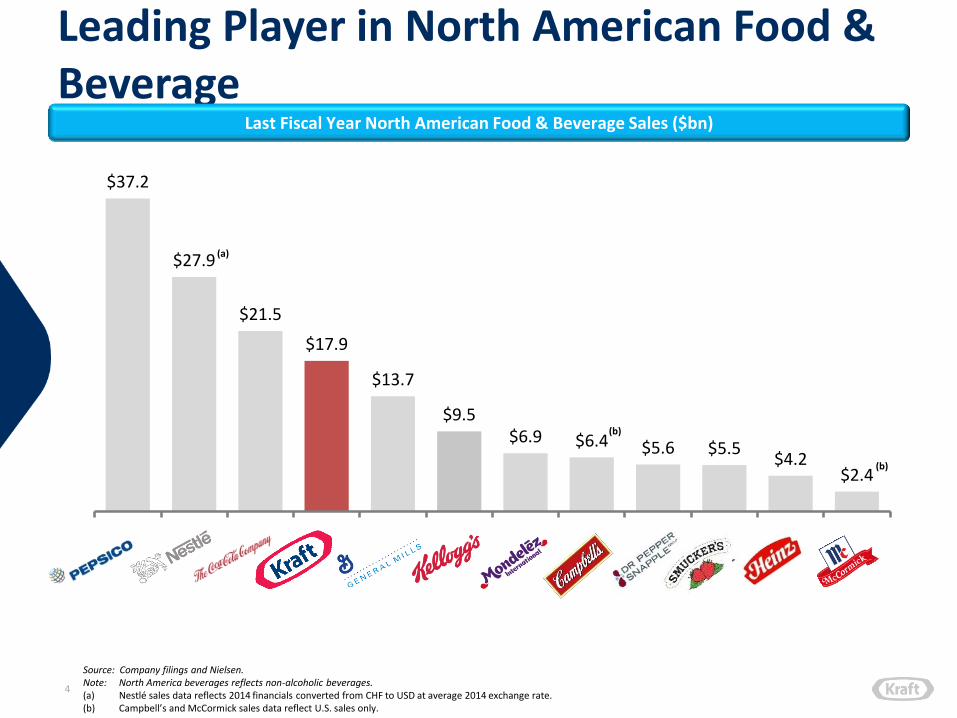
$37.2
$27.9
$21.5
$17.9
$13.7
$9.5 $6.9 $6.4 $5.6 $5.5
$4.2 $2.4
4
Source: Company filings and Nielsen. Note: North America beverages reflects non-alcoholic beverages. (a) Nestlé sales data reflects 2014 financials converted from CHF to USD at average 2014 exchange rate. (b) Campbell’s and McCormick sales data reflect U.S. sales only.
Leading Player in North American Food & Beverage
Last Fiscal Year North American Food & Beverage Sales ($bn)
(b)
(a)
(b)
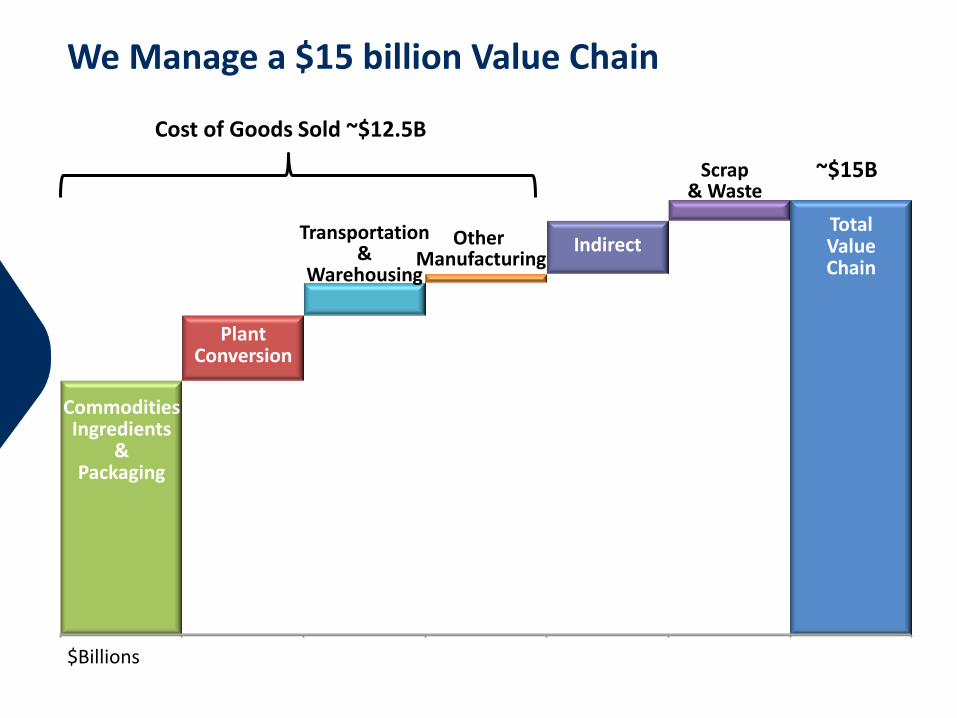
We Manage a $15 billion Value Chain
~$15B
Plant Conversion
Other Manufacturing
Indirect Transportation
& Warehousing
Commodities Ingredients
& Packaging
Scrap & Waste
Total Value Chain
$Billions
Cost of Goods Sold ~$12.5B

Win Together We’re one team wearing the same jersey … with Kraft on the front. We share the same competitive spirit. We win when the company performs. So share freely with, and steal shamelessly from, one another. Be individuals, yet remain indivisible.
Keep it Simple Make smart decisions quickly and move on. Do it well, once. Don’t let perfect be the enemy of good. Streamline cumbersome processes. Keep things loose and have fun.
Inspire Trust Be transparent, be open, be real. Listen hard, talk less. Combine honesty with empathy. Have each other’s backs. Make certain our actions match our words. When they don’t, say so. Always do the right thing – integrity matters.
Make Tough Choices We own the results. No one else, just us. Be candid and accountable. Prioritize resources well. Treat our money like it’s our very own. Make lean a competitive advantage.
The Values We Share

Creating a Service Vision Aspirational Case Study – Inditex / Zara
• Inditex – HQ in Spain
– Largest global clothing retailer with over 6,200 stores worldwide
– Stock + 450% over 10 years; Net Income ~2X in 5 years
• Zara – Inditex subsidiary
– 1,770 stores in 86 countries
– Supply Chain as strategic advantage and fuel for growth
• Zara Video

Aspirational Case Study – Inditex / Zara
• Critical differentiators – Constant change in part of the model vs. disruptor
– Original supply / order to forecast • Zara = ~50% Competitors = ~80%
– Local production cost offset by higher revenue % and lower unsold merchandise
• % of Full Revenue: Zara = ~85% Competitors = ~60%
• % Unsold: Zara = <10% Competitors = ~20%
– Zara Video
– Audience Observations

Aspirational Case Study – Inditex / Zara
• What does Zara have to do with CPG?
– Waste associated with aged inventory, packaging conversions, etc…
– Excess inventory associated with inaccurate forecasts
– Inventory discounted or donated due to age / shelf life
– Constant innovation and complex Product Lifecycle Management
• Similarities with your businesses?

Setting the Service Vision
Gather Input from Internal and External Key Stakeholders
Customer Interviews
Kraft Leadership Team Interviews:
Chief Operating Officer Chief Customer Officer
Chief Supply Chain Officer Division Presidents
Customer Service & Logistics Team on-line survey:
~350 respondents:
– 13 questions + 1 for general feedback
– 69% in CS&L >5 years
– 81% at Kraft >5 years
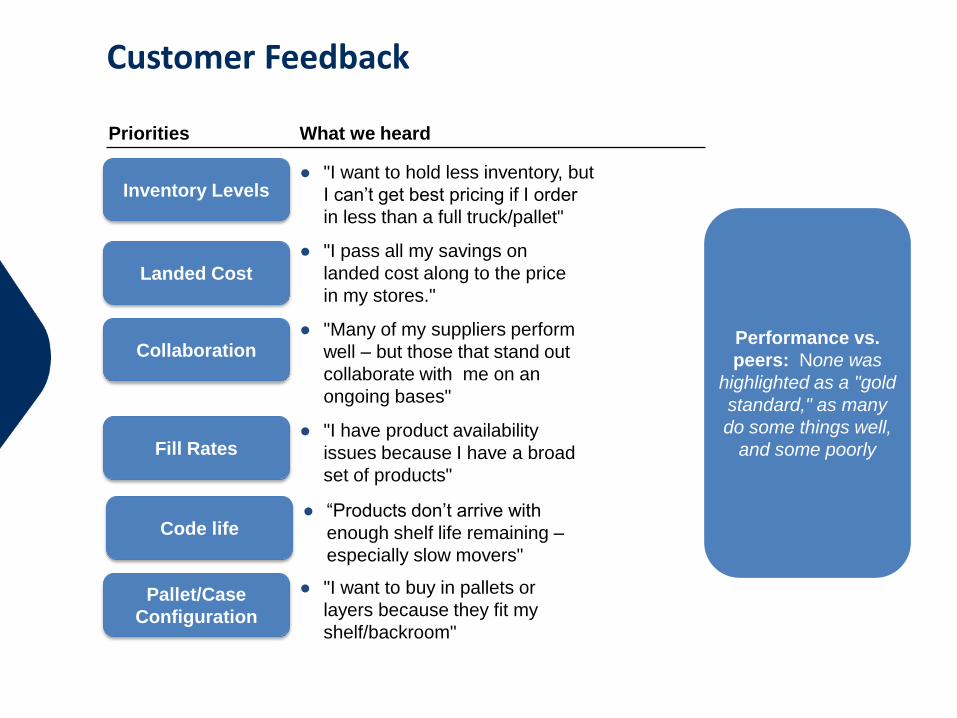
Customer Feedback
Priorities What we heard
Performance vs.
peers: None was
highlighted as a "gold
standard," as many
do some things well,
and some poorly
● "I want to buy in pallets or
layers because they fit my
shelf/backroom"
Pallet/Case
Configuration
● "I pass all my savings on
landed cost along to the price
in my stores."
Landed Cost
● "I want to hold less inventory, but
I can’t get best pricing if I order
in less than a full truck/pallet"
Inventory Levels
● "I have product availability
issues because I have a broad
set of products"
Fill Rates
● “Products don’t arrive with
enough shelf life remaining –
especially slow movers"
Code life
● "Many of my suppliers perform
well – but those that stand out
collaborate with me on an
ongoing bases"
Collaboration

Kraft Leadership Team Interview Feedback
Role and Purpose of Customer Service & Logistics:
End-to-End, seamless, continuous flow of demand and supply
Perfect orders to our customers
Effective, efficient, preferred supplier
Enable cost and cash
Ideal Vision for Customer Service & Logistics: Customer-facing resources have a toolbox that enables development of
customer-specific programs Best-in-class cost and service By taking time out of the supply chain, enable speed to market as a competitive
advantage Faster Route-to-Market enables freshness
Desired Behaviors from Customer Service & Logistics: Envisioning: Inspire the team AND internal and external customers Enabling: Build capability Execution: Daily, weekly and monthly

Customer Service & Logistics Team Member Feedback
What are you most proud of?
People Working as a team Leadership Customer Service (internally and externally) Delivering results
What do you see as CS&L’s strengths?
People Leadership Technical mastery within the members of the team Teamwork Customer Service
What do you see as CS&L’s opportunities?
On boarding, training and development systems Better communication, both internally and externally Integration with the Divisions Streamlining and simplification Clarity of goals and vision

Customer Service & Logistics Team Member Feedback
How do you think CS&L should be leveraged to maximize Kraft’s business results? Partnering with the Divisions to maximize gains in productivity and simplification Strong linkage with sales and commercial disciplines to deliver winning customer
solutions Laser focus on delivering cash and service improvements Leverage systems and optimized business processes Involve CS&L early into project feasibility calculations to maximize return on
investment
What behaviors do you want to see in the future?
Aligned objectives/one team Clear accountabilities Openness/trust Positive attitude/esprit de corps Effective communications (two-way) Learning, coaching, development Collaboration Servant leadership

Creating exceptional speed, value and growth through integrated partnerships from farm to family
REDUCING CYCLE TIME TO IMPROVE CASH FLOW, COST PROFILE AND FRESHNESS
RIGHT PRODUCT, PLACE, TIME, QUANTITY, QUALITY, PRICE
EMERGING ROUTES TO MARKET
SPEED VALUE GROWTH
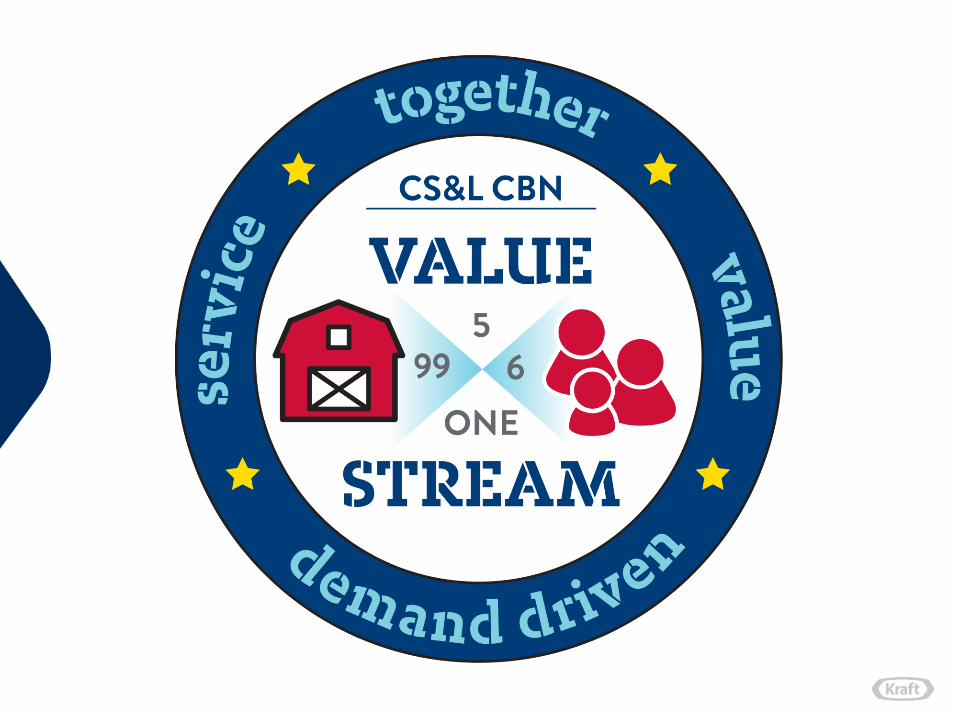
Customer Service & Logistics Vision

99+% Service Level
6% Productivity
CS&L
5 DIOH
One team (integrated
partnerships)

Bringing it to Life and Driving Business Outcomes
Leverage the Organization Performance Model (OPM)* to Achieve Required Outcomes
Establish Clear Business
Goals and Communicate Broadly & Frequently
Cascade Goals to Every Team Member
*Task, Information, Decision Making, People, Structure, Rewards

Deliver Service to Drive Top Line Growth
Deliver Fuel for Growth
Drive Cash Conversion Cycle
Drive Supply Chain Fundamentals
Business & Culture Transformation
People Strategies & Talent Development
Strategic Priorities
Key Objectives
● Deliver service to drive top-line growth:
− Improve customer In Stocks, migrate towards On Shelf Availability − Fill rate improvement − Improve on-time delivery
● Deliver fuel for growth:
− Build productivity pipeline to 120% of target − Deliver net productivity target − Drive focus and process metrics to consistently limit waste − Drive overhead cost accountability
● Drive Cash Conversion Cycle: − Deliver AR objective − Deliver Inventory objectives while delivering service
● Drive Supply Chain fundamentals:
− Strict compliance with traceability and recall − Optimize Route to Market while balancing service − Improve inventory accuracy − Optimize Module/Shipper execution
● Business and culture transformation: − Implement Systems / Business Process improvements flawlessly − VSMs and Loss Analysis as way of working − Evolve supplier integration
● People strategies and talent development: − Drive a high performing & ownership culture − Build employee capabilities − Build talent pipeline and succession planning − Drive organization effectiveness & employee engagement

CS&L GOAL-SETTING - 2015
Strategic Priorities Specific Goal Metric/Target Key personal milestone to support the goal
Deliver Service to Drive Top Line Growth
Deliver Fuel for Growth
Drive Cash Conversion Cycle
Drive Supply Chain Fundamentals
Business & Culture Transformation
People Strategies & Talen Development
Write down one* goal and metric for each strategic priority that you will personally help deliver from the 2015 CSL Goals document
* Intended to be a simple first step in developing individual and team goals for 2015.