creating service desk metrics
TRANSCRIPT
Creating Service Desk Metrics
Creating Service Desk Metrics | Zendesk 2
Table of Contents
1 ITIL, PINK ELEPHANT AND ZENDESK ............................................................................................... 3
2 IMPORTANCE OF MONITORING, MEASURING AND REPORTING ...................................................... 3
2.1 BALANCED MANAGEMENT INFORMATION CATEGORIES ................................................................................... 3 2.2 CSFS, KPIS, AND ACTIVITY METRICS ............................................................................................................ 4
2.2.1 Key Performance Indicators ................................................................................................................ 5 2.3 STEPS FOR CREATING A MEASUREMENT FRAMEWORK .................................................................................. 7 2.4 METRICS SHOULD DRIVE THE RIGHT BEHAVIOR ............................................................................................ 8
3 APPENDIX ......................................................................................................................................... 10
3.1 SERVICE DESK AND PROCESS METRICS ...................................................................................................... 10 3.2 TELEPHONY METRICS ................................................................................................................................. 12
Creating Service Desk Metrics | Zendesk 3
1 ITIL, Pink Elephant and Zendesk ITIL® (Information Technology Infrastructure Library) is the most widely adopted framework for IT Service Management in the world. Used by many hundreds of organizations around the world, a whole ITIL philosophy has grown up around the guidance contained within the ITIL books and the supporting professional qualification scheme. ITIL Best Practices also underpin the foundations of ISO/IEC 20000 (previously BS15000), the International Service Management Standard for organizational certification and compliance. Organizations can therefore implement ITIL principles in order to meet the requirements within the standards, to achieve organizational certification. Zendesk facilitates ITIL best practices by helping IT organizations track and measure issue resolution through its native analytics dashboard and enhanced GoodData-powered business intelligence platform.
2 Importance of Monitoring, Measuring and Reporting We have all heard the saying, “You can’t manage what you don’t measure.” Measurement and verification is often perceived as an overhead or a nice-to-have activity - something we will eventually get to once the important work is done. For people who are stressed and over-worked, sustaining a best effort often slides downhill into doing the easiest thing. Service Desks metrics span external factors such as impact on customer goals and satisfaction, and internal factors like goals, critical success factors and key performance indicators for people, process and technology. Even though Service Desks are often under stress and it’s easy to look over measurement importance, it’s critical to remember that measurement is the essential ingredient for feedback, which drives service state awareness, accountability and improvement to influence management action.
2.1 Balanced Management Information Categories Timely, accurate, and reliable Management Information is a critical success factor for the management and control of the Service Desk. The Service Desk, which can be an internal IT help desk or customer service division, needs to measure each of the following areas:
1. People 2. Process 3. Products/Technology 4. Partners 5. Performance
Creating Service Desk Metrics | Zendesk 4
In fact the first four areas are referenced in the IT Infrastructure Library (ITIL®) best practice library as the 4 P’s of value generation and form the building blocks for ensuring customer satisfaction. We prefer to think in terms of the 5P’s.
The 5Ps all play an important part in Service Desk measurement. Ultimately Customer Satisfaction is achieved by managing all of these areas.
• People – tasks, roles, and responsibilities (for Service Desk Manager and
Analysts, Reporting Analysts, 2nd and 3rd level support groups) defined and assigned to specific personnel. From a metrics perspective, service desk skills are defined and measured to ensure the right people are in the correct roles.
• Processes – such as Incident Management and Request Fulfillment define the
core day-to-day activities of Service Desk personnel. The maturity of the processes and consistency of execution are key contributors of Service Desk performance.
• Products – technical tools that the Service Desk uses such as Zendesk.
Zendesk provides ticket and knowledge management, self-help options, portal message routing and queuing, as well as a number of integration options with telephony systems and call bridges, e-mail and status broadcast systems, remote control tools, and more. Zendesk generates analytics and reporting for a number of areas in the 5 P’s.
• Partners – internal and external suppliers that your organization relies on to
run or staff the Service Desk, or to handle incidents and to provision requests that are dispatched and managed by the Service Desk. The timeliness and quality of partner services provided to the Service Desk processes are critical for establishing and meeting service agreements.
• Performance – the value provided by the Service Desk to the organization.
Standards for timeliness, cost, and customer satisfaction all ground the Service Desk relationship with its customers, and the management of the Service Desk as an important function in the organization.
2.2 CSFs, KPIs, and Activity Metrics Critical Success Factors (CSFs), Key Performance Indicators (KPIs) and Activity Metrics are common measurement terms used when setting up a measurement framework. It is important to understand the definition of each and how they relate to each other when establishing a measurement system. Critical Success Factors
Creating Service Desk Metrics | Zendesk 5
At the highest level of a measurement system are the critical success factors (CSFs). A CSF is something that needs to be met or true to achieve your goals. A Process CSF would be that Service Desk Agents have a defined process that consistently determines the urgency and impact of a customer issue. For example, when new requests come in, there should be a process in place to assign the request to the correct person or group of people, who should then have the knowledge or access to knowledge on how to resolve the request as quickly as possible. Other Service Desk CSFs would include:
• People: Agents have adequate knowledge of the IT services, technology and organizations they support
• Product: The ticketing system includes workflows to enable queue management and escalation procedures.
• Partner: Operational Level Agreements exist for technical and application infrastructure areas to ensure incident resolution intervals for 2nd level technical and application support teams.
• Performance: Service Desk staff are aware of key performance indicators for their roles.
Without these critical success factors and others like them in place the achievement of your customer services goals are at risk.
2.2.1 Key Performance Indicators Key Performance Indicators are “chosen“ metrics that measure actual performance to determine the state of Critical Success Factors. They indicate the health of the Service Desk and its components. For example: 80% of Priority 1 Incidents are resolved within 4 hours. Below are some example KPIs for a Service Desk. The numbers are examples only and each Service Desk will need to define their own KPIs based on organizational goals and objectives.
• KPI: First call resolution is at or above 75% • KPI: Call abandon rate is maintained at or below 10% • KPI: All Severity 1 incident notifications are responded to by 2nd level support
within 10 minutes The set of KPIs for an area should measure the following 4 vectors to ensure a solid understanding of the Service Desk performance.
Creating Service Desk Metrics | Zendesk 6
• Quantity – A measure that focuses on output. Example: Calls answered, incidents resolved or assigned, requests completed or assigned per shift/day/week/month
• Quality – A quality measure focuses on the correctness or accuracy. Example: Notes in logs accurately reflect the history of incidents and requests. 97% of 2nd level ticket work queue assignments are correct.
• Timeliness – A time-based measure. Examples: 80% of Severity 1 Incidents are resolved within 4 hours. 2nd Level acknowledges and responds to Severity 1 incidents assigned to their support queues within 10 minutes of notifications being sent.
• Compliance – Measures that inform controls and governance. Failure to meet compliance KPIs casts doubt on other measures. (Example: 100% of password reset requests include execution and logging of authentication procedures.)
Ensure you have a full picture of the health and welfare of your Service Desk. Unless KPIs cover all of the four categories of Service Desk management the information provided may not adequately support decision-making and improvement. Quantity Based Activity Measures Quantity measures are important because they provide knowledge on the production of the Service Desk. Activity metrics require historical perspective and correlation with external information to inform Service Desk management, capacity and resource planning. Common incident/request management activity metrics include the following in a common interval (workday, week, month)
• Number of new incidents/requests logged • Number of incidents/requests by priority • Number of incidents/requests by category • Number of incidents/requests by priority and organization unit affected • Number of incidents/requests resolved/fulfilled by the Service Desk on first
contact • Number of incidents/requests assigned to 2nd level teams • Number of incidents/requests resolved/fulfilled by 2nd level teams • Number of incidents resolved by 3rd level teams • Number of incidents/requests closed • Average age incidents/requests at closure by category • Number of open incidents/requests • Average age of open incidents/requests • Number of errors in incident prioritization, categorization, assignment and
closure
Creating Service Desk Metrics | Zendesk 7
It is easy to get caught up in the trap of trying to measure and report on too many quantity based activity metrics, so each measure chosen should support one or more of the 4 KPI categories (quantity, quality, timeliness and compliance), which in turn support the CSFs. When starting to collect management information the saying “less is more” often holds true. Start small and grow the span of your metrics over time. The key is to ensure that there is agreement on what is important to be measured and reported, and that management is receiving reliable and actionable information.
2.3 Steps for Creating a Measurement Framework Creating a measurement framework is a series of dependent actions and decisions.
• Step 1: Understand customer expectation and service requirements • Step 2: Define the Critical Success Factors of the Service Desk 5Ps you are
measuring • Step 3: Choose the KPI Category you are measuring (Quantity, Quality,
Timeliness, Compliance) • Step 4: Define the KPI • Step 5: Define the KPI target or success criteria • Step 6: Determine the data source and instrumentation to obtain and collect KPI
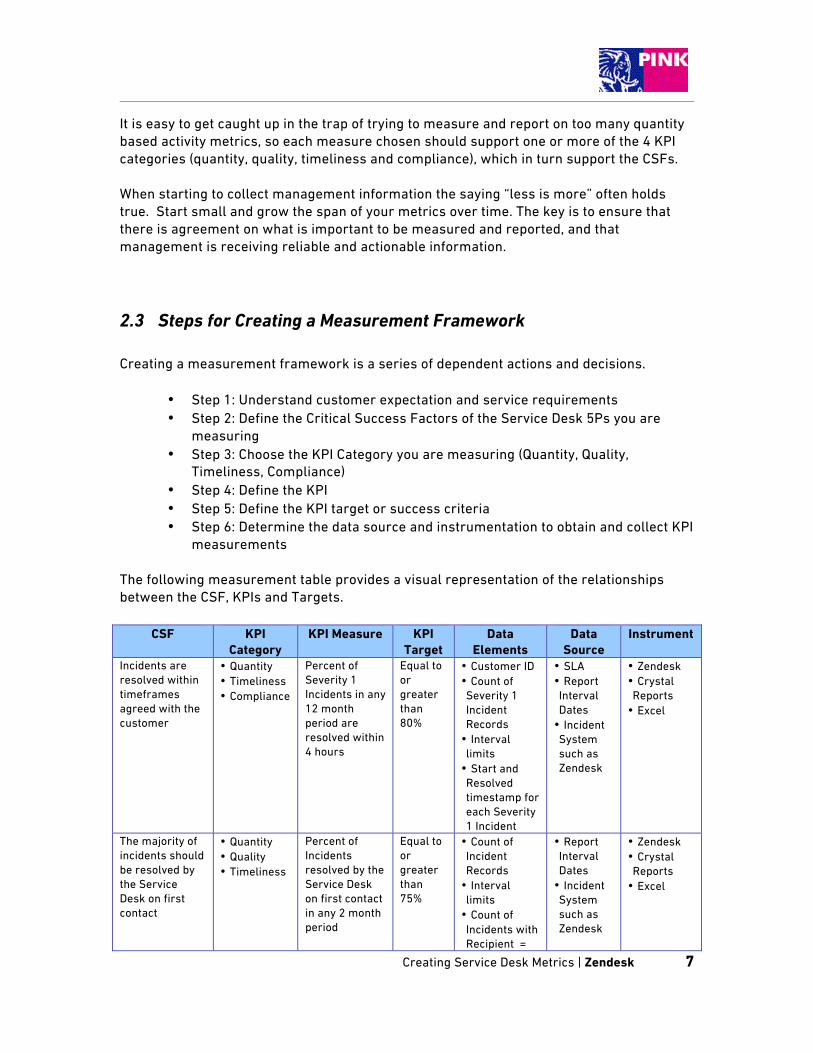
measurements The following measurement table provides a visual representation of the relationships between the CSF, KPIs and Targets.
CSF KPI Category
KPI Measure KPI Target
Data Elements
Data Source
Instrument
Incidents are resolved within timeframes agreed with the customer
• Quantity • Timeliness • Compliance
Percent of Severity 1 Incidents in any 12 month period are resolved within 4 hours
Equal to or greater than 80%
• Customer ID • Count of Severity 1 Incident Records • Interval limits • Start and Resolved timestamp for each Severity 1 Incident
• SLA • Report Interval Dates • Incident System such as Zendesk
• Zendesk • Crystal Reports • Excel
The majority of incidents should be resolved by the Service Desk on first contact
• Quantity • Quality • Timeliness
Percent of Incidents resolved by the Service Desk on first contact in any 2 month period
Equal to or greater than 75%
• Count of Incident Records • Interval limits • Count of Incidents with Recipient =
• Report Interval Dates • Incident System such as Zendesk
• Zendesk • Crystal Reports • Excel
Creating Service Desk Metrics | Zendesk 8
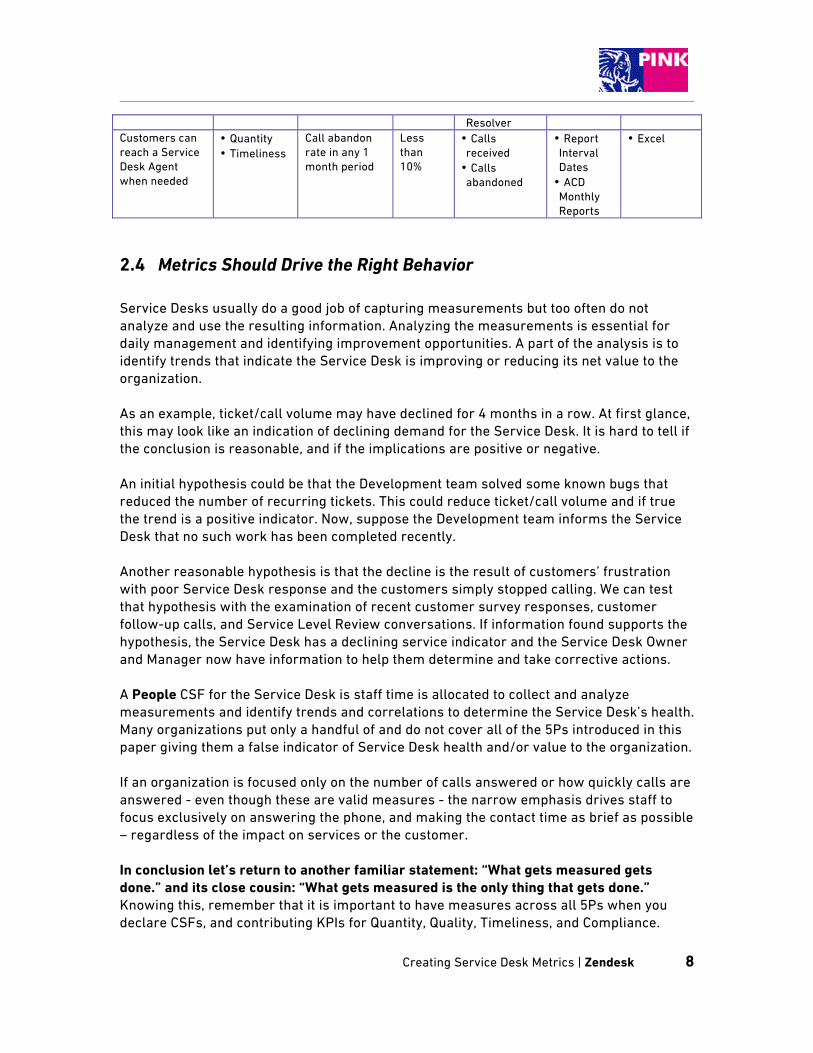
Resolver Customers can reach a Service Desk Agent when needed
• Quantity • Timeliness
Call abandon rate in any 1 month period
Less than 10%
• Calls received • Calls abandoned
• Report Interval Dates • ACD Monthly Reports
• Excel
2.4 Metrics Should Drive the Right Behavior Service Desks usually do a good job of capturing measurements but too often do not analyze and use the resulting information. Analyzing the measurements is essential for daily management and identifying improvement opportunities. A part of the analysis is to identify trends that indicate the Service Desk is improving or reducing its net value to the organization. As an example, ticket/call volume may have declined for 4 months in a row. At first glance, this may look like an indication of declining demand for the Service Desk. It is hard to tell if the conclusion is reasonable, and if the implications are positive or negative. An initial hypothesis could be that the Development team solved some known bugs that reduced the number of recurring tickets. This could reduce ticket/call volume and if true the trend is a positive indicator. Now, suppose the Development team informs the Service Desk that no such work has been completed recently. Another reasonable hypothesis is that the decline is the result of customers’ frustration with poor Service Desk response and the customers simply stopped calling. We can test that hypothesis with the examination of recent customer survey responses, customer follow-up calls, and Service Level Review conversations. If information found supports the hypothesis, the Service Desk has a declining service indicator and the Service Desk Owner and Manager now have information to help them determine and take corrective actions. A People CSF for the Service Desk is staff time is allocated to collect and analyze measurements and identify trends and correlations to determine the Service Desk’s health. Many organizations put only a handful of and do not cover all of the 5Ps introduced in this paper giving them a false indicator of Service Desk health and/or value to the organization. If an organization is focused only on the number of calls answered or how quickly calls are answered - even though these are valid measures - the narrow emphasis drives staff to focus exclusively on answering the phone, and making the contact time as brief as possible – regardless of the impact on services or the customer. In conclusion let’s return to another familiar statement: “What gets measured gets done.” and its close cousin: “What gets measured is the only thing that gets done.” Knowing this, remember that it is important to have measures across all 5Ps when you declare CSFs, and contributing KPIs for Quantity, Quality, Timeliness, and Compliance.
Creating Service Desk Metrics | Zendesk 9
About Zendesk Zendesk is web-based customer support software used by over 10,000 companies for both internal IT service desk requirements as well as external customer service. Zendesk was developed using many ITIL best practices. This white paper outlines a framework for creating support metrics that speaks to ITIL standards specifically. About Pink Elephant Pink Elephant is proud to be celebrating 20 years of ITIL® experience. Pink Elephant is the world’s #1 supplier of ITIL and ITSM conferences, education and consulting services. To date, close to 200,000 IT professionals have benefited from Pink Elephant’s expertise. Pink Elephant has been championing the growth of ITIL worldwide since its inception in 1989 – longer than any other supplier – and was selected as an international expert to contribute to the ITIL V3 project – as authors of V3’s Continual Service Improvement book and through representation on the International Exam Panel.
Creating Service Desk Metrics | Zendesk 10
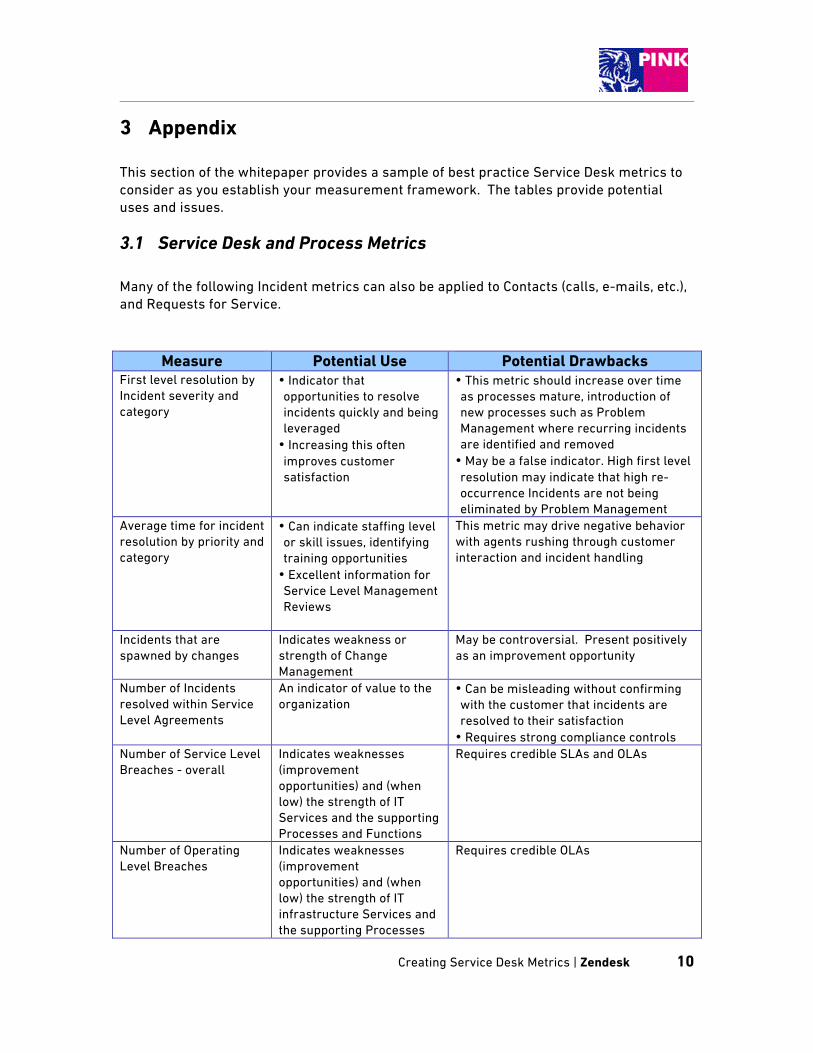
3 Appendix This section of the whitepaper provides a sample of best practice Service Desk metrics to consider as you establish your measurement framework. The tables provide potential uses and issues.
3.1 Service Desk and Process Metrics Many of the following Incident metrics can also be applied to Contacts (calls, e-mails, etc.), and Requests for Service.
Measure Potential Use Potential Drawbacks First level resolution by Incident severity and category
• Indicator that opportunities to resolve incidents quickly and being leveraged • Increasing this often improves customer satisfaction
• This metric should increase over time as processes mature, introduction of new processes such as Problem Management where recurring incidents are identified and removed • May be a false indicator. High first level resolution may indicate that high re-occurrence Incidents are not being eliminated by Problem Management
Average time for incident resolution by priority and category
• Can indicate staffing level or skill issues, identifying training opportunities • Excellent information for Service Level Management Reviews
This metric may drive negative behavior with agents rushing through customer interaction and incident handling
Incidents that are spawned by changes
Indicates weakness or strength of Change Management
May be controversial. Present positively as an improvement opportunity
Number of Incidents resolved within Service Level Agreements
An indicator of value to the organization
• Can be misleading without confirming with the customer that incidents are resolved to their satisfaction • Requires strong compliance controls
Number of Service Level Breaches - overall
Indicates weaknesses (improvement opportunities) and (when low) the strength of IT Services and the supporting Processes and Functions
Requires credible SLAs and OLAs
Number of Operating Level Breaches
Indicates weaknesses (improvement opportunities) and (when low) the strength of IT infrastructure Services and the supporting Processes
Requires credible OLAs
Creating Service Desk Metrics | Zendesk 11
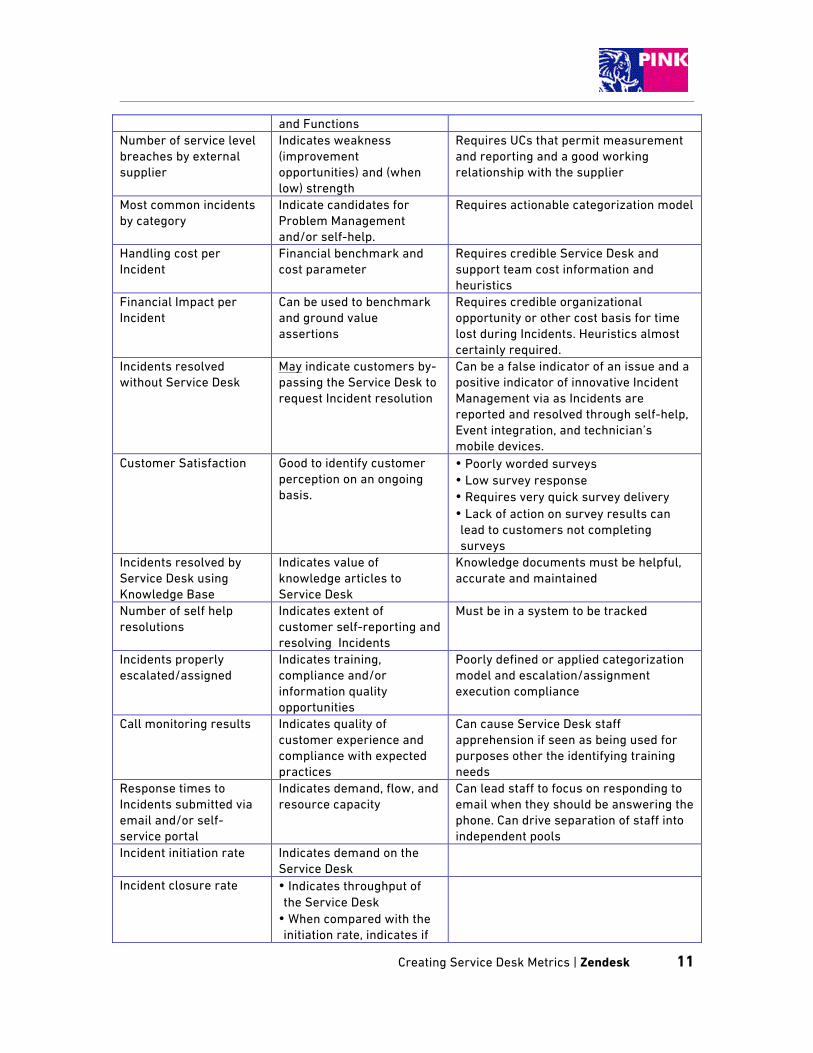
and Functions Number of service level breaches by external supplier
Indicates weakness (improvement opportunities) and (when low) strength
Requires UCs that permit measurement and reporting and a good working relationship with the supplier
Most common incidents by category
Indicate candidates for Problem Management and/or self-help.
Requires actionable categorization model
Handling cost per Incident
Financial benchmark and cost parameter
Requires credible Service Desk and support team cost information and heuristics
Financial Impact per Incident
Can be used to benchmark and ground value assertions
Requires credible organizational opportunity or other cost basis for time lost during Incidents. Heuristics almost certainly required.
Incidents resolved without Service Desk
May indicate customers by-passing the Service Desk to request Incident resolution
Can be a false indicator of an issue and a positive indicator of innovative Incident Management via as Incidents are reported and resolved through self-help, Event integration, and technician’s mobile devices.
Customer Satisfaction Good to identify customer perception on an ongoing basis.
• Poorly worded surveys • Low survey response • Requires very quick survey delivery • Lack of action on survey results can lead to customers not completing surveys
Incidents resolved by Service Desk using Knowledge Base
Indicates value of knowledge articles to Service Desk
Knowledge documents must be helpful, accurate and maintained
Number of self help resolutions
Indicates extent of customer self-reporting and resolving Incidents
Must be in a system to be tracked
Incidents properly escalated/assigned
Indicates training, compliance and/or information quality opportunities
Poorly defined or applied categorization model and escalation/assignment execution compliance
Call monitoring results Indicates quality of customer experience and compliance with expected practices
Can cause Service Desk staff apprehension if seen as being used for purposes other the identifying training needs
Response times to Incidents submitted via email and/or self-service portal
Indicates demand, flow, and resource capacity
Can lead staff to focus on responding to email when they should be answering the phone. Can drive separation of staff into independent pools
Incident initiation rate Indicates demand on the Service Desk
Incident closure rate • Indicates throughput of the Service Desk • When compared with the initiation rate, indicates if
Creating Service Desk Metrics | Zendesk 12
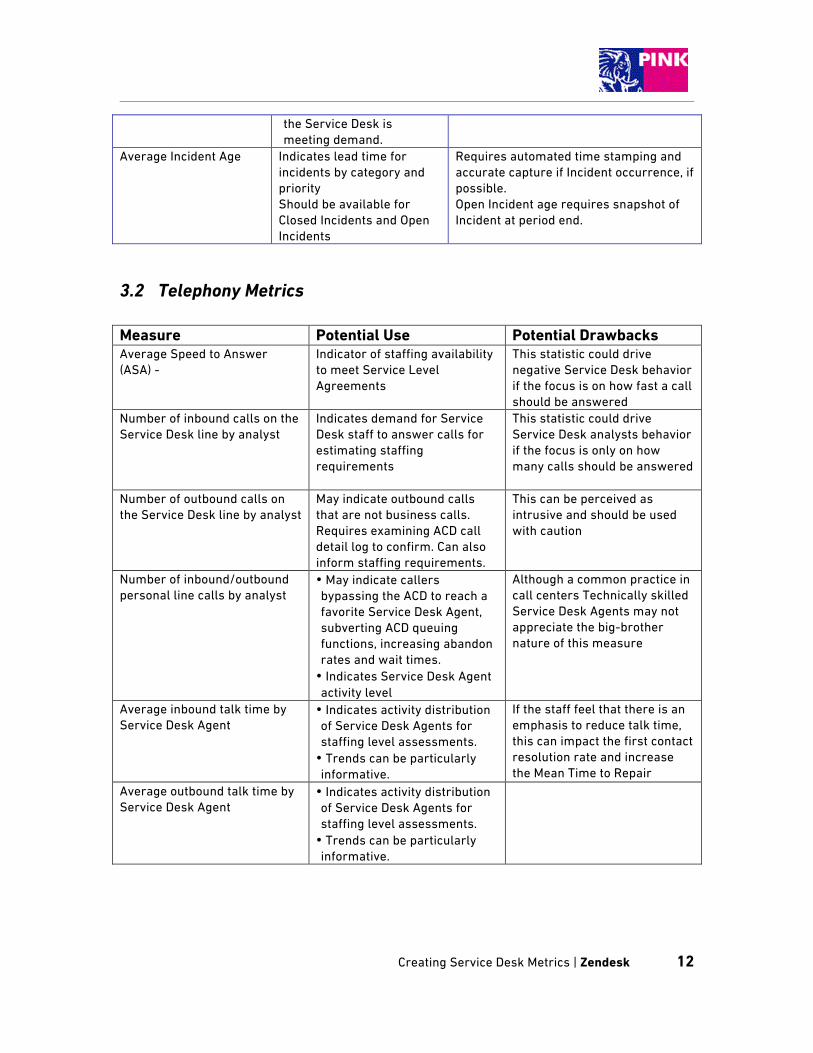
the Service Desk is meeting demand.
Average Incident Age Indicates lead time for incidents by category and priority Should be available for Closed Incidents and Open Incidents
Requires automated time stamping and accurate capture if Incident occurrence, if possible. Open Incident age requires snapshot of Incident at period end.
3.2 Telephony Metrics Measure Potential Use Potential Drawbacks Average Speed to Answer (ASA) -
Indicator of staffing availability to meet Service Level Agreements
This statistic could drive negative Service Desk behavior if the focus is on how fast a call should be answered
Number of inbound calls on the Service Desk line by analyst
Indicates demand for Service Desk staff to answer calls for estimating staffing requirements
This statistic could drive Service Desk analysts behavior if the focus is only on how many calls should be answered
Number of outbound calls on the Service Desk line by analyst
May indicate outbound calls that are not business calls. Requires examining ACD call detail log to confirm. Can also inform staffing requirements.
This can be perceived as intrusive and should be used with caution
Number of inbound/outbound personal line calls by analyst
• May indicate callers bypassing the ACD to reach a favorite Service Desk Agent, subverting ACD queuing functions, increasing abandon rates and wait times. • Indicates Service Desk Agent activity level
Although a common practice in call centers Technically skilled Service Desk Agents may not appreciate the big-brother nature of this measure
Average inbound talk time by Service Desk Agent
• Indicates activity distribution of Service Desk Agents for staffing level assessments. • Trends can be particularly informative.
If the staff feel that there is an emphasis to reduce talk time, this can impact the first contact resolution rate and increase the Mean Time to Repair
Average outbound talk time by Service Desk Agent
• Indicates activity distribution of Service Desk Agents for staffing level assessments. • Trends can be particularly informative.
Creating Service Desk Metrics | Zendesk 13
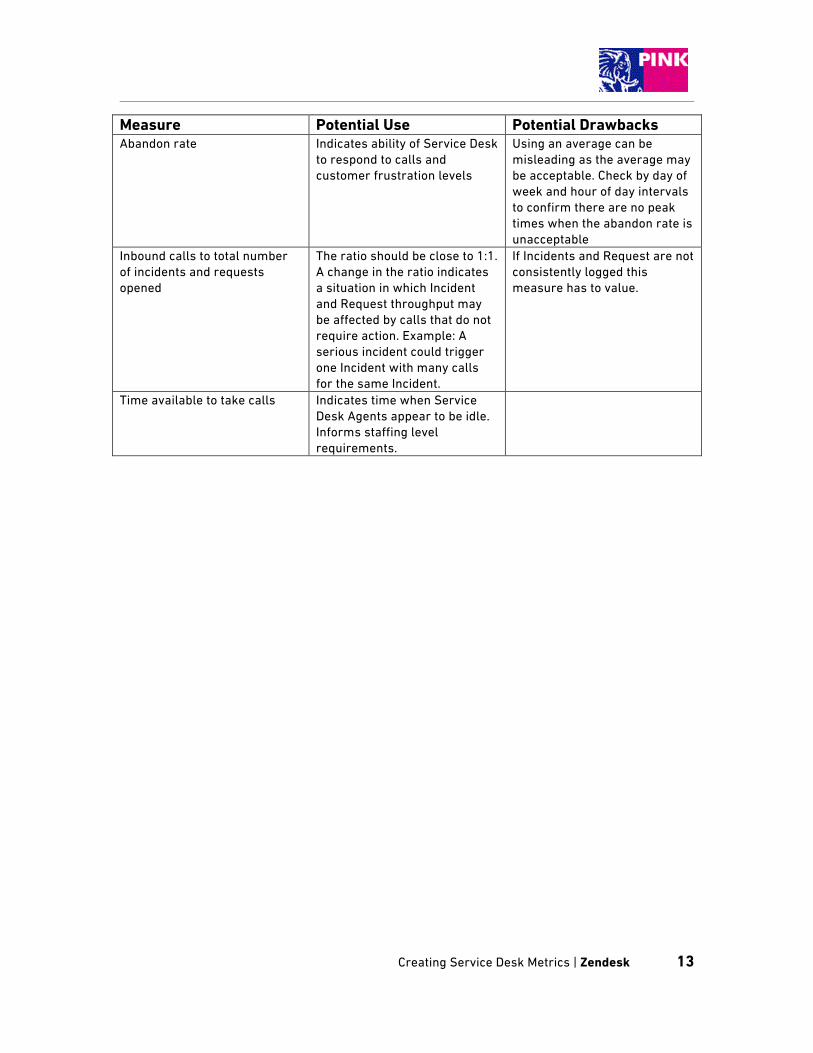
Measure Potential Use Potential Drawbacks Abandon rate Indicates ability of Service Desk
to respond to calls and customer frustration levels
Using an average can be misleading as the average may be acceptable. Check by day of week and hour of day intervals to confirm there are no peak times when the abandon rate is unacceptable
Inbound calls to total number of incidents and requests opened
The ratio should be close to 1:1. A change in the ratio indicates a situation in which Incident and Request throughput may be affected by calls that do not require action. Example: A serious incident could trigger one Incident with many calls for the same Incident.
If Incidents and Request are not consistently logged this measure has to value.
Time available to take calls Indicates time when Service Desk Agents appear to be idle. Informs staffing level requirements.