create pivot tables using excel 2008 v1f 1 by milo schield member: international statistical...
TRANSCRIPT

Create Pivot Tables using Excel 2008 V1F 1
byMilo Schield
Member: International Statistical InstituteUS Rep: International Statistical Literacy ProjectDirector, W. M. Keck Statistical Literacy Project
Slides and Demo output at: www.StatLit.org/pdf/Create-Pivot-Tables-Excel-2008-6up.pdf
pdf/Create-Pivot-Tables-using-Excel-Demo.pdf
Creating Pivot TablesUsing Excel 2008, 2010 or 2013

Create Pivot Tables using Excel 2008 V1F 2
A: Open/Download Data File;Press ‘Enable Editing’ button
Excel data at:www.statlit.org/XLS/Create-Pivot-Tables-using-Excel-Data.xls
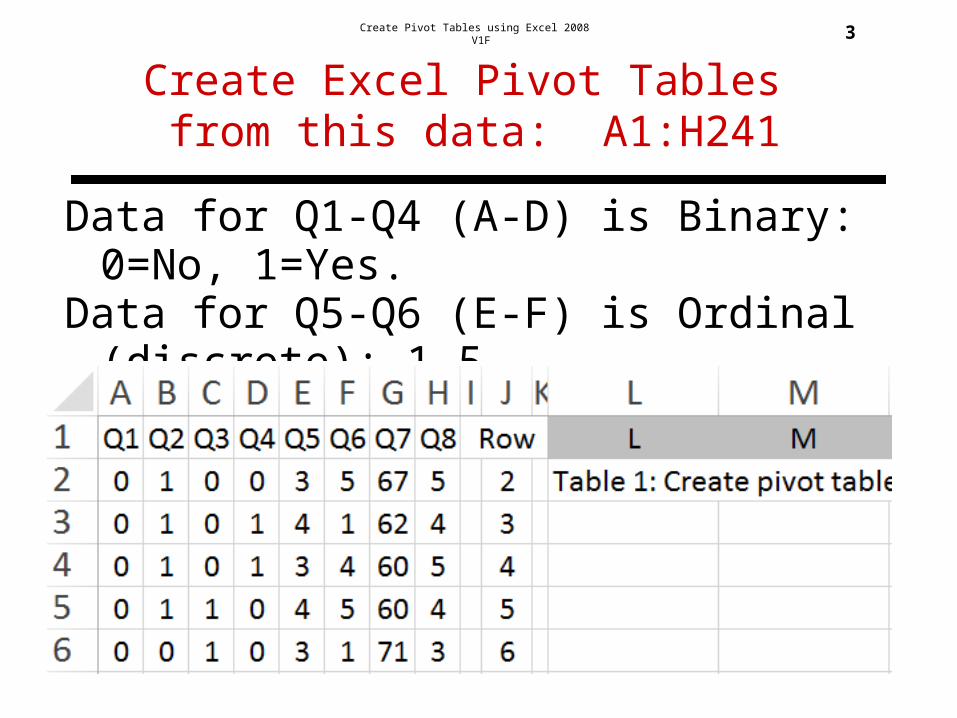
Create Pivot Tables using Excel 2008 V1F 3
Create Excel Pivot Tables from this data: A1:H241
Data for Q1-Q4 (A-D) is Binary: 0=No, 1=Yes.Data for Q5-Q6 (E-F) is Ordinal (discrete): 1-5. Data for Q7-Q8 (G-H) is Quantitative (ratio).

Create Pivot Tables using Excel 2008 V1F 4
B: From the Insert ribbon,Select “Pivot Table”
.

Create Pivot Tables using Excel 2008 V1F 5
C: In Wizard, Select ‘Table/Range’ and ‘Location’
.

Create Pivot Tables using Excel 2008 V1F 6
D: Table Layout shows Field List
.
Create Pivot Tables using Excel 2008 V1F 7
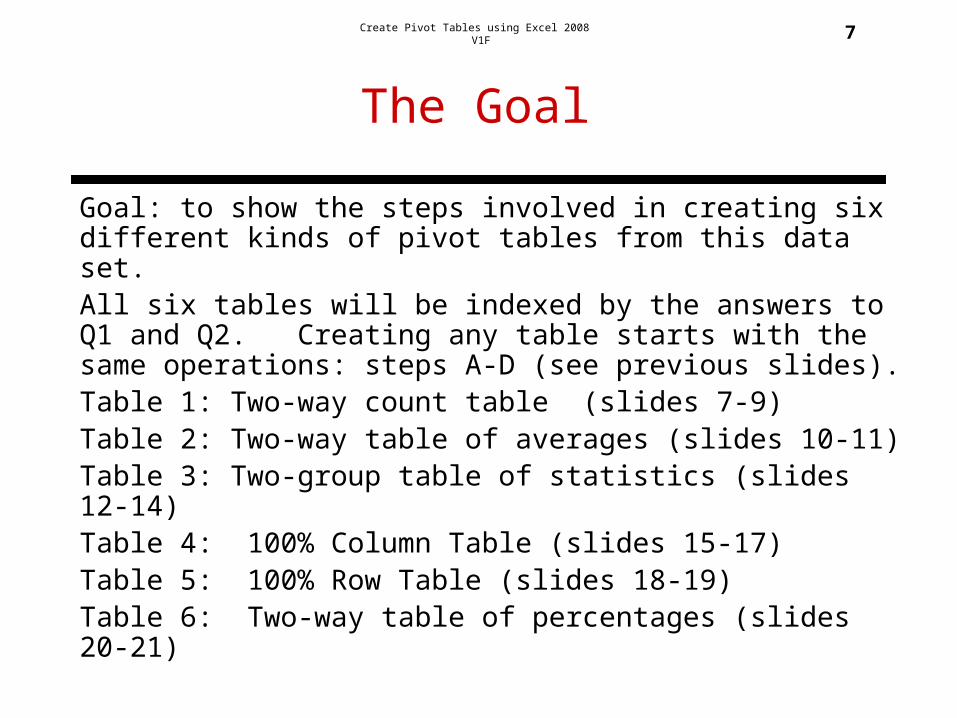
The Goal
Goal: to show the steps involved in creating six different kinds of pivot tables from this data set. All six tables will be indexed by the answers to Q1 and Q2. Creating any table starts with the same operations: steps A-D (see previous slides).Table 1: Two-way count table (slides 7-9)Table 2: Two-way table of averages (slides 10-11)Table 3: Two-group table of statistics (slides 12-14)Table 4: 100% Column Table (slides 15-17)Table 5: 100% Row Table (slides 18-19)Table 6: Two-way table of percentages (slides 20-21)

Create Pivot Tables using Excel 2008 V1F 8
1: Create Table of Counts:Index by Q1 & Q2
Table 1
Any field in the dataset can be used in the body. 32 subjects answer “yes” to Q1 and Q2.
No
Yes
YesNo

Create Pivot Tables using Excel 2008 V1F 9
1a: Use Q1 for Rows, Q2 for Columns, Q1 for Values
. Drag required fields to the table layout (left side) OR to the boxes (below).

Create Pivot Tables using Excel 2008 V1F 10
1b: Right-mouse on DataChange “Sum” to “Count”
.
Create Pivot Tables using Excel 2008 V1F 11
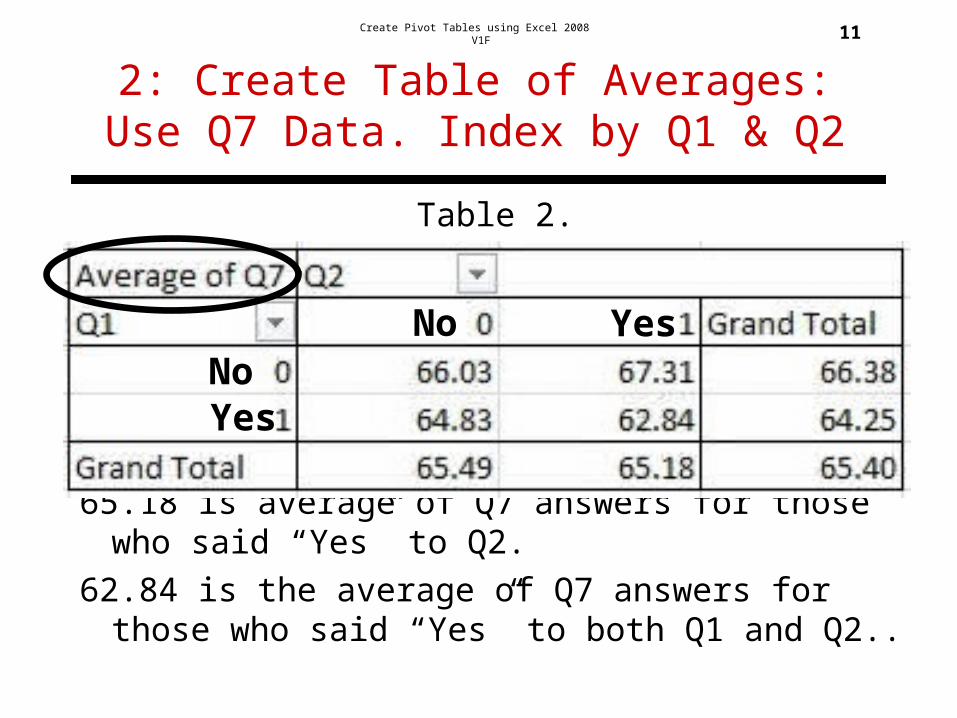
2: Create Table of Averages:Use Q7 Data. Index by Q1 & Q2
Table 2.
65.18 is average of Q7 answers for those who said “Yes” to Q2.
62.84 is the average of Q7 answers for those who said “Yes” to both Q1 and Q2..
NoNo
Yes
Yes

Create Pivot Tables using Excel 2008 V1F 12
2a: Drag data fields as needed;Change “Sum” to “Average”
.

Create Pivot Tables using Excel 2008 V1F 13
3: Create 3 Statistics for Q7; Index by Q1 & Q2
65.40 is average of Q7 for all respondents.
64.25 is average of Q7 for those who said Yes to Q1.
No Yes
Yes
No

Create Pivot Tables using Excel 2008 V1F 14
3a: Drag Q1 to Rows; Q2 to Cols.Drag Q7 three times to Values
If problem dragging Q7 third time to same place, drag to different place

Create Pivot Tables using Excel 2008 V1F 15
3b: Change Show Values to Average, Count and StdDev.
Right-mouse Q7; change to Average.; Right-mouse Q7_2; change to Count. Right-mouse Q7_3; change to StdDev.

Create Pivot Tables using Excel 2008 V1F 16
4: Create 100% Column Table; Index on Q1 and Q2.
Table 4.
45.83% of all respondents said “Yes” to Q1.47.76% of those who said Yes to Q2 said Yes to Q1.
Yes
YesNo
No

Create Pivot Tables using Excel 2008 V1F 17
4a: Double-click on Data Field;Select Count in ‘Summarize by’
.

Create Pivot Tables using Excel 2008 V1F 18
4b: Select “Show Values as”Select “% of Column Total”
.

Create Pivot Tables using Excel 2008 V1F 19
5: Create 100% Row Table; Index on Q1 and Q2.
Table 5.
27.92% of all respondents said “yes” to Q2.29.09% of those saying yes to Q1 said Yes to Q1.The first step for Table 5 is the same as 4a for Table 4.
No
No
Yes
Yes

Create Pivot Tables using Excel 2008 V1F 20
5a: Select “Show Values as”;Select “% of Row Total”
.
Create Pivot Tables using Excel 2008 V1F 21
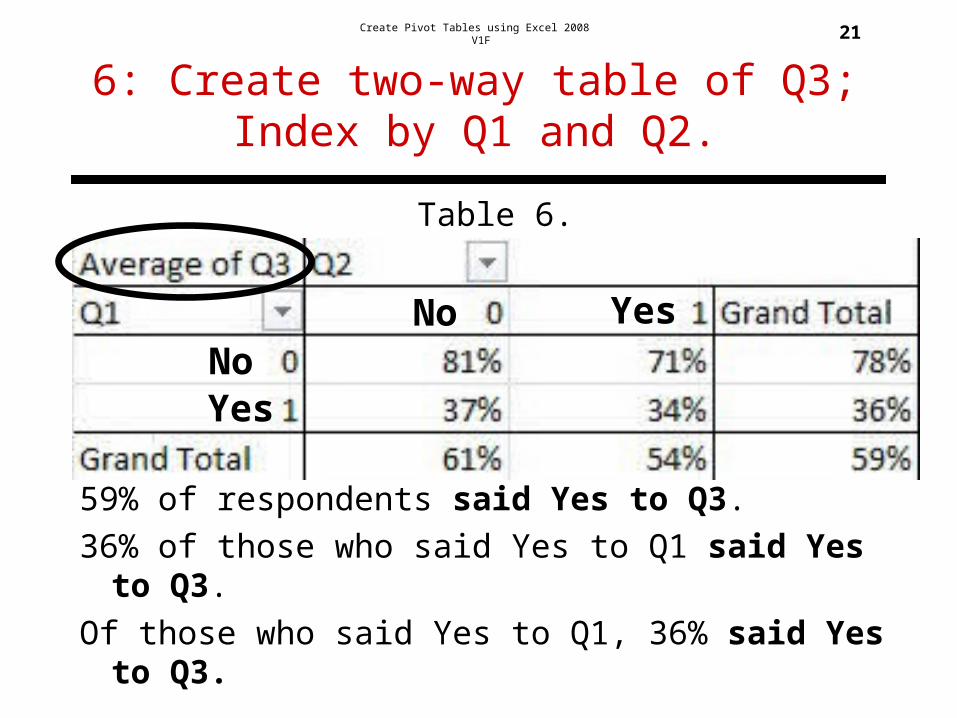
6: Create two-way table of Q3; Index by Q1 and Q2.
Table 6.
59% of respondents said Yes to Q3.
36% of those who said Yes to Q1 said Yes to Q3.
Of those who said Yes to Q1, 36% said Yes to Q3.
NoNo
Yes
Yes

Create Pivot Tables using Excel 2008 V1F 22
6a: Change Sum to Average;Format data as Percentages

Create Pivot Tables using Excel 2008 V1F 23
Conclusion
Pivot tables are one of the more powerful features of Excel.
Knowing how to create pivot tables is a valuable skill.
Knowing which is the better table is a more valuable skill
Knowing how to read, interpret and communicate the data summarized in pivot tables is a most valuable skill.