two group hypothesis tests using excel 2013 t-test command ... · two group hypothesis tests using...
TRANSCRIPT
Two group hypothesis tests using Excel 2013 T-TEST command 1
byMilo Schield
Member: International Statistical InstituteUS Rep: International Statistical Literacy ProjectDirector, W. M. Keck Statistical Literacy Project
Slides and audio at: www.StatLit.org/pdf/T-TEST-Command-Excel-2013-6up.pdf
Two-Group Hypothesis Tests: Excel 2013 T-TEST Command

Two group hypothesis tests using Excel 2013 T-TEST command 2
Excel T-TEST Command
Purpose: Calculate likelihood (p-value) of getting the observed difference in two sample means (or more extreme) by chance in random samples – assuming there is no difference in the two population means (the Null Hypothesis).
Four Inputs:1) Array or range of two samples. 2) Alpha cutoff.3) Tails: 1 (Excel matches Alternate with sample means) or 2. 4) Type of T-TEST. 1 dependent, matched subjects.
2: population variances unknown but equal. [Often true] 3: population variances unknown & unequal. [Conservative]
Two group hypothesis tests using Excel 2013 T-TEST command 3
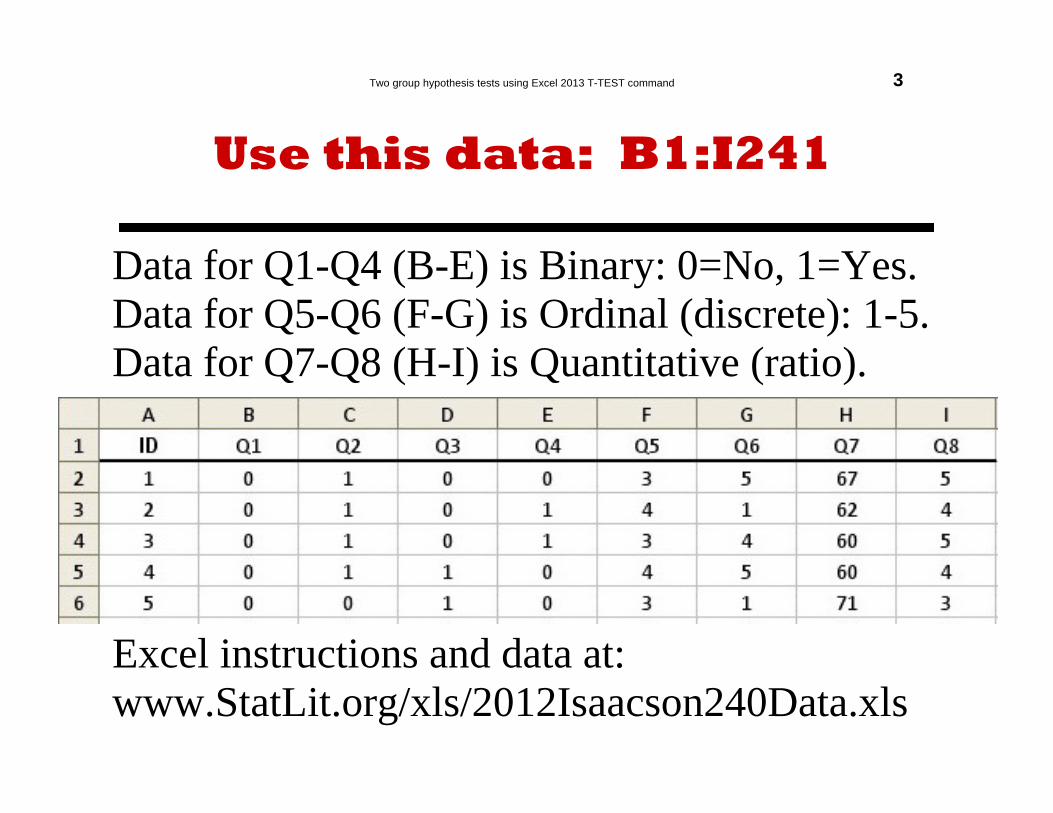
Use this data: B1:I241
Data for Q1-Q4 (B-E) is Binary: 0=No, 1=Yes.Data for Q5-Q6 (F-G) is Ordinal (discrete): 1-5. Data for Q7-Q8 (H-I) is Quantitative (ratio).
Excel instructions and data at:www.StatLit.org/xls/2012Isaacson240Data.xls
Two group hypothesis tests using Excel 2013 T-TEST command 4
Approach
Excel’s two-population T-Test command requires that the data be “stacked” (separated into two groups) by the value of the predictor. Predictor must be binary.
If the binary predictor is the answer to Q1, then the entire data set must be sorted by Q1.
The Excel “Sort” requires that the entire data set be selected before invoking the sort command. A common mistake is to sort just a single column rather than the entire dataset.
Unfortunately Excel does not have a “stacked” or conditional T-Test. The T-Test command will not automatically update p-values if data is changed.
Two group hypothesis tests using Excel 2013 T-TEST command 5
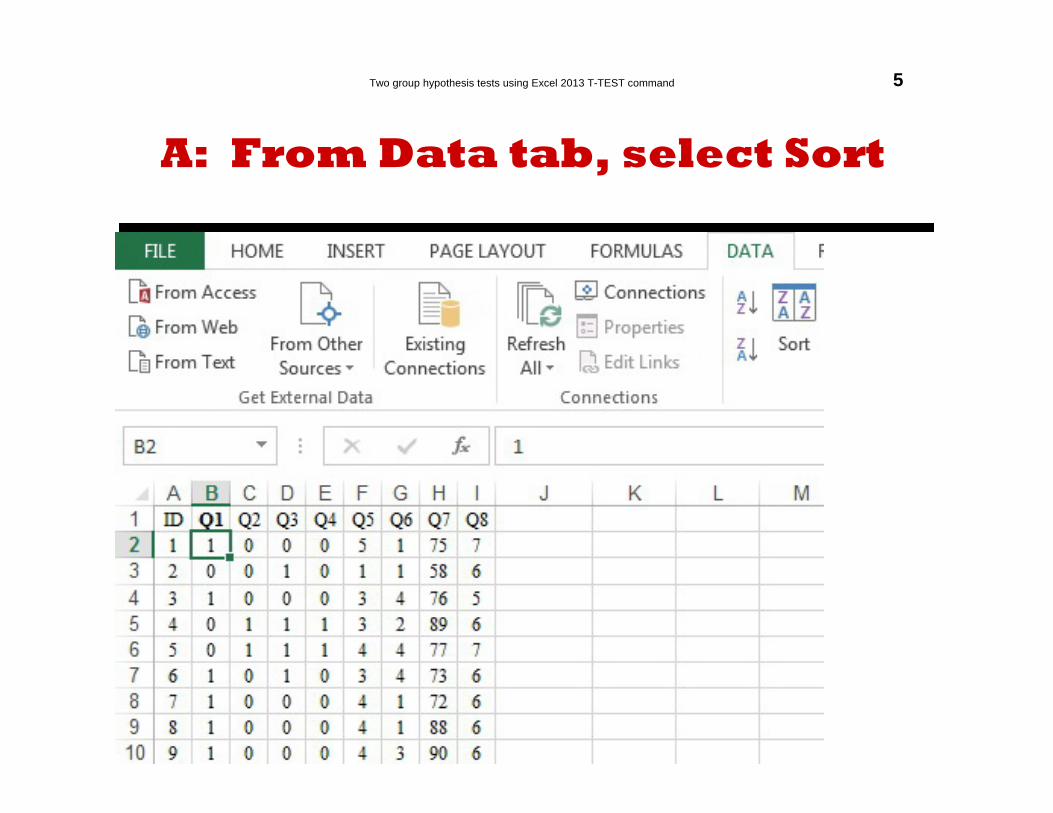
A: From Data tab, select Sort
.

Two group hypothesis tests using Excel 2013 T-TEST command 6
B: Select Sort Column/Order
.
Two group hypothesis tests using Excel 2013 T-TEST command
.
7
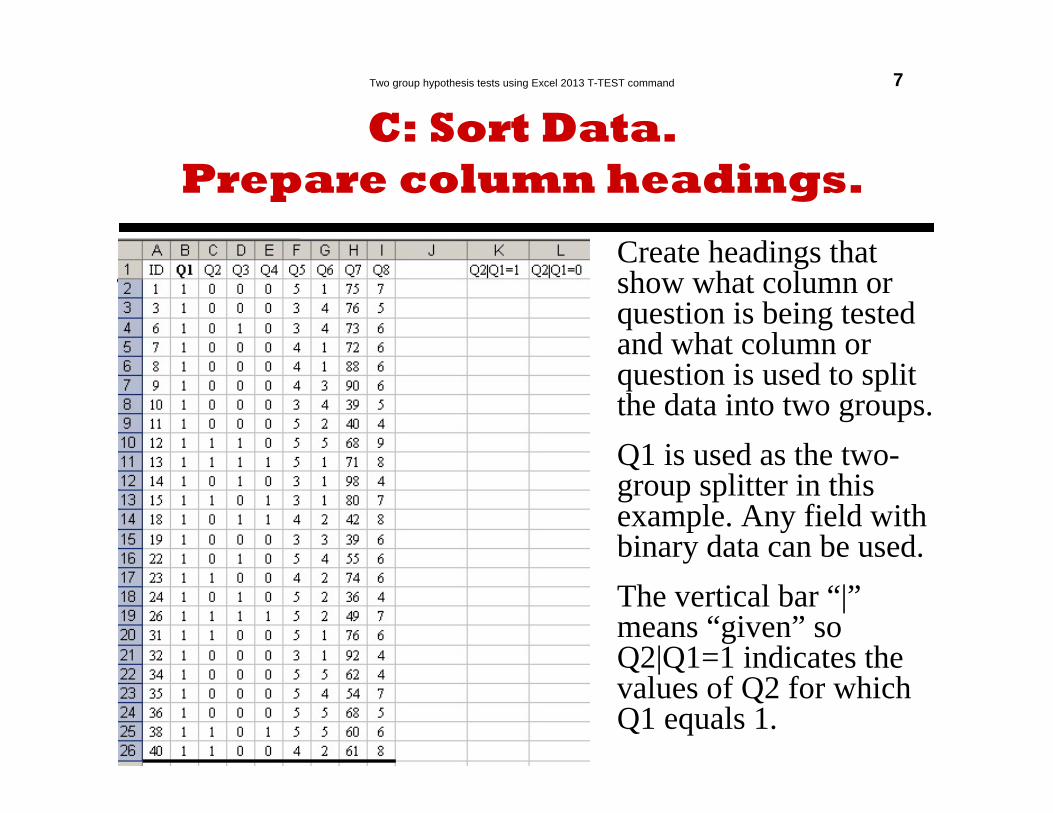
C: Sort Data. Prepare column headings.
Create headings that show what column or question is being tested and what column or question is used to split the data into two groups.Q1 is used as the two-group splitter in this example. Any field with binary data can be used.The vertical bar “|”means “given” so Q2|Q1=1 indicates the values of Q2 for which Q1 equals 1.
Two group hypothesis tests using Excel 2013 T-TEST command
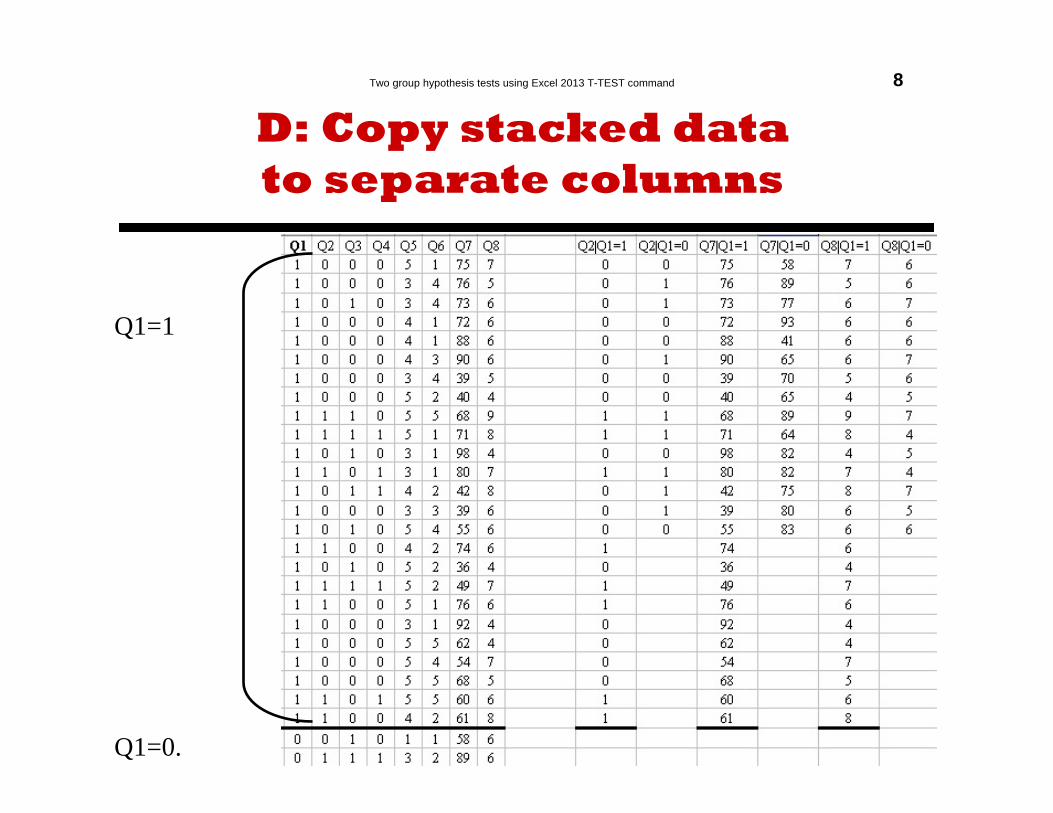
Q1=1
Q1=0.
8
D: Copy stacked data to separate columns

Two group hypothesis tests using Excel 2013 T-TEST command 9
[E: If needed,] Enable Data-Analysis Toolpak
If "Data Analysis" is not shown on Data tab, install it.
• Excel 2010/13: From File menu, select Options/Add-Ins.
• Excel 2008: From Microsoft button, select "Add Excel Options" in lower right corner.
• Excel 2003 If "Data Analysis Toolpak" is not shown under Tools menu, install it. From TOOLS menu, select ADD-INS.
Check the check box for "Data Analysis Toolpak“. Press the OK command button. The Data Analysis command should be added to the appropriate menu. If not remove and reinstall.

Two group hypothesis tests using Excel 2013 T-TEST command 10
T-TEST Command ProcedureGiven Separated Data
1: From Tool Menu, select “Data Analysis”.
2: From Data Analysis window, select “t-test: Two-sample with unequal variances”.
3: From associated window, enter inputs and outputs.
4. Obtain results of t-test.

Two group hypothesis tests using Excel 2013 T-TEST command 11
1) From the Data ribbonselect Data Analysis
.

Two group hypothesis tests using Excel 2013 T-TEST command 12
2) Select T-Test Command:Two-Sample; Unequal Variances
.
Two group hypothesis tests using Excel 2013 T-TEST command 13
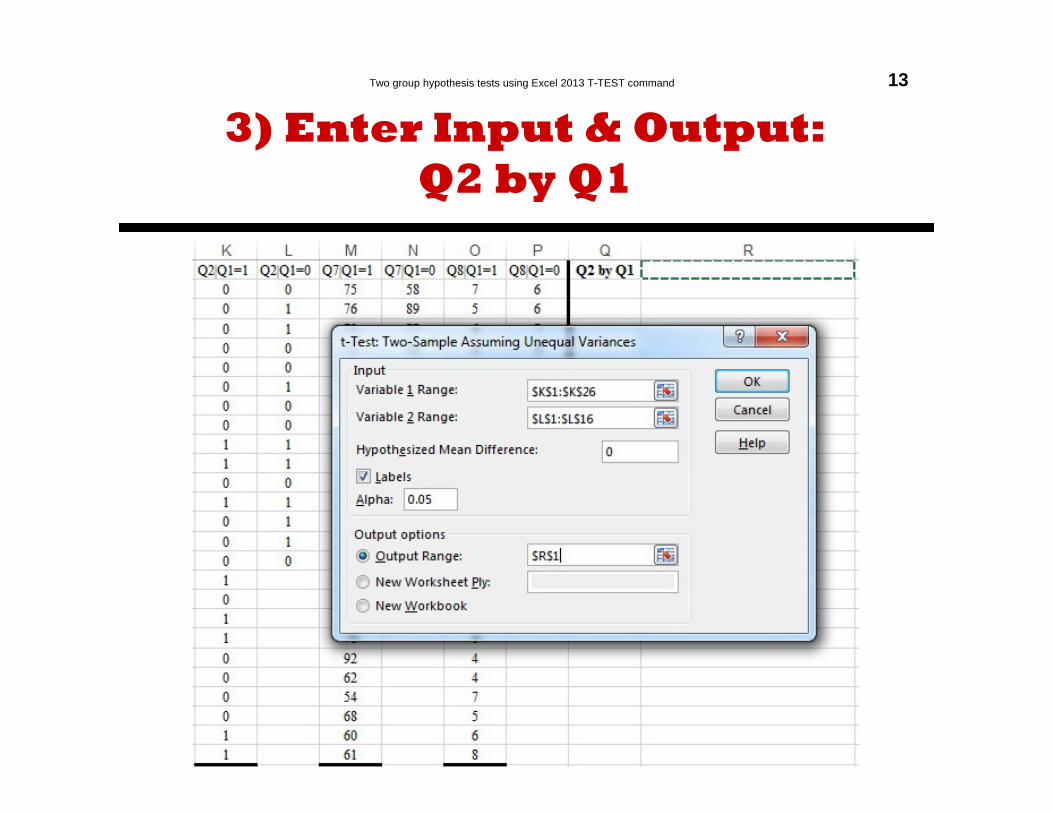
3) Enter Input & Output:Q2 by Q1
.

Two group hypothesis tests using Excel 2013 T-TEST command 14
4) Excel-Generated Results:Q2 by Q1
Difference in Q2 proportions by Q1 in not statistically significantTechnical: Fail to reject the null hypothesis for Q2 by Q1.

Two group hypothesis tests using Excel 2013 T-TEST command 15
3) Enter Input and Output:Q7 by Q1
.
Two group hypothesis tests using Excel 2013 T-TEST command 16
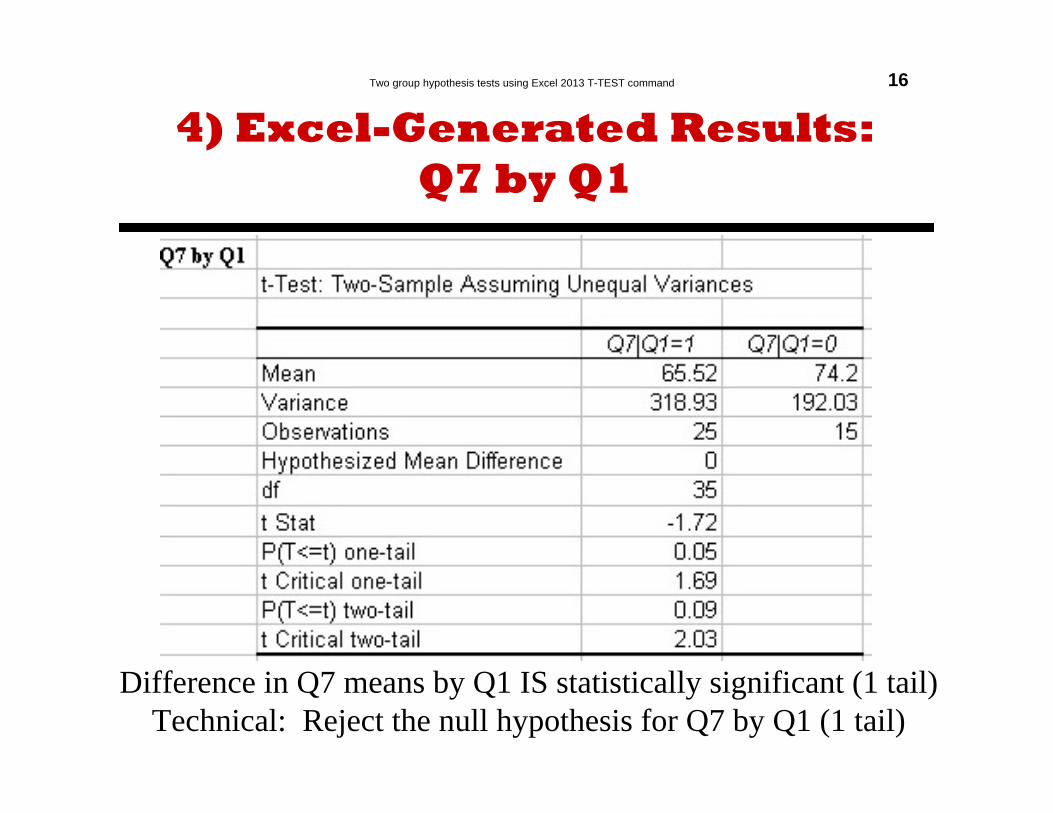
4) Excel-Generated Results:Q7 by Q1
Difference in Q7 means by Q1 IS statistically significant (1 tail)Technical: Reject the null hypothesis for Q7 by Q1 (1 tail)
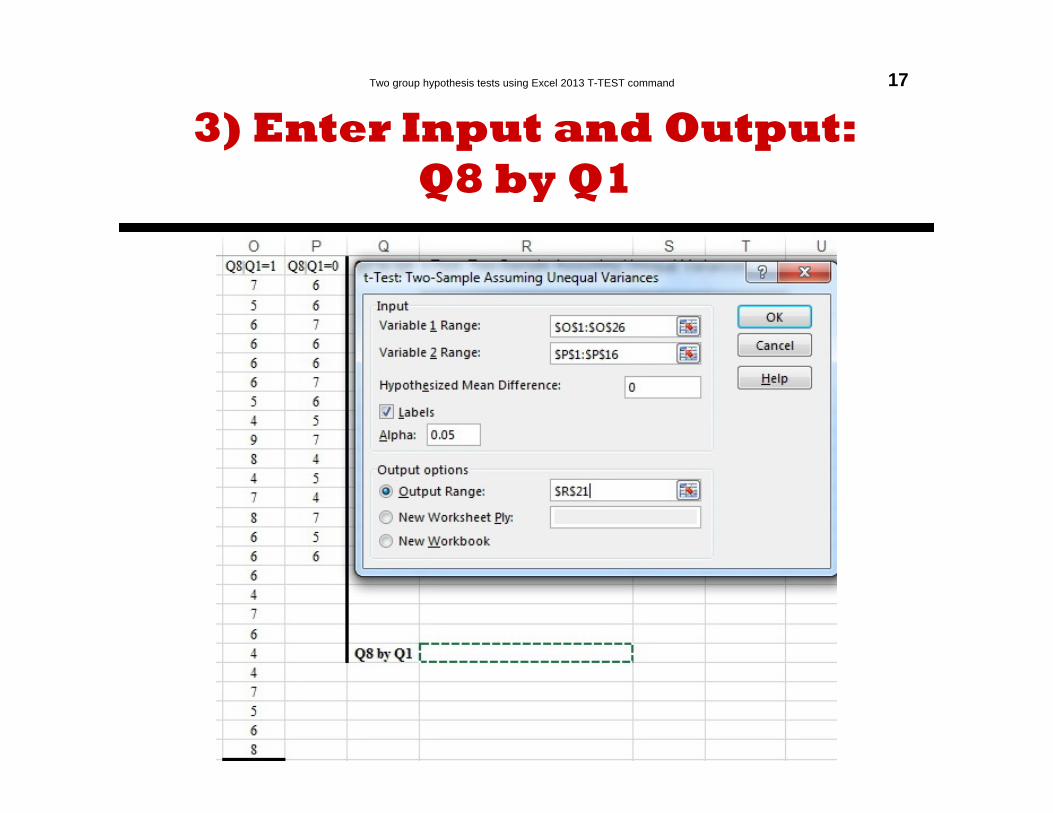
Two group hypothesis tests using Excel 2013 T-TEST command 17
3) Enter Input and Output:Q8 by Q1
.
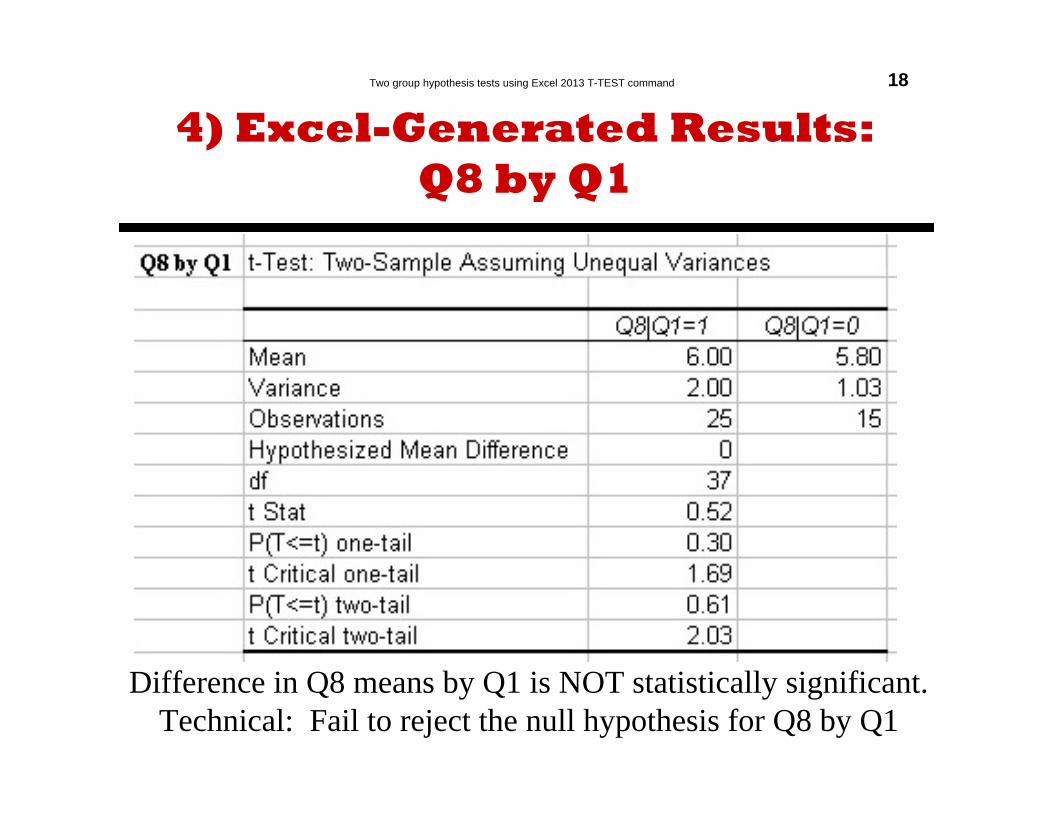
Two group hypothesis tests using Excel 2013 T-TEST command 18
4) Excel-Generated Results:Q8 by Q1
Difference in Q8 means by Q1 is NOT statistically significant.Technical: Fail to reject the null hypothesis for Q8 by Q1

Two group hypothesis tests using Excel 2013 T-TEST command 19
Summary
In a one-tailed test, T-TEST always tests whether the positive difference between the larger sample statistic and the smaller is statistically-significant.
“Reject the null hypothesis” and “Failure to reject the null hypothesis” are technical conclusions.
“A difference IS [or IS NOT] statistically significant”is a less-technical conclusion.
Use the less-technical expressions for everyday communication.