crazy clown - island county, washington
TRANSCRIPT

Annales Geophysicae, 23, 1391–1403, 2005SRef-ID: 1432-0576/ag/2005-23-1391© European Geosciences Union 2005
AnnalesGeophysicae
Electric current and magnetic field geometry in flappingmagnetotail current sheets
A. Runov1, V. A. Sergeev2, W. Baumjohann1, R. Nakamura1, S. Apatenkov2, Y. Asano1, M. Volwerk 1,6, Z. Voros1,T. L. Zhang1, A. Petrukovich3, A. Balogh4, J.-A. Sauvaud5, B. Klecker6, and H. Reme5
1Space Research Institute, Austrian Academy of Sciences, A-8042, Graz, Austria2St. Petersburg University, Russia3Space Research Institute, Russian Academy of Sciences, Moscow, Russia4Imperial College, London, UK5CESR, Toulouse, France6MPE, Garching, Germany
Received: 10 December 2004 – Revised: 3 March 2005 – Accepted: 29 March 2005 – Published: 3 June 2005
Abstract. Using four-point magnetic field measurements bythe Cluster spacecraft, we statistically analyze the magneticfield and electric current configurations during rapid cross-ings of the current sheet observed in July–October 2001 atgeocentric distances of 19RE . The database includes 78crossings, specially selected to apply multi-point data analy-sis techniques to calculate vector derivatives. Observed bipo-lar variations ofjz, often with|jz|>jy , indicate that the elec-tric currents follow kinks of the current sheet. The currentdensity varies between 5–25 nA/m2. The half-thickness ofthe current sheet during flapping varies over a wide range,from 1 to 20 ion thermal gyroradii (Lcp, calculated from av-erage temperature and lobe magnetic field for each crossing).We found no relationship between the tilt angle of the cur-rent sheet normal and the half-thickness. In 68 cases themagnetic field curvature vector has a positive (earthward)X-component. Ten cases with a negative (tailward) cur-vature, associated with reconnection, were detected within0<YGSM<7RE . The minimum curvature radii vary mainlybetween 1 and 10Lcp, and the adiabaticity parameterκ≤1for 73% of the events. The electric current density duringflapping is often off-central, i.e. the main current density isshifted from the neutral sheet (|Bx |<5 nT) to the Northernor Southern Hemisphere. This is most likely a temporal ef-fect related to the flapping. The analysis shows that the flap-ping motion of the current sheet is associated with kink-likewaves on the sheet surface. The kink fronts, tilted in theY−Z plane, moved toward dawn in the morning half and to-ward dusk in the evening half of the magnetotail.
Keywords. Magnetospheric physics (Magnetotail; Plasmasheet)
Correspondence to:A. Runov([email protected])
1 Introduction
Speiser and Ness(1967) noticed that the magnetotail currentsheet frequently moves in the north-south direction. This mo-tion, which has been referred to as flapping (Lui et al., 1978),provides the possibility to probe the structure of the currentsheet during multiple crossings (Sergeev et al., 1993) and de-duce an electric current density within the sheet (Sergeevet al., 1998). The interpretation of measurements duringflapping was sometimes based on suggestions that flappingis an up-down motion of the magnetic field, together withplasma (Sergeev et al., 1998) and that the current sheet isa planar structure, with current distribution described by aHarris (1962) function (Sanny et al., 1994). However, evensingle-spacecraft measurements show indications that the ge-ometry of the magnetotail current sheet is more complex thana planar surface, and that the sheet may be corrugated (Luiet al., 1978; Nakagawa and Nishida, 1989).
Case studies of the magnetotail current sheet with theCluster four spacecraft constellation show that short-term(∼30 s− several minutes), large-scale variations (δBx∼15–30 nT) of the magnetic field, which are typical manifestationsof flapping, are associated mainly with wave-like structureson the current sheet surface, propagating in the cross tail di-rection (Zhang et al., 2002; Runov et al., 2003b; Sergeevet al., 2003). Sergeev et al.(2004) have shown by multi-pointtiming analysis that near the flanks (8<|YGSM |<15RE) theflapping waves propagate from the central sector of the mag-netotail toward the flanks. Moreover, the distribution of thecurrent density within such transients is often far from that inthe Harris sheet (Runov et al., 2003b; Sergeev et al., 2003).
In this paper we provide a statistical survey of the currentsheet geometry, magnetic field gradient, curvature, and cur-rent density distribution during rapid crossings of the sheetduring the 2001 Cluster tail season.

1392 A. Runov et al.: Electric current and magnetic field geometry
2 Method
Calculations based on the reciprocal vectors (Chanteur,1998) allow one to estimate the magnetic field gradient, curl,and divergence using linear interpolation between the Clus-ter tetrahedron nodes. Another method, based on a least-squares minimization (Harvey, 1998), yields consistent re-sults (Chanteur and Harvey, 1998). Both methods are sen-sitive to geometrical factors of the tetrahedron, such as itselongationE and planarityP . During the tail season (Julyto October) the Cluster tetrahedron is nearly regular withE≤0.1 andP≤0.1 (Chanteur and Harvey, 1998) which iswell-suited for calculations of the vector derivatives (Robertet al., 1998a). Test calculations and applications of thecurlometer for Cluster data are described byDunlop et al.(2002). Calculation of curl and divergence ofB in the mag-netotail lobe gives the median value 0.58±0.23 nT/1000 kmand 0.21±0.17 nT/1000 km, respectively.
Gradient estimates can also be used to estimate the mag-netic field curvature vectorC=(b·∇)b, whereb=B/B. Thecurvature radius is the reciprocal value of the curvature vec-tor Rc=1/C. The accuracy ofRc estimation using four-pointmeasurements in the magnetotail is discussed byShen et al.(2003).
The local normal to the current sheet can be obtained byMinimum Variance Analysis (e.g.,Sonnerup and Schneible,1998), by four-point timing analysis (Harvey, 1998), or byusing ∇B2 (Shen et al., 2003) or the l×[∇×B] direction,where l is the magnetic field maximum variance eigenvec-tor (this study).
Using the estimated magnetic field gradient∇B and as-suming that rapid crossings of the magnetotail current sheetare due to a translational motion of the entire sheet with ve-locity U,
dBdt
=∂B∂t
+ (U·∇)B=0, (1)
where integration ofUn (component of the translation veloc-ity along the current sheet normal) yields the effective coor-dinate across the current sheet
Z∗(t)=
∫ t2
t1
∂Bl
∂t[∇nBl]
−1dt, (2)
whereBl is the main, maximum variance component of themagnetic field (close toBx in the near-midnight part of themagnetotail) and∇n is the gradient along the current sheetnormal. The half-thickness of the current sheeth may beestimated as the width of thej (Z∗) profile atj=0.5max(j),or using a fit to the Harris function.
To examine the accuracy of the estimations, a set of testcalculations was performed with the simplest Harris-typecurrent sheet (see Appendix) and with two shifted Harrisdistributions (to model a bifurcated sheet) passing over avirtual spacecraft tetrahedron. Cluster configurations dur-ing September 2001 (close to a regular tetrahedron), midJuly and end of October (maximum deviation from a regu-lar tetrahedron) were used for the model calculations. The
numerical experiments show that the direction of the currentis reconstructed with an error of less than 20◦ without anydependence on the tetrahedron configuration, but the currentdensity magnitude might be underestimated up to 30%. Thescaleh is also underestimated up to∼15%, depending onthe tetrahedron configuration and the mutual orientation oftetrahedron and model current sheet. Non-regularity of thespacecraft tetrahedron produces also some asymmetry of thereconstructed current density profile with a displacement ofthe peak of up to±500 km fromZ∗=0. In turn, the mag-netic field curvature radius, being proportional to a reciprocalvalue of a magnetic field gradient, might be overestimated.
3 Data
During the 2001 tail season (from mid of July until the end ofOctober) the Cluster quartet crossed the magnetotail plasmasheet in the configuration of a nearly regular tetrahedron withthe maximal scale of 1700–2000 km (Baumjohann and Naka-mura, 2005). The 1-s averaged magnetic field data from theFlux Gate Magnetometer (FGMBalogh et al., 2001) andthe 2-spin (normal mode) and 1-spin (4 s, burst mode) av-eraged data from the Cluster Ion Spectrometry experiment(CIS, Reme et al., 2001) are used for the statistical analysispresented below.
We use the following criteria to select rapid current sheetcrossings. First, we selected the events with large and rapidvariations of|Bx | at the Cluster barycenter:δ|Bx |>15 nTduring time interval 30≤τ≤300 s. During the 2001 tail sea-son, 198 such cases were found. From this large data baseonly “complete” crossings, during which all four spacecraftcross (or, at least touch) the neutral sheet region (|Bx |<5 nT),were selected for further analysis. Besides, by visual inspec-tion we selected smooth crossings without significant shorttime scale fluctuations and with similar shapes of magne-tograms at all four spacecraft. For final selection we calcu-late curl and divergence estimations using 1-s averaged FGMdata. Since the main source of the magnetic field divergenceis an error of linear interpolation of the field within the tetra-hedron, we selected events with|∇·B|/|∇×B|<0.30 in morethan 60% of samples during the crossing (see Appendix).
It should be noted that the database does not contain thincurrent sheets with a thickness less than the Cluster tetrahe-dron scale, like those presented byNakamura et al.(2002).
To avoid LLBL and magnetosheath samples, only cross-ings within−15<Y<15RE were used (no storm-time eventsin the near flank region are included into the database).No selection by plasma parameters was applied. The finaldatabase contains 78 rapid current sheet crossings.
4 Event study
To illustrate our selection criteria and further analysis, westart by presenting one event. Figure 1 shows Cluster ob-servations for a 500-s long interval after∼15:25 UT on 12

A. Runov et al.: Electric current and magnetic field geometry 1393
August 2001 (seeVolwerk et al. (2004) for a detailed de-scription of this event). During this time Cluster was lo-cated in the morning sector at [−17.3, −6.0, 5.0]RE (co-ordinates of the barycenter). The relative positions of thespacecraft are shown in the inserted box in Fig. 1. The Clus-ter barycenter crosses the neutral sheet twice: first from northto south, then in the opposite direction. The instances of neu-tral sheet crossings (t01, t02) are marked by vertical dashedlines. Crossing durations are∼100 s.By was small and var-ied in between−3 and 3 nT, andBz was positive and reached10 nT during the crossings. The proton velocity was small(≤100 km/s) at the beginning of the first crossing and aroundzero during the second one, C1 and C4 spacecraft show ap-proximately the same values. The proton density was unusu-ally high (1.6–1.9 cm−3), and the proton temperature was 1.8and 2.4 keV, for both crossings, respectively, which is lowerthan the typical value (∼5 keV, seeBaumjohann et al., 1989).Thus, the Cold-Dense Plasma Sheet (CDPS), preceded by∼7 h of positive IMFBz (ACE data, not shown) was ob-served.
The Z-component of the electric current densityj=µ−1
0 ∇×B calculated from four-point magnetic field mea-surements was the largest component during both crossings,and showed a bipolar variation:jz>0 during the first cross-ing andjz<0 during the second one. This indicates a strongtilt of the current sheet in theY−Z plane. During the firstcrossing the current density maximum is seen before the neu-tral sheet crossing at barycenter (t0). The magnetic field cur-vature vector is directed earthward (positive curvature).
Visual inspection of theBx time series shows that a frontof the flapping wave moves dawnward (-Y) so that the C2spacecraft (red trace) crosses the neutral sheet first and C4(blue) last. The order of magnetograms and time lags remainthe same for both crossings: C2→C3→C1→C4 with delays(with respect to C2) of 44, 20, 13 s for the first crossing and47, 10, 12 s for the second one. These timings yield a nor-mal velocity of 25 km/s with a normal directionnt 1=[0.15,−0.99, 0.04], and 28 km/s andnt 2=[0.16, −0.98, −0.12]for the first and second crossings, respectively. Results of aMinimum Variance Analysis (MVA) of the barycenter mag-netic field time series are similar. For the first crossingthe MVA yields n1=[0.01, −0.99, 0.15] with an eigenval-ues ratioλ2/λ3=8.57. For the second crossing the minimumand intermediate variance directions are not well resolved(λ2/λ3=2.17). We also computed the normals to the cur-rent density direction using the maximum variance compo-nentsl1,2, (λ1/λ2=128.1: first crossing,λ1/λ2=408.5: sec-ond crossing) and computingnj=l×ej , whereej=j/j is aunit vector along the current density direction, for both cross-ings. The results arenj 1=[0.12, −0.86, 0.46],nj 2=[0.05,−0.95, −0.22]. This gives a consistency between timing-and current-based normals:nt 1·nj 1=0.89 andnt 2·nj 2=0.97.
The results of this case study are summarized in Fig. 2.Panel a) shows a diagram inferred from the sheet orienta-tions obtained: Cluster passes through a quasi-rectangularkink in the current sheet. The length of this kink (size inthe Y direction) estimated from timing is∼6000 km. Panels
0
10
20
Bx,
nT
0
10
20
By,
nT
0
10
20
Bz,
nT
0
10
20
B,
nT
-10-505
10
J, n
A/m
/m
-0.20.00.20.40.6
C,
1/1
0^3
km
1.60
1.80
2.00
Np
, cm
^-3
2.02.22.4
Tp,
keV
-500
50
Vx,
km
/s
-500
50
Vy,
km
/s
100 200 300 400 500
-500
50
Vz,
km
/s
t0_1 t0_2
C1 C2 C3 C4
Bx By Bz
dvBJx Jy Jz
Cx Cy Cz
Fig. 1. 500 s of Cluster data from∼15:25 UT, 12 August 2001.From top to bottom:Bx , By , Bz from all four spacecraft; threecomponents ofB at the Cluster barycentre; three components ofthe calculated current densityj ; X-,Y-, and Z-components of themagnetic field curvature vectorC=(b·∇)b; H+ density, pressureand bulk velocity (three components) from Cluster 1 and 4.
b) and c) illustrate the vertical scale estimation made usingEq. (2) with the additional conditionZ∗(t0)=0. These cal-culations yield an amplitude of the kink of 6000 km whichis equal to the kink length. It should be noted, however, thatthe accuracy of the amplitude estimate is rather poor for thestructures with scales of the order of the inter-spacecraft sep-aration scale (see Appendix). There were no current sheetcrossings during 30 min before and 30 min after this kink(Volwerk et al., 2004), which implies that this structure couldbe a solitary wave. The kink velocityVy∼25 km/s obtainedfrom the timing is similar to theY -component of the ion bulkvelocity (see Fig. 1). Therefore, this kink may be transportedwith the ion flow.

1394 A. Runov et al.: Electric current and magnetic field geometry
Y
Z
j
a)
b)
c)
Vy
CL2 CL1CL4
CL3
τ, sec
Z* , 1000 km
Z* ,
1
00
0 k
mj,
nA
/m2
Fig. 2. (a) An interpretation of 12 August 2001 data: Sketch ofthe electric current geometry in theY−Z plane;(b) Changes in theCluster barycenter position during the crossings with respect to theneutral sheet (Z∗=0); (c) Reconstructed current density profiles.
Using estimates ofZ∗ we reconstructed the current den-sity profiles during both crossings (Fig. 2c). Both profiles aresingle-peak, shifted by 1000 km fromBx=0 during the firstcrossing and centered at the neutral sheet for the second one.The current sheet during both crossings was sufficiently thinwith a half-thickness of 1500 km. These results can be sim-ply verified by visual inspection of theBx time series (Fig. 1,upper panel): At the instance∼140 s, first crossing, Clus-ter 2 detectsBx=0 while Cluster 1 detectsBx=15 nT, whichis roughly half of the lobe field value. Thus, the distance be-tween these two spacecraft (1500 km) gives an estimate ofthe current sheet half-thickness.
5 Statistical survey
Figure 3 shows the spacecraft locations during neutral sheetcrossings for the selected 78 cases. We use aberrated GSMcoordinates (see, e.g.,Hori et al., 2000)
'
'
'
Fig. 3. Neutral sheet position (Bx=min(|Bx |) at the Clusterbarycenter) projections ontoX′
−Y ′ andY ′−Z planes for the 78 se-
lected cases (X′, Y ′ - aberrated GSM coordinates, see explanationin the text).
1. X′=X cos(3.5◦)−Y sin(3.5◦) and
2. Y ′=X sin(3.5◦)+Y cos(3.5◦).
The cases are distributed within−12<Y ′<12RE and−2<Z<5.5RE . Following seasonal changes, the neutralsheet crossings are asymmetrically distributed in theY ′
−Z
plane: During July–August (morning sector,Y ′<0) the neu-tral sheet was, on average,∼3RE above theZ=0 plane, andduring October (evening sector,Y ′>0) the neutral sheet po-sitions are located below theZ=0 plane. The position of theneutral sheet at midnight was slightly above (1.5–2RE) thenominal magnetic equator. A detailed analysis of seasonalchanges of the neutral sheet geometry using Cluster 2001–2003 data was performed byPetrukovich et al.(2005).
5.1 Plasma properties
Figure 4 shows the distributions of average ion density (toppanel, NH+ : crosses,NH++NO+ : circles), ion tempera-ture (middle panel,TH+ only) and maximum and median
H+− ion bulk horizontal velocitiesVeq=
√V 2
x +V 2y (CIS-
CODIF data from Cluster 1 and 4 are used for the statis-tical analysis). To avoid any influence of PSBL samples(where counter-streaming beams could lead to an apparenthigh parallel temperature; see e.g.,Baumjohann et al., 1988),the average values were calculated using samples with corre-sponding|Bx |<0.5BL, whereBL is the lobe magnetic field,BL=(B2
+2µ0Pi)1/2, wherePi is the total ion pressure, cal-
culated as the sum ofH+ andO+ pressures.The ion density varies between 0.1 and 3.2 with the max-
imum occurrence rate atNi∼0.4 cm−3. Three cases with anion density less than 0.1 cm−3 at Y ′
∼7RE were observedduring the 1 October 2001 storm, when the plasma sheetwas mainly populated by O+ ions (Kistler et al., 2005).Four cases with extremely high ion density up to 3.2 cm−3
at Y ′∼2RE were observed on 14 September 2001, during
a long period of northward IMF (Petrukovich et al., 2003).
A. Runov et al.: Electric current and magnetic field geometry 1395
'
Fig. 4. Distributions of average ion density (NH+ : crosses,NH+ +
NO+ : circles, upper panel), H+ temperature (mid panel), average(crosses) and maximal (circles) horizontal velocities (Vxy ) for eachselected crossing versusY ′.
The ion temperature varies in a wide range fromTi∼2 keVto Ti∼10 keV. Therefore, our database includes a broad spec-trum of plasma conditions ranging from a hot rarified plasmasheet to a cold dense one.
In 52 of the 78 cases the average horizontal ion bulk ve-locity (Vxy) was less than 100 km/s, in 17 cases it rangedbetween 100<Vxy<300 km/s. In more than 60% of the cases(50 out of 78) the maximum ion bulk velocity was less than200 km/s. High-speed horizontal flow withVxy>400 km/swas detected in 14 cases (maximum velocities were counted).All of them were observed in the pre-midnight half of themagnetotail. Therefore, the majority of crossings representslow velocity events.
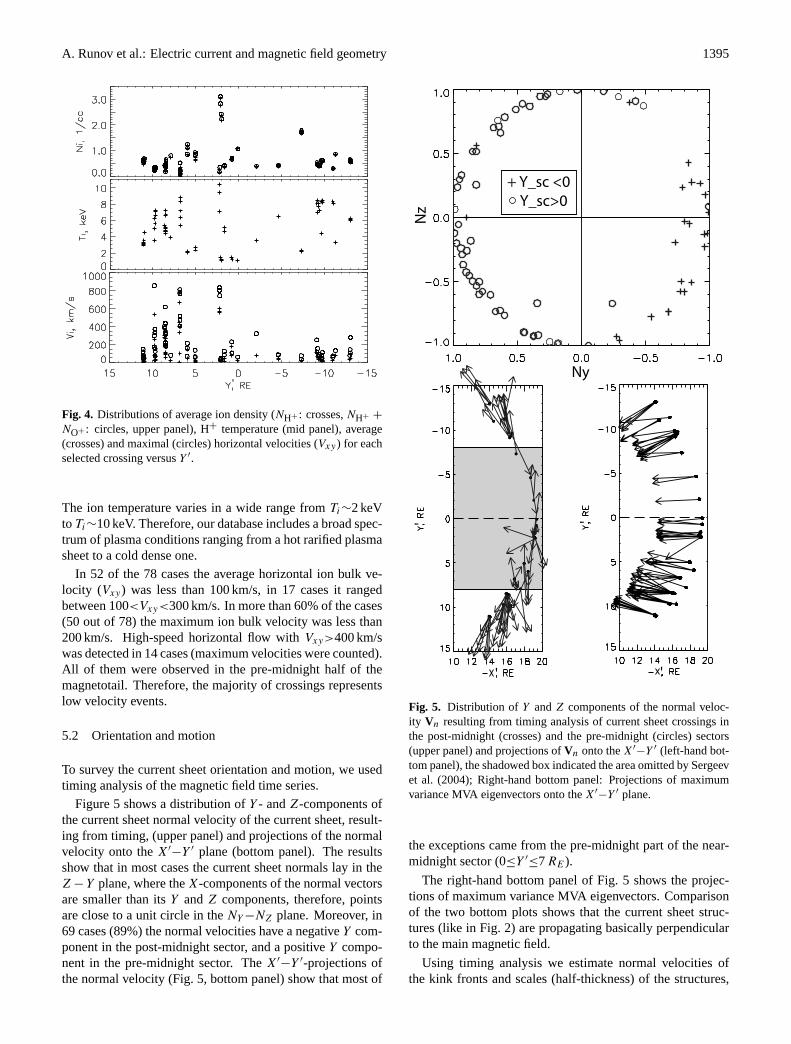
5.2 Orientation and motion
To survey the current sheet orientation and motion, we usedtiming analysis of the magnetic field time series.
Figure 5 shows a distribution ofY - andZ-components ofthe current sheet normal velocity of the current sheet, result-ing from timing, (upper panel) and projections of the normalvelocity onto theX′
−Y ′ plane (bottom panel). The resultsshow that in most cases the current sheet normals lay in theZ −Y plane, where theX-components of the normal vectorsare smaller than itsY andZ components, therefore, pointsare close to a unit circle in theNY −NZ plane. Moreover, in69 cases (89%) the normal velocities have a negativeY com-ponent in the post-midnight sector, and a positiveY compo-nent in the pre-midnight sector. TheX′
−Y ′-projections ofthe normal velocity (Fig. 5, bottom panel) show that most of
Ny
Nz
+ Y_sc <0
Y_sc>0
''
' '
Fig. 5. Distribution of Y andZ components of the normal veloc-ity Vn resulting from timing analysis of current sheet crossings inthe post-midnight (crosses) and the pre-midnight (circles) sectors(upper panel) and projections ofVn onto theX′
−Y ′ (left-hand bot-tom panel), the shadowed box indicated the area omitted bySergeevet al. (2004); Right-hand bottom panel: Projections of maximumvariance MVA eigenvectors onto theX′
−Y ′ plane.
the exceptions came from the pre-midnight part of the near-midnight sector (0≤Y ′
≤7RE).
The right-hand bottom panel of Fig. 5 shows the projec-tions of maximum variance MVA eigenvectors. Comparisonof the two bottom plots shows that the current sheet struc-tures (like in Fig. 2) are propagating basically perpendicularto the main magnetic field.
Using timing analysis we estimate normal velocities ofthe kink fronts and scales (half-thickness) of the structures,

1396 A. Runov et al.: Electric current and magnetic field geometry
Fig. 6. Occurrence rates of the current sheet normal velocity (Vn,from timing) and estimated scaless=Vn·τ , whereτ is a crossingduration, normalized to characteristic tetrahedron scalea.
Sh=Vnτ , where τ is a crossing duration fromBx=0 toBx=max|Bx |. The results are presented in Fig. 6. In 53cases (68%) the normal velocity of the sheet was low, be-tween 30 to 70 km/s. Only 17 cases with velocities between100–300 km/s were found. The corresponding thickness ofthe structures varied from 1500 km to 10000 km, with themaximum occurrence at 2000–3000 km. The bottom panelof Fig. 6 shows the occurrence rates of the estimated scales,normalized to the characteristic scales of the tetrahedron 2a(seeRobert et al., 1998b), calculated for each crossing timet0. The ratioSh/(2a)>1 in 99% andSh/(2a)>3 in more than50% of the cases. Therefore, the use of the linear gradient es-timator technique is justified for most of the crossings in ourdatabase.
5.3 Electric currents in the neutral sheet
To survey the directions of electric currents we calculatedthe current unit vectorej=∇×B/|∇×B| in the neutral sheet(|Bx |<5 nT). The distribution ofY - andZ-components ofej
is shown in Fig. 7 (upper panel). The electric current direc-tions are equally distributed in theej Y
>0 half-plane, indi-
''
' '
Fig. 7. Electric current and curvature directions. Upper panel:DistributionY andZ components of the unit vectorsej=j/j ; Bot-tom panels: Projections ofej (left-hand panel), and projections ofeC=C/C (right-hand panel) onto theX′
−Y ′ plane.
cating that electric currents often deviate from the nominaldawn-dusk direction during current sheet flapping events, asin Fig. 2. There are four events with a significant negativeY component ofej . This may be explained by an increasein the kink front steepness up to its overturn, similar to thesituation described byZhang et al.(2002).
The left-hand bottom panel in Fig. 7 shows projections ofthe electric current direction in theX′
−Y ′ plane. The electriccurrent basically has a negativeX-component in the morningsector and a positive one in the evening sector. An occurrencerate analysis shows that in the post-midnight sector in 7 casesfrom 23 ej x
>0 and in 16 casesej x≤0; in the pre-midnight
sector in 37 casesej x≥0 and in 18 casesej x
<0. Therefore,

A. Runov et al.: Electric current and magnetic field geometry 1397
predominantly, the neutral sheet current is directed, as ex-pected, perpendicular to the flaring tail magnetic field.
Projections of the normalized magnetic field curvaturevectorseC=C/C, whereC=(b·∇)b onto theX′
−Y ′ planeare shown in Fig. 7, right-hand bottom panel. The curvaturedisplays the corresponding behaviour. In most of the cases(68 of 78) the magnetic field curvature vectors are directedearthward (X>0), as expected on closed magnetic field linesof the plasma sheet. In 10 casesCx<0; the negative cur-vature means that Cluster is situated on magnetic loops ortailward of the reconnection region. All these situations inour database are detected in the pre-midnight sector. In thepost-midnight sector in 19 casesCy≥0 and in 4 casesCy<0;in the pre-midnight sectorCy≤0 in 34 cases andCy>0 in 21cases.
In order to examine the mutual orientation of the maxi-mum variance eigenvectorsl, the current sheet normalsnt ,defined by timing analysis, and the electric current direc-tions ej , we compare their dot products andnt ·nj , wherenj=l×ej . The results are shown in Fig. 8.
Data points cluster around the point (0, 1) on both pan-els, indicating the expected relationship between these direc-tions: The timing normals are generally orthogonal to themaximum variance eigenvector and collinear tonj . At thesame time, the difference betweennt and nj is not negli-gible: Only for 32% of cases are the angles between thesetwo normals are less than 15◦, and for 76% of the cases arethey less than 30◦. This difference stems mainly from non-orthogonality ofej andl (Fig. 8, right-hand panel).
5.4 Characteristic scales
To estimate the amplitude of the current sheet flapping wecalculateZ∗ according to Eq. (2). All events were visuallyinspected to exclude cases with non-monotonous changes inZ∗ with time. Only 67 crossings are suitable for the scaleestimation. For these cases the characteristic gradient scalesh were estimated as the half-thickness of thej (Z∗) profile.Distributions of the flapping amplitudeS=|max(Z∗)| and thescaleh versusY ′ are shown in Fig. 9 (upper panel). Anothercharacteristic of the current sheet scale could be the medianvalue of the magnetic field curvature radius in the neutralsheet (Rceq ) and minimumRc value, averagingRc valueswithin 8 s (∼2 spacecraft spins) around the actual minimumof Rc during each crossing. The middle panel shows the dis-tribution of the median in the neutral sheet (equatorialRc)and minimum values of the magnetic field curvature radiusRc, calculated for the selected 67 crossings versusY ′. Theresults show that both flapping amplitude and scaleh havea tendency to increase toward the flanks. For the magneticfield curvature radius this tendency is less pronounced. Onlya very weak correlation (R∼0.2) between the current sheetscalesh and the median curvature radii was found.
An alternative way to obtain a proxy of the current sheethalf-thickness is a fit to the Harris functionBx=BLtanh(Z/λ)
using the lobe fieldBL and the estimated gradient of the mag-
nt l.
|nt
nj|
.
ej l.
nt l.
|nt
nj|
.
ej l.
Fig. 8. Mutual orientation of the main magnetic field directionl,timing normalnt , andnj=l×j/j .
netic field. The Harris scaleλ results from the calculation of∂Bx/∂Z, expressed in the current sheet coordinate system as
λ=BL
∇nBl
[1 −
(Bl
BL
)2]
, (3)
whereBl is the main component of the magnetic field, and∇n is the component of the magnetic field gradient along thenormal. For the 64 selected crossings we estimate〈λ〉 us-ing median value of∇nBl . The relative standard deviationσ(λ)/λ varies in between 0.07 and 2.7. On average, the Har-ris scaleλ is a factor of 2 larger than the scaleh, see Fig. 9(bottom panel).
Figure 10 shows the occurrence rates of the current sheethalf-thicknessesh, magnetic field curvature radii in the neu-tral sheet (equatorialRc), and minimumRc. The estimates

1398 A. Runov et al.: Electric current and magnetic field geometry
'
Fig. 9. Distributions of flapping amplitude (crosses), current sheethalf-thicknesses (circles) and median radii of the magnetic field cur-vature in the NS (Rceq , crosses) and minimumRc (circles) versusY ′ (upper panel); Bottom panel: Comparison of gradient scalesh,calculated according to Eq. (2) and Harris scales, Eq. (3).
of h andRc are normalized to a characteristic plasma scale(the proton thermal gyroradiiLcp, calculated from protontemperature, averaged for each crossing using samples with|Bx |<0.5BL, and the lobe magnetic fieldBL). Lcp variedbetween 130 and 700 km with a mean value of 343 km. Thehalf-thicknessh varies within a rather wide range ofLcp: In38 cases out of 67 (57%) the current sheet was relatively thinwith 1<Z∗/Lcp<10, and in 29 casesZ∗/Lcp>10. No re-lationship was found between the scale estimatesh and thecurrent sheet tilt. The most frequent value of minimumRc
varies in between 1–5 ion thermal gyroradii (Lcp), but themost frequent median value ofRc in the neutral sheet is be-tween 1–10Lcp.
Figure 11 presents distributions of median magnetic field
in the neutral sheetBNS=
√〈By〉
2+〈Bz〉
2 (〈〉 denotes av-eraging within |Bx |<5 nT), and the adiabaticity parame-ter κ=
√min(Rc)/ρp, whereρp=LcpBNS/BL is the proton
thermal gyroradius in the neutral sheet.BNS varies between1.0 and 18.1 nT with the median value of 3.6 nT. Theκ pa-rameter is generally smaller than unity (median value is 0.6)which indicates a non-adiabatic motion of protons in the flap-
min Rc
equatorial Rc
h/
Rc/
Fig. 10. Occurrence rates of current sheet half-thicknessesh andmagnetic field curvature radiiRc (minimum and median in the NS).h andRc are normalized by the characteristic plasma scaleLcp (seedetails in text).
'
Fig. 11. Distributions of the median magnetic field in the neutralsheetBNS (upper panel) and the adiabaticity parameterκ (bottompanel) versusY ′.

A. Runov et al.: Electric current and magnetic field geometry 1399
SH
+ NH
2
2
2
'
Fig. 12.Upper panel: Distributions of the maximum current density(crosses) and median current density in the NS (circles). Bottompanel: Distribution of median values of|j | in the NS and out of theNS.
ping current sheet. BothBNS andκ have a tendency to bemore scattered in the post-midnight sector than in the pre-midnight. No pronounced statistical relationship between theκ-parameter and the current sheet half-thickness was found(R=0.15).
Figure 12 shows distributions of the maximum and mediancurrent density within the neutral sheet (|Bx |<5 nT) for 78crossings (upper panel). As it was mentioned in Sect. 2, thecurrent density value may be underestimated by up to 30%,and values shown in Fig. 12 rather give their lower estimates.The most frequent current density value varies between 5 and10 nA/m2. There is a tendency for the current to be strongerin the dusk sector than at dawn. The largest current densityin our database was observed during a strong storm-time sub-storm on 1 October 2001 (Runov et al., 2003a; Kistler et al.,2005).
To characterize the current density distribution in thesheet we compared the mean values of the current den-sity within the neutral sheet (jNS) and outside the neutralsheet (joff −NS) for the northern (NH, 5<Bx<15 nT) andthe southern (SH,−15<Bx<−5 nT) halves of the currentsheet (Fig. 12, bottom panel). In 55% of the selected cross-ings (43 of 78) the current density is larger in the neu-tral sheet:〈|j |〉NS>〈|j |〉off −NS , in the remaining 35 casesthe current density distribution is off-center. Eight out ofthese 35 cases show a bifurcated current sheet: The meanvalue of the current density in the southern half is compa-rable with the current density in the northern half, namely,〈|j |〉SH <〈|j |〉NH ·(1±0.25). In the other 27 cases the cur-rent sheet is asymmetric with a larger current density in onehemisphere.
6 Discussion
The statistical survey of rapid crossings of the magnetotailcurrent sheet shows that Cluster mainly crosses corrugationsof the sheet surface, similar to the one shown in Fig. 2.The current sheet normalN is tilted in theY−Z plane; ac-cording to the timing analysis, in 54% of the cases stud-ied the tilt angleφ=atan(|Ny |/|Nz|)>45◦. These kink-typewaves, responsible for the sheet’s corrugation, mainly prop-agate dawnward in the post-midnight sector and duskward inthe pre-midnight one, as was shown bySergeev et al.(2004)using only the data from near-flank crossings. Inclusion ofthe near-midnight sector|Y |<8RE , omitted in the previousstudy, generally does not change this conclusion. However,most of the exceptions are located in the evening half ofthe near-midnight sector with 0≤Y ′
≤7RE (Fig. 5). As fol-lows from the timing analysis the flapping wave fronts movemainly perpendicular to the main magnetic field direction,except for several cases within 0≤Y ′
≤7RE . Their normalvelocities vary between a few tens and 300 km/s.
The study of the electric current direction during flappingconfirms the timing results: In 51% of the cases the angle be-tween theZ=0 plane (nominal position of the neutral sheet)and the calculated current density direction is larger than 45◦.In 44 casesjZ was positive and in the other 34jZ<0. The di-rections ofj are mainly perpendicular to the normal obtainedfrom the timing analysis. Therefore, the electric current ge-ometry, described in the example case (Fig. 2) seems to becommon, confirming that flapping is not a simple up-downmotion of a planar current sheet with dawn-dusk directed cur-rent, but is due to current sheet corrugations, moving towardthe flanks perpendicular to the main magnetic field. Somecaution follows from this result: The properties of the currentsheet observed during flapping are properties of the kinkingcurrent sheet, and they may be different from properties of anormal current sheet.
Values of the current density resulting from the linear es-timation of the∇×B are underestimated, because of the rel-atively large inter-spacecraft separation during the 2001 tailperiod, however, typically they are by a factor of 2 largerthan the values obtained by analysis of longer crossings (3.5nA/m2, Zhang et al., 2005) and statistical values of the cur-rent density in the plasma sheet, calculated from measuredion and electron moments (1–3 nA/m2, Kaufmann et al.,2001).
Comparing the current density within and outside the neu-tral sheet, we found that the current sheet during flapping isoften off-center: The main part of the current is shifted fromthe neutral sheet to the northern or southern half of the sheet.A simple check of symmetry, a comparison between mediancurrent density in the Northern and Southern Hemispheres,shows that most frequently the current density has an asym-metric distribution. Similar analysis, performed byAsanoet al.(2005) for non-flapping intervals, yields off-central cur-rent density distribution only in∼20% of the events. Thus,asymmetry seems to be a feature of the kink-like waves, and

1400 A. Runov et al.: Electric current and magnetic field geometry
is most likely a temporal effect rather than a stable feature ofthe current sheet.
The magnetic field curvature is an important factor con-trolling particle and wave motions in the current sheet.Our study shows that the kink-like waves, responsible forflapping, mainly propagate in a magnetic field with posi-tive (Cx>0 − earthward) curvature, that is on closed fieldlines, with minimum curvature radii varying from∼500 to10000 km. Generally, this agrees with the values reported byShen et al.(2003).
The fact that the flapping waves propagate through acurved magnetic field may be crucial for understanding thedriving mechanism of this kinking. Indeed, neither Kelvin-Helmholtz (Nakagawa and Nishida, 1989; Ricci et al., 2004)nor ion-ion kink (Karimabadi et al., 2003) waves propagatein opposite (±Y ) directions from the midnight region. Theinvestigation of MHD eigenmodes of the Harris-type currentsheet without a normal component (e.g.,Lee et al., 1988;Louarn et al., 2004) also did not provide a solution. However,ballooning-like waves, generated in a curved magnetic field,can possibly propagate in oppositeY directions (Golovchan-skaya and Maltsev, 2004). It should be emphasized thatflapping is most likely associated not with regular harmonicwaves, but with a set of isolated kinks, as shown in Sect. 2.Moreover, they exhibit properties of strongly nonlinear os-cillations, i.e. their amplitudes have the same order of mag-nitude as the thickness of the sheet, and wave front over-steepness does not seem rare.
Excitation of large amplitude nonlinear kink waves withphase velocity an order of magnitude less than the thermalion speed have been reported in PIC simulations of the bifur-cated current sheet (Sitnov et al., 2004). These kinks, devel-oping from the instability of the thin bifurcated current sheet,can be transported by plasma flow. The current sheet bifur-cation was observed in 10% of selected cases. We found aweak correlation between theY -component of the averageion velocity and theY -component of the front velocity: Thecorrelation coefficient in the morning sector was R=0.64, andin the evening sector R∼0.5 (only cases withVxy<200 km/swere taken into account). The slope of the linear regressionwas near unity in both sectors. Correlations betweenZ com-ponents of ion and front velocities are much weaker (near0.3) in both sectors.
Crossings with negative (tailward) curvature, most likelyassociated with reconnection, were detected in the eveningpart of the near-midnight sector. High speed ion flows (seeFig. 4), both earthward and tailward, were also detected inthe same part of the magnetotail. This agrees with the mostprobable location of substorm onsets (0<Y<8RE , Nagaiet al., 1998). It is interesting to note that the exceptions fromthe main rule (propagation from midnight toward flanks, seeFig. 5) are also concentrated in this region of the magnetotail.Therefore, sources of the flapping waves, are most likely sit-uated within 0≤Y≤7RE . However, more detailed analysis,including simulations, are needed to verify this observation.
According to our statistical analysis, the minimum radiusof magnetic field, curvature is comparable with the charac-
teristic plasma scaleLcp and the median value ofRc/Lcp
in the neutral sheetRceq∼1–10. The magnetic field in theneutral sheet ranges between 0<Bns<7 nT, and the param-eterκ is less than unity for the largest part of the selectedcrossing, indicating the non-adiabatic character of ion mo-tion in the neutral sheet vicinity (e.g.,Buchner and Zelenyi,1989). However, several crossings with a large curvature ra-diusRc/Lcp≥20 were also found.
The half-thickness of the current sheet during flappingvaries in a broad range from 1 to 20Lcp, with a maximumoccurrence rate at 5–10Lcp. We found no statistical rela-tionship between the current sheet half-thickness and the tiltof the normal.
No close relationship between the minimum curvature ra-dius and the current sheet half-thickness was found. There-fore, the minimum curvature radius should not be used as aproxy of the current sheet half-thickness, as was suggestedby Shen et al.(2003).
7 Conclusions
The analysis of the magnetic field geometry, plasma, andelectric current characteristics was done for 78 rapid cross-ings of the magnetotail current sheet during July–October2001. We found that:
1. Most of the rapid crossings are due to kink-like tran-sients passing over the spacecraft. The normals to thekink fronts are tilted in theY−Z plane. The electric cur-rents exhibit corresponding behavior. The kinks frontsare often close to vertical with|jz|>jy , and sometimesover-steepened (jy<0). They exhibit properties of non-linear waves.
2. The half-thickness of the current sheet during flappingvaries from∼1 to 20 ion thermal gyroradii (calculatedusing the lobe magnetic field). No relationship be-tween half-thickness and tilt of the normal was found.Thus, kinking is not a feature of thin current sheetsonly. In 68 out of 78 cases, the magnetic field curva-ture vector was directed earthward (positive curvature).The minimum curvature radius varies between 500 and10000 km, showing no close relationship with the sheethalf-thickness estimation. In 73% of the crossings theadiabaticity parameterκ, ruling ion motion in the cur-rent sheet, is less than unity.
3. Kinking current sheets often have off-center and asym-metric current distribution across the sheet, so that themain current is shifted from the neutral sheet. Thisseems to be a dynamic feature associated with the flap-ping.
Appendix A
To test the accuracy of the current sheet structure recon-struction described in Sect. 2, we performed a set of test

A. Runov et al.: Electric current and magnetic field geometry 1401
CL2
CL3
CL1
CL4
Vn
0 5 10 15 20 nT
-4 -2 0 2 4
Y, 1000 km
-4 -2 0 2 4
Z*, 1000 km
4
2
0
-2
-4
Z, 1
00
0 k
m
10
8
4
6
2
0
J, n
A/m
2
model
reconstruction*****
Fig. A1. Upper panel: Model of flapping motion of 1-D currentsheet, magnetic field intensity is gray-scale coded. Bottom panel:Model (solid line) and reconstructed (asterisks) profiles of currentdensity.
calculations using a kinematic model of the current sheet.To simplify the calculations we used the 1-D Harris-typemodel: Bx=B0tanh(Zn/λ), By=Bz=0, whereZn is a coor-dinate along the normal to the sheet. It is assumed that sucha current sheet is moving with constant velocity without ro-tation while keeping its structure and scale size.
In the following we use the Cluster tetrahedron con-figuration at 15:30 UT, 12 August 2001 (see example inSect. 4 when the spacecraft separations relative to tetrahe-dron barycenter (in km) were [1021,−287, 490], [−415,1110, 410], [77, 51,−1174] and [−683, −874, 274], cor-respondingly, for spacecraft C1, C2, C3 and C4. Thus,the semiaxes of the corresponding pseudo-ellipsoid area=697.0 km, b=694.5 km and c=629.9 km, the characteristicsize 2a=1394 km, elongation E=0.0036, planarity P=0.0931,and the tetrahedron geometric factorQsr=0.95 (seeRobertet al., 1998b, for definitions).
First, we show an example of calculations for the currentsheet normal corresponding to the crossing at 15:27:40 UT12 August 2001 (see Sect. 4):n=[0.123−0.878 0.462]. Thecurrent sheet normal is tilted by 62.3◦ in the Y-Z plane, by11.3◦ in the X–Y plane and by 14.9◦ in the X–Z plane - seeFig. A1 (upper panel). The model current sheet parameters
0.05 0.1 0.15 0.2 0.25 0.3 0.35 0.4 0.45
dj/jm
0.20
0.25
0.30
0.35
0.40
0.45
0.50
0.55
0.60
me
an
(div
B/c
url
B)
Fig. A2. Average ratio|∇·B|/|∇×B| with standard deviations (er-rorbars) versus relative error of the current density estimate formodelλ=500–4000 km.
areB0=20 nT andλ=2000 km. Model normal translation ve-locity of the current sheet isVn=23.5 km/s. The crossing du-ration isτ=300 s.
We first simulate the magnetic field time series from fourvirtual magnetometers and then calculate the tensor of themagnetic field derivatives using the linear curl estimatortechnique (Chanteur, 1998). Since the minimum varianceanalysis (MVA) cannot be applied to determine a normal vec-tor for the Harris-type current sheet (whereδBz=δBy=0),the sheet normal is estimated by combining MVA and cur-lometer results. From MVA we obtain the maximum vari-ance eigenvectorl, which gives the direction of the mainmagnetic field componentBl (in the example of Fig. A1l=[0.957, −0.134, 0.256]). Based on the known normaldirection we compute the normal component ofBl gradi-ent ∇nBl=∇Bl ·n. To reconstruct the effective vertical co-ordinateZ∗ we integrate the effective translation velocityU=∂tBl[∇nBl]
−1 in time during the crossing and setZ∗=0whereBl=min(|Bl |).
Figure A1 (bottom panel) shows the reconstructed pro-file of the current densityjr(Z
∗) (asterisks) and the modelprofile jm(Z) (solid line). The maximum of the recon-structed current density is max(jr)=9.06 nA/m2, which isby 9% smaller than the model current density maximummax(jm)=10.0 nA/m2. The ratio |divB|/|rotB| is <0.30for 63% of simulated samples. The half-thickness of thereconstructed current density profileHT (half-thickness atjr=0.5max(jr)) equals 2160 km, with a relative error of0.08. The direction of the reconstructed electric current atBx∼0 is ejr=[−0.168, 0.461, 0.871], thusn·ejr=0.02 andl·ejr=7.45·10−8.
Applying multi-point timing analysis (Harvey, 1998) tosimulatedBx time series we obtained the effective nor-mal vectorn∗=[0.117, −0.878, 0.463] and normal veloc-ity V ∗
n =23.6 km/s. Since the normal magnetic field gradi-ent is underestimated by∼10%, the translation velocityUis overestimated. It is varying in time from the minimum

1402 A. Runov et al.: Electric current and magnetic field geometry
0.05
0.1
0.15
0.2
0.25
0.3
0.35
0.4
0
0.1
0.2
0.3
0.4
0.5
0.6
0.7
λ, km
dj/
jmd
HT
/λ
500 1000 1500 2000 2500 3000 3500 4000
Fig. A3. Relative errors of current density (upper panel) and the cur-rent sheet half-thickness (bottom panel) estimates versus the modelsheet half-thickness.
value of 28.5 km/s (at the maximum of∇nB1 ) to the maxi-mum of 30.0 km/s (at∇nB1 minimum, calculations stoppedwhen∇nB<0.5 nT/1000 km). The mean value of the effec-tive translation velocity is 29.5 km/s. The effective width (orflapping amplitude) of the current neutral sheet (S=
∫Udt)
is 9143 km, which is 2100 km larger than the actual widthVnτ=7041 km.
Figure A2 shows the mean values of the normalized diver-gence|∇·B|/|∇×B| for the given set of the current sheet nor-mal and half-thicknesses. The mean normalized divergencedecreases with an increasing ofλ from 0.45 atλ=500 to 0.28atλ=2000 and then stays near this level. Thus, for the struc-tures with scales exceeding the maximum inter-spacecraftseparation the divergence can hardly be a good measure ofcurrent density estimation error.
Summarizing many simulation runs Fig. A3shows the relative error of the current densitydj/jm=(max(jm)− max(jr))/ maxjm (upper panel)and the relative error of the half-thicknessdHT/λ (bottompanel) estimations as functions of model current sheet scaleλ. In the range of 1500–3000 km (most frequent currentsheet scales according to statistical analysis of Sect. 5.4) therelative error of current density estimates varies around 10%and the half-thickness overestimation is between 10%–15%.The effective widthS is overestimated, its relative errorchanged from 70% atλ=1000 km to 25% atλ=4000 km (notshown).
Acknowledgements.We wish to thank H.-U. Eichelberger, G. Laky,L. Kistler, E. Georgescu and E. Penou for help with data and soft-ware, C. Cully, M. Fujimoto, L. Zelenyi, R. Treumann, M. Sit-nov and H. Malova for fruitful discussion. ACE spacecraft dataare provided by N. Ness (Bartol Research Institute) and availableon CDAWeb. This work is supported by INTAS 03-51-3738 grant,by RFBR N 03-02-17533 and N 03-05-20012, by WTZA Austria-Russia N I.1/04 grants, and the Intergeophysics Program. The workby MV was financially supported by the German Bundesminis-terium fur Bildung und Forschung and the Zentrum fur Luft- undRaumfahrt under contracts 50 OC 0104.
Topical Editor T. Pulkkinen thanks C. Mouikis and another ref-eree for their help in evaluating this paper.
References
Asano, Y., Nakamura, R., Baumjohann, W., Runov, A., Voros, Z.,Volwerk, M., Zhang, T. L., Balogh, A., Klecker, B., and Reme,H.: How typical are atypical current sheets?, Geophys. Res. Lett.,32(L03 108), doi:10.1029/2004GL021 834, 2005.
Balogh, A., Carr, C., Acuna, M., Dunlop, M., Beek, T., Brown, P.,Fornacon, K.-H., Georgescu, E., Glassmeier, K.-H., Harris, J.,Musmann, G., Oddy, T., and Schwingenschuh, K.: The Clustermagnetic field investigation: Overview of inflight perfomanceand initial results, Ann. Geophys., 19, 1207–1217, 2001.
Baumjohann, W. and Nakamura, R.: What is Cluster telling usabout magnetotail dynamics, Adv. Space. Res., 99, in press,2005.
Baumjohann, W., Paschmann, G., Scopke, N., Cattell, C., and Carl-son, C.: Average ion moments in the plasma sheet boundarylayer, J. Geophys. Res., 93, 11 507–11 520, 1988.
Baumjohann, W., Paschmann, G., Scopke, N., and Cattell, C.: Av-erage plasma properties in the central plasma sheet, J. Geophys.Res., 94, 6597–6606, 1989.
Buchner, J. and Zelenyi, L.: Regular and chaotic charged parti-cle motion in magnetotaillike field reversals, 1, Basic theory oftrapped motion, J. Geophys. Res., 94, 11 821–11 842, 1989.
Chanteur, G.: Spatial interpolation for four spacecraft: The-ory, in: Analysis Methods for Multi-Spacecraft Data, (Eds.)G. Paschmann and P. Daly, 349–369, ESA, Noordwijk, 1998.
Chanteur, G. and Harvey, C.: Spatial interpolation for four space-craft: Application to magnetic gradients, in: Analysis Methodsfor Multi-Spacecraft Data, (Eds.) G. Paschmann and P. Daly,349–369, ESA, Noordwijk, 1998.
Dunlop, M., Balogh, A., Glassmeier, K., and Robert, P.: Four-pointCluster application of magnetic field analysis tool: The Curlome-ter, J. Geophys. Res., 107, 1384, doi:10.1029/2001JA005 088,2002.
Golovchanskaya, I. and Maltsev, Y.: On the identification of plasmasheet flapping waves observed by Cluster, Geophys. Res. Lett,32(L02 102), doi:10.1029/2004GL021 552, 2004.
Harvey, C.: Spatial gradients and volumetric tensor, in: AnalysisMethods for Multi-Spacecraft Data, (Eds.) G. Paschmann andP. Daly, 307–322, ESA, Noordwijk, 1998.
Hori, T., Maezawa, K., Saito, Y., and Mukai, T.: Average profileof ion flow and convection electric field in the near-Earth plasmasheet, Geophys. Res. Lett., 27, 1623–1626, 2000.
Karimabadi, H., Pritchett, P., Daughton, W., and Krauss-Varban,D.: Ion-ion kink instability in the magnetotail: 2 Three-dimensional full particle and hybrid simulations and com-

A. Runov et al.: Electric current and magnetic field geometry 1403
parison with observations, J. Geophys. Res., 108, 1401,doi:10.1029/2003JA010 109, 2003.
Kaufmann, R., Ball, B., Paterson, W., and Frank, L.: Plasma sheetthickness and electric currents, J. Geophys. Res., 106, 6179–6193, 2001.
Kistler, L., Mouikis, C., Mobius, E., Klecker, B., Sauvaud, J.,Reme, H., Korth, A., Marocci, M., Lundin, R., Parks, G.,and Balogh, A.: The contribution of non-adiabatic ions to thecrosstail current and O+ dominated thin plasma sheet, J. Geo-phys. Res., 110, in press, 2005.
Lee, L., Wang, S., Wei, C., and Tsurutani, B.: Streaming sausage,kink and tearing instabilities in a current sheet with application tothe Earth’s magnetotail, J. Geophys. Res., 93, 7354–7365, 1988.
Louarn, P., Fruit, G., Budnik, E., Sauvaud, J., Jacquey, C., Queau,D., Reme, H., Lucek, E., Balogh, A., et al.: On the propagation oflow frequency fluctuations in the plasmasheet: 1. CLUSTER ob-servations and magnetohydrodynamic analysis, J. Geophys. Res.,109, A03 216, 10.1029/2003JA010 228, 2004.
Lui, A., Meng, C.-I., and Akasofu, S.-I.: Wavy nature of the mag-netotail neutral sheet, Geophys. Res. Lett., 5, 279–282, 1978.
Nagai, T., Fujimoto, M., Saito, Y., Machida, S., Terasawa, T., Naka-mura, R., Yamamoto, T., Mukai, T., Nishida, A., and Kokubun,S.: Structure and dynamics of magnetic reconnection for sub-storm onsets with Geotail observations, J. Geophys. Res., 103,4419–4440, 1998.
Nakagawa, T. and Nishida, A.: Southward magnetic field in the neu-tral sheet produced by wavy motions propagating in the dawn-dusk direction, Geophys. Res. Lett., 16, 1265–1268, 1989.
Nakamura, R., Baumjohann, W., Runov, A., Volwerk, M.,Zhang, T., Klecker, B., Bogdanova, Y., Roux, A., Balogh,A., Reme, H., Sauvaud, J., and Frey, H.: Fast flow dur-ing current sheet thinning, Geophys. Res. Lett., 29, 2140,doi:10.1029/2002GL016 200, 2002.
Petrukovich, A., Baumjohann, W., Nakamura, R., Balogh, A.,Mukai, T., Glassmeier, K.-H., Reme, H., and Klecker, B.: Plasmasheet structure during strongly northward IMF, J. Geophys. Res.,108, 1258, doi:10.1029/2002JA009 738, 2003.
Petrukovich, A., Baumjohann, W., Nakamura, R., Runov, A., andBalogh, A.: Cluster vision of the magnetotail current sheet on amacro-scale, J. Geophys. Res., 110, in press, 2005.
Reme, H., Aostin, C., Bosqued, J., Danduras, I., Lavraud, B.,Sauvaud, J., Barthe, A., Bouyssou, J., Camus, T., Coeur-Joly,O., et al.: First multispacecraft ion measurements in and near theEarth’s magnetosphere with the identical Cluster ion spectrome-try (CIS) experiment, Ann. Geophys, 19, 1303–1354, 2001.
Ricci, P., Lapenta, G., and Brackbill, J.: Structure of themagnetotail current: Kinetic simulation and comparisonwith satellite observations, Geophys. Res. Lett., 31(L06 801),doi:10.1029/2002GL016 136, 2004.
Robert, P., Dunlop, M., Roux, A., and Chanteur, G.: Accuracy ofCurrent Density Determination, in: Analysis Methods for Multi-Spacecraft Data, (Eds.) G. Paschmann and P. Daly, 395–418,ESA, Noordwijk, 1998a.
Robert, P., Harvey, C., Dunlop, M., Daly, P., and Glassmeier, K.-H.: Tetrahedron Geometric Factors, in: Analysis Methods forMulti-Spacecraft Data, (Eds.) G. Paschmann and P. Daly, 323–348, ESA, Noordwijk, 1998b.
Runov, A., Nakamura, R., Baumjohann, W., Treumann, R., Zhang,T., Volwerk, M., Voros, Z., Balogh, A., Glassmeier, K.-H.,Klecker, B., Reme, H., and Kistler, L.: Current sheet structurenear magnetic X-line observed by Cluster, Geophys. Res. Lett.,30, 1579, doi:10.1029/2002GL016 730, 2003a.
Runov, A., Nakamura, R., Baumjohann, W., Zhang, T., Volwerk,M., Eichelberger, H.-U., and Balogh, A.: Cluster observationof a bifurcated current sheet, Geophys. Res. Lett., 30, 1036,doi:10.1029/2002GL016 136, 2003b.
Sanny, J., McPherron, R., Russel, C., Baker, D., Pulkkinen, T., andNishida, A.: Growth-phase thinning of the near-Earth currentsheet during CDAW 6 substorm, J. Geophys. Res., 99, 5805–5816, 1994.
Sergeev, V., Mitchell, D., Russell, C., and Williams, D.: Structureof the tail plasma/current sheet at∼11RE and its changes in thecourse of a substorm, J. Geophys. Res, 98, 17 345–17 365, 1993.
Sergeev, V., Angelopulous, V., Carlson, C., and Sutcliffe, P.: Cur-rent sheet measurements within a flapping plasma sheet, J. Geo-phys. Res, 103, 9177–9188, 1998.
Sergeev, V., Runov, A., Baumjohann, W., Nakamura, R., Zhang,T., Volwerk, M., Balogh, A., Reme, H., Sauvaud, J., Andr,M., and Klecker, B.: Current sheet flapping motion and struc-ture observed by Cluster, Geophys. Res. Lett., 30, 1327,doi:10.1029/2002GL016 500, 2003.
Sergeev, V., Runov, A., Baumjohann, W., Nakamura, R., Zhang,T., Balogh, A., Louarn, P., Sauvaud, J., and Reme, H.: Orienta-tion and propagation of current sheet oscillations, Geophys. Res.Lett., 31(L05 807), doi:10.1029/2003GL019 346, 2004.
Shen, C., Li, X., Dunlop, M., Liu, Z., Balogh, A., Baker,D., Hapgood, M., and Wang, X.: Analysis on the ge-ometrical structure of magnetic field in the current sheetbased on Cluster measurements, J. Geophys. Res., 108, 1168,doi:10.1029/2002JA009 612, 2003.
Sitnov, M., Swisdak, M., Drake, J., Guzdar, P., and Rogers, B.:A model of the bifurcated current sheet: 2. Flapping motion,Geophys. Res. Lett., 31(L09 805), doi:10.1029/2004GL019 473,2004.
Sonnerup, B. and Schneible, M.: Minimum and maximum varianceanalysis, in: Analysis Methods for Multi-Spacecraft Data, (Eds.)G. Paschmann and P. Daly, 185–220, ESA, Noordwijk, 1998.
Speiser, T. and Ness, N.: The neutral sheet in the geomagnetictail: Its motion, equivalent currents, and field line reconnectionthrough it, J. Geophys. Res., 72, 131–141, 1967.
Volwerk, M., Glassmeier, K.-H., Runov, A., Nakamura, R.,Baumjohann, W., Klecker, B., Richter, I., Balogh, A.,Reme, H., and Yumoto, K.: Flow burst induced large-scaleplasma sheet oscillation, J. Geophys. Res., 109(A11 208),doi:10.1029/2004JA010 533, 2004.
Zhang, T., Baumjohann, W., Nakamura, R., Balogh, A., and Glass-meier, K.-H.: A wavy twisted neutral sheet observed by Clus-ter, Geophys. Res. Lett., 29, 1899, doi:10.1029/2002GL015 544,2002.
Zhang, T., Baumjohann, W., Nakamura, R., Runov, A., Volwerk,M., Asano, Y., Voros, Z., Eichelberger, H.-U., Sergeev, V., Shi,J., and Balogh, A.: A statistical survey of the neutral sheet, Adv.Space Res., 99, in press, 2005.