cpe 619 monitors aleksandar milenković the lacasa laboratory electrical and computer engineering...
TRANSCRIPT

CPE 619Monitors
Aleksandar Milenković
The LaCASA Laboratory
Electrical and Computer Engineering Department
The University of Alabama in Huntsville
http://www.ece.uah.edu/~milenka
http://www.ece.uah.edu/~lacasa

2
Part II: Measurement Techniques and Tools
Measurements are not to provide numbers but insight - Ingrid Bucher
Measure computer system performance Monitor the system that is being subjected to a
particular workload How to select appropriate workload
In general performance analysis should know1. What are the different types of workloads?2. Which workloads are commonly used by other analysts?3. How are the appropriate workload types selected?4. How is the measured workload data summarized?5. How is the system performance monitored?6. How can the desired workload be placed on the system in a
controlled manner?7. How are the results of the evaluation presented?
3
Outline
Introduction Terminology Software Monitors Hardware Monitors Monitoring Distributed Systems
4
Monitors
A monitor is a tool used to observe activities on a system
Observe performance Collect performance
statistics May analyze the data May display results May even suggest
remedies
Monitors are used not only by performance analysts
Systems programmer may profile software
System manager may measure resource utilization to find bottleneck
System manager may use to tune system
System analyst may use to characterize workload
System analyst may use to develop models or inputs for models
That which is monitored improves. – Source unknown

5
Outline
Introduction Terminology Software Monitors Hardware Monitors Monitoring Distributed Systems

6
Terminology
Event – a change in the system state E.g.: cache miss, page fault, process context switch, beginning of
seek on a disk, arrival of a packet, Trace – a log of events, usually including the time of the event,
and other important parameters Overhead – most monitors perturb the system operation
Use CPU or storage; Sometimes called artifact. Goal is to minimize artifact
Domain – the set of activities observable by the monitor E.g.: accounting logs record information about CPU time, number
of disks, terminals, networks, paging I/O’s, the number of characters transferred among disks, terminals, networks, and paging devices
7
Terminology (cont’d)
Input rate – the maximum frequency of events that monitor can correctly observe Burst mode: the rate at which an event can occur for a
short period of time Sustained mode: the rate the monitor can tolerate for
long durations Resolution – coarseness of the information observed Input width – the number of bits recorded for each
event. Input rate x width = storage required
8
Monitor Classification
Implementation level Software, Hardware, Firmware, Hybrid
Trigger mechanism Event driven – activated only by occurrence of certain events;
Low overhead for rare event, but higher if event is frequent
Sampling (timer driven) – activated at fixed time intervals by clock interrupts
Ideal for frequent events Display
On-line – provide data continuously. E.g.: tcpdump Batch – collect data for later analysis. E.g.: gprof.
9
Outline
Introduction Terminology Software Monitors Hardware Monitors Monitoring Distributed Systems
10
Software Monitors
Monitor operating systems, and higher level software,
e.g., networks, databases At each activation, several instructions are executed
In general, only suitable for low frequency event or overhead becomes too high
Overhead may be OK if timing does not need to be preserved;
Lower input rates, lower resolutions, and higher overhead than hardware
But, they have higher input widths, higher recording capacities
Easier to develop and modify
11
Issues in Software Monitor Design - Activation Mechanism
How to trigger the data collection routine? 1) Trap – instrument the system software with trap instructions
at appropriate points. Collect data. Like a subroutine. E.g.: to measure I/O service time, trap before I/O service routine
and record time, trap after, take diff 2) Trace – each instruction is followed by data collection
routine (trace mode). Enormous overhead. Time insensitive. E.g., instruction-trace monitor to produce a PC histogram
3) Timer interrupt – a timer interrupt service provided by the OS is used to transfer control to a data collection routine at fixed intervals.
Overhead is independent of the event rate If sampling counter, beware of overflows
12
Issues in Software Monitor Design – Buffer Size
Store recorded data in buffers in memory, which are later written to hard disk
Buffers should be large To minimize the need to write frequently to hard disk
Buffers should be small Don’t have a lot of overhead when write to disk Doesn’t impact performance of system
(or reduced memory availability is not observable) Optimal buffer size is a function of the input rate,
input width, and emptying rate

13
Issues in Software Monitor Design – Number of Buffers
Usually organized in a ring Allows recording (buffer-emptying) process to
proceed at a different rate than monitoring (buffer-filling) process Monitoring may be bursty
Since cannot read while process is writing, a minimum of two buffers required for concurrent access
May be circular for writing so monitor overwrites last if recording process too slow
May compress to reduce space, but adds overhead
14
Issues in Software Monitor Design – Buffer Overflow
In spite of a ring, all buffers could become full Two options (both result in information loss)
Overwrite a previously written buffer Old information is lost
Stop monitoring until a buffer becomes available New information is lost
Trade-off: old vs. new information importance Counter overflows

15
Issues in Software Monitor Design – Misc
Data Compression or Analysis Online compression/processing before storing to
reduce storage requirements On/Off
Most hardware monitors have an on/off switch Software can have “if … then” but still some overhead.
Or can “compile out” E.g.: remove “-pg” flag E.g.: with #define and #ifdef
Priority Asynchronous, then keep low. If timing matters, need
it sufficiently high so doesn’t caus skew
16
Outline
Introduction Terminology Software Monitors Hardware Monitors Monitoring Distributed Systems

17
Hardware Monitors
Hardware monitors -- separate pieces of equipment attached to the system being monitored via probes No system resources are consumed in monitoring
Generally, lower overhead, higher input rate, reduced chance of introducing bugs
Can increment counters, compare values, employ timers, record histograms of observed values … Range from simple logic elements and counters to
sophisticated computer systems Usually, gone through several generations and
testing so is robust

18
Software vs. Hardware Monitors What level of detail to measure?
Software more limited to system layer code (OS, device driver) or application or above
Hardware may not be able to get above information What is input rate? Hardware tends to be faster Expertise?
Good knowledge of hardware needed for hardware monitor Good knowledge of software system (programmer) needed
for software monitor Most hardware monitors can work with a variety of
systems, but software may be system specific Most hardware monitors work when there are bugs,
but software monitors brittle Hardware monitors more expensive
19
Firmware and Hybrid Monitors
Firmware monitors fall between hardware and software monitors
Implemented by modifying the processor microcode Hybrid: combines hardware, firmware, software
monitoring E.g., use hardware components to capture events and
software modules to compress/analyze collected data

20
Outline
Introduction Terminology Software Monitors Hardware Monitors Monitoring Distributed Systems

21
Monitoring Distributed Systems
More difficult than single computer system
Monitor itself must be distributed
Easiest with layered view of monitors
May be zero+ components of each layer
Many-to-many relationship between layers
Management Console Interpretation Presentation Analysis Collection Observation
Distributed system: many hardware and software components working together separately and concurrently
Layered view of a distributed-system monitor
22
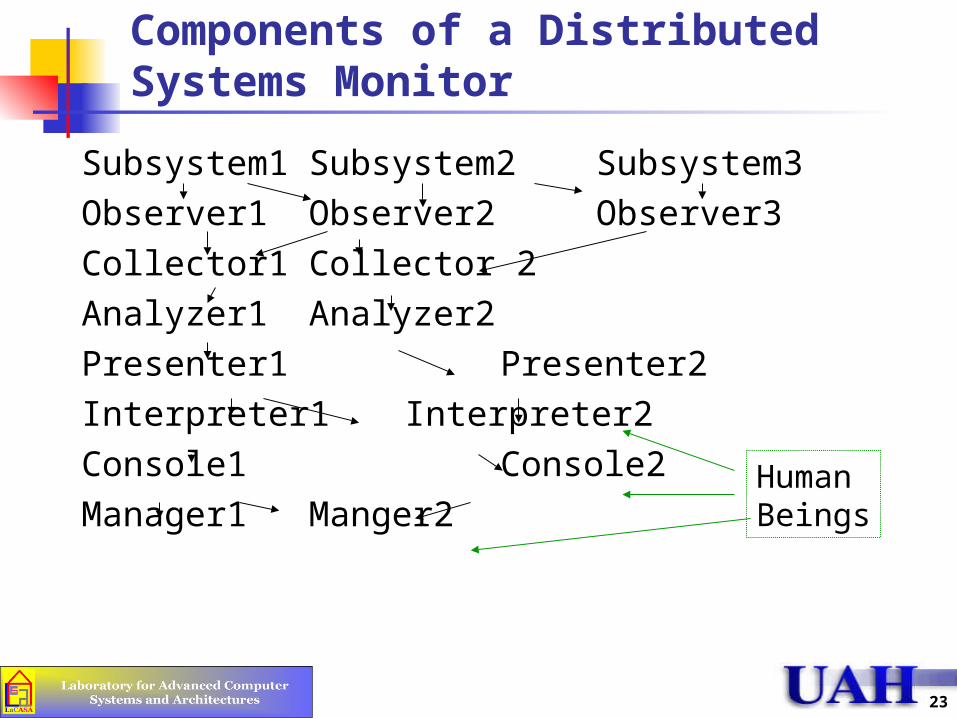
Layered View
Observation – gather raw data on individual components of the system; each component may have an observer designed specifically for it
Collection – collects data from various observers; may have more than one observer on large systems
Analysis – Analyzes data gathered at various collectors. May include various statistical routines to summarize the data characteristics
Presentation – Deals with human user interface (reports, displays, alarms)
Interpretation – Intelligent entity (human or expert system) that can make meaningful interpretations of the data (more sophisticated than simple threshold-based rules)
Console – Interface to control the system parameters and states (outside monitor)
Management – Entity that makes the decision to set or change system parameters or configuration (manager). Implements decisions suing consoles.
23
Components of a Distributed Systems Monitor
Subsystem1 Subsystem2Subsystem3
Observer1 Observer2 Observer3
Collector1 Collector 2
Analyzer1 Analyzer2
Presenter1 Presenter2
Interpreter1 Interpreter2
Console1 Console2
Manager1 Manger2HumanBeings

24
Observation (1 of 2)
Concerned with data gathering Implicit spying – promiscuously observing the
activity on the bus or network link Little impact on existing system Accompany with filters that can ignore some
events E.g.: tcpdump between two IP address
Explicit instrumentation – incorporating trace points, hooks, … Adds overhead, but can augment implicit data E.g.: may have application hooks
logging when data sent

25
Observation (2 of 2)
Probing – making “feeler” requests to see performance E.g.: packet pair techniques to gauge capacity (a
special packet sent to a given destination and looped back may provide info about queuing at the source, intermediate bridges, the destination, and back
There is overlap between the three techniques, but they are not totally redundant -- often one shows a part of the system that others cannot
26
Collection
Data gathering component, perhaps from several observers E.g.: I/O and network observer on one host could
go to one collector for the system May have different collectors share same
observers Collectors can poll observers for data Or observers can advertise when they have data
Clock synchronization can be an issue Usually aggregate over a large interval
to account for skew
27
Analysis
More sophisticated than collector Division of labor unclear, but usually, if fast,
infrequent in observer, but if takes more processing time, put in analyzer
Or, if it requires aggregate data, put in analyzer Ex: if successful transaction rate depends upon
disk error rate and network error rate then analyzer needs data from multiple observers
General philosophy, simplify observers and push complexity to analyzers

28
Presentation (1 of 2)
User interface, closely tied with monitor function Three key functions 1) Performance monitoring – helps quantify if service
provided is correct Throughput, response time, utilization of different
components Summary statistics Time stamped traces
29
Presentation (2 of 2)
2) Error monitoring – incorrect performance Error statistics, counts or traces Maybe sort to help determine what part of system is
unreliable 3) Configuration monitoring – non-performance of the
system components Tell which are up Show initial configurations May show only incremental configurations Scope to allow zoom or whole system

30
Interpretation and Console
Interpreter – uses set of rules to make judgments about state of system Often need expert system to warn about faults before
they occur May suggest configuration changes
Console functions – allow system manager to change system, bring up and down, allow remote diagnostics Ideally, one console can get feedback and apply
configuration, but some parts may be vendor specific
Real-World Examples

32
Performance Tuning
Performance tuning steps 1) Define the performance problem 2) Identify the bottlenecks using
monitoring and measurement tools 3) Remove bottlenecks by applying
a tuning methodology 4) Repeat steps 2 and 3 until
you find a satisfactory resolution

33
Measuring Execution Time
No changes to the program date time
Added to the program code directly clock gettimeofday
Program profilers gprof
34
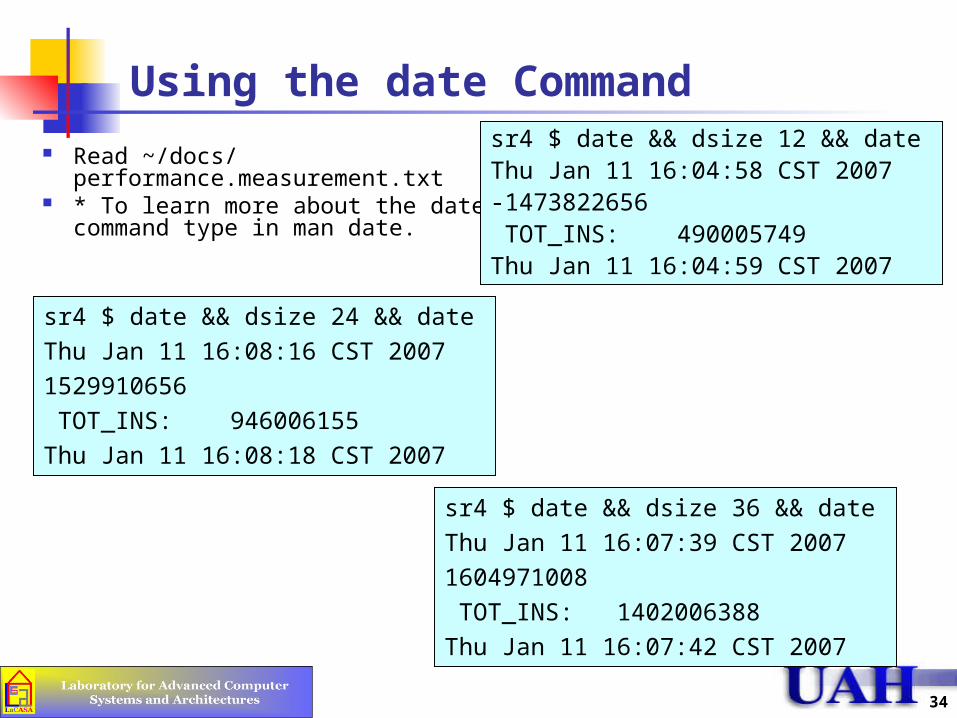
Using the date Command
Read ~/docs/ performance.measurement.txt
* To learn more about the date command type in man date.
sr4 $ date && dsize 12 && dateThu Jan 11 16:04:58 CST 2007-1473822656 TOT_INS: 490005749 Thu Jan 11 16:04:59 CST 2007
sr4 $ date && dsize 24 && date
Thu Jan 11 16:08:16 CST 2007
1529910656
TOT_INS: 946006155
Thu Jan 11 16:08:18 CST 2007
sr4 $ date && dsize 36 && date
Thu Jan 11 16:07:39 CST 2007
1604971008
TOT_INS: 1402006388
Thu Jan 11 16:07:42 CST 2007
35
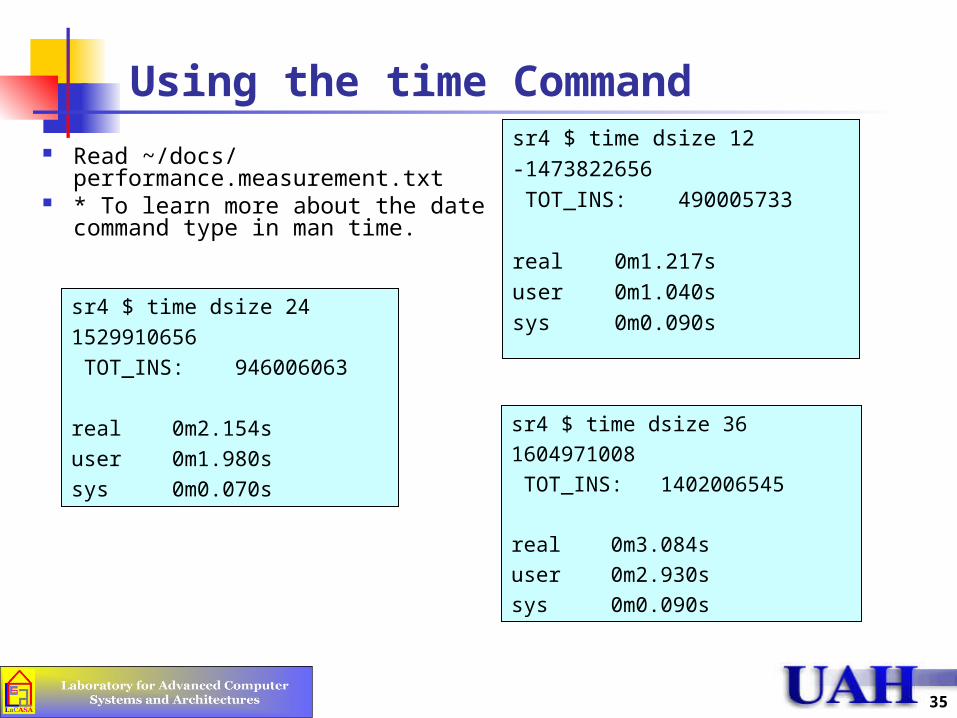
Using the time Command
Read ~/docs/ performance.measurement.txt
* To learn more about the date command type in man time.
sr4 $ time dsize 12
-1473822656
TOT_INS: 490005733
real 0m1.217s
user 0m1.040s
sys 0m0.090ssr4 $ time dsize 24
1529910656
TOT_INS: 946006063
real 0m2.154s
user 0m1.980s
sys 0m0.070s
sr4 $ time dsize 36
1604971008
TOT_INS: 1402006545
real 0m3.084s
user 0m2.930s
sys 0m0.090s

36
Using the clock() Function
The clock() function allows you to measure the time spent in a section of a program
* To learn more about the clock() function type in man clock
* A typical program template for using the clock() function
#include <time.h>
....
int main(void) {
clock_t start_time, finish_time;
...
// determine overhead
start_time = clock();
finish_time = clock();
double delay_time = (double) (finish_time - start_time);
...
start_time = clock();
...// code you want to determine the execution time for
finish_time = clock();
double elapsed_time = finish_time - stat_time - delay_time;
double elapsed_time_sec = elapsed_time/CLOCKS_PER_SEC;
...
}

37
Using the gettimeofday() function
* To learn more about this function type in man gettimeofday
The function gettimeofday returns two integers
The first one indicates the number of seconds from January 1, 1970
and the second returns the number of microseconds since the most recent second boundary.
* A sample program that uses gettimeofday().
#include <stdio.h>
#include <sys/time.h>
struct timeval start, finish ;
int msec;
int main ()
{
gettimeofday (&start, NULL);
sleep (200); /* wait ~ 100 seconds */
gettimeofday (&finish, NULL);
msec = finish.tv_sec * 1000 + finish.tv_usec / 1000;
msec -= start.tv_sec * 1000 + start.tv_usec / 1000;
printf("Time: %d milliseconds\n", msec);
}

38
Program Profiling
Profilers are utility programs used to determine execution profiles,in other words they tell us how much time is spent in each subroutine or function
10-90 rule of thumb states that 10% of your code is responsible for 90% of the program execution time
Tuning the most time-consuming subroutines that dominate execution time can be very rewarding (assuming that we do this right)
The profiler collects the data during the program's execution Typical steps in profiling are as follows:
enable it when compiling and linking programs a profiling data file are generated when the program is executed profiling data are analyzed using gprof

39
Example: gprof
An excerpt from testsort.report:@@@@@@@@@@@@@@@@@@@@@@@@@@@@@@@@@@@@@@@@@@@@@@@@@@@@@@@@@@@@@@@@@@@@@@@@@@@@@@@@@....
granularity: each sample hit covers 4 byte(s) for 0.05% of 21.18 seconds
% cumulative self self total time seconds seconds calls ms/call ms/call name 47.2 9.99 9.99 internal_mcount [5] 36.0 17.61 7.62 5894908 0.00 0.00 partition [4] 11.7 20.08 2.47 70536890 0.00 0.00 swap [6] 2.1 20.52 0.44 1 440.00 10530.00 quicksort [3] 1.6 20.86 0.34 10000000 0.00 0.00 rand [8] 0.8 21.02 0.16 1 160.00 500.00 fillArray [7] 0.8 21.18 0.16 _mcount (665) 0.0 21.18 0.00 24 0.00 0.00 _return_zero [329] 0.0 21.18 0.00 12 0.00 0.00 _mutex_unlock [330] 0.0 21.18 0.00 12 0.00 0.00 mutex_lock [9] 0.0 21.18 0.00 3 0.00 0.00 atexit [10] 0.0 21.18 0.00 3 0.00 0.00 get_mem [11] 0.0 21.18 0.00 2 0.00 0.00 free_mem [12] 0.0 21.18 0.00 1 0.00 0.00 _atexit_init [331]
40
PAPI Interface
Read PAPI documentation athttp://www.ece.uah.edu/~milenka/cpe619-08S/docs/papi.README.ver2.s07.txt
41
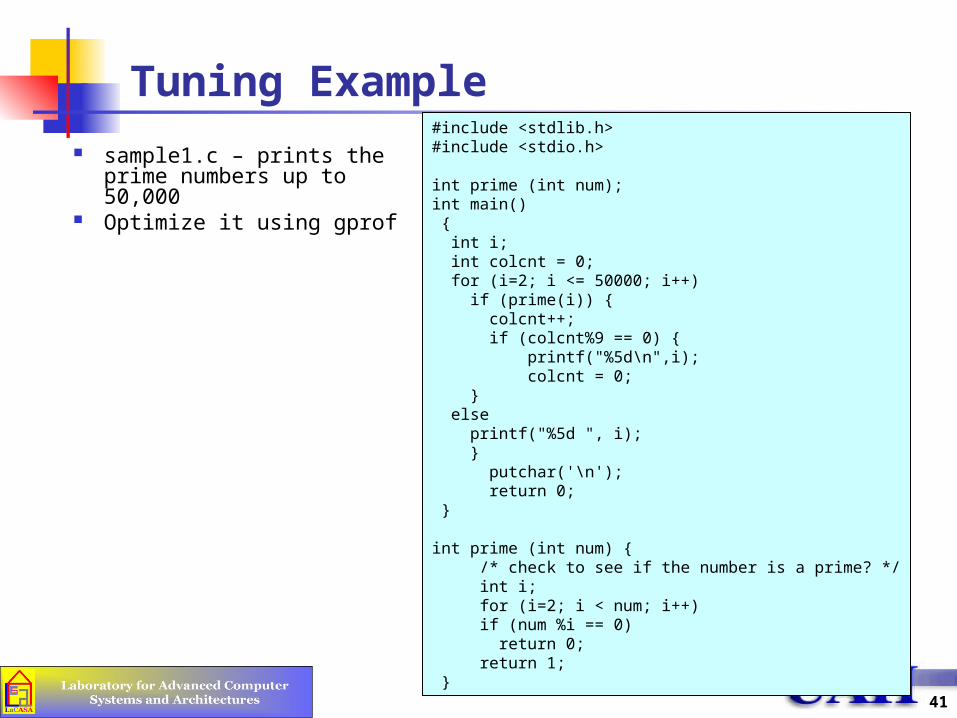
Tuning Example
sample1.c – prints the prime numbers up to 50,000
Optimize it using gprof
#include <stdlib.h>#include <stdio.h> int prime (int num); int main() { int i; int colcnt = 0; for (i=2; i <= 50000; i++) if (prime(i)) { colcnt++; if (colcnt%9 == 0) {
printf("%5d\n",i);colcnt = 0;
} else printf("%5d ", i); } putchar('\n'); return 0; }
int prime (int num) { /* check to see if the number is a prime? */ int i; for (i=2; i < num; i++) if (num %i == 0) return 0; return 1; }
42
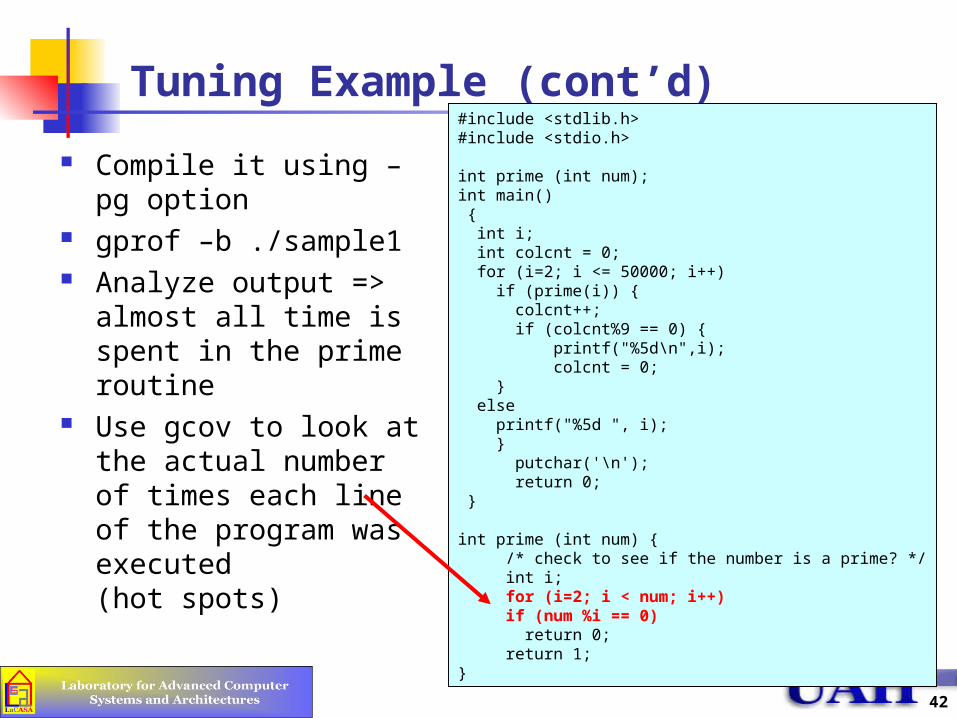
Tuning Example (cont’d)
Compile it using –pg option
gprof –b ./sample1 Analyze output =>
almost all time is spent in the prime routine
Use gcov to look at the actual number of times each line of the program was executed (hot spots)
#include <stdlib.h>#include <stdio.h> int prime (int num);int main() { int i; int colcnt = 0; for (i=2; i <= 50000; i++) if (prime(i)) { colcnt++; if (colcnt%9 == 0) {
printf("%5d\n",i);colcnt = 0;
} else printf("%5d ", i); } putchar('\n'); return 0; }
int prime (int num) { /* check to see if the number is a prime? */ int i; for (i=2; i < num; i++) if (num %i == 0) return 0; return 1;}
43
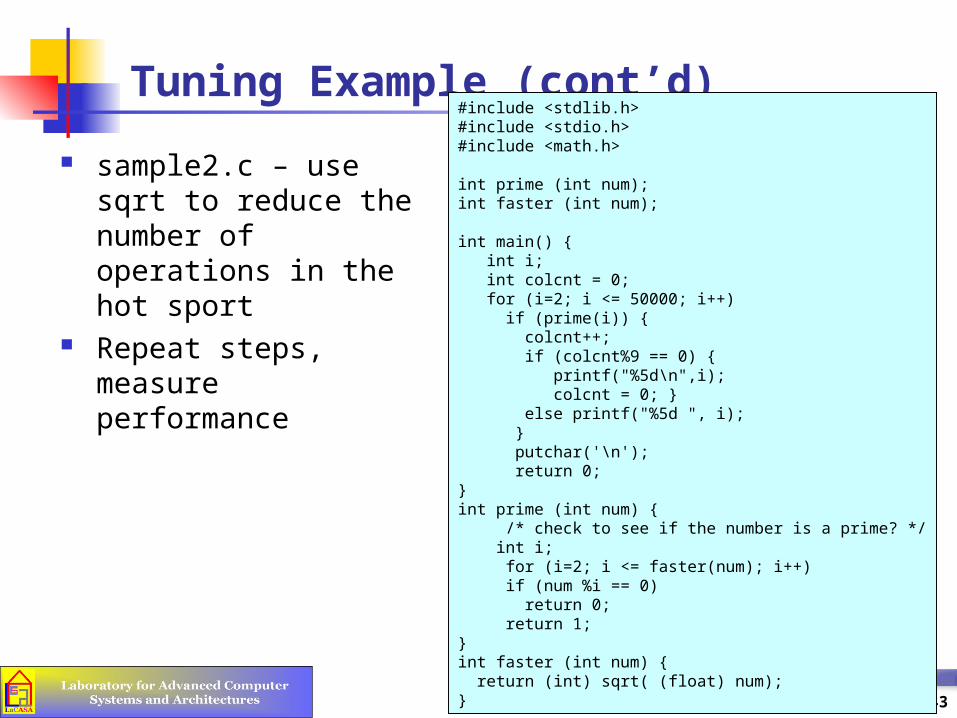
Tuning Example (cont’d)
sample2.c – use sqrt to reduce the number of operations in the hot sport
Repeat steps, measure performance
#include <stdlib.h>#include <stdio.h>#include <math.h>
int prime (int num);int faster (int num);
int main() { int i; int colcnt = 0; for (i=2; i <= 50000; i++) if (prime(i)) { colcnt++; if (colcnt%9 == 0) {
printf("%5d\n",i);colcnt = 0; }
else printf("%5d ", i); } putchar('\n'); return 0;}int prime (int num) { /* check to see if the number is a prime? */ int i; for (i=2; i <= faster(num); i++) if (num %i == 0) return 0; return 1;}int faster (int num) { return (int) sqrt( (float) num);}
44
Homework #3
Read chapters 7 (and 8) Read documents in /docs directory
performance.measurements.txt papi.README.ver2.s07.txt
Write a program that prints first N prime number (N should be input from the command line)
Measure execution time using time command Measure execution time using clock() function Measure the number of clock cycles the program take using PAPI Profile the program using gcov and gprof
Due: Monday, February 4, 2008, 12:45 PM Submit by email to instructor with subject
“CPE619-HW3” Name file as: FirstName.SecondName.CPE619.HW3.doc