covid-19 pandemic increases the divide between cash and
TRANSCRIPT

NBP Working Paper No. 339
COVID-19 pandemic increases the divide between cash and cashless payment users in Europe
Radoslaw Kotkowski, Michal Polasik
Narodowy Bank PolskiWarsaw 2021
NBP Working Paper No. 339
COVID-19 pandemic increases the divide between cash and cashless payment users in Europe
Radoslaw Kotkowski, Michal Polasik
Published by: Narodowy Bank Polski Education & Publishing Department ul. Świętokrzyska 11/21 00-919 Warszawa, Poland www.nbp.pl
ISSN 2084-624X
© Copyright Narodowy Bank Polski 2021
Radoslaw Kotkowski – corresponding author, Narodowy Bank Polski; [email protected];
Michal Polasik – Nicolaus Copernicus University; [email protected]
AcknowledgmentWe would like to thank Mariusz Kapuściński for his invaluable support and constructive comments. Any remaining errors are our own. This paper was funded by the National Science Centre in Poland (Project No. 2017/26/E/HS4/00858). The views and opinions expressed in this article are those of the authors and do not necessarily reflect the official policy or position of Narodowy Bank Polski.

ContentsAbstract 4
1. Introduction 5
2. Data and method 6
3. Results and discussion 10
4. Conclusions 14
References 15
Narodowy Bank Polski4
Abstract
2
Abstract
This paper investigates the way in which the COVID-19 pandemic has changed an
important aspect of everyday life, viz. how people make payments. The empirical study
is based on a survey of over 5,000 respondents from 22 European countries. It shows that
consumers who had been making cashless payments prior to the outbreak of the pandemic
have been even more likely to do so since it broke out. On the other hand, the consumers
who had mostly been paying in cash have often continued to do so. Results indicate that
the usage of banking and payment innovations proved to be the catalyst leading to the
growth of cashless payment usage. The divide between those who pay in cash and those
who do not, therefore, seems to have widened during the pandemic. We found that the
probability of more frequent cashless payments as a result of the pandemic differs
considerably between countries and therefore depends on local conditions. The results
indicate that the pandemic has exacerbated major financial inclusion issues and that this
needs to be addressed by policymakers, but also that further analysis of factors
differentiating usage of cash and the cashless instrument is needed.
JEL Codes: E41, E42, I12, I18
Keywords: COVID-19 pandemic; Cash; Cashless payments; Change in payment
behaviour
5NBP Working Paper No. 339
Chapter 1
3
1. Introduction
Consumer payment behaviour is important for the real economy and the efficiency of the
payment system (Humphrey et al., 2006; Zhang et al., 2019). The ways in which
payments are made depends on a plethora of factors (see e.g. Arango-Arango et al., 2018;
Bagnall et al., 2016; Koulayev et al., 2016; Liñares-Zegarra & Willesson, 2021; van der
Cruijsen & van der Horst, 2019), and changes tend to be incremental (see e.g. ECB
(2020b) and Greene & Stavins (2020) for developments in Europe and the United States
respectively). However, the COVID-19 pandemic (henceforth “the pandemic”), and the
measures imposed by governments to contain it, appear to have had a considerable impact
on consumer payment behaviour. This is most evident in the rapid increase in the adoption
of cashless payments.
By drawing on the data from various national payment systems, Kraenzlin et al. (2020),
Ardizzi et al. (2020) and Bounie et al. (2020) show that the volume of cashless payments
increased in Switzerland, Italy and France during the pandemic, despite an overall decline
in consumption expenditure. A payment diary survey conduct in the Netherlands by
Jonker et al. (2020) shows an increase in debit card use since the onset of the pandemic.
However, this growth is mainly attributable to government restrictions imposed to contain
the pandemic. Wisniewski et al. (2021) show that the decrease in cash transactions was
due to both fear (of getting infections in connection with the use of cash) and new habits
developed during enforced safety measures.
This study primarily aims to investigate how the use of cash prior to the outbreak of the
pandemic have influenced consumer payment behaviour during it. It additionally
examines the extent to which the specificities of particular countries have affected
behavioural changes in payment patterns. The paper is structured as follows: Section 2
presents the data and discusses the methodology; Section 3 presents the empirical results,
and Section 4 concludes our findings.

Narodowy Bank Polski6
Chapter 2
4
2. Data and method
Our analysis is based on a CAWI survey of 5,504 respondents conducted in 22 European
countries between July and August 2020.1 Table 1 presents details on the variables used
and Table 2 contains their descriptive statistics.
Table 1. Variable definition Variable Definition
payment_behaviour_change One of five possible answers to the question "Has the coronavirus pandemic (COVID-19) affected how you pay in physical stores?" These are: 1 – Yes, I make more frequent cashless payments (by card, smartphone, smartwatch); 2 – Yes, I pay more often in cash; 3 – I pay the same way as I did before the pandemic; 4 – I do not know; 5 – I did not make any purchases during the pandemic.
payment_behaviour_change_ordered Ordered payment_behaviour_change variable with the following values assigned: 1 – for answer 1 (change towards cashless payments); 0 – for answer 3 (no change); -1 – for answer 2 (change towards cash payments).
cash_usage Self-reported share of cash transactions in retail payments at physical points-of-sale in the 12 months preceding the COVID-19 pandemic outbreak.
male Dummy variable indicating whether the respondent is male (1) or not (0). age Respondent's age in years. location_size The size of the place of residence of the respondent. Responses are coded
on a 6-point scale: 1 – Rural area; 2 – City with a population of less than 50,000; 3 – City with a population of between 50,000 and 100,000; 4 – City with a population of between 100,000 and 500,000; 5 – City with a population of between 500,000 and 1,000,000; 6 – City with a population of over 1,000,000.
education_years Respondent's years of formal education. income_below_average Dummy variable indicating whether the respondent's income was below
average in his country of residence (1 = yes, 0 = no). mobile_bank Dummy variable indicating whether the respondent had used a mobile
banking application in the 12 months prior to the survey (1 = yes, 0 = no). mobile_payments Dummy variable indicating whether the respondent had used a mobile
payment application (Google Pay, Apple Pay, Samsung Pay, HCE) in the 12 months prior to the survey (1 = yes, 0 = no).
wearables_payments Dummy variable indicating whether the respondent had used contactless payment-enabled wearables (smartwatches, smartbands and systems, e.g., Garmin Pay, Huawei Pay) in the 12 months prior to the survey (1 = yes, 0 = no).
social_networks Dummy variable indicating whether the respondent had a profile on a social media platform (Facebook, Instagram, etc.) (1 = yes, 0 = no).
1 The respondents resided in 20 European Union member states (Croatia, Cyprus, Estonia, Latvia, Luxembourg, Malta, and Slovenia were omitted), the United Kingdom, and Norway.

7NBP Working Paper No. 339
Data and method
5
Table 2. Descriptive statistics Variable Mean SD Min Median Max
payment_behaviour_change_ordered 0.41132 0.61366 -1.00000 0.00000 1.00000cash_usage 0.32716 0.30219 0.00000 0.22766 1.00000 male 0.48074 0.49968 0.00000 0.00000 1.00000 age 47.12581 16.25443 18.00000 47.00000 98.00000 location_size 2.77517 1.57503 1.00000 2.00000 6.00000 education_years 13.85446 3.40651 0.00000 14.00000 25.00000 income_below_avarege 0.12842 0.33459 0.00000 0.00000 1.00000 mobile_bank 0.55444 0.49707 0.00000 1.00000 1.00000 mobile_payments 0.28141 0.44973 0.00000 0.00000 1.00000 wearables_payments 0.12730 0.33334 0.00000 0.00000 1.00000 social_networks 0.80644 0.39513 0.00000 1.00000 1.00000
Note: The variables are defined in Table 1. The number of observations for each of the variables listed above is 5,373.
Our dependent variable (payment_behaviour_change) is based on the response to the
question "Has the coronavirus pandemic (COVID-19) affected how you pay in physical
stores?", which had five possible answers (see Table 1). These were ordered and
the following values assigned:
1 - the respondent paid more frequently in cashless means;
0 - the respondent’s payment behaviour had not changed;
-1 - the respondent paid in cash more frequently.
Respondents who could not answer the question or who stated that they did not make any
purchase during the pandemic were excluded from further investigation. This left 5,373
respondents. The distribution of ordered responses by country is presented in Table 3.
The greatest increase in the proportion of cashless payments was observed in the United
Kingdom and the lowest in Bulgaria. By contrast, the greatest increase in the proportion
of cash payments was observed in Germany and the lowest in Poland and Hungary.

Narodowy Bank Polski8
6
Table 3. Declared change in payment behaviour during COVID-19 pandemic
Country Share 1 0 -1
Austria 40.9% 52.1% 7.0% Belgium 64.6% 27.2% 8.2% Bulgaria 30.1% 59.2% 10.7% Czechia 43.3% 53.3% 3.3% Denmark 43.0% 50.3% 6.7% Finland 41.2% 53.8% 5.0% France 43.1% 48.7% 8.2% Germany 34.7% 48.8% 16.5% Greece 48.0% 46.6% 5.4% Hungary 35.2% 62.1% 2.8% Ireland 64.4% 25.3% 10.3% Italy 40.3% 48.8% 10.8% Lithuania 31.7% 62.1% 6.2% Netherlands 56.7% 35.6% 7.7% Poland 56.9% 40.3% 2.8% Portugal 62.3% 34.2% 3.4% Romania 56.6% 34.5% 9.0% Slovakia 40.1% 55.1% 4.8% Spain 50.2% 44.0% 5.8% Sweden 33.5% 60.7% 5.9% United Kingdom 68.4% 26.0% 5.6% Norway 47.7% 48.7% 3.6% average 47.9% 45.4% 6.7%
Note: The total number of observations is 5,373; 1 denotes a change towards cashless payments, 0 no change declared, and -1 a change towards cash payments. Our main explanatory variable is the self-reported share of cash transactions at physical
points-of-sale in the 12 months preceding the pandemic outbreak (cash_usage). We allow
for a non-linear relationship between the initial share of cash and the respective outcomes
by adding the squared values of the former. Various control variables obtained in the
survey are also used.
Dummy variables have additionally been included for each country (country_dummies).
These are used to cover unobserved or omitted factors.2 We allow for further differences
between countries by adding interaction terms between country dummies and both the
2 e.g. different levels of adoption of cashless payment instruments or development of payment infrastructure (ECB, 2020a), nation-specific payment behaviour (ECB, 2020b), or the severity of the COVID-19 crisis and the policy responses to it (Roser et al., 2020).
9NBP Working Paper No. 339
Data and method
7
cash usage prior to the outbreak of the pandemic (cash_usage) and its square (in addition
to the country dummies themselves).
Ordered logistic regression is used to estimate the relationship between the dependent
variable and the explanatory variables. Four models are used to ensure robustness. The
parameters of the first model are estimated with the main explanatory variable and basic
socio-demographic controls. The second model expands on the first by adding control
variables related to various banking and payment innovations and the use of social media.
The third model adds dummy variables for each country, and the fourth includes the
interaction terms. The full model takes the following form:
𝑦𝑦�∗ = 𝛼𝛼� ∗ casℎ_𝑢𝑢𝑢𝑢𝑢𝑢𝑢𝑢𝑢𝑢� + 𝛼𝛼� ∗ 𝑐𝑐𝑢𝑢𝑢𝑢ℎ_𝑢𝑢𝑢𝑢𝑢𝑢𝑢𝑢𝑢𝑢�� + ∑ 𝛼𝛼�� ∗ 𝑐𝑐𝑐𝑐𝑢𝑢𝑐𝑐𝑐𝑐𝑐𝑐𝑦𝑦 𝑗𝑗������� + ∑ 𝛼𝛼�� ∗ 𝑐𝑐𝑐𝑐𝑢𝑢𝑐𝑐𝑐𝑐𝑐𝑐𝑦𝑦 𝑗𝑗 � ∗���
���
𝑐𝑐𝑢𝑢𝑢𝑢ℎ_𝑢𝑢𝑢𝑢𝑢𝑢𝑢𝑢𝑢𝑢� + ∑ 𝛼𝛼�������� ∗ 𝑐𝑐𝑐𝑐𝑢𝑢𝑐𝑐𝑐𝑐𝑐𝑐𝑦𝑦 𝑗𝑗� ∗ 𝑐𝑐𝑢𝑢𝑢𝑢ℎ_𝑢𝑢𝑢𝑢𝑢𝑢𝑢𝑢𝑢𝑢�� + 𝛼𝛼� ∗ 𝑍𝑍� + 𝜇𝜇�
(1)
where: i identifies the observations (respondents); j identifies the country; n is the number
of countries; Z are the control variables; α are the parameters; μ is the random component
with a logistic distribution; and y* is an unobservable continuous variable which can be
mapped onto the observed, ordinal variable y.

Narodowy Bank Polski10
Chapter 3
3. Results and discussion
Figure 1 presents the distributions of the answers for our dependent variable. The
respondents indicated that they either started to make more cashless payments (47.9% of
the sample) or did not change their behaviour (45.4% of the sample). However, the
responses varied widely between countries (see Table 3). Interestingly, respondents
who usually paid in cash before the outbreak of the pandemic have often continued to
do so, whereas those who usually made cashless payments now do so more frequently.
Table 4 presents the results of our models. The frequency of cash usage prior to the
outbreak of the pandemic, our main explanatory variable, is significant (with a negative
sign), albeit in squared terms. This confirms our earlier observations (Figure 1) that
greater use of cashless instruments has been associated with more cashless payments. The
probability of change toward cashless payments is positively related with years of formal
education and use of innovative banking and payment solutions, and negatively related
with below-average income and maleness. Neither the size of the respondent’s place of
residence nor his/her social network usage seems to have significantly affected payment
behaviour.
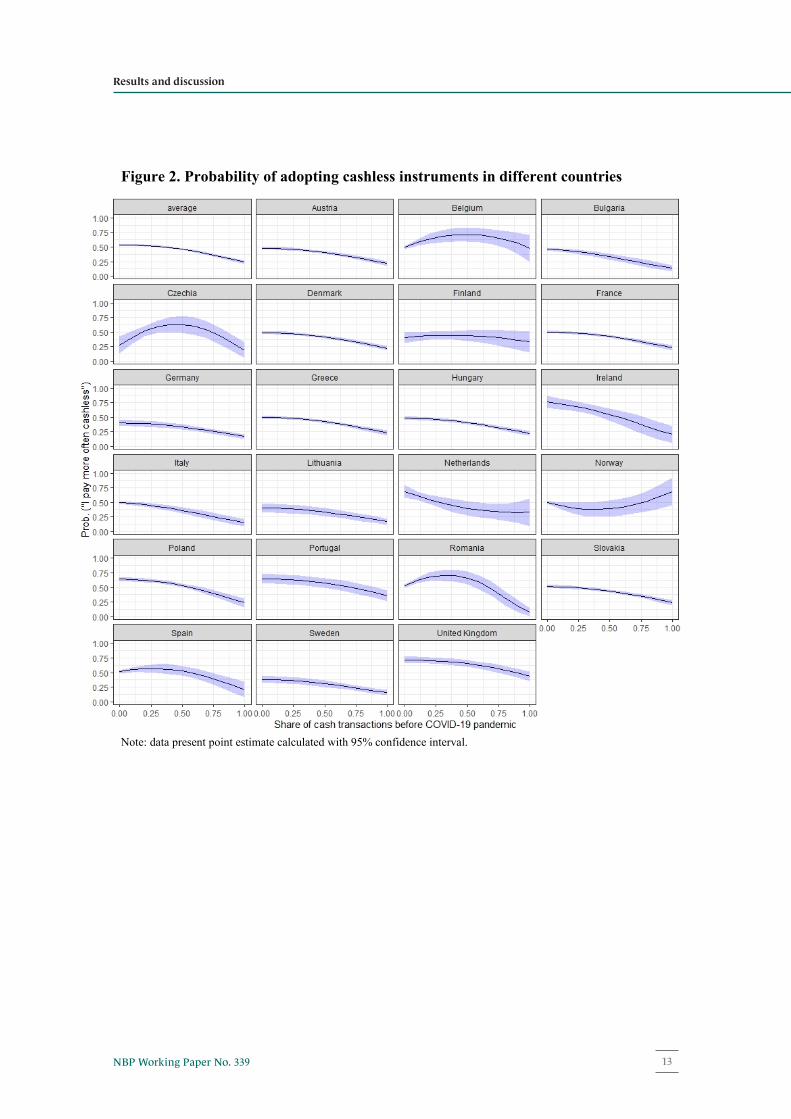
Figure 2 presents the calculated probabilities of making more cashless payments in
response to the pandemic in different countries for various initial proportions of cash
payments. The probability of change is negatively related to the share of cash transactions
prior to the outbreak of the pandemic. However, there are notable exceptions. For
example, in Belgium, Czechia, Romania, and Spain, the probability curves have a
negative parabolic shape whose vertices (i.e. where the probability is greatest) correspond
to an initial cash share of 25-50%. On the other hand, the probabilities of the Netherlands
and Norway exhibit an inverted relationship. Most notably, Norway is the only country
in which (after a slight decline) the probability of making more cashless payments
increases with the initial share of cash payments.
8

11NBP Working Paper No. 339
Results and discussion
9
Figure 1. Distribution of declared change in payment behaviour the during COVID-19 pandemic by country
Note: The total number of observations is 5,373. 1 denotes a change towards cashless payments, 0 no change declared, and -1 a change towards cash payments.
9
Figure 1. Distribution of declared change in payment behaviour the during COVID-19 pandemic by country
Note: The total number of observations is 5,373. 1 denotes a change towards cashless payments, 0 no change declared, and -1 a change towards cash payments.
9
Figure 1. Distribution of declared change in payment behaviour the during COVID-19 pandemic by country
Note: The total number of observations is 5,373. 1 denotes a change towards cashless payments, 0 no change declared, and -1 a change towards cash payments.

Narodowy Bank Polski12
10
Table 4. Estimation output. Dependent variable payment_behaviour_change_ordered (1) (2) (3) (4)
cash_usage -0.5929*(0.3257)
-0.1187(0.3319)
-0.1573(0.3500)
-0.3073(1.5958)
cash_usage-squared -1.0544***(0.3274)
-1.2527***(0.3305)
-1.1527***(0.3415)
-0.9178(1.4888)
male -0.1745***(0.0550)
-0.2217***(0.0560)
-0.2325***(0.0566)
-0.2320***(0.0572)
age -0.0045***(0.0017)
0.0015(0.0018)
0.0015(0.0019)
0.0014(0.0019)
location_size 0.0263(0.0174)
0.0124(0.0176)
0.0121(0.0182)
0.0133(0.0184)
education_years 0.0350***(0.0081)
0.0326***(0.0081)
0.0311***(0.0084)
0.0305***(0.0084)
income_below_average -0.4586***(0.0827)
-0.4259***(0.0833)
-0.3598***(0.0855)
-0.3684(0.0865)
mobile_bank 0.2864*** (0.0611)
0.2808***(0.0622)
0.2835***(0.0629)
mobile_payments 0.2469*** (0.0714)
0.2102***(0.0734)
0.0622**(0.0750)
wearables_payments 0.5712*** (0.0947)
0.5411***(0.0965)
0.1810***(0.0742)
social_networks 0.0776(0.0720)
0.0630(0.0744)
0.5383 (0.0973)
country_dummies No No Yes Yescountry_interactions No No No YesObservations 5373 5373 5373 5373pseudo R-squared 0.0473 0.0581 0.0740 0.0471
Note: Variable definitions can be found in Table 1. In model 4, due to the introduction of country_interactions, parameters on cash_usage and cash_usage-squared are interpreted as an effect for the base country. Standard errors are shown in parentheses. ***, **, * denote statistical significance at 1%, 5% and 10%, respectively.
13NBP Working Paper No. 339
Results and discussion
11
Figure 2. Probability of adopting cashless instruments in different countries
Note: data present point estimate calculated with 95% confidence interval.
11
Figure 2. Probability of adopting cashless instruments in different countries
Note: data present point estimate calculated with 95% confidence interval.
11
Figure 2. Probability of adopting cashless instruments in different countries
Note: data present point estimate calculated with 95% confidence interval.

Narodowy Bank Polski14
Chapter 4
12
4. Conclusions
This paper sheds more light on the change of payment behaviour since the onset of the
pandemic by controlling for country-specific characteristics. Our results lead to two main
conclusions.
Firstly, consumers who had been making cashless payments prior to the outbreak of the
pandemic have often been doing so more frequently since, while those who had preferred
to pay in cash have for the most part continued to do so. This may well indicate financial
inclusion issues that need to be addressed by policymakers, as the divide between those
who do and do not pay in cash seems to have widened since the onset of the pandemic.
Secondly, the change in payment patterns in response to the pandemic varies considerably
between the European countries. This indicates that country-specific factors could be
significant. Further studies could potentially include research on barriers to cash and
cashless payments, such as various levels of adoption of payment methods or the
development of payment infrastructure, size of the shadow economy, cultural differences,
and the impact of the pandemic on consumers in different countries.
15NBP Working Paper No. 339
References
13
References
Arango-Arango, C. A., Bouhdaoui, Y., Bounie, D., Eschelbach, M., & Hernandez, L. (2018). Cash remains top-of-wallet! International evidence from payment diaries. Economic Modelling, 69, 38–48. https://doi.org/10.1016/j.econmod.2017.09.002
Ardizzi, G., Nobili, A., & Rocco, G. (2020). A game changer in payment habits: evidence from daily data during a pandemic (No. 591; Banca d’Italia Occasional Papers). https://www.bancaditalia.it/pubblicazioni/qef/2020-0591/QEF_591_20.pdf
Bagnall, J., Bounie, D., Huynh, K. P., Kosse, A., Schmidt, T., Schuh, S., & Stix, H. (2016). Consumer cash usage: A cross-country comparison with payment diary survey data. International Journal of Central Banking, 12(4), 1–59. https://www.ijcb.org/journal/ijcb16q4a1.pdf
Bounie, D., Camara, Y., & Galbraith, J. W. (2020). Consumers’ mobility, expenditure and online- offline substitution response to Covid-19: evidence from French transaction data (No. 2020S-28; CIRANO Working Papers). https://cirano.qc.ca/files/publications/2020s-28.pdf
ECB. (2020a). ECB Payments Statistics. https://sdw.ecb.europa.eu/reports.do?node=1000004051
ECB. (2020b). Study on the payment attitudes of consumers in the euro area (SPACE). https://www.ecb.europa.eu/pub/pdf/other/ecb.spacereport202012~bb2038bbb6.en.pdf
Greene, C., & Stavins, J. (2020). 2019 Diary of Consumer Payment Choice (No. 20–4; Federal Reserve Bank of Atlanta Research Data Reports). https://doi.org/10.29338/rdr2020-04
Humphrey, D. B., Willesson, M., Bergendahl, G., & Lindblom, T. (2006). Benefits from a changing payment technology in European banking. Journal of Banking & Finance, 30(6), 1631–1652. https://doi.org/10.1016/j.jbankfin.2005.09.009
Jonker, N., van der Cruijsen, C., Bijlsma, M., & Bolt, W. (2020). Pandemic payment patterns (No. 701; DNB Working Paper). https://www.dnb.nl/media/xbrj1xuc/working-paper-no-701.pdf
Koulayev, S., Rysman, M., Schuh, S., & Stavins, J. (2016). Explaining adoption and use of payment instruments by US consumers. RAND Journal of Economics, 47(2), 293–325. https://doi.org/10.1111/1756-2171.12129
Kraenzlin, S., Meyer, C., & Nellen, T. (2020). COVID-19 and regional shifts in Swiss retail payments. Swiss Journal of Economics and Statistics, 156. https://doi.org/10.1186/s41937-020-00061-x
Narodowy Bank Polski16
14
Liñares-Zegarra, J. M., & Willesson, M. (2021). The effects of negative interest rates on cash usage: Evidence for EU countries. Economics Letters, 198, 109674. https://doi.org/10.1016/j.econlet.2020.109674
Roser, M., Ritchie, H., Ortiz-Ospina, E., & Hasell, J. (2020). Coronavirus Pandemic (COVID-19). Our World in Data. https://ourworldindata.org/coronavirus
van der Cruijsen, C., & van der Horst, F. (2019). Cash or card? Unravelling the role of socio-psychological factors. De Economist, 167(2), 145–175. https://doi.org/10.1007/s10645-019-09340-2
Wisniewski, T. P., Polasik, M., Kotkowski, R., & Moro, A. (2021). Switching from cash to cashless payments during the COVID-19 pandemic and beyond (No. 337; NBP Working Papers). https://www.nbp.pl/publikacje/materialy_i_studia/337_en.pdf
Zhang, Y., Zhang, G., Liu, L., De Renzis, T., & Schmiedel, H. (2019). Retail payments and the real economy. Journal of Financial Stability, 44, 100690. https://doi.org/10.1016/j.jfs.2019.100690
www.nbp.pl