coverage technical report
TRANSCRIPT

Catalogue no. 98-303-X2016001 ISBN 978-0-660-26767-8
Census of Population, 2016
Coverage Technical Report
Release date: November 13, 2019

How to obtain more informationFor information about this product or the wide range of services and data available from Statistics Canada, visit our website, www.statcan.gc.ca. You can also contact us by Email at [email protected] Telephone, from Monday to Friday, 8:30 a.m. to 4:30 p.m., at the following numbers:
• Statistical Information Service 1-800-263-1136 • National telecommunications device for the hearing impaired 1-800-363-7629 • Fax line 1-514-283-9350
Depository Services Program
• Inquiries line 1-800-635-7943 • Fax line 1-800-565-7757
Note of appreciationCanada owes the success of its statistical system to a long-standing partnership between Statistics Canada, the citizens of Canada, its businesses, governments and other institutions. Accurate and timely statistical information could not be produced without their continued co-operation and goodwill.
Standards of service to the publicStatistics Canada is committed to serving its clients in a prompt, reliable and courteous manner. To this end, Statistics Canada has developed standards of service that its employees observe. To obtain a copy of these service standards, please contact Statistics Canada toll-free at 1-800-263-1136. The service standards are also published on www.statcan.gc.ca under “Contact us” > “Standards of service to the public.”
Published by authority of the Minister responsible for Statistics Canada
© Her Majesty the Queen in Right of Canada as represented by the Minister of Industry, 2019
All rights reserved. Use of this publication is governed by the Statistics Canada Open Licence Agreement.
An HTML version is also available.
Cette publication est aussi disponible en français.

Statistics Canada – Catalogue no. 98-303-X2016001 iii
Coverage Technical Report
Table of contents
Introduction ............................................................................................................................................................................1
1. Estimates of population coverage errors .......................................................................................................31.1 Introduction .....................................................................................................................................................................31.2 Net undercoverage ........................................................................................................................................................31.3 Undercoverage ...............................................................................................................................................................81.4 Overcoverage ...............................................................................................................................................................12
2. Census universe ...........................................................................................................................................................132.1 Introduction ...................................................................................................................................................................132.2 Population universe .....................................................................................................................................................132.3 Dwelling universe .........................................................................................................................................................132.4 Usual place of residence ............................................................................................................................................14
3. Population coverage error .....................................................................................................................................163.1 Sources ..........................................................................................................................................................................163.2 Control ...........................................................................................................................................................................163.3 Definitions ......................................................................................................................................................................173.4 Evaluation ......................................................................................................................................................................19
4. Census data collection .............................................................................................................................................21
5. Census data processing .........................................................................................................................................22
6. Dwelling Classification Survey (DCS).............................................................................................................236.1 Introduction ...................................................................................................................................................................236.2 Methodology .................................................................................................................................................................23
6.2.1 Stratification and sample selection .................................................................................................................236.2.2 Field interviews ...................................................................................................................................................246.2.3 Processing and estimation ...............................................................................................................................246.2.4 Census whole household imputation (WHI) ..................................................................................................25
6.3 Estimates .......................................................................................................................................................................266.3.1 Unoccupied dwellings .......................................................................................................................................266.3.2 Non-response dwellings ...................................................................................................................................31
7. Reverse Record Check .............................................................................................................................................367.1 Sampling ........................................................................................................................................................................367.2 Processing and classification .....................................................................................................................................41
7.2.1 Processing ..........................................................................................................................................................417.2.2 Classification .......................................................................................................................................................42
iv Statistics Canada – Catalogue no. 98-303-X2016001
Coverage Technical Report
7.3 Collection .......................................................................................................................................................................467.3.1 Environment ........................................................................................................................................................467.3.2 Operations ...........................................................................................................................................................477.3.3 Tracing .................................................................................................................................................................487.3.4 Collection statistics ............................................................................................................................................49
7.4 Estimation ......................................................................................................................................................................537.4.1 Calculating the initial weights ...........................................................................................................................537.4.2 Non-response adjustment ................................................................................................................................537.4.3 Weight calibration of the 2011 Census frame ................................................................................................547.4.4 Post-stratification adjustment for the territories .............................................................................................547.4.5 Adjustment for overcoverage in the 2011 Census frame .............................................................................547.4.6 Weighted distribution by classification ............................................................................................................547.4.7 Calculating the census undercoverage ..........................................................................................................55
8. Census Overcoverage Study (COS) ................................................................................................................588.1 Overview and methodology ........................................................................................................................................588.2 Construction of the sampling frame ..........................................................................................................................59
8.2.1 Input files for the construction of the COS sampling frame .........................................................................598.2.2 Steps in constructing the COS frame ............................................................................................................598.2.3 Step 1: Probabilistic RDB-RDB linkage .........................................................................................................608.2.4 Step 2: Probabilistic RDB-ADMIN linkage ....................................................................................................608.2.5 Step 3: Extension of the sampling frame based on households ................................................................618.2.6 Creation of the sampling units .........................................................................................................................618.2.7 Step 4: Supplement frame ................................................................................................................................61
8.3 Census Overcoverage Study sample design ..........................................................................................................628.3.1 Sample allocation ...............................................................................................................................................628.3.2 Sample from stratum 1 ......................................................................................................................................638.3.3 Sample from stratum 2 ......................................................................................................................................638.3.4 Sample from stratum 3 ......................................................................................................................................648.3.5 Sample from stratum 4 ......................................................................................................................................66
8.4 Collection .......................................................................................................................................................................678.5 Weighting and estimation ...........................................................................................................................................678.6 Final results ...................................................................................................................................................................69
8.6.1 Overcoverage by step .......................................................................................................................................698.6.2 Distribution of overcoverage by scenario .......................................................................................................71
9. Estimation.........................................................................................................................................................................74

Statistics Canada – Catalogue no. 98-303-X2016001 v
Coverage Technical Report
10. Evaluation of coverage studies .......................................................................................................................7610.1 Reverse Record Check .............................................................................................................................................76
10.1.1 Introduction .......................................................................................................................................................7610.1.2 Comparisons with census counts .................................................................................................................7610.1.3 Comparison with demographic estimates ....................................................................................................7710.1.4 Components of population growth ................................................................................................................80
10.2 Census Overcoverage Study ...................................................................................................................................8110.2.1 Comparison of the 2011 and 2016 AMSs ....................................................................................................8110.2.2 Comparison of the 2016 COS and the 2016 AMS .....................................................................................82
10.3 Demographic estimates ............................................................................................................................................8310.3.1 Error of closure .................................................................................................................................................8310.3.2 Accuracy of postcensal estimates .................................................................................................................84
11. Historical estimates of population coverage error ..............................................................................8611.1 Estimates .....................................................................................................................................................................8611.2 Changes in the design of population coverage studies .......................................................................................98
12. Special topics ............................................................................................................................................................10112.1 Collection undercoverage ...................................................................................................................................... 10112.2 Participation of Indian reserves and Indian settlements ................................................................................... 103
12.2.1 Introduction .................................................................................................................................................... 10312.2.2 Incompletely enumerated Indian reserves and Indian settlements ...................................................... 104
Appendix A ‒ Whom to include in the census questionnaire .............................................................105
Appendix B ‒ Reverse Record Check survey questionnaire ..............................................................106
Bibliography .......................................................................................................................................................................107

Statistics Canada – Catalogue no. 98-303-X2016001 1
Coverage Technical Report
Introduction
The 2016 Census required the participation of the entire population of Canada, roughly 36 million people over a territory of nine million square kilometres. Although data collection and processing have to meet rigorous quality standards, it is impossible to eliminate all errors. To use census data correctly and appropriately, it is important to understand the conceptual framework and the definitions used to conduct the census, and the data collection and processing methods. Users also need to know the main sources of error and, where possible, the size of the errors and any unusual circumstances that might limit the usefulness or interpretation of census data. With this information, users can assess the risks associated with using census data to draw conclusions or make decisions.
This technical report examines coverage errors in the 2016 Census. There are two types of coverage errors. The first, called population undercoverage, refers to excluding persons who should have been enumerated. The second, called population overcoverage, refers to either including persons who should not have been enumerated or enumerating persons more than once. In the first instance of overcoverage, the overall error is considered negligible. Undercoverage is generally more common than overcoverage. The net impact of undercoverage and overcoverage on the size of a population of interest is population net undercoverage. Net undercoverage is the number of persons excluded who should have been enumerated (undercoverage) less the number of extra enumerations of persons who were enumerated more than once (overcoverage). Coverage errors are among the most significant types of errors, since they affect the accuracy not only of the counts for the various census universes, but also of all the census data that describe the characteristics of these universes.
Census coverage errors are measured using three studies. The first, the Dwelling Classification Survey (DCS), examines coverage errors resulting from errors in classifying dwellings. Census data are adjusted for this type of coverage error. The second, the Reverse Record Check (RRC), measures population undercoverage, while the third, the Census Overcoverage Study (COS), measures population overcoverage. Census data are not adjusted for the coverage errors measured by the RRC and the COS. Rather, Statistics Canada uses net undercoverage estimates to produce demographic estimates. The 2016 Census studies are quite similar to the 2011 studies, with some changes and improvements.
Census data users should be aware that the presence of coverage errors in the 2016 Census means that census products are subject to incomplete enumeration or double-counting. Undercoverage, for example, is higher for young adult males. For 2016 Census coverage error estimates for various demographic and geographic levels and groupings, see Section 1.
Section 2 covers the 2016 Census conceptual framework and provides definitions of the population universe, the dwelling universe and the usual place of residence that the census aims to measure. Section 3 describes coverage errors, their cause, census practices that minimize them and the conceptual framework used to evaluate them. It also introduces census coverage studies. Section 4 and Section 5 describe the data collection and processing methodology used in the 2016 Census.
Section 6 presents the methodology used during the 2016 DCS and the results obtained. Coverage error rate estimates are produced only for the population universe. Section 7 and Section 8 describe the methodology used for and the results of the 2016 RRC and 2016 COS, respectively. Section 9 shows how the results of the RRC and the COS were combined with census data to produce population coverage error estimates and the associated standard errors.
Section 10 covers the results of evaluations performed for the RRC and the COS, and the evaluation of the error of closure. “Error of closure” refers to the difference between demographic estimates whose base population is the 2011 Census counts, adjusted for net undercoverage, and 2016 Census data, also adjusted for net undercoverage.

2 Statistics Canada – Catalogue no. 98-303-X2016001
Coverage Technical Report
Statistics Canada has conducted census population coverage studies since the first RRC, which dates back to the 1961 Census.1 Section 11 provides a chronological review of coverage errors from the 1971 Census to the 2016 Census.
Section 12 covers additional topics, including the concept of persons not enumerated, and participation by Indian reserves and Indian settlements in the census.
This report was prepared by Melanie Abeysundera, Karen Bruce, Lucia Debroy, Heather Farr, Michel Parenteau, Martin Provost and Martin St-Pierre of the Statistical Integration Methods Division, and Julien Bérard-Chagnon of the Demography Division.
Many people made valuable comments on preliminary versions, which improved the content and readability of the final report.
For additional information on census concepts, variables and geography, please see the Dictionary, Census of Population, 2016, Catalogue no. 98-301-X. For additional information about the census process, please see the reference materials, 2016 Census.
1. The first RRC was conducted in 1961, but there was no frame of persons missed in the previous census. The 1966 RRC used the results of the 1961 RRC to build the frame of persons missed by the 1961 Census.

Statistics Canada – Catalogue no. 98-303-X2016001 3
Coverage Technical Report
1. Estimates of population coverage errors
1.1 Introduction
The census defines the population to be counted and the rules by which the population is to be counted (see Section 3). Coverage errors occur when errors are made relative to these definitions and rules. The main sources of coverage errors include the failure to include a dwelling (and, in turn, failing to include its residents), and respondent error by not including all persons who should be included or by including persons who should not be included. This section presents estimates of 2016 Census population net undercoverage, undercoverage and overcoverage. Undercoverage and overcoverage may lead to bias in official counts and estimates because the characteristics of the persons not included may differ from those of persons who are included, and the characteristics of those counted more than once (duplicates) may differ from those of persons who were counted only once. Net undercoverage indicates the extent to which the number of enumerations included in census data is higher or lower than complete enumeration.
1.2 Net undercoverage
The 2016 Census population net undercoverage rate was estimated at 2.36%.2 In other words, the difference between the number of persons who were not included in the census but were members of the census target population and the number of duplicates was estimated to be 2.36% of the census target population. The population undercoverage rate is estimated at 4.32% (1,557,061 persons), while the population overcoverage rate is estimated at 1.96% (707,335 persons). An undercoverage rate of 4.32% indicates that persons who were not included but who were part of the target population represent 4.32% of the census target population. An overcoverage rate of 1.96% indicates that duplicate enumerations represent 1.96% of the census target population.
The estimated undercoverage and overcoverage rates have both increased compared with the 2011 Census. The net undercoverage rate, which is the difference between undercoverage and overcoverage, increased slightly.
Since the primary goal of census coverage studies is always to produce the best coverage estimates possible for the most recent census, their methodology for the 2016 Census, as described in sections 7 and 8, has been improved. However, these improvements limit the comparability of these estimates with the 2011 net undercoverage estimates and partly explain the difference observed. In addition, since the net undercoverage estimates are measured from samples, the margin of error associated with the 2011 and 2016 estimates may also partly explain the difference.
Table 1.2a Estimated rates of population coverage error and standard errors for Canada, 2011 and 2016 censuses
Coverage error
2011 Census 2016 CensusEstimated
rate Standard
error Estimated
rate Standard
error percent
Undercoverage 4.07 0.16 4.32 0.11Overcoverage 1.85 0.02 1.96 0.04Net undercoverage 2.22 0.16 2.36 0.12Sources: Statistics Canada, 2011 and 2016 census coverage studies.
2. Net undercoverage rates in this report could differ slightly from the rates published on September 27, 2018, because incompletely enumerated Indian reserves and Indian settlements are excluded. All coverage error estimates in this report exclude coverage error for this group.

4 Statistics Canada – Catalogue no. 98-303-X2016001
Coverage Technical Report
This section presents estimates of net undercoverage based on the following geographic and demographic variables:
• province or territory of current residence at the time of the census• age and sex• marital status and sex• mother tongue• census metropolitan area (CMA) of the usual place of residence on Census Day.
Table 1.2b provides an estimate of net undercoverage, standard errors related to the estimate, and the corresponding estimated net undercoverage rate and standard error for various characteristics. Negative net undercoverage estimates indicate that the overcoverage rate was higher than the undercoverage rate. For an explanation of how this can occur, see Section 9.
Table 1.2b Estimated population net undercoverage and standard errors for various characteristics, 2016 Census
Characteristics
Population net undercoverage
Population net undercoverage rate
Estimated number
Standard error
Estimated rate (%)
Standard error (%)
Canada 849,726 43,844 2.36 0.12
Provinces and territoriesNewfoundland and Labrador 9,774 2,015 1.85 0.37Prince Edward Island 3,464 870 2.37 0.58Nova Scotia 17,809 3,042 1.89 0.32New Brunswick 15,735 2,777 2.06 0.36Quebec 35,191 20,613 0.43 0.25Ontario 381,542 33,316 2.76 0.23Manitoba 31,895 4,829 2.43 0.36Saskatchewan 34,844 4,651 3.07 0.40Alberta 115,968 13,530 2.77 0.31British Columbia 197,267 16,561 4.07 0.33Yukon 2,370 191 6.20 0.47Northwest Territories 2,939 257 6.57 0.54Nunavut 929 229 2.52 0.61
Sex and age groupBoth sexes 849,726 43,844 2.36 0.120 to 4 years 39,490 10,957 2.04 0.555 to 14 years -21,669 17,139 -0.55 0.4415 to 17 years 13,248 10,734 1.10 0.8818 to 19 years 38,895 12,407 4.44 1.3520 to 24 years 146,524 16,731 6.13 0.6625 to 34 years 316,263 24,223 6.41 0.4635 to 44 years 186,685 20,988 3.95 0.4345 to 54 years 138,593 21,814 2.68 0.4155 to 64 years 37,802 22,145 0.76 0.4465 years and older -46,105 18,152 -0.78 0.31

Statistics Canada – Catalogue no. 98-303-X2016001 5
Coverage Technical Report
Table 1.2b Estimated population net undercoverage and standard errors for various characteristics, 2016 Census
Characteristics
Population net undercoverage
Population net undercoverage rate
Estimated number
Standard error
Estimated rate (%)
Standard error (%)
Males 593,549 37,058 3.32 0.200 to 4 years 26,543 7,531 2.66 0.735 to 14 years -23,070 12,405 -1.16 0.6315 to 17 years 2,548 8,052 0.42 1.3118 to 19 years 21,721 9,082 4.82 1.9220 to 24 years 102,117 13,265 8.19 0.9825 to 34 years 203,361 18,612 8.15 0.6835 to 44 years 117,649 16,236 5.03 0.6645 to 54 years 102,971 16,493 3.99 0.6155 to 64 years 46,128 17,662 1.89 0.7165 years and older -6,418 11,950 -0.24 0.45Females 256,177 35,347 1.41 0.190 to 4 years 12,947 8,983 1.38 0.945 to 14 years 1,402 12,591 0.07 0.6515 to 17 years 10,701 6,928 1.81 1.1518 to 19 years 17,174 8,688 4.04 1.9620 to 24 years 44,407 10,510 3.89 0.8825 to 34 years 112,901 15,678 4.64 0.6135 to 44 years 69,036 13,705 2.89 0.5645 to 54 years 35,622 15,089 1.37 0.5755 to 64 years -8,326 13,557 -0.33 0.5465 years and older -39,687 14,183 -1.24 0.45
Marital status and sex for persons aged 15 years and olderBoth sexes 831,905 41,831 2.76 0.13Married (not separated) 68,469 26,934 0.51 0.20Common law 73,765 16,456 2.06 0.45Single (never legally married) 555,623 31,295 6.31 0.33Separated 94,350 15,674 11.61 1.70Divorced 28,443 13,364 1.54 0.71Widowed 11,254 13,635 0.69 0.83Males 590,076 35,333 3.97 0.23Married (not separated) 69,986 19,599 1.03 0.29Common law 47,907 12,563 2.65 0.68Single (never legally married) 360,923 24,751 7.51 0.48Separated 66,411 13,519 17.65 2.96Divorced 36,658 9,814 4.81 1.23Widowed 8,193 5,485 2.36 1.54Females 241,829 32,755 1.58 0.21Married (not separated) -1,516 19,369 -0.02 0.29Common law 25,859 11,561 1.45 0.64

6 Statistics Canada – Catalogue no. 98-303-X2016001
Coverage Technical Report
Table 1.2b Estimated population net undercoverage and standard errors for various characteristics, 2016 Census
Characteristics
Population net undercoverage
Population net undercoverage rate
Estimated number
Standard error
Estimated rate (%)
Standard error (%)
Single (never legally married) 194,701 22,908 4.86 0.54Separated 27,940 8,965 6.40 1.92Divorced -8,215 8,905 -0.76 0.83Widowed 3,061 12,314 0.24 0.95
Mother tongueTotal 849,726 43,844 2.36 0.12English 365,400 35,034 1.79 0.17French 3,256 20,318 0.04 0.27Non-official language 481,070 30,079 5.88 0.35
Census metropolitan area (CMA)St. John’s 4,316 1,473 2.05 0.69Halifax 9,601 2,410 2.32 0.57Moncton 1,619 1,557 1.11 1.05Saint John 5,164 1,681 3.93 1.23Saguenay 3,381 4,576 2.06 2.73Québec -16,916 6,237 -2.16 0.81Sherbrooke -1,796 4,354 -0.85 2.09Trois-Rivières 1,163 4,143 0.74 2.62Montréal 44,633 17,183 1.08 0.41Ottawa–Gatineau 1,733 10,310 0.13 0.78Kingston 4,609 4,470 2.78 2.62Belleville 4,155 3,231 3.86 2.89Peterborough -4,350 2,185 -3.71 1.93Oshawa 14,914 8,303 3.78 2.02Toronto 262,847 26,870 4.25 0.42Hamilton 12,403 10,987 1.63 1.42St. Catharines–Niagara 10,746 8,698 2.58 2.03Kitchener–Cambridge–Waterloo 12,326 7,410 2.30 1.35Brantford -296 3,291 -0.22 2.46Guelph 2,877 3,892 1.86 2.47London 5,928 6,659 1.19 1.32Windsor 8,383 6,703 2.48 1.94Barrie 4,978 4,324 2.46 2.09Greater Sudbury -934 3,182 -0.57 1.95Thunder Bay 6,668 4,455 5.20 3.29Winnipeg 11,143 4,093 1.41 0.51Regina 5,060 2,403 2.09 0.97Saskatoon 12,047 3,224 3.92 1.01Lethbridge -938 2,645 -0.81 2.29Calgary 28,409 8,971 2.00 0.62

Statistics Canada – Catalogue no. 98-303-X2016001 7
Coverage Technical Report
Table 1.2b Estimated population net undercoverage and standard errors for various characteristics, 2016 Census
Characteristics
Population net undercoverage
Population net undercoverage rate
Estimated number
Standard error
Estimated rate (%)
Standard error (%)
Edmonton 27,659 8,722 2.05 0.63Kelowna 6,145 3,886 3.06 1.87Abbotsford–Mission 8,807 3,800 4.65 1.91Vancouver 111,040 14,245 4.31 0.53Victoria 18,107 6,127 4.69 1.51All CMAs 625,631 40,612 2.45 0.15Outside a CMA 224,096 29,333 2.15 0.28Sources: Statistics Canada, 2016 Census, 2016 Reverse Record Check and 2016 Census Overcoverage Study.
The standard error provides an indication of the accuracy of sampling-based estimates. An interval covering two standard errors on both sides of the estimate includes the correct value 19 times out of 20. In other words, there are approximately 19 chances out of 20 (95%) that the actual population net undercoverage rate for the 2016 Census was between 2.12% and 2.60% (i.e., 2.36% ± two standard errors), or about 2 chances out of 3 (68%) that the actual rate was between 2.24% and 2.48% (i.e., 2.36% ± one standard error).
Since net undercoverage reflects both undercoverage and overcoverage, the reader should also consult the undercoverage and overcoverage estimates in Table 1.3. A low net undercoverage rate, for example, may reflect a low undercoverage rate, or a high undercoverage rate combined with a high overcoverage rate.
The highest population net undercoverage rates in the country were observed in two of the three territories: the Northwest Territories, which had the highest rate (6.57%), followed by Yukon (6.20%). Among the provinces, British Columbia had the highest net undercoverage rate, 4.07%, followed by Saskatchewan (3.07%), Alberta (2.77%) and Ontario (2.76%). Quebec had the lowest population net undercoverage rate, at 0.43%, followed by Newfoundland and Labrador (1.85%) and Nova Scotia (1.89%). In 2011, the highest rates were observed in the three territories, while New Brunswick had the lowest rate. As previously mentioned, improvements made to the methodology of the 2016 Census coverage studies limit the comparability of estimates with those of 2011 net undercoverage.
Population net undercoverage was generally higher for males, and highest for young adults. The net undercoverage rate for males was more than twice the rate for females, 3.32% compared with 1.41%. In the general population, net undercoverage was highest in the 20 to 34 age group for both men and women. It stood at 6.13% among persons aged 20 to 24, and 6.41% among those aged 25 to 34. For men, the highest net undercoverage rate was 8.19% among men aged 20 to 24, and 8.15% among men aged 25 to 34. For women, this rate reached 4.64% among those aged 25 to 34. Contrary to what was observed among men, the net undercoverage rate of women aged 20 to 24 was quite similar to the rate noted for women aged 18 to 19 (3.89%, compared with 4.04%). For women aged 55 and older and men aged 65 and older, the net undercoverage rate was negative, which indicates more excess enumerations than persons who were not enumerated.
The net undercoverage rate of the population aged 15 and older was higher for separated persons (11.61%), especially for males (17.65%). It was also high for single persons (6.31%), i.e., persons who had never legally married and who were not in a common-law union.
The net undercoverage rate for those whose mother tongue is English was higher than for those whose mother tongue is French (1.79%, compared with 0.04%). The net undercoverage rate for allophones, persons whose mother tongue is neither English nor French, was higher (5.88%).

8 Statistics Canada – Catalogue no. 98-303-X2016001
Coverage Technical Report
Net population undercoverage was slightly more frequent in CMAs than outside them. Nationally, net undercoverage was 2.45% for those who should have been enumerated in CMAs. This was slightly higher than the net undercoverage rate for those not living in a CMA (2.15%). Only Manitoba and Alberta had a higher rate outside CMAs than within them.
1.3 Undercoverage
Undercoverage generally referred to persons who were not included as usual residents in the questionnaire that was completed for their usual residence, or persons for whom no questionnaire was completed for their usual residence. For example, persons who regarded their residence as temporary may not have been included as usual residents elsewhere. Persons without a usual place of residence (e.g., the homeless) were also much more subject to undercoverage.
This section presents undercoverage estimates based on the following geographic and demographic variables:
• province or territory of current residence at the time of the census• age and sex• marital status and sex• mother tongue• census metropolitan area (CMA) of the usual place of residence on Census Day.
Table 1.3 provides the estimated undercoverage regarding the number of persons not included, the standard error of the estimate, the corresponding estimated undercoverage rate, and its standard error. In some instances, undercoverage estimates are negative (e.g., -1,269 persons in the Peterborough CMA). For an explanation of how this can occur, see Section 9.
Table 1.3 Estimated population undercoverage and overcoverage and standard errors for various characteristics, 2016 Census
Characteristics
Population undercoverage Population overcoverageEstimated
numberStandard
errorEstimated
rate (%)Standard error (%)
Estimated number
Standard error
Estimated rate (%)
Standard error (%)
Canada 1,557,061 41,050 4.32 0.11 707,335 15,401 1.96 0.04
Provinces and territoriesNewfoundland and Labrador 20,848 1,982 3.94 0.36 11,074 364 2.09 0.07Prince Edward Island 5,875 864 4.01 0.57 2,412 100 1.65 0.07Nova Scotia 34,872 2,965 3.70 0.30 17,063 684 1.81 0.07New Brunswick 32,382 2,701 4.24 0.34 16,647 644 2.18 0.08Quebec 211,077 18,074 2.57 0.21 175,886 9,911 2.15 0.12Ontario 640,831 31,508 4.63 0.22 259,289 10,826 1.87 0.08Manitoba 51,742 4,772 3.95 0.35 19,847 736 1.51 0.06Saskatchewan 56,494 4,375 4.99 0.37 21,651 1,579 1.91 0.14Alberta 188,706 13,293 4.51 0.30 72,739 2,522 1.74 0.06British Columbia 305,948 16,215 6.31 0.31 108,681 3,366 2.24 0.07Yukon 3,219 188 8.42 0.45 849 32 2.22 0.08Northwest Territories 3,500 255 7.83 0.53 561 29 1.25 0.06Nunavut 1,565 228 4.25 0.59 636 27 1.73 0.07

Statistics Canada – Catalogue no. 98-303-X2016001 9
Coverage Technical Report
Table 1.3 Estimated population undercoverage and overcoverage and standard errors for various characteristics, 2016 Census
Characteristics
Population undercoverage Population overcoverageEstimated
numberStandard
errorEstimated
rate (%)Standard error (%)
Estimated number
Standard error
Estimated rate (%)
Standard error (%)
Sex and age groupBoth sexes 1,557,061 41,050 4.32 0.11 707,335 15,401 1.96 0.040 to 4 years 73,537 10,269 3.79 0.51 34,047 3,823 1.76 0.195 to 14 years 115,279 15,125 2.94 0.37 136,948 8,061 3.49 0.2015 to 17 years 52,294 9,823 4.35 0.78 39,046 4,328 3.25 0.3518 to 19 years 67,506 11,878 7.71 1.25 28,612 3,586 3.27 0.4020 to 24 years 230,347 15,422 9.64 0.58 83,822 6,488 3.51 0.2625 to 34 years 424,019 22,742 8.60 0.42 107,757 8,342 2.19 0.1735 to 44 years 239,817 20,305 5.07 0.41 53,132 5,310 1.12 0.1145 to 54 years 199,652 21,216 3.86 0.39 61,059 5,073 1.18 0.1055 to 64 years 109,145 21,011 2.21 0.42 71,343 6,995 1.44 0.1465 years and older 45,465 17,172 0.77 0.29 91,570 5,885 1.55 0.10Males 941,799 34,853 5.27 0.18 348,250 12,593 1.95 0.070 to 4 years 42,169 7,140 4.22 0.68 15,626 2,397 1.56 0.245 to 14 years 46,881 10,944 2.35 0.54 69,951 5,842 3.50 0.2815 to 17 years 27,918 7,153 4.55 1.11 25,370 3,696 4.14 0.5818 to 19 years 33,232 8,857 7.38 1.82 11,511 2,008 2.56 0.4420 to 24 years 142,866 12,392 11.46 0.88 40,749 4,731 3.27 0.3725 to 34 years 260,481 17,559 10.44 0.63 57,119 6,169 2.29 0.2435 to 44 years 145,997 15,790 6.24 0.63 28,349 3,778 1.21 0.1645 to 54 years 133,156 16,114 5.16 0.59 30,185 3,514 1.17 0.1355 to 64 years 76,049 16,959 3.11 0.67 29,921 4,931 1.22 0.2065 years and older 33,050 11,254 1.23 0.41 39,468 4,019 1.47 0.15Females 615,262 33,151 3.39 0.18 359,085 12,265 1.98 0.070 to 4 years 31,368 8,465 3.34 0.87 18,421 3,005 1.96 0.315 to 14 years 68,398 11,173 3.56 0.56 66,996 5,806 3.49 0.2915 to 17 years 24,376 6,540 4.13 1.06 13,675 2,287 2.32 0.3818 to 19 years 34,274 8,159 8.07 1.77 17,100 2,988 4.02 0.6820 to 24 years 87,480 9,473 7.66 0.77 43,073 4,551 3.77 0.3825 to 34 years 163,539 14,560 6.71 0.56 50,637 5,813 2.08 0.2335 to 44 years 93,820 13,180 3.93 0.53 24,784 3,759 1.04 0.1645 to 54 years 66,496 14,635 2.56 0.55 30,874 3,675 1.19 0.1455 to 64 years 33,096 12,585 1.32 0.50 41,422 5,042 1.66 0.2065 years and older 12,415 13,484 0.39 0.42 52,102 4,398 1.63 0.14
Marital status and sex for persons aged 15 years and olderBoth sexes 1,368,245 39,208 4.54 0.12 536,340 14,579 1.78 0.05Married (not separated) 256,069 25,184 1.90 0.18 187,600 9,550 1.39 0.07Common law 128,097 15,578 3.57 0.42 54,332 5,304 1.52 0.15Single (never legally married) 786,318 29,629 8.93 0.31 230,695 10,077 2.62 0.11

10 Statistics Canada – Catalogue no. 98-303-X2016001
Coverage Technical Report
Table 1.3 Estimated population undercoverage and overcoverage and standard errors for various characteristics, 2016 Census
Characteristics
Population undercoverage Population overcoverageEstimated
numberStandard
errorEstimated
rate (%)Standard error (%)
Estimated number
Standard error
Estimated rate (%)
Standard error (%)
Separated 105,874 15,446 13.03 1.65 11,523 2,665 1.42 0.32Divorced 53,142 12,934 2.88 0.68 24,700 3,362 1.34 0.18Widowed 38,744 13,284 2.36 0.79 27,491 3,074 1.68 0.18Males 852,749 33,437 5.74 0.21 262,673 11,418 1.77 0.08Married (not separated) 160,201 18,513 2.37 0.27 90,216 6,433 1.33 0.09Common law 73,759 12,009 4.08 0.64 25,852 3,687 1.43 0.20Single (never legally married) 487,170 23,395 10.14 0.44 126,248 8,079 2.63 0.16Separated 72,153 13,337 19.17 2.87 5,742 2,212 1.53 0.58Divorced 47,567 9,613 6.24 1.18 10,909 1,979 1.43 0.26Widowed 11,899 5,451 3.42 1.51 3,706 607 1.07 0.17Females 515,496 30,822 3.37 0.19 273,668 11,087 1.79 0.07Married (not separated) 95,868 17,884 1.43 0.26 97,384 7,439 1.46 0.11Common law 54,338 10,883 3.06 0.59 28,480 3,901 1.60 0.22Single (never legally married) 299,148 21,936 7.47 0.51 104,447 6,602 2.61 0.16Separated 33,720 8,840 7.73 1.87 5,781 1,487 1.32 0.34Divorced 5,576 8,477 0.52 0.78 13,791 2,730 1.27 0.25Widowed 26,846 11,939 2.08 0.90 23,785 3,015 1.84 0.23
Mother tongueTotal 1,557,061 41,050 4.32 0.11 707,335 15,401 1.96 0.04English 757,966 33,420 3.71 0.16 392,566 10,514 1.92 0.05French 169,888 17,760 2.29 0.23 166,632 9,871 2.25 0.13Non-official language 629,206 28,795 7.69 0.33 148,137 8,694 1.81 0.10
Census metropolitan area (CMA)St. John’s 9,638 1,432 4.58 0.65 5,322 347 2.53 0.16Halifax 15,829 2,388 3.83 0.56 6,228 329 1.51 0.08Moncton 4,573 1,535 3.12 1.02 2,954 261 2.02 0.18Saint John 7,647 1,667 5.82 1.19 2,483 220 1.89 0.17Saguenay 7,591 4,265 4.62 2.48 4,210 1,657 2.56 0.98Québec 653 5,225 0.08 0.67 17,569 3,405 2.24 0.43Sherbrooke 3,850 3,866 1.83 1.80 5,646 2,005 2.68 0.93Trois-Rivières 5,611 3,719 3.57 2.28 4,448 1,825 2.83 1.13Montréal 124,215 15,608 3.00 0.37 79,582 7,186 1.92 0.17Ottawa–Gatineau 24,514 9,599 1.85 0.71 22,781 3,762 1.72 0.28Kingston 7,695 4,318 4.64 2.48 3,086 1,155 1.86 0.69Belleville 4,900 3,220 4.55 2.86 746 264 0.69 0.24Peterborough -1,269 1,820 -1.08 1.57 3,080 1,208 2.62 1.00Oshawa 19,520 8,162 4.94 1.97 4,606 1,524 1.17 0.38

Statistics Canada – Catalogue no. 98-303-X2016001 11
Coverage Technical Report
Table 1.3 Estimated population undercoverage and overcoverage and standard errors for various characteristics, 2016 Census
Characteristics
Population undercoverage Population overcoverageEstimated
numberStandard
errorEstimated
rate (%)Standard error (%)
Estimated number
Standard error
Estimated rate (%)
Standard error (%)
Toronto 382,488 25,610 6.18 0.39 119,640 8,131 1.93 0.13Hamilton 28,323 10,108 3.73 1.28 15,920 4,305 2.09 0.56St. Catharines–Niagara 18,437 8,457 4.42 1.94 7,691 2,031 1.85 0.48Kitchener–Cambridge–Waterloo 22,306 6,944 4.16 1.24 9,980 2,585 1.86 0.47Brantford 2,290 3,078 1.71 2.26 2,587 1,164 1.93 0.85Guelph 5,376 3,730 3.47 2.33 2,499 1,111 1.61 0.71London 12,970 6,373 2.59 1.24 7,042 1,929 1.41 0.38Windsor 12,478 6,506 3.70 1.86 4,095 1,614 1.21 0.47Barrie 7,773 4,156 3.85 1.98 2,795 1,194 1.38 0.58Greater Sudbury 2,034 2,895 1.24 1.75 2,968 1,322 1.81 0.79Thunder Bay 9,057 4,322 7.06 3.13 2,390 1,080 1.86 0.83Winnipeg 22,401 4,023 2.84 0.50 11,258 751 1.43 0.09Regina 9,379 2,380 3.88 0.95 4,319 334 1.79 0.14Saskatoon 16,833 3,209 5.48 0.99 4,786 308 1.56 0.10Lethbridge 1,183 2,607 1.02 2.22 2,122 449 1.82 0.38Calgary 53,538 8,786 3.77 0.60 25,129 1,811 1.77 0.13Edmonton 51,690 8,495 3.83 0.61 24,031 1,975 1.78 0.14Kelowna 10,629 3,765 5.29 1.77 4,483 964 2.23 0.47Abbotsford–Mission 13,428 3,706 7.09 1.82 4,621 837 2.44 0.43Vancouver 170,896 13,974 6.64 0.51 59,856 2,764 2.32 0.11Victoria 27,171 6,017 7.04 1.45 9,064 1,158 2.35 0.30All CMAs 1,115,647 38,308 4.36 0.14 490,016 13,486 1.92 0.05Outside a CMA 441,414 27,683 4.23 0.25 217,318 9,699 2.08 0.09Sources: Statistics Canada, 2016 Census, 2016 Reverse Record Check and 2016 Census Overcoverage Study.
There were some demographic trends in undercoverage. The rate of undercoverage for males was more than one-and-a-half times the rate for females, or 5.27% compared with 3.39%. The undercoverage rate was highest for young adults aged 18 to 34 (men and women). Among young men, undercoverage was 11.46% for those aged 20 to 24 and 10.44% for those aged 25 to 34.
In terms of marital status, undercoverage was highest among those aged 15 or older who were separated and not in a common-law union, at 13.03%. It was also high for single persons not in a common-law union, at 8.93%. In both cases, these rates were higher for men than for women.
Table 1.3 shows that the persons most likely to have been missed in the 2016 Census were men aged 18 to 34 who were single (who were never married and not in a common-law union), and separated persons. Mother tongue was also significant for undercoverage rates because undercoverage rates were lower among those whose first language was French (2.29%), followed by those whose first language was English (3.71%). For persons whose mother tongue was neither English nor French, the rate was even higher, at 7.69%.

12 Statistics Canada – Catalogue no. 98-303-X2016001
Coverage Technical Report
1.4 Overcoverage
Population overcoverage is the number of excess enumerations in the census counts for persons enumerated more than once (usually twice). This error produces bias because these persons should have been enumerated only once. Examples of overcoverage include children whose parents live separately who were included on each parent’s census questionnaire, persons who do not live with their family for work reasons who are listed on their family’s form and also on the form for the dwelling they live in while working, and students away at school who are listed both by their roommates and by their parents.
This section presents estimates of overcoverage based on the following geographic and demographic variables:
• province or territory of current residence at the time of the census• age and sex• marital status and sex• mother tongue• census metropolitan area (CMA) of the usual place of residence on Census Day.
Table 1.3 also contains estimates of the number of excess enumerations and the associated standard error.
The standard errors for overcoverage estimates found in Table 1.3 were lower than those for undercoverage. As indicated below, certain demographic trends emerged from overcoverage estimates.
Across the provinces and territories, the estimated overcoverage rate varied less than the estimated undercoverage rate. In fact, the gap between the lowest rate and the highest rate among all provinces and territories was 0.99 percentage points for overcoverage (with the rate varying between 1.25% and 2.24%), whereas this gap was 5.85 percentage points for undercoverage (with the rate varying between 2.57% and 8.42%). Males and females had similar overcoverage rates, at 1.95% compared with 1.98%. Overcoverage was higher for children and young adults aged 5 to 24. As mentioned, these high rates were largely attributable to multiple enumerations of children in shared custody and students.
For marital status, the overcoverage rate was higher for persons who had never been married and who were not in a common-law union (2.45%). This phenomenon was observed equally among women and men, and was consistent with the results by age.
In summary, Table 1.3 presents the profile of persons most likely to be counted more than once; they were equally likely to be male or female, and more likely to be a child or a young adult. For persons aged 15 and older, single persons were more likely to be counted more than once.

Statistics Canada – Catalogue no. 98-303-X2016001 13
Coverage Technical Report
2. Census universe
2.1 Introduction
While the 2016 Census collects information on the population, dwellings, households and families, the 2016 Census Coverage Error Measurement Program estimates the coverage error of the population universe only. However, the definitions of dwelling concepts and the rules for determining the list of people who should be enumerated in each dwelling affect coverage of the census target population. As a result, this section describes the concepts of population and dwelling. In addition, since coverage error can be caused by misinterpreting the concept of usual place of residence as defined in census questionnaires, this section also provides the information in the census questionnaires, and the 2016 Census definition of usual place of residence.
2.2 Population universe
The 2016 Census target population includes the following groups:
• Canadian citizens and landed immigrants (permanent residents) with a usual place of residence in Canada• Canadian citizens and landed immigrants (permanent residents) who are abroad, either on a military base
or attached to a diplomatic mission• Canadian citizens and landed immigrants (permanent residents) at sea or in port aboard merchant vessels
under Canadian registry or Canadian government vessels• non-permanent residents:
○ persons with a usual place of residence in Canada who are claiming refugee status and family members living with them
○ persons with a usual place of residence in Canada who hold a study permit (covering Census Day) and family members living with them
○ persons with a usual place of residence in Canada who hold a work permit (covering Census Day) and family members living with them.
The 2016 Census population universe does not include foreign residents, but since 1991, it has included non-permanent residents.
The definition of target population specifies which persons should be included in the census, but not where these persons should be enumerated. The Canadian census uses the modified de jure method of enumeration, under which persons are to be enumerated at their usual place of residence, even if they are temporarily away on Census Day. Persons away from their usual place of residence and residing elsewhere in Canada must be enumerated at their usual place of residence and are considered present, but temporarily at the other location. Persons who have no usual place of residence are to be enumerated wherever they happen to be on Census Day. Some countries use the de facto method, under which all persons are to be enumerated wherever they are on Census Day, regardless of their usual place of residence.
2.3 Dwelling universe
A dwelling is defined as a set of living quarters. Two types of dwellings are identified in the census: private dwellings and collective dwellings. Census coverage studies include these two types of dwellings, without distinction.
Private dwelling refers to a separate set of living quarters with a private entrance either from outside the building or from a common hall, lobby, vestibule or stairway inside the building. The entrance to the dwelling must be one that can be used without passing through the living quarters of some other person or group of persons.

14 Statistics Canada – Catalogue no. 98-303-X2016001
Coverage Technical Report
The dwelling must meet the two conditions necessary for year-round occupancy:
1. a source of heat or power (as evidenced by chimneys, power lines, oil or gas pipes or meters, generators, woodpiles, electric lights, heating pumps or solar panels).
2. an enclosed space that provides shelter from the elements as evidenced by complete and enclosed walls and roof, and by doors and windows that provide protection from wind, rain and snow.
Dwellings that do not meet the conditions necessary for year-round occupancy are marginal dwellings. Private dwellings are classified into regular private dwellings and occupied marginal dwellings. Regular private dwellings are further classified into three major groups: occupied dwellings (occupied by usual residents), dwellings occupied solely by foreign residents and/or by temporarily present persons and unoccupied dwellings. Marginal dwellings are classified as occupied by usual residents or occupied solely by foreign residents and/or by temporarily present persons. Marginal dwellings that were unoccupied on May 10, 2016, are not counted in the housing stock.
A collective dwelling is a dwelling of commercial, institutional or communal nature. It may be identified by a sign on the premises or by an enumerator speaking with the person in charge, a resident, a neighbour, etc. Included are lodging or rooming houses, hotels, motels, tourist establishments, nursing homes, hospitals, staff residences, military bases, work camps, jails, group homes, and so on.
Collective dwellings are classified as either occupied dwellings or unoccupied dwellings. Occupied dwellings are either occupied by usual residents or occupied solely by foreign residents or by persons temporarily present. In the case of unoccupied collective dwellings, data on the dwelling, such as the types of services offered, were collected but are not included in census products.
In summary, the dwelling universe includes the following:
• private dwellings occupied by usual residents• private dwellings occupied solely by foreign residents or by persons temporarily present• unoccupied private dwellings • marginal dwellings occupied on Census Day• collective dwellings occupied by usual residents• collective dwellings occupied by foreign residents or by persons temporarily present.
The dwelling universe does not include the following:
• marginal dwellings that were unoccupied on Census Day• collective dwellings that were unoccupied on Census Day• dwellings outside Canada.
2.4 Usual place of residence
Under the de jure enumeration method used in the Canadian population census, the population is enumerated on a “usual place of residence” basis, that is, at the location where a person lives most of the time. Most people have only one residence, and it is easy to enumerate them at their usual place of residence. Enumeration involves listing all the persons having this dwelling as their usual place of residence on Census Day by following the step-by-step instructions at the beginning of the census questionnaire: “How many persons usually live at this address on May 10, 2016, including yourself? Include: all persons who have their main residence at this address, even if they are temporarily away. See the instructions on page 3 (joint custody, students, landed immigrants, secondary residence, etc.).” The instructions on page 3 of the 2016 Census questionnaire are presented in Appendix A.

Statistics Canada – Catalogue no. 98-303-X2016001 15
Coverage Technical Report
In some cases, it is difficult to determine a person’s usual place of residence. That is why special rules were developed for determining usual place of residence in some cases:
1. Persons with more than one residence This category includes all persons who have more than one dwelling in Canada that could be considered
their usual place of residence. In this situation, the usual place of residence is the place where a person spends the majority of the year. If the person spends the same amount of time at both residences or is not sure which one to choose, they should choose the residence where they stayed overnight between May 9 and 10, 2016. There are two exceptions to this rule:
a. Children who live somewhere else while attending school or working at a summer job but return to live with their parents for part of the year should consider the residence they share with their parents to be their usual place of residence, even if they spend most of the year elsewhere.
b. Spouses or common-law partners who live away from their families while working or studying but return to their families periodically should consider the residence they share with their spouse to be their usual place of residence, even if they spend most of the year elsewhere.
2. Persons in an institution, such as a hospital, home for the aged, prison or correctional institution Persons who have been in one or more institutions for a continuous period of six months or longer at the
time of the census are to be considered usual residents of the institution.
3. Persons with no usual place of residence Persons who do not have a usual place of residence should be enumerated in the dwelling where they
stayed overnight between May 9 and 10, 2016.
4. Persons residing outside Canada Canadian citizens and landed immigrants (permanent residents) residing outside Canada on Census Day
include:• persons aboard Canadian vessels or merchant vessels• Canadian federal and provincial/territorial government employees and family members• members of the Canadian Armed Forces and family members who do not have a permanent place
of residence in Canada occupied by one or more family members.
These persons should indicate in the census questionnaire the address they use for election purposes or their last permanent address in Canada. This information is used to assign them with a geographic location in Canada for dissemination purposes.

16 Statistics Canada – Catalogue no. 98-303-X2016001
Coverage Technical Report
3. Population coverage error
3.1 Sources
Although census data collection and processing have to meet high quality standards, it is very difficult to eliminate all potential errors. There are two kinds of population coverage error. Population undercoverage refers to the exclusion of persons who should have been enumerated, and population overcoverage refers to the inclusion of persons who were enumerated more than once (generally twice). Overcoverage also includes persons who were enumerated but should not have been. However, this type of error is considered negligible; consequently, it is not measured.
Undercoverage can occur in the first stage of the census if the list of dwellings used for the dwelling universe is incomplete. This risk is higher, for example, if a dwelling is under construction. Conversely, overcoverage can occur if a dwelling is listed twice.
Coverage error can also occur during the field data collection stage. Respondent error is responsible for coverage error when the person completing the census form omits someone whose usual place of residence, according to census rules, is the dwelling concerned; this is undercoverage. The person may also include someone whose usual place of residence is not the dwelling concerned; there is overcoverage if this person has already been enumerated at their usual place of residence or somewhere else. In most cases, it is easy to determine a person’s usual place of residence. However, as stated in the previous section, the process is sometimes more complex, and special rules have been developed for determining an individual’s usual place of residence. The rules are spelled out in the census questionnaire, but the list is long, and there can be comprehension difficulties. Coverage error may result when the rules are not consulted or are incorrectly applied. The idea of using Census Day as the reference date for determining usual residence may also be misunderstood, which can lead to coverage error.
Coverage errors may also be committed during the processing stage at any point where records for persons or households are added to or removed from the census database. Records can be deleted by mistake. Questionnaires may be linked to the wrong record or returned too late to be included.
Even though efforts are made to enumerate the homeless population, the risk of undercoverage is high. Some other living arrangements are also susceptible to coverage error. For example, young adults newly away from home may be either undercovered, because neither their roommates nor their parents include them in the census questionnaire, or overcovered, because they are included in both census questionnaires. Persons who maintain a second residence because of their employment can also cause coverage error.
Users should also be aware of the extent to which Indian reserves and Indian settlements participated in the 2016 Census. In some cases, enumeration was not permitted by the community or was interrupted before it could be completed. These geographic areas (14 in all in 2016) are considered incompletely enumerated Indian reserves and settlements. There are no 2016 data for incompletely enumerated Indian reserves and settlements, and those areas are not included in the totals. Similar problems have occurred in previous censuses. For example, 22 Indian reserves and settlements were incompletely enumerated in the 2006 Census, and 31 in the 2011 Census. Of those reserves and settlements, 20 participated in the 2016 Census.
The demographic estimates for the 14 incompletely enumerated Indian reserves and settlements are based on a model. However, since no reliable source is available to verify the assumptions in the model, the estimates must be used with caution. For more information, see Section 12.2.
3.2 Control
Potential sources of coverage error were recognized during the planning stage of the 2016 Census, and the following measures were taken to minimize the associated risks:
• Collection unit (CU) boundaries were carefully defined and mapped to ensure that no geographic areas were left out or included twice.

Statistics Canada – Catalogue no. 98-303-X2016001 17
Coverage Technical Report
• List/leave areas: The enumerator’s manual contained instructions on how to enumerate a CU so as to minimize the risk of missing dwellings. The total number of dwellings from the 2011 Census was provided to field operations supervisors to help them identify significant changes. In addition, when the listing operation resulted in a substantial difference in the number of dwellings relative to the 2011 Census, the listing was checked. Lastly, specific quality control procedures were applied to the CU to evaluate and correct any changes made in the listing.
• Mail-out areas: Mail-out was based on a list of addresses from Statistics Canada’s Address Register. This list was updated regularly and listing activities were carried out mainly in the fastest-growing areas. These listing activities were carried out continuously, but more intensively in the two years preceding the census. Listing operations led to nearly 30% of the addresses in the mail-out areas being checked. The work of enumerators was closely monitored. Some collective dwellings had to be checked by field staff to verify their occupancy status before the collection stage; if they were occupied then they were identified and included in the census.
• Special procedures were developed for the enumeration of persons who have difficulty responding (e.g., people who are fluent in neither English nor French, or are illiterate) and persons located in specific parts of large cities where response or coverage was poor in the past.
• Special procedures were defined for the enumeration of the population residing on Indian reserves.• Advertisements informed Canadians about the census and indicated what to do if they did not receive a
questionnaire.• The Census Help Line (CHL) was available to answer any questions about the census, including questions
about coverage.• There was a “Whom to include” section in the questionnaire so respondents could determine which
persons should be included. Also, almost 70% of the responses to the 2016 Census were obtained through Internet, and the electronic questionnaire included additional verification questions when respondents reported a dwelling as unoccupied or non-existent, or if they had a problem determining whether a person should be included or not.
• In the questionnaire, respondents were asked to indicate whether there were people who had not been listed because they were not sure they should be included. The electronic questionnaire provided guidance so respondents could make the right decision. In the other cases, a telephone follow-up was subsequently carried out with the respondent to determine if the persons in question should or should not be listed in the questionnaire.
• Telephone follow-up was carried out after questionnaires were reviewed for coverage inconsistencies or to verify household status, including questionnaires containing only foreign residents or persons temporarily present.
• Non-response follow-up included a dwelling coverage check.
These procedures, along with appropriate staff training, supervisory checks and quality controls during the collection and processing stages, helped to reduce the number of coverage errors.
3.3 Definitions
Algebraic definitions of coverage errors are presented in this section. Let T denote the total or the “actual” number of persons targeted by the Census of Population. Let C denote the published census count of persons in the target population. The error associated with using C instead of T is as follows:
N T C �
This error, denoted as N, is the net population coverage error.
Let U denote population undercoverage, the number of persons not included in C who should have been.

18 Statistics Canada – Catalogue no. 98-303-X2016001
Coverage Technical Report
The census count C is composed of two elements:
C E I �
Where:
E is the number of persons enumerated. This is the number of persons who were listed on a census questionnaire.
I is the number of persons imputed. This is an estimate of the number of persons missed because their dwelling was classified as occupied but non-response or misclassified as unoccupied, therefore for which no follow-up was done. For more information on whole household imputation (WHI), see Section 3.6 of the Sampling and Weighting Technical Report, Census of Population, 2016, Catalogue no. 98-306-X.
Undercoverage compared with the published census count C is therefore what remains of the persons who should have been listed on a census questionnaire and who were not taken into account by the WHI. In other words, it does not include the estimate of the number of persons who were not enumerated either because no completed census questionnaire was returned for the dwelling (non-response dwelling) or because the dwelling was misclassified as unoccupied (classification error) and did not receive a questionnaire.
The concept of undercoverage before the WHI also exists. This is what is referred to as Census of Population collection undercoverage. For more information, see Section 12.1.
Let O denote population overcoverage, the number of excess enumerations included in C that should not have been.
O has two components. One is the excess enumerations of persons enumerated more than once. Coverage studies focus on these excess enumerations. The second is persons who were enumerated but who were not in the census target population. For example, foreign residents visiting Canada who are listed on a census questionnaire as usual residents of a dwelling should not be included in C . Fictitious persons are another example. According to previous studies, the number of persons who are enumerated but are not in the census target population is generally very small and can be ignored. Consequently, census coverage does not measure this component of coverage error.
Since U refers to persons who were not enumerated but should be included in C and since O denotes enumerations that should not be included in C, the difference between T and C is U less O . That is:
N U O
The actual number of persons in the census target population is therefore:
T C N C U O �
In practice, for reasons of cost and timeliness of the data produced, an estimate of T is given by T , based on sample studies, where:
ˆˆ ˆ ˆT C N C U O
U is an estimate of the number of persons not included in C who should have been, and O is an estimate of the number of persons included in C who should not have been. We can assume that overcoverage from persons included in C who are not in the census target population is zero, since it is negligible. Consequently, O is simply an estimate of the number of duplicate enumerations. The purpose of census coverage studies is to determine the values of U and O .
NOTE: P with circumflex disappears randomly when exporting to PDF
NOTE: S with circumflex disappears randomly when exporting to PDF

Statistics Canada – Catalogue no. 98-303-X2016001 19
Coverage Technical Report
In summary, the actual population T is composed of the census count C and the net undercoverage N. This is referred to as net undercoverage because U is generally larger than O in the context of the current census in Canada. However, the opposite is possible, whereby N would be negative. C consists of E plus the number of persons added in WHI, and this imputation I targets persons living in non-response dwellings or in occupied dwellings misclassified as unoccupied.
Census population coverage errors can generally be expressed as rates relative to the actual population. The undercoverage rate UR is U as a percentage of T . The overcoverage rate OR is O as a percentage of T . The net undercoverage rate NR is the difference between U and O as a percentage of the census target population. These three rates can be estimated by ˆ
UR , ˆOR and ˆ
NR , as follows:
ˆ ˆˆ 100 * 100*ˆ ˆUU URT C N
ˆ ˆˆ 100 * 100*ˆ ˆOO ORT C N
ˆˆ ˆˆ 100 * 100*ˆ ˆNN U ORT C N
A positive net undercoverage rate indicates that the undercoverage rate is higher than the overcoverage rate. That is, the number of people not included in the published census count C is higher than the number of excess enumerations. That is generally the case for all Canadian censuses. For some domains of interest, however, negative net undercoverage is sometimes observed.
3.4 Evaluation
Two postcensal studies were carried out to estimate the 2016 Census population coverage error. The Reverse Record Check (RRC) provided estimates for population undercoverage, while the Census Overcoverage Study (COS) estimated population overcoverage. As previously mentioned, the Dwelling Classification Survey (DCS) does not contribute to census coverage error estimates since census counts are already adjusted to take DCS results into account.
The RRC and COS were conducted subsequent to field collection and census processing operations. Preliminary estimates of 2016 Census population coverage error were released on March 29, 2018. Following an in-depth validation exercise with the Demography Division and the provincial and territorial statistical focal points, final estimates were released on September 27, 2018. The data were released at the same time as the new official demographic estimates reflecting the update of the base population to the 2016 Census. Census population counts adjusted for net population undercoverage constituted the updated estimates of the base population.
A brief description of the methodology used in the two census coverage studies is presented below:
Reverse Record Check (RRC)
In the RRC, a random sample of individuals representing the 2016 Census target population was selected from frames independent of the census. These frames are described in Section 7.1. The 2016 RRC sample consisted of 67,872 persons in the provinces and 2,595 persons in the territories. The 2016 Census database was then searched to determine whether these persons had indeed been enumerated.

20 Statistics Canada – Catalogue no. 98-303-X2016001
Coverage Technical Report
Where necessary, interviews were conducted, mostly via computer-assisted telephone interviewing (CATI) from the regional offices (ROs), to collect information for use in additional searches of the 2016 Census database. An interview was completed for 82.1% of the 15,584 cases sent to the ROs. The sampling weight was adjusted for non-response. Specifically, the total sampling weight of non-respondents was divided among groups of respondents most like the non-respondents in their response probability.
The estimate of population undercoverage is based on the number of persons in the RRC sample who were classified as “missed.” These persons were part of the target population for the 2016 Census, but no evidence of enumeration could be found in the 2016 Census Response Database. Nationally, 4,821 persons in the RRC sample were classified as missed in the provinces and 1,128 in the territories.
Census Overcoverage Study (COS)
Overcoverage was measured by matching the final 2016 Census database to itself, and then matching the final 2016 Census database and a list of persons who should have been enumerated according to administrative data sources. Probabilistic linkage was used for matching. Probabilistic linkage identifies matches that are close but not exact. A sample of potential duplicates was selected for each linkage, and demographic characteristics and names were examined to identify true cases of overcoverage.

Statistics Canada – Catalogue no. 98-303-X2016001 21
Coverage Technical Report
4. Census data collection
Data collection in the 2016 Census ensured that each of the 15.4 million dwellings in Canada was enumerated, and that for each occupied dwelling, the corresponding household completed a census questionnaire.
In 2016, Canadian households had the option of responding online, completing a paper questionnaire (mail-back) or contacting the Census Help Line. Households that did not use any of these three response modes received a follow-up by telephone or in person. The three collection methods used for the Canadian census were mail-out, list/leave and canvasser enumeration. To make census collection as efficient as possible, Canada is divided into small geographic units known as collection units (CUs). In the 2016 Census, there were approximately 46,000 CUs in Canada. For mail-out CUs, the postal system was used to deliver the census material. Mail-out CUs are typically in urban areas. While mail-out CUs now include about 82% of Canadian dwellings, they cover only a tiny fraction of the country’s land area. List/leave CUs are typically in rural areas. In those areas, enumerators prepare a list of dwellings and deliver the census material. About 17% of Canadian dwellings are in list/leave CUs, which cover a large portion of the country’s land area. Enumeration by canvasser interview occurs on Indian reserves or in CUs in remote or difficult-to-access locations. To limit the number of trips that enumerators have to make to those places for follow-ups—trips that are often expensive and logistically complicated—they do more than prepare dwelling lists; they also complete a questionnaire with each household on the spot. Interview CUs cover just over half of Canada’s land area, but only about 1% of its dwellings.
Since the 2011 Census, a new method has been used for census collection. Known as the wave methodology, it involves contacting non-respondent households at key times to remind them to participate in the census and persuade them to complete the questionnaire. In each wave, households are provided with the information they need to respond. This methodology varies with the collection method used to distribute the census materials for a given region.
Because every Canadian household is required by law to answer the census questions, the wave methodology was designed to encourage people to respond early online, yet offers an alternative for households that do not wish to complete their questionnaire online. The wave methodology has many advantages: it increases the number of online responses, a mode that facilitates the flow of questions and real-time response edits; and it reduces non-response, the need for costly follow-up, and the number of questionnaires to register and data to capture. In the end, it increases the quality of the census.
For more information on census data collection, see Chapter 1 of the Sampling and Weighting Technical Report, Census of Population, 2016, Statistics Canada Catalogue no. 98-306-X.

22 Statistics Canada – Catalogue no. 98-303-X2016001
Coverage Technical Report
5. Census data processing
The processing of all the completed questionnaires, regardless of type, includes several steps, from receiving the questionnaires to creating an accurate and complete census database. These steps include questionnaire registration, questionnaire imaging and data capture, editing, error correction, failed edit follow-up, coding, dwelling classification and non-response adjustments, income data linkage, imputation and weighting (for the long-form questionnaire sample).
Automated processes, implemented for the 2016 Census, were monitored to ensure that all Canadian residences were enumerated only once. The Master Control System (MCS) was built to control and monitor the process flow, from data collection to processing. The MCS held a master listing of all the dwellings in Canada where each dwelling was identified with a unique identifier. This system was updated on a daily basis with information about each dwelling’s status in the census process flow (delivered, received, processed, etc.). Reports were generated daily and made accessible online to the managers to ensure that census operations were efficient and effective.
For more information on census data processing, see Chapter 3 of the Sampling and Weighting Technical Report, Census of Population, 2016, Statistics Canada Catalogue no. 98-306-X.

Statistics Canada – Catalogue no. 98-303-X2016001 23
Coverage Technical Report
6. Dwelling Classification Survey (DCS)
6.1 Introduction
The Dwelling Classification Survey (DCS) measures dwelling classification errors in the census. The DCS also estimates the number of usual residents in occupied non-response dwellings. Census data are adjusted for occupied non-response dwellings.3 The DCS estimates are used in census processing to specify how many persons are to be imputed during whole household imputation (WHI).
One of the potential sources of error in a census is the misclassification of a dwelling. When a household does not return a questionnaire, the enumerator has to determine whether the dwelling is occupied. Two types of dwelling classification errors can occur in this situation. First, an occupied dwelling can be misclassified as unoccupied. This dwelling classification error results in census population undercoverage since the dwelling occupants will not be included in the census database. Second, an unoccupied dwelling can be misclassified as occupied. When this error occurs, no questionnaire will be received from this dwelling, and the dwelling will be subject to non-response follow-up (NRFU).4 If the NRFU fails to correct the dwelling’s classification to unoccupied, the dwelling will continue to be considered a non-response dwelling and will be subject to imputation. This dwelling classification error results in population overcoverage—persons are added to the census database when, in fact, no one lives at that dwelling. Estimates from the DCS are used to adjust census data for these two coverage errors.
Additionally, a third type of dwelling classification error that the DCS measures is the error incurred when marginal dwellings or dwellings under construction are misclassified as dwellings. Since these dwellings are classified as unoccupied—and because only occupied dwellings can be classified as non-response dwellings, which are subject to imputation—this error does not result in population overcoverage. However, this error does result in dwelling overcoverage. Census data are not adjusted for these dwellings, so census estimates of the housing stock include some degree of overcoverage.
6.2 Methodology
6.2.1 Stratification and sample selection
The DCS target population included all dwellings classified as either unoccupied or non-response dwellings, excluding dwellings in collection units (CUs) with collective dwelling, canvasser and reserve collection types.5 Those areas were excluded because of cost and operational considerations.
The DCS sample size was set at 1,730 CUs. The sampling frame consisted of all self-enumeration CUs (i.e., mail-out, list/leave and seasonal CUs, where respondents completed their own census questionnaire). Consequently, Nunavut had no in-scope CUs, and the DCS was not conducted there. The sample design was as follows: first, all in-scope CUs in Yukon (42 CUs) and the Northwest Territories (21 CUs) formed one stratum. All these CUs were selected for the DCS sample with certainty. All the CUs in Prince Edward Island formed a second stratum from which a simple random sample of 49 CUs was selected.
The remaining CUs were grouped into urban and rural strata. A CU was considered urban if it had initially been part of a census metropolitan area (CMA) or a census agglomeration (CA) that had 40,000 or more occupied dwellings. Further, all the CUs within a crew leader district (CLD) were considered urban if more than 50% of the CUs in the CLD were urban. All the remaining CUs formed the rural strata. Urban CUs were stratified by CMA and CA. A simple random sample of at least five CUs was selected within each stratum. From past census data,
3. Refer to the Sampling and Weighting Technical Report, Census of Population, 2016 (Catalogue no. 98-306-X2016001) Section 3.6. 4. Refer to the Sampling and Weighting Technical Report, Census of Population, 2016 (Catalogue no. 98-306-X2016001) Section 1.1.3.5. Refer to Section 4.

24 Statistics Canada – Catalogue no. 98-303-X2016001
Coverage Technical Report
it was determined that five CUs was an appropriate workload for an interviewer. There were 984 urban CUs in the sample. To control field costs, CUs in close proximity to each other were chosen for the rural sample. This was done via a two-stage stratified random sampling design. In the first stage, CLDs were selected within each province. In the second stage, five CUs were selected from each of the selected CLDs. There were 746 rural CUs in the sample.
Dwelling subsampling within a sampled CU occurred when the number of unoccupied and non-response dwellings exceeded a maximum dwelling parameter, which was 50 in mail-out and list/leave CUs, and 200 in seasonal CUs. Subsampling of in-scope dwellings occurred in 325 CUs. Otherwise, all unoccupied dwellings and non-response dwellings in the sampled CUs formed the DCS dwelling sample. A total of 38,714 unoccupied and 9,994 non-response dwellings were sampled in 2016. Table 6.2.1 shows the distribution of the sample by province and territory.
6
Table 6.2.1 Sample size for Canada, provinces and territories
Provinces and territoriesNumber of
collection units
Number of unoccupied
dwellings
Number of non-response
dwellings
Canada 1,730 38,714 9,994Newfoundland and Labrador 100 3,482 477Prince Edward Island 49 1,728 364Nova Scotia 113 3,385 471New Brunswick 95 2,683 356Quebec 318 6,845 1,385Ontario 387 7,769 1,971Manitoba 122 1,951 915Saskatchewan 133 2,845 742Alberta 170 3,178 1,357British Columbia 180 3,748 1,331Yukon 42 742 309Northwest Territories 21 358 316Nunavut 0 0 0Source: Statistics Canada, 2016 Dwelling Classification Survey.
.2.2 Field interviews
A DCS questionnaire was used to verify the true occupancy status on Census Day of sampled dwellings in the sampled CUs that were classified as unoccupied on Census Day, or that were classified as occupied but for which no census form was returned. Occupancy status was verified in late June and early July 2016.
Timing for DCS field interviews were left to the discretion of each regional office. To determine occupancy status and to collect other information, enumerators were instructed to contact current occupants, neighbours, landlords, or any other person with knowledge about the dwelling. Up to three contact attempts were made for each dwelling. If the dwelling was found to have been occupied on Census Day, the number of occupants on Census Day was also obtained, along with occupants’ sex and age, where possible.
6.2.3 Processing and estimation
All completed questionnaires were sent to head office in Ottawa for processing.

Statistics Canada – Catalogue no. 98-303-X2016001 25
Coverage Technical Report
The questionnaires were sent for data capture (key entry). Once data capture was completed, the questionnaires were subjected to an extensive set of consistency edits. The questionnaires that failed the edits were examined manually to resolve inconsistencies.
At this point in the processing, the unoccupied dwellings and the non-response dwellings in the sample were separated, and the dwellings’ classifications were confirmed against the final census listing. The questionnaires completed for each sampled CU were matched to the final census listing of unoccupied dwellings. If a match could not be found, the sampled dwelling was discarded and no further processing was required. Dwellings listed as unoccupied on the census list for which no DCS questionnaire was received were considered as total non-response to the DCS and proceeded to the next processing step. Similarly, the final census listing of all dwellings for which a census questionnaire was not received (i.e., the dwelling was classified as a non-response dwelling) was used to establish which of the DCS dwellings for which a DCS questionnaire was not received would be considered as total non-response to the DCS, before continuing on to the next processing step.
Total non-response to the DCS was addressed by a weighting adjustment, and item imputation was used for item non-response. The procedure was the same for unoccupied dwellings and non-response dwellings. When there was no information for a dwelling, the design weights of the respondents were adjusted to account for the design weight of the non-respondents. The adjustment was done separately by geographic post-stratum—that is, for each of the Montréal, Toronto and Vancouver CMAs, for the remaining urban areas in each province and territory, and for the rural areas for each province and territory. Item non-response for occupancy status, number of usual residents, and dwelling type was addressed by imputation. Occupancy status was imputed first and then used in the imputation of the other variables. Design weights were then adjusted so that the sum of the adjusted weights for each geographic post-stratum equalled the number of unoccupied/non-response dwellings. The household size, collected on the DCS questionnaire when a dwelling was found occupied, was used to produce an estimate—by household size—of the occupancy rate of private dwellings classified by the census as unoccupied and non-response.
6.2.4 Census whole household imputation (WHI)
The whole household imputation (WHI) procedure aims to represent non-response private dwellings in the census and, as such, imputes for total non-response to the census. In geographic areas where the DCS was conducted (i.e., CUs with mail-out and list/leave collection types), the DCS estimates were used as input to the WHI algorithm to impute occupied private dwellings based on post-strata and household size distributions. First, within a DCS geographic post-stratum, all the non-response dwellings were identified (this was done separately for unoccupied and non-response dwelling universes). Second, only for the non-response dwelling universe, any non-response dwelling for which field collection had obtained the number of usual residents was deemed to be occupied and was assigned the recorded household size. Finally, non-response dwellings were randomly selected and imputed as occupied. The selection was done so that the final number of non-response and unoccupied dwellings converted to occupied dwellings in the post-strata equalled the DCS estimate of occupied dwellings in the non-response and unoccupied dwelling universes. In geographic areas where the DCS was not conducted (i.e., CUs with collective dwelling, canvasser and reserve collection types), all private dwellings classified as non-response were imputed as occupied based on the household size distribution of census respondents. The WHI procedure resulted in all private dwellings being classified as either occupied or unoccupied in the census database (i.e., there were no longer any non-response dwellings).
Once a private unoccupied/non-response dwelling was imputed as occupied, a procedure—subject to the constraints of DCS estimates by post-stratum and household dwelling size—was used to impute the household dwelling size and other variables. Household size was determined by randomly selecting a dwelling from all dwellings that had completed a census questionnaire in the same CU. The complete record from this donor household was then assigned to the unoccupied/non-response dwelling that was imputed as occupied. If no donor was found, then only a household size was assigned.
More information on WHI can be found in the report by Farr (2018).

26 Statistics Canada – Catalogue no. 98-303-X2016001
Coverage Technical Report
6.3 Estimates
Census data were adjusted using DCS estimates, via the WHI procedure, for non-response dwellings and for occupied dwellings that were misclassified as unoccupied. The estimates are given in sections 6.3.1.1 and 6.3.2. Census data were not adjusted for marginal dwellings or dwellings under construction that were misclassified as dwellings. Section 6.3.1.2 presents estimates of the number of marginal dwellings and dwellings under construction that were classified in error as dwellings and that were therefore erroneously included in the housing stock.
6.3.1 Unoccupied dwellings
6.3.1.1 Occupied dwellings misclassified as unoccupied
Table 6.3.1.1.1 gives the estimated number of dwellings classified as unoccupied that should have been classified as occupied, and the corresponding error rate for unoccupied dwellings by urban and rural area,6 and by province and territory. For comparison, Table 6.3.1.1.2 gives the same estimates for the 2011 Census. Table 6.3.1.1.3 gives the estimated number of persons living in occupied dwellings that were misclassified as unoccupied. Table 6.3.1.1.4 shows the number of households and persons added to the initial 2016 Census counts to adjust for these misclassifications.
Table 6.3.1.1.1 shows that 15.0% of all dwellings classified as unoccupied in 2016 were actually occupied. This is a slight increase from 13.8% in 2011. Dwelling misclassification was more prevalent in urban areas (21.3%) than in rural areas (6.5%). Urban areas show an increase from 2011. Increases in the misclassification rates occurred for all provinces except New Brunswick, where it decreased.
Among the provinces and territories, the Northwest Territories had the highest misclassification rate (19.8%), followed by British Columbia (18.0%), Alberta (16.9%), Ontario (16.5%), Yukon (16.3%) and Quebec (14.3%). The rates for the other provinces ranged from 12.9% for Manitoba to 5.9% for Prince Edward Island.
Because of errors in the initial dwelling classification, approximately 178,219 households were not enumerated in the 2016 Census. This is the number of households added to the census during WHI. Table 6.3.1.1.4 shows the number of households and persons added to adjust for occupied private dwellings misclassified as unoccupied.
6. Urban refers to urban areas with a population of over 50,000 persons. The remaining geographies constitute the rural areas.

Statistics Canada – Catalogue no. 98-303-X2016001 27
Coverage Technical Report
Table 6.3.1.1.1 Number of occupied dwellings misclassified as unoccupied dwellings for various characteristics, 2016 Census
Characteristics
Number of unoccupied
dwellings
Occupied dwellings misclassified as unoccupied
Estimated number
Standard error
Estimated rate (%)
Standard error (%)
Canada 1,187,392 178,219 5,520 15.0 0.5Urban (population over 50,000) 680,629 145,308 4,819 21.3 0.7Rural 506,763 32,911 2,692 6.5 0.5
Atlantic provinces 144,073 12,577 816 8.7 0.6Newfoundland and Labrador 43,770 2,830 310 6.5 0.7Prince Edward Island 10,909 646 117 5.9 1.1Nova Scotia 51,940 5,351 633 10.3 1.2New Brunswick 37,454 3,750 395 10.0 1.1
Quebec 289,593 41,544 2,240 14.3 0.8
Ontario 378,298 62,536 4,309 16.5 1.1
Prairies 204,641 30,779 1,637 15.0 0.8Manitoba 36,147 4,680 460 12.9 1.3Saskatchewan 54,414 6,839 1,022 12.6 1.9Alberta 114,080 19,260 1,193 16.9 1.0
British Columbia 169,340 30,526 1,881 18.0 1.1
Territories 1,447 256 0 17.7 0.0Yukon 874 143 0 16.3 0.0Northwest Territories 573 113 0 19.8 0.0Source: Statistics Canada, 2016 Dwelling Classification Survey.

28 Statistics Canada – Catalogue no. 98-303-X2016001
Coverage Technical Report
Table 6.3.1.1.2 Number of occupied dwellings misclassified as unoccupied dwellings for various characteristics, 2011 Census
Characteristics
Number of unoccupied
dwellings
Occupied dwellings misclassified as unoccupied
Estimated number
Standard error
Estimated rate (%)
Standard error (%)
Canada 1,099,156 151,152 8,153 13.8 0.7Urban (population over 50,000) 622,309 120,322 7,375 19.3 1.2Rural 476,847 30,830 3,690 6.5 0.8
Atlantic provinces 126,074 9,611 1,007 7.6 0.8Newfoundland and Labrador 39,016 2,240 391 5.7 1.0Prince Edward Island 9,493 537 132 5.7 1.4Nova Scotia 46,338 3,350 664 7.2 1.4New Brunswick 31,227 3,484 635 11.2 2.0
Quebec 248,311 36,952 4,374 14.9 1.8
Ontario 374,639 55,366 6,564 14.8 1.8
Prairies 180,821 22,422 1,602 12.4 0.9Manitoba 36,357 3,047 432 8.4 1.2Saskatchewan 40,901 3,632 535 8.9 1.3Alberta 103,563 15,743 1,447 15.2 1.4
British Columbia 168,421 26,695 1,487 15.9 0.9
Territories 890 107 0 12.0 0.0Yukon 654 85 0 13.1 0.0Northwest Territories 236 21 0 8.9 0.0Source: Statistics Canada, 2011 Dwelling Classification Survey.

Statistics Canada – Catalogue no. 98-303-X2016001 29
Coverage Technical Report
Table 6.3.1.1.3 Estimated number of persons living in misclassified occupied dwellings and standard errors for various characteristics, 2016 Census
CharacteristicsEstimated
numberStandard
error
Canada 338,246 11,110Urban (population over 50,000) 277,996 9,818Rural 60,250 5,199
Atlantic provinces 23,220 1,577Newfoundland and Labrador 5,042 623Prince Edward Island 1,257 248Nova Scotia 9,638 1,155New Brunswick 7,283 838
Quebec 73,306 4,200
Ontario 120,951 8,429
Prairies 58,289 3,684Manitoba 8,502 906Saskatchewan 12,395 2,134Alberta 37,392 2,863
British Columbia 62,003 4,323
Territories 477 0Yukon 251 0Northwest Territories 226 0Source: Statistics Canada, 2016 Dwelling Classification Survey.

30 Statistics Canada – Catalogue no. 98-303-X2016001
Coverage Technical Report
6.
Table 6.3.1.1.4 Imputed households and persons for various characteristics, 2016 Census
CharacteristicsNumber of
imputed householdsNumber of
imputed persons
Canada 178,219 338,246Urban (population over 50,000) 145,308 277,996Rural 32,911 60,250
Atlantic provinces 12,577 23,220Newfoundland and Labrador 2,830 5,042Prince Edward Island 646 1,257Nova Scotia 5,351 9,638New Brunswick 3,750 7,283
Quebec 41,544 73,306
Ontario 62,536 120,951
Prairies 30,779 58,289Manitoba 4,680 8,502Saskatchewan 6,839 12,395Alberta 19,260 37,392
British Columbia 30,526 62,003
Territories 256 477Yukon 143 251Northwest Territories 113 226Source: Statistics Canada, 2016 Dwelling Classification Survey.
3.1.2 Housing stock overcoverage
Table 6.3.1.2 shows the estimated number of unoccupied dwellings not in the housing stock, and the corresponding error rate for unoccupied dwellings for various geographic areas. No adjustments were made to the census database to account for dwellings not in the housing stock that were misclassified as unoccupied.
The enumeration of unoccupied dwellings that fall outside the housing universe results in dwelling overcoverage. Dwellings are considered to be outside the housing universe if they are used for commercial purposes, if they are not habitable year round, or if they are double counted in the census. Double counting can occur when the dwelling appears to have two addresses associated with it, or when two questionnaires are mistakenly returned for a dwelling that no longer contains a separate apartment.
The DCS estimates of the number of unoccupied dwellings misclassified as dwellings were not used to adjust the census database because of the degree of subjectivity associated with classifying a dwelling as suitable for year-round occupancy. A dwelling must have a source of heat or power and provide complete shelter from the elements to be considered suitable for year-round occupancy. It is sometimes difficult to tell whether or not a dwelling is habitable, such as when a dwelling is a cottage, is under construction and almost complete, or has deteriorated.
Dwellings outside the housing stock accounted for 9.8% of all dwellings classified as unoccupied. Among the provinces and territories, the incidence of dwellings outside the housing stock being classified as unoccupied ranged from 5.2% in Prince Edward Island to 17.2% in Yukon. The problem had a similar prevalence in urban areas (9.7%) and rural areas (10.0%).

Statistics Canada – Catalogue no. 98-303-X2016001 31
Coverage Technical Report
Dwellings actually outside the housing stock represented 0.8% of all private dwellings in the 2016 Census. This was a slight increase from the 2011 error rate of 0.6%. Among the provinces and territories, the error ranged from a low of 0.1% in the Northwest Territories to a high of 1.4% in New Brunswick.
6
Table 6.3.1.2 Dwellings not in housing stock misclassified as unoccupied for various geographic areas, 2016 Census
Geographic areas
Number of unoccupied
dwellings
Dwellings not in housing stock misclassified as unoccupied
Estimated number
Standard error
Estimated rate1 (%)
Standard error (%)
Canada 1,187,392 116,547 6,593 9.8 0.6Urban (population over 50,000) 680,629 66,124 5,161 9.7 0.8Rural 506,763 50,423 4,103 10.0 0.8
Atlantic provinces 144,073 11,693 955 8.1 0.7Newfoundland and Labrador 43,770 2,880 423 6.6 1.0Prince Edward Island 10,909 563 80 5.2 0.7Nova Scotia 51,940 3,838 556 7.4 1.1New Brunswick 37,454 4,411 646 11.8 1.7
Quebec 289,593 22,323 2,181 7.7 0.8
Ontario 378,298 37,833 4,736 10.0 1.3
Prairies 204,641 19,584 2,323 9.6 1.1Manitoba 36,147 2,507 547 6.9 1.5Saskatchewan 54,414 4,341 1,007 8.0 1.9Alberta 114,080 12,736 2,020 11.2 1.8
British Columbia 169,340 24,945 3,159 14.7 1.9
Territories 1,447 169 0 11.7 0.0Yukon 874 150 0 17.2 0.0Northwest Territories 573 19 0 3.3 0.01. The rate is the estimated number of dwellings not in housing stock misclassified as unoccupied as a percentage of all unoccupied dwellings.Source: Statistics Canada, 2016 Dwelling Classification Survey.
.3.2 Non-response dwellings
6.3.2.1 Persons added in non-response dwellings
Table 6.3.2.1.1 gives the estimated number and rate of occupied non-response dwellings in the census by urban (population over 50,000) and rural area, and by province and territory. Table 6.3.2.1.2 gives the number of persons estimated by the DCS to be living in these non-response dwellings, and Table 6.3.2.1.3 gives the same information for the 2011 DCS.
Table 6.3.2.1.1 shows that 63.1% of all dwellings classified as non-response were actually occupied. The census did relatively the same job of classifying non-response dwellings in urban areas (63.5%) as it did in rural areas (61.4%). At the province and territory level in 2016, Quebec had the highest rate of correctly classified non-response dwellings, at 67.8%, while New Brunswick had the lowest rate, at 53.4%.

32 Statistics Canada – Catalogue no. 98-303-X2016001
Coverage Technical Report
Table 6.3.2.1.2 shows the number of non-response dwellings in the 2016 Census, and gives the number of persons added in those dwellings through the DCS. Table 6.3.2.1.3 shows the same data from the 2011 DCS. In 2016, a total of 357,666 persons were added to the census in 179,823 dwellings. The comparable 2011 numbers were 443,098 persons in 220,181 dwellings.
Table 6.3.2.1.1 Occupied non-response dwellings for various characteristics, 2016 Census
Characteristics
Number of non-response
dwellings
Occupied non-response dwellingsEstimated
numberStandard
errorEstimated
rate1 (%) Standard error (%)
Canada 284,966 179,823 2,525 63.1 0.9Urban (population over 50,000) 227,692 144,678 2,219 63.5 1.0Rural 57,274 35,145 1,205 61.4 2.1
Atlantic provinces 20,914 11,371 487 54.4 2.3Newfoundland and Labrador 4,779 2,637 313 55.2 6.5Prince Edward Island 1,302 802 64 61.6 4.9Nova Scotia 7,839 4,199 272 53.6 3.5New Brunswick 6,994 3,733 248 53.4 3.6
Quebec 58,039 39,376 1,110 67.8 1.9
Ontario 91,159 58,195 1,536 63.8 1.7
Prairies 64,103 38,020 1,264 59.3 2.0Manitoba 10,811 6,375 586 59.0 5.4Saskatchewan 11,143 6,453 333 57.9 3.0Alberta 42,149 25,191 1,070 59.8 2.5
British Columbia 50,016 32,418 973 64.8 1.9
Territories 735 444 0 60.4 0.0Yukon 405 227 0 56.1 0.0Northwest Territories 330 217 0 65.7 0.01. The rate is the estimated number of occupied non-response dwellings as a percentage of all non-response dwellings.Source: Statistics Canada, 2016 Dwelling Classification Survey.

Statistics Canada – Catalogue no. 98-303-X2016001 33
Coverage Technical Report
Table 6.3.2.1.2 Persons living in occupied non-response dwellings for various characteristics, 2016 Census
Characteristics
Occupied non-response dwellings
Persons living in occupied
non-response dwellingsEstimated
numberStandard
errorEstimated
numberStandard
error
Canada 179,823 2,525 357,666 7,800Urban (population over 50,000) 144,678 2,219 286,286 7,204Rural 35,145 1,205 71,380 2,990
Atlantic provinces 11,371 487 22,686 1,163Newfoundland and Labrador 2,637 313 5,054 686Prince Edward Island 802 64 1,459 130Nova Scotia 4,199 272 8,651 783New Brunswick 3,733 248 7,523 503
Quebec 39,376 1,110 68,744 2,761
Ontario 58,195 1,536 125,071 5,541
Prairies 38,020 1,264 78,093 3,226Manitoba 6,375 586 13,312 1,239Saskatchewan 6,453 333 12,795 996Alberta 25,191 1,070 51,986 2,807
British Columbia 32,418 973 62,089 3,278
Territories 444 0 983 0Yukon 227 0 452 0Northwest Territories 217 0 531 0Source: Statistics Canada, 2016 Dwelling Classification Survey.

34 Statistics Canada – Catalogue no. 98-303-X2016001
Coverage Technical Report
6.
Table 6.3.2.1.3 Persons living in occupied non-response dwellings for various characteristics, 2011 Census
Characteristics
Occupied non-response dwellings
Persons living in occupied
non-response dwellingsEstimated
numberStandard
errorEstimated
numberStandard
error
Canada 220,181 3,160 443,098 8,924Urban (population over 50,000) 181,105 2,506 361,319 7,604Rural 39,076 1,980 81,778 4,841
Atlantic provinces 16,582 465 33,240 1,221Newfoundland and Labrador 2,720 186 5,478 463Prince Edward Island 753 50 1,476 129Nova Scotia 7,162 332 14,496 804New Brunswick 5,946 263 11,790 783
Quebec 54,110 1,481 101,503 4,021
Ontario 76,310 2,199 159,370 6,382
Prairies 39,587 1,125 81,567 3,289Manitoba 7,657 497 16,260 1,542Saskatchewan 6,595 563 13,892 1,571Alberta 25,335 838 51,415 2,444
British Columbia 33,063 1,301 66,433 3,471
Territories 530 0 985 0Yukon 373 0 696 0Northwest Territories 157 0 289 0Source: Statistics Canada, 2011 Dwelling Classification Survey.
3.2.2 Dwellings not in the housing stock misclassified as non-response
Table 6.3.2.2 shows the 2016 Census dwelling classification error from dwellings misclassified as non-response because they should not have been included in the housing stock. Section 6.3.1.2 provides the definition of dwellings outside the housing universe and comments on the difficulty in determining whether a dwelling should be included in the housing stock.
At the national level, dwellings outside the housing stock accounted for 4.0% of all non-response dwellings. The error rate was higher in rural areas (5.2%) than urban areas (3.7%). For provinces and territories, the incidence of dwellings outside the housing stock being classified as non-response ranged from 1.6% in Prince Edward Island to 9.2% in Manitoba. At the national level, non-response dwellings outside the housing stock accounted for 0.1% of all private dwellings. This error was rounded to 0.0% in Prince Edward Island, 0.2% in Manitoba and Yukon, and 0.1% in all other provinces and in the Northwest Territories.

Statistics Canada – Catalogue no. 98-303-X2016001 35
Coverage Technical Report
Table 6.3.2.2 Dwellings not in housing stock misclassified as non-response dwellings for various geographic areas, 2016 Census
Geographic areas
Number of non-response
dwellings
Dwellings not in housing stock misclassified as non-response dwellings
Estimated number
Standard error
Estimated rate1 (%)
Standard error (%)
Canada 284,966 11,445 1,178 4.0 0.4Urban (population over 50,000) 227,692 8,477 1,076 3.7 0.5Rural 57,274 2,969 480 5.2 0.8
Atlantic provinces 20,914 954 166 4.6 0.8Newfoundland and Labrador 4,779 196 82 4.1 1.7Prince Edward Island 1,302 21 9 1.6 0.7Nova Scotia 7,839 275 86 3.5 1.1New Brunswick 6,994 462 116 6.6 1.7
Quebec 58,039 1,852 433 3.2 0.7
Ontario 91,159 3,834 651 4.2 0.7
Prairies 64,103 3,050 762 4.8 1.2Manitoba 10,811 994 694 9.2 6.4Saskatchewan 11,143 422 122 3.8 1.1Alberta 42,149 1,634 288 3.9 0.7
British Columbia 50,016 1,710 411 3.4 0.8
Territories 735 45 0 6.1 0.0Yukon 405 25 0 6.1 0.0Northwest Territories 330 20 0 6.2 0.01. The rate is the estimated number of dwellings not in housing stock misclassified as non-response dwellings as a percentage of all non-response dwellings.Source: Statistics Canada, 2016 Dwelling Classification Survey.

36 Statistics Canada – Catalogue no. 98-303-X2016001
Coverage Technical Report
7. Reverse Record Check
The primary purpose of the Reverse Record Check is to estimate the number of persons in the 2016 Census target population who were not enumerated by the census at the national, provincial and territorial levels. A sample of close to 70,000 persons was drawn from six sampling frames independent of the 2016 Census. The data for the selected persons (SPs) were linked with tax data and other administrative sources to obtain recent information about SPs’ usual residence, contact addresses, and household members or related groups of persons.
A series of complex automated linkages and manual searches was done to find each SP in the 2016 Census Response Database (RDB). The census coverage studies, including the Reverse Record Check, were conducted based on the version of the RDB that was available in early October 2016 (i.e., before the end of census processing). This version, which predates the final 2016 RDB, was called the CCS-RDB. There are a few minor differences between the CCS-RDB and the later versions of the census databases. The CCS-RDB, a database of persons, comprises all the records of enumerated persons, except three record groups: census records imputed through whole household imputation (WHI); all census records that were added late (after the start of RRC processing), though this was rare in 2016 compared with the two preceding cycles; and census records called “incomplete enumerations.” Section 7.4.6 provides more information on incomplete enumerations.
When a search produces no matches, a multimode collection process is initiated to determine whether the SP was a member of the target population, and to get additional information (particularly addresses) to help find the SP in the CCS-RDB. At the end of the search, each SP is classified as out-of-scope (deceased, emigrated, temporarily outside Canada), enumerated or missed. A small number of non-response cases, consisting mostly of persons who could not be traced during collection, must be processed and are used to adjust respondent weights based on a non-response adjustment model.
7.1 Sampling
The sampling frame for the RRC’s target population, which includes all persons who should have been enumerated in the 2016 Census, was constructed from six frames independent of the census. The first five frames were used to select a sample for estimating undercoverage in the 10 provinces, while estimates for the three territories were calculated using samples from the last frame only.
At the provincial level, sampling began with the persons who were in the 2011 Census target population. This included all persons enumerated in the 2011 Census and all persons missed by the 2011 Census, represented by the portion of the sample of SPs from the 2011 RRC who were classified as missed. To take into account persons added to the target population since the previous census, intercensal (i.e., between the 2011 and 2016 censuses) births and immigrants were added, as were non-permanent residents as of Census Day in 2016. The data sources for these frames are as follows:
• Census frame: Persons who were enumerated in the 2011 Census and appear in the 2011 CCS-RDB.• Missed frame: There is no comprehensive list of missed persons. However, there is a representative
sample of these persons: the 2011 RRC sample of SPs classified as missed. They were all included in the 2016 sample with their 2011 weights.
• Birth frame: Vital statistics data on intercensal births. Since the final vital statistics file on births was only available late, the RRC sample of births was drawn from a mix of vital statistics preliminary, final and raw data files.
• Immigrant frame: Administrative data from Immigration, Refugees and Citizenship Canada (IRCC) on immigrants who arrived in Canada during the intercensal period.
• Non-permanent resident frame: Administrative data from IRCC on persons claiming refugee status on Census Day and persons holding a valid work or study permit on Census Day.

Statistics Canada – Catalogue no. 98-303-X2016001 37
Coverage Technical Report
For each territory, the only frame consisted of health insurance files for persons eligible for health care on Census Day. Although these frames have excellent coverage, the frame used for the territories is not complete, and the sample weight must be adjusted to correct the undercoverage. Each frame for a given territory is independent of the other territory frames and is used to estimate the undercoverage only for that given territory. The territory frames are also not used to estimate undercoverage in the provinces.
None of the first five frames for the provinces covered persons who had emigrated or who were outside Canada during the 2011 Census and did not complete a 2011 Census questionnaire and who returned during the intercensal period (“returning Canadians within a province”). According to the 2016 Census long-form questionnaire, the number of persons in this group was estimated at 241,361. In addition, the number of persons returning from a territory to a province was estimated at 12,106. Added to this number were 18,528 persons from Indian reserves or settlements that were partially enumerated in 2011 and enumerated in 2016. Also, persons born after the 2011 Census outside Canada or in the territories who have Canadian citizenship and who returned to one of the provinces by Census Day in 2016 were not covered by the first five RRC census frames. According to the 2016 Census long-form questionnaire, the number of persons in this group was estimated at 17,243. Coverage error estimates do not include these populations, which total an estimated 289,238 persons.
One problem with using multiple sampling frames is the possibility that the same person could be included in more than one frame. For example, a person in the immigrant frame may have been in Canada on a work permit in May 2011, and therefore may have been enumerable in the 2011 Census. That person would then be in both the immigrant frame and the census frame if they were enumerated, or in the immigrant frame and the missed frame if they were not enumerated. Consequently, it is important to identify all cases of frame overlap. Otherwise, estimates may be too high because some people are included twice in the frames. Whenever possible, this overlap is identified when the sampling frames are constructed, but some overlap is also identified later using information provided by respondents.
The sample design varied by frame depending on the type of list used. A one-stage stratified design was used for the 2011 Census frame. The population was stratified by province of residence, sex, age and marital status. Persons enumerated on Indian reserves in the 2011 Census were placed in separate strata. Before the frame was stratified, a deterministic linkage with the tax data frame was done. About 96% of individuals were linked. Persons identified as deceased based on tax data were placed in a take-all stratum of deceased persons. The most recent province of residence was then derived based on tax data and was used to stratify the frame by province (province of selection). Persons who were not linked to tax data or persons who were linked but whose address was located outside the 10 provinces were stratified according to their province from the 2011 Census. Then, in each province of selection, people were assigned to one of the following 13 strata based on sex, age (on Census Day in 2011) and marital status:
• Indian reserves (all ages and sexes)• females, 0 to 12 years• females, 13 to 24 years• females, 25 to 34 years, married*• females, 25 to 34 years, unmarried (including common-law spouses)• females, 35 years and older, married*• females, 35 years and older, unmarried (including common-law spouses)• males, 0 to 12 years• males, 13 to 24 years• males, 25 to 34 years, married*• males, 25 to 34, unmarried (including common-law spouses)• males, 35 years and older, married*• males, 35 years and older, unmarried (including common-law spouses) * For Quebec, married includes common-law spouses.

38 Statistics Canada – Catalogue no. 98-303-X2016001
Coverage Technical Report
The missed frame is a sample-based frame since there is no list of all persons missed in the 2011 Census. The sample for this frame consisted of all cases classified as “missed” in the 2011 RRC. Although the sample was not stratified as such, implicit stratification was inevitable since the 2011 missed cases were from different frames and strata.
To construct the birth frame, copies of intercensal birth registrations were obtained from vital statistics through the National Routing System, which provides faster access to these data. The frame contains all births between May 10, 2011, and May 9, 2016, inclusively. The frame was then stratified by mother’s province of residence.
The immigrant frame was constructed with records from IRCC. The immigrant frame contains all persons who immigrated to Canada between May 10, 2011, and May 9, 2016, inclusively. Those who were non-permanent residents on Census Day in 2011 were removed from the 2016 immigrant frame since they were already covered by the 2011 Census frame or by the 2011 missed frame. This frame was stratified by province of destination of immigrants. Immigrants in all provinces, except the four Atlantic provinces, were then separated into two strata according to their date of immigration. The first stratum consisted of immigrants who arrived between May 10, 2011, and May 9, 2015, and the second consisted of immigrants who arrived between May 10, 2015, and May 9, 2016, because newer immigrants are usually more likely to be missed in the census.
The non-permanent resident frame (permit holders and refugee claimants) was constructed with IRCC records. As with intercensal immigrants, non-permanent residents on Census Day in 2011 were removed from the 2016 non-permanent resident frame. The frame was stratified by province of destination of non-permanent residents. Because a large number of non-permanent residents did not provide a province of destination (being open permit holders), they were placed in a national stratum.
In the provinces, it was decided that the total size of the 2016 sample would be similar to that of the 2011 RRC. Sample allocation was done in two stages.
First, the national sample was allocated to the provinces to obtain similar standard errors for the undercoverage rate between similar-sized provinces. Smaller standard errors were sought for larger provinces than for smaller provinces to help obtain a small standard error at the national level. The standard errors sought for the undercoverage rate varied between 0.31% and 0.50%.
Second, the provincial samples were allocated to the provincial strata. The sample size of the stratum for the 2011 missed frame was already set because everyone who was classified as “missed” in the 2011 RRC was selected. The remaining sample size in each province was then allocated by optimal allocation based on historical undercoverage rates, historical non-response rates, and stratum size. Sampling fractions were not the same in all strata. To make the sample design more efficient, higher sampling rates were used in subgroups for which significant undercoverage or a lower tracing rate was expected. For example, like in the 2011 RRC, single men aged 18 to 29 in 2016 had a greater probability of being selected, since it was observed in previous RRCs that undercoverage was consistently higher in that stratum. Because of increased interest in studies of Aboriginal populations, the samples in the provincial strata for persons enumerated on Indian reserves in the 2011 Census were larger than the optimal allocation results suggested. However, the sample sizes were adjusted downward relative to optimal allocation for the non-permanent resident strata to avoid increasing too much the size of the RRC sample that required field collection. Compared with that of the 2011 RRC, the sample of non-permanent residents nevertheless increased by about 1,000 persons in the 2016 RRC.
Note that the resulting allocation was only approximately optimal since assumptions were made about the size of certain populations, including the expected number of intercensal births and immigrants at the time of the allocation. The actual size of the provincial sample of births, immigrants and non-permanent residents was unknown until all the samples were selected. The final total allocated sample was 67,842 persons distributed across the frames in the provinces. Table 7.1.1 shows the final sample allocation by stratum for all provinces.

Statistics Canada – Catalogue no. 98-303-X2016001 39
Coverage Technical Report
T
Table 7.1.1 Sample allocation, sampling frames and strata for all provinces
Sampling frames Strata within each provinceNumber of
persons
Total ... 67,872
2011 Census
Females, 0 to 12 years 3,135Females, 13 to 24 years 4,907Females, 25 to 34 years, married1 1,207Females, 25 to 34 years, not married 1,915Females, 35 years and older, married1 7,060Females, 35 years and older, not married 5,536Males, 0 to 12 years 3,549Males, 13 to 24 years 5,410Males, 25 to 34 years, married1 1,350Males, 25 to 34 years, not married 2,723Males, 35 years and older, married1 8,960Males, 35 years and older, not married 5,844On reserve 2,067
2011 Missed No further stratification 4,745Births No further stratification 4,026
ImmigrantsBetween May 10, 2011, and May 9, 20152 2,198Between May 10, 2015, and May 9, 2016 760
Non-permanent residentsWith permit in a province 2,345With open permit 135
... not applicable1. In Quebec only, persons in common-law relationships are included in the married strata.2. There was only one stratum in these four provinces: Newfoundland and Labrador, Prince Edward Island, Nova Scotia, and New Brunswick.Source: Statistics Canada, 2016 Reverse Record Check.
he sampling methodology for the territories was similar to the one used in 2011, with some changes. The sampling frames for the three territories were constructed from their respective health insurance files. The people included in the sampling frame for each territory were then matched with the 2016 Census Response Database (CCS-RDB) using systems developed for information processing (see Section 7.2.1). This frame excluded incomplete enumerations. A manual verification was also performed to confirm that the matched cases were actually the same individuals. Persons matched in their territory (in the same territory as in the sampling frame) were classified as “enumerated” and were assigned a weight of 1. Persons matched outside their territory then formed a separate stratum. Next, unmatched persons were separated into six strata by age and sex (see Table 7.1.2).
For sample allocation to the territories, the first step involved determining the total sample to be allocated to each territory to achieve similar and adequate precision for undercoverage. The precision achieved for the 2011 RRC differed greatly between the territories and was of lower quality, particularly in Nunavut. In 2016, the standard error sought for the undercoverage rate was 0.6% in Yukon and the Northwest Territories, and 0.65% in Nunavut. Consequently, in 2016, the sample sizes for the territories were increased where necessary to obtain the desired precision. Then, the sample for each territory was allocated to the six strata (by age and sex) proportionately to their size because the missed rate does not usually vary much between the strata. A small additional sample (varying between 55 and 80 per territory) was also allocated to the stratum of persons matched outside their territory. The sole purpose of this sample was to ensure that these persons were not also enumerated in their territory because, if they were, this enumeration would be given precedence for the RRC. This additional sample was not sent to RRC collection, as those people were already found in the CCS-RDB.
Table 7.1.2 shows the allocation by stratum for all territories.

40 Statistics Canada – Catalogue no. 98-303-X2016001
Coverage Technical Report
T
Table 7.1.2 Sample allocation, strata by territoryStrata Yukon N.W.T Nunavut Total
Matched within territory 30,040 30,160 25,220 85,420Matched outside territory 1,352 2,093 1,635 5,080Control sample 55 80 65 200Unmatched 560 805 1,030 2,395Females, 0 to 17 years 38 93 199 330Females, 18 to 29 years 61 85 107 253Females, 30 years and older 146 196 188 530Males, 0 to 17 years 39 98 203 340Males, 18 to 29 years 68 94 118 280Males, 30 years and older 208 239 215 662Source: Statistics Canada, 2016 Reverse Record Check.
able 7.1.3 shows the sample allocation for Canada, the provinces and the territories.
Table 7.1.3 Sample size for Canada, provinces and territoriesProvinces and territories Number of persons
Canada 155,887
All provinces 67,872Newfoundland and Labrador 4,558Prince Edward Island 4,365Nova Scotia 6,084New Brunswick 3,858Quebec 7,766Ontario 11,771Manitoba 5,780Saskatchewan 6,730Alberta 7,022British Columbia 9,803NPR-CA1 135
All territories 88,015Matched in territory 85,420Unmatched in territory 2,595
Yukon 30,655Matched in territory 30,040Unmatched in territory 615
Northwest Territories 31,045Matched in territory 30,160Unmatched in territory 885
Nunavut 26,315Matched in territory 25,220Unmatched in territory 1,0951. Non-permanent residents - Canada.Source: Statistics Canada, 2016 Reverse Record Check.

Statistics Canada – Catalogue no. 98-303-X2016001 41
Coverage Technical Report
A systematic sampling method within the strata was used to select the samples. Here is the list of sorting variables used to obtain an efficient sample (implicit stratification), classified by sampling frame:
• 2011 Census frame: private or collective dwelling, sex, age and geographic area• birth frame: year of birth and age of mother• immigrant frame: year of immigration and age• non-permanent resident frame: type of permit, sex and age• territory frame: geographic area and age.
No sampling was needed for the 2011 missed frame since all missed persons from the 2011 RRC were selected in the sample for the 2016 RRC.
Once the provincial and territorial samples were selected, they had to be prepared by checking the quality of the information for the different variables of interest, i.e., the geographic and demographic variables. For example, the quality of names was checked, and birth dates were validated. Addresses were standardized to facilitate subsequent processing activities. To update the geographic information, especially for the census sample and the missed sample (for which the information was from 2011), these were linked with Canada Revenue Agency (CRA) records, including personal income tax records for 2010 to 2015 and Canada Child Tax Benefit records for 2011 to 2016. CRA files and vital statistics data were also used to check whether any selected persons had died. This preparation stage was important because it helped to determine the persons enumerated in the census frames, and to contact persons not found and interview them.
7.2 Processing and classification
7.2.1 Processing
The objective of processing is to provide information for the classification of SPs for the purposes of non-response adjustment and estimation. Specifically, processing is carried out to:
• determine whether the SPs are enumerated in the Census Response Database• determine whether the SPs are in the census target population• provide further information for non-response adjustment.
The processing results were recorded in a classification assigned to each SP for estimation and tabulation purposes (see Section 7.4 and Section 9).
Most of the processing work involved automated and computer-assisted searching of the census coverage studies version of the 2016 Census Response Database (CCS-RDB) to determine whether or not the SP was enumerated.
Various elements of information were used for searching, including surnames, given names and birth dates. Telephone numbers and addresses associated with the SP or members of their household were also used. Questionnaires in which the SP could have been listed were identified from a variety of sources, including the following:
• matches with the CCS-RDB using the birth date and sex of the SP and members of the household, or the SP’s name, postal code or telephone number
• selection addresses from the sampling frame• address updates from tax records• information from the computer-assisted telephone interview (CATI) (see Section 7.3).

42 Statistics Canada – Catalogue no. 98-303-X2016001
Coverage Technical Report
The first step after sample preparation was to search the CCS-RDB for each SP by processing all SPs with the addresses available from the sampling frame and tax data. There were two outcomes. When the SP was found, they were usually classified as “enumerated,” and no further processing was required, except for SPs who were later identified through vital statistics information as being deceased before the census. When the SP was not found, the case was sent for collection. While collection was taking place, the CCS-RDB search continued. When CATI data were available, researchers could determine whether or not each SP was part of the census target population. If so, the CATI data could enable further searching.
Searching for the SP was done both automatically and manually by coding staff guided by subject matter experts. To ensure coding uniformity, coding staff were provided with a highly detailed procedure manual that spelled out the specific steps for coding the search results. Automated searches were conducted first. For addresses obtained from a match with the CCS-RDB, there was a corresponding census questionnaire. A measure of similarity between the census questionnaire and the Reverse Record Check data was calculated. When this measure was above a specified threshold, it was automatically concluded that the SP was enumerated at that address. In these cases, neither this address nor the SP’s other addresses needed to be processed by the coding staff. Computer programs also determined when one address was a duplicate of another. These duplicate addresses also did not need to be processed.
For other cases, a manual linkage was conducted using DocLink’s Interactive Verification Application (DIVA), an application developed specifically for this operation. The coding staff used a number of tools for this process, such as Geographical Reference Files, electronic telephone directories and the Street Attributes File. There were often suggested census questionnaires or census collection units that matched the address that was used as the first step for searching. Staff could also search the CCS-RDB using flexible parameters further in the process (searching by name, date of birth, etc). The results of the manual search were then automatically edited via DIVA built-in edits to minimize errors. A file containing the search results was then produced. The data from this file were used to classify SPs.
7.2.2 Classification
Processing provides the information required to determine whether SPs were:
• included in the “census target population” or “out of scope” (not included)• “classified” or “not classified”• “listed” or “not listed”• “identifiable” or “non-identifiable”• “enumerated”• “missed.”
Some SPs fit into more than one category, which will be explained in greater detail in this section.
7.2.2.1 “Target population” or “out of scope” classification
The “census target population” includes the group of persons noted in Section 2.2. An SP was considered “out of scope” if they were not in the census target population. Each SP classified as “out of scope” was assigned one of the following statuses: deceased, emigrated or represented by another sampling frame. For a person to be classified as deceased, they had to appear in the vital statistics death files or had to have been reported as deceased in income tax files or the collection interview. Permanent or temporary emigrants were also determined through a collection interview based on certain criteria and on the responses provided regarding their place of residence on Census Day, the amount of time they had spent outside Canada, their intention to return to live in Canada, and the reason they were outside Canada on Census Day. Other SPs were also classified as “listed emigrants,” regardless of whether they were respondents during collection. These were non-permanent residents (from the 2011 Census and missed frames) who did not have a permit in 2016 or had not had an immigrant status since 2011.

Statistics Canada – Catalogue no. 98-303-X2016001 43
Coverage Technical Report
SPs classified as “represented by another sampling frame” included cases selected in a province but classified in one of the three territories. Cases selected in a territory but classified in a province or another territory were also classified as “represented by another sampling frame.”
SPs classified in the census target population were either “enumerated,” “missed” or “not classified” (see Section 7.2.2.2). An SP was considered “enumerated” if they were in the CCS-RDB. SPs in the census target population were classified as “missed” if they were not enumerated or “not classified.”
7.2.2.2 Classification for non-response and non-response adjustment
Whether an SP was classified as “listed” or “not classified” depended on the usefulness of the addresses provided and the CATI information. In many cases, collection provided information and one or more addresses that could not be found from other sources. In other cases, all the addresses and all the information obtained through collection could be found from other sources.
An SP was “listed” if they were classified without using CATI data; even if data were collected, the addresses and information collected through the interview were not required.
A person was considered “not classified” if it was possible to determine whether they were in the target population but not whether they were missed. This occurred when place of residence on Census Day, as defined in Section 2.4, was known but not identified in the CCS-RDB. Persons whose place of residence on Census Day was not specific enough (e.g., only the name of a large city) and persons without a fixed address were included in this category.
SPs for whom one or more of the characteristics in the list above could not be determined were considered non-respondents. There are three types of non-respondents:
• An SP was “not identified” when it could not be determined whether they were listed. In other words, since the information about the SP was incomplete, it was impossible to link the SP with the CCS-RDB or to collect their information through an interview.
• An SP was “not traced” when it could not be determined whether they were included in the census target population.
• A “not classified” SP was deemed to be partial non-response. It was known that the person was in the target population but not whether they were missed or enumerated.
7.2.2.3 Distribution of the sample by classification
Table 7.2 shows the distribution of the sample by classification and sampling frame. The classification was determined from specific combinations of the characteristics listed above. Initially, a total sample of 67,872 SPs was selected in the provinces. Of that number, 58,808 SPs were classified as “enumerated,” 4,821 as “missed,” and 2,268 as non-respondents, 357 of whom were classified as “not classified.” The other 1,975 SPs were classified as “out of scope,” specifically 857 deaths, 934 emigrants (permanent or temporary) and 184 for other reasons. A non-response adjustment was made during estimation (see Section 7.4). It is important to note that for classification, and therefore for estimation, the definition of a non-respondent was not the same as the usual definition of a non-respondent for whom data collection was attempted but not completed. This is because classification was based on data from many sources, including collection. To prevent any confusion, Section 7.3 on collection refers to “completed collection” rather than “response.”
Persons in the territory sampling frames were assigned to the matched stratum or the unmatched strata. The matched stratum corresponds to the initial processing of records from the territorial sampling frames. These cases were processed in the same way that the sample was processed: in DIVA using processing procedures specific to the territories. Of the 121,892 persons in the territorial sampling frame, 85,420 SPs were classified as “enumerated.” A total sample of 2,595 SPs was selected from the unmatched persons. Of that number, 655 SPs

44 Statistics Canada – Catalogue no. 98-303-X2016001
Coverage Technical Report
were classified as “enumerated,” 1,128 as “missed,” and 441 as non-respondents, 105 of whom were classified as “not classified.” The other 371 SPs were classified as “out of scope,” specifically 25 deaths, 15 emigrants (permanent or temporary) and 331 who were classified in a province or another territory.
7.2.2.4 Implications of the classification
“Traced” SPs are SPs for whom it was possible to determine whether they were included in the census target population. For purposes of estimation and tabulation, traced SPs who were also classified were the respondents. Since names, including those of household members, and addresses were available in the CCS-RDB, and since the tools for consulting the database were sufficiently powerful, it was possible to verify whether an SP was enumerated at an address even if the address provided was vague.
The usefulness of knowing whether an SP was enumerated is self-evident. SPs who were in the census target population but who were not enumerated and were therefore classified as “missed” formed the basis for the undercoverage estimate. We also wanted to classify SPs according to the above-mentioned characteristics so that the most appropriate respondents could be chosen to represent non-respondents.
Lastly, except for SPs who were not classified, the Census Day address (usual place of residence) of each SP in the census target population was determined. This is the address where, according to census instructions, the SP should have been enumerated. If the SP was enumerated, the enumeration address was considered to be the Census Day address, despite other information provided that might suggest that the census instructions were not well understood.
For more information on processing and classification, see Parenteau (2017).

Statistics Canada – Catalogue no. 98-303-X2016001 45
Coverage Technical Report
Table 7.2 Classification of selected persons, sampling frames for Canada
Classification
Provincial strata2011
Census Missed Births ImmigrantsNon-permanent
residents number % number % number % number % number %
Total 53,663 100.0 4,745 100.0 4,026 100.0 2,958 100.0 2,480 100.0
Enumerated 48,462 90.3 3,278 69.1 3,575 88.8 2,287 77.3 1,206 48.6Listed 48,244 89.9 3,257 68.6 3,573 88.7 2,279 77.0 1,183 47.7Unlisted 218 0.4 21 0.4 2 0.0 8 0.3 23 0.9
Missed 2,906 5.4 710 15.0 290 7.2 339 11.5 576 23.2Listed 416 0.8 81 1.7 42 1.0 31 1.0 39 1.6Unlisted 2,490 4.6 629 13.3 248 6.2 308 10.4 537 21.7
Out of scope 1,158 2.2 471 9.9 45 1.1 175 5.9 126 5.1Listed 781 1.5 328 6.9 21 0.5 81 2.7 13 0.5Unlisted 377 0.7 143 3.0 24 0.6 94 3.2 113 4.6
Non-response 1,137 2.1 286 6.0 116 2.9 157 5.3 572 23.1Traced not classified 196 0.4 55 1.2 24 0.6 11 0.4 71 2.9Identified not traced 933 1.7 231 4.9 92 2.3 146 4.9 499 20.1Not identified 8 0.0 0 0.0 0 0.0 0 0.0 2 0.1
Classification
Territorial strataTotalMatched Unmatched
number % number % number %
Total 85,420 100.0 2,595 100.0 155,887 100.0
Enumerated 85,420 100.0 655 25.2 144,883 92.9Listed 85,420 100.0 628 24.2 144,584 92.7Unlisted 0 0.0 27 1.0 299 0.2
Missed 0 0.0 1,128 43.5 5,949 3.8Listed 0 0.0 333 12.8 942 0.6Unlisted 0 0.0 795 30.6 5,007 3.2
Out of scope 0 0.0 371 14.3 2,346 1.5Listed 0 0.0 264 10.2 1,488 1.0Unlisted 0 0.0 107 4.1 858 0.6
Non-response 0 0.0 441 17.0 2,709 1.7Traced not classified 0 0.0 105 4.0 462 0.3Identified not traced 0 0.0 336 12.9 2,237 1.4Not identified 0 0.0 0 0.0 10 0.0Source: Statistics Canada, 2016 Reverse Record Check.

46 Statistics Canada – Catalogue no. 98-303-X2016001
Coverage Technical Report
7.3 Collection
7.3.1 Environment
Head office staff in Ottawa worked closely with staff in five Statistics Canada regional offices (ROs) to collect data during the survey phase of the RRC. These regional offices were located in Halifax, Sherbrooke, Sturgeon Falls, Winnipeg and Edmonton. The suggestions and recommendations made by the regional offices as a result of conducting the 2011 RRC were incorporated into the design and operations of the 2016 survey. Head office provided a CATI application that met the survey needs and was interviewer- and respondent-friendly.
Samples were assigned to regional offices based on head office’s “best guess” about where the SP was residing during the collection period. Once a case was assigned to a regional office, it was never transferred to another RO, even if it was determined that the SP had moved outside the RO collection area. RO coverage areas and survey counts are shown in Table 7.3.1.
T
Table 7.3.1 Geographic coverage for regional officesRegional offices Coverage Number of cases
Total Canada 15,584
HalifaxNewfoundland and Labrador, Prince Edward Island, Nova Scotia 2,707
Sherbrooke New Brunswick, Quebec, Manitoba 3,148Sturgeon Falls Ontario, Saskatchewan 3,715Winnipeg Alberta, Yukon, Northwest Territories, Nunavut 3,691Edmonton British Columbia 2,323Source: Statistics Canada, 2016 Reverse Record Check.
he RRC sample size was 155,887 (Section 7.1 describes the sample design). Pre-collection processing attempted to find these cases on the CCS-RDB. Those found were classified as “enumerated,” and did not need to be sent to collection. However, a subsample of these cases were sent to collection for use in calculating the non-response adjustment (detailed in Section 7.4). All the cases that were not found on the CCS-RDB were sent to collection. The total number of cases sent to collection (the collection sample size) was 15,584: 6,533 subsample cases and 9,951 regular cases (those not found on the CCS-RDB).
There were three versions of the RRC survey questionnaire: non-proxy (the SP responds for themselves), proxy (someone else responds for the SP) and deceased (for SPs deceased before Census Day). Questionnaire content focused on determining whether the SP was in scope for the census and collecting addresses where the SP lived (and thus where they may have been enumerated) on and around Census Day. Names and demographic data were also collected for all Census Day household members. By design, collection was proxy for SPs who were younger than 18 years of age or presumed deceased. Proxy respondents were also used when the SP was not available during the collection period or was difficult to reach. Overall, 28% of the completed cases were completed by a suitable proxy.
For deceased SPs, it was important to determine whether they had died before, on, or after Census Day since different paper questionnaires and CATI flows were used depending on the date of death. In some cases—for example, by matching tax records and vital statistics—SPs were determined to be deceased before Census Day prior to collection. These cases were not sent for collection. However, when in doubt, cases were sent for collection with a flag indicating that the SP was presumed deceased.
It was imperative that the correct SP (or a proxy for the correct SP) was interviewed. The purpose of the RRC survey is to use the collected data about the SP to try to find that SP on the CCS-RDB, and to classify them as enumerated, missing from the census or out of scope. If data are collected about the wrong person, then the

Statistics Canada – Catalogue no. 98-303-X2016001 47
Coverage Technical Report
matching and resulting classification would be incorrect. The CATI system was designed and interviewers were instructed to verify that the person they were interviewing was the correct SP at the beginning of the interview. If an interview was completed with someone other than the SP (e.g., someone with a similar name and date of birth), then the case was sent back to the regional office to be completed with the correct person.
Although the 2016 RRC was a multi-mode survey, the main data collection mode was computer-assisted telephone interview (CATI). The CATI application was developed using many of the standards set for all CATI questionnaires used at Statistics Canada. The application consisted of various integrated modules linked to a tracing application. Interviewers were assigned cases based on language and whether cases required tracing or not.
The secondary collection mode was self-enumeration. Paper questionnaires in both official languages were available for SPs who were contacted by telephone and requested a paper questionnaire. SPs who were not contacted by the regional offices by telephone and who had a valid mailing address were sent a paper questionnaire package from head office that contained the different questionnaire versions, a cover letter explaining the survey and instructions on choosing the right questionnaire. Instructions on how to complete the paper questionnaires were printed on the first page of the questionnaires.
The third collection mode was field interviewers recording SP responses on paper questionnaires. This took place mid-collection in cities across Canada that had numerous incomplete cases and where the regional offices had interviewers available.
Data capture from the paper questionnaires was performed at head office using the CATI application. A great deal of coordination was required to operationalize a sequential multi-mode collection system like the RRC.
7.3.2 Operations
Prior to collection (January 3 to 6), introductory letters were mailed to all cases with a valid mailing address. The letters explained the RRC and advised the SP (or proxy) that they had been selected for the survey. A phone number was provided if they had any questions or if they wanted to call the regional office to complete the survey.
New for the 2016 RRC was the addition of a pre-collection “blitz” where all cases without a valid phone number that had valid mailing addresses were sent paper questionnaires. This initiative served to reduce the tracing burden at the start of collection. These questionnaires were mailed out from January 9 to 13.
The mid-collection blitz, where paper questionnaires were mailed out to all incomplete cases with valid mailing addresses, occurred from April 13 to 20. At that point in collection, all the cases had been touched (either called, attempted to call, traced, or attempted to trace), so this procedure provided another avenue to try to reach the SP.
Field interviews took place in cities with incomplete cases where the regional offices had interviewers available. The field interviews took place from May 17 to June 30. To maximize response, there was considerable overlap between the cases sent out for field interviews and the mid-collection blitz cases. The field interviews were sent out almost a month after the blitz questionnaires were mailed and blitz cases were removed from the field interviewer’s lists as they were completed (either by CATI or by paper questionnaire) so that respondents were not contacted twice.
Data collection began in all regional offices on January 16, 2017. Except for the Winnipeg office, the last day of active collection was June 30, and the last day of passive collection (where regional offices did not make outgoing calls to complete cases, but could complete cases by phone if a respondent called in) was July 15. For Winnipeg, active collection ended on July 31, and passive collection ended on August 31. The Winnipeg office had an extended collection period to improve its response rates. It required more time to trace and complete cases since it had all of the territorial sample, which was delivered into the CATI system later than the start of collection (in March). A total of 12,787 cases were completed during active collection, 65 during passive collection, and 7 more were completed after collection had ended (paper questionnaires received after August 31).

48 Statistics Canada – Catalogue no. 98-303-X2016001
Coverage Technical Report
Survey data were sent electronically to head office from the five regional offices each night after interviewing was completed. Data quality analysis was performed on the data each morning at head office to verify the completeness and accuracy of each case. Cases with missing or ambiguous data in key fields, or where the data collected were for someone other than the SP, were reactivated and sent back to the regional offices for follow-up. There were 26 reactivated cases in the 2016 RRC. Cases that passed the data quality analysis were compiled into batches for processing, as described in Section 7.2.1.
Quality management of the collection operation involved training regional data collection managers at head office, monitoring interviewer training in all regional offices, and retraining and discussing specific data quality issues related to completed cases noted in head office. A ticket-based communication tool was used to centralize and facilitate communication between head office and the regional offices. It tracked all questions and issues and ensured that each one was resolved in a timely manner. Regional office managers allocated resources to the survey while balancing the needs of other surveys taking place in their region. Sustained efforts to interview persons who initially refused to participate in the survey improved response rates.
Table 7.3.2 shows the distribution of cases sent to the regional offices from head office over time. The majority of cases were sent at the start of collection on January 16, and consisted of cases from the census, missed, birth, immigrant and non-permanent resident frames. Cases from the territorial frames were sent on March 7 and March 14. The adjusted total represents the number of cases sent to collection, excluding the cases removed from collection.
D
Table 7.3.2 Regional office workloads by date sent
Date sent in 2017Regional offices
Halifax Sherbrooke Sturgeon Falls Winnipeg Edmonton Total
January 16 2,799 3,289 3,860 1,831 2,351 14,130February 7 8 14 20 5 16 63February 10 0 1 0 0 0 1March 7 15 11 24 872 30 952March 14 2 4 8 1,157 12 1,183March 25 11 10 20 20 12 73July 10 0 0 0 2 0 2Total cases sent 2,835 3,329 3,932 3,887 2,421 16,404Cases dropped by head office1 128 181 217 196 98 820Adjusted total 2,707 3,148 3,715 3,691 2,323 15,5841. Collection was no longer required because the case had been classified in processing as either enumerated or out of scope.Source: Statistics Canada, 2016 Reverse Record Check.
etailed management reports were created at head office on a daily and weekly basis to document survey collection progress. The reports presented the number of cases collected and response rates by outcome code, regional office and stratum.
7.3.3 Tracing
Tracing is the process of searching for contact information for either an SP or a proxy for the SP. It is a major part of the RRC survey. Since the RRC has the most tracing needs of any survey at Statistics Canada, its needs drive the development of the tracing application used in all social surveys.
As part of the sample preparation, cases were linked to tax and other administrative data to provide updated contact information for the SP and their household members. In some cases, initial CATI data were outdated or incomplete, and tracing was required.

Statistics Canada – Catalogue no. 98-303-X2016001 49
Coverage Technical Report
Head office provided tracing leads using several large administrative files—including tax files; Immigration, Refugees and Citizenship Canada files; vital statistics files; and cell phone files—that contain names and addresses and/or telephone numbers. These tracing leads were loaded into the CATI tracing application prior to collection, and additional leads were sent to the regional offices as they were found in processing during the collection period.
Tracing was done for both the SP and the household members, and was extended outside Canada (calls and emails could be made internationally). Interviewers used a variety of tracing tools—the most popular being Internet searches on Canada411.ca™ and Google, and publicly available information on social media sites.
At the start of data collection, only 3.4% of the cases had insufficient contact information and needed to be traced. Because of the quality and quantity of tracing sources provided by head office, 70% of the completed cases used phone numbers that were provided by head office. The other 30% used new phone numbers that were found by the regional offices’ tracing efforts.
7.3.4 Collection statistics
Many statistics were monitored throughout the data collection period, and the statistics were analyzed after collection was completed.
Of the 12,787 completed cases, 94.8% were completed using the CATI system—91.3% where the regional office called the respondent, and 3.5% where the respondent called the regional office. The remaining 5.2% were completed by paper questionnaire—2.5% where the respondent requested a paper questionnaire, 2.2% where head office had mailed out the questionnaire and 0.5% where a field interviewer completed the questionnaire.
Table 7.3.4.1 shows provincial and territorial completion rates by sample type (regular or non-response adjustment subsample). The table shows that completion rates were higher for the subsample cases. This was expected because these respondents already demonstrated a propensity to answer by completing their census forms.

50 Statistics Canada – Catalogue no. 98-303-X2016001
Coverage Technical Report
Table 7.3.4.1 Completion counts and rates by type of sample for Canada, provinces and territories
Provinces and territories
Regular sample Non-response adjustment sampleCases
sentCases
completedCompletion
rate (%)Cases
sentCases
completedCompletion
rate (%)
Canada 9,305 6,921 74.4 6,279 5,866 93.4Newfoundland and Labrador 433 322 74.4 428 383 89.5Prince Edward Island 454 316 69.6 377 339 89.9Nova Scotia 584 419 71.7 541 508 93.9New Brunswick 388 315 81.2 441 417 94.6Quebec 608 475 78.1 594 579 97.5Ontario 1,415 1,052 74.3 800 760 95.0Manitoba 609 468 76.8 555 528 95.1Saskatchewan 758 590 77.8 547 525 96.0Alberta 996 721 72.4 606 541 89.3British Columbia 1,541 1,144 74.2 735 699 95.1Yukon 444 325 73.2 208 191 91.8Northwest Territories 450 349 77.6 211 195 92.4Nunavut 527 387 73.4 218 187 85.8NPR-CA1 98 38 38.8 18 14 77.8
Provinces and territories
TotalCases
sentCases
completedCompletion
rate (%)
Canada 15,584 12,787 82.1Newfoundland and Labrador 861 705 81.9Prince Edward Island 831 655 78.8Nova Scotia 1,125 927 82.4New Brunswick 829 732 88.3Quebec 1,202 1,054 87.7Ontario 2,215 1,812 81.8Manitoba 1,164 996 85.6Saskatchewan 1,305 1,115 85.4Alberta 1,602 1,262 78.8British Columbia 2,276 1,843 81.0Yukon 652 516 79.1Northwest Territories 661 544 82.3Nunavut 745 574 77.0NPR-CA1 116 52 44.81. Non-permanent residents - Canada (open permit).Source: Statistics Canada, 2016 Reverse Record Check.

Statistics Canada – Catalogue no. 98-303-X2016001 51
Coverage Technical Report
Table 7.3.4.2 shows completion rates by frame and sample type. The low rate for the non-permanent resident (NPR) frame was largely caused by permits expiring before collection—41% had permits that expired before the start of collection, and another 15% expired during collection. Also, because of the transitory nature of non-permanent residents in general, it is often difficult to locate these SPs or a suitable proxy. However, the completion rate for the NPR frame improved from 55.2% in 2011 to 68.5% in 2016.
Table 7.3.4.2 Completion counts and rates by sampling frames and type of sample for Canada
Sampling frames
Regular sample Non-response adjustment sampleCases
sentCases
completedCompletion
rate (%)Cases
sentCases
completedCompletion
rate (%)
Total 9,305 6,921 74.4 6,279 5,866 93.42011 Census 4,558 3,492 76.6 4,430 4,185 94.5Missed 1,104 877 79.4 415 378 91.1Births 395 304 77.0 194 184 94.8Immigrants 578 431 74.6 137 128 93.4Non-permanent residents 1,249 756 60.5 466 418 89.7Yukon 444 325 73.2 208 191 91.8Northwest Territories 450 349 77.6 211 195 92.4Nunavut 527 387 73.4 218 187 85.8
Sampling frames
TotalCases
sentCases
completedCompletion
rate (%)
Total 15,584 12,787 82.12011 Census 8,988 7,677 85.4Missed 1,519 1,255 82.6Births 589 488 82.9Immigrants 715 559 78.2Non-permanent residents 1,715 1,174 68.5Yukon 652 516 79.1Northwest Territories 661 544 82.3Nunavut 745 574 77.0Source: Statistics Canada, 2016 Reverse Record Check.
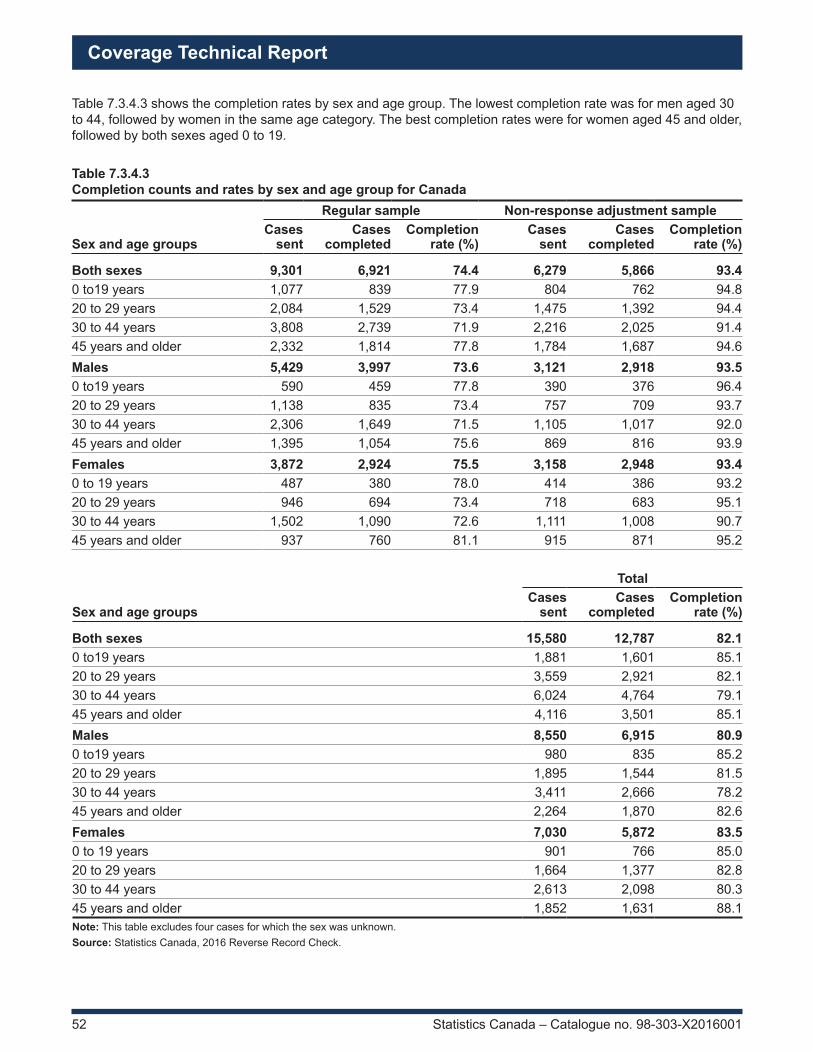
52 Statistics Canada – Catalogue no. 98-303-X2016001
Coverage Technical Report
Table 7.3.4.3 shows the completion rates by sex and age group. The lowest completion rate was for men aged 30 to 44, followed by women in the same age category. The best completion rates were for women aged 45 and older, followed by both sexes aged 0 to 19.
Table 7.3.4.3 Completion counts and rates by sex and age group for Canada
Sex and age groups
Regular sample Non-response adjustment sampleCases
sentCases
completedCompletion
rate (%)Cases
sentCases
completedCompletion
rate (%)
Both sexes 9,301 6,921 74.4 6,279 5,866 93.40 to19 years 1,077 839 77.9 804 762 94.820 to 29 years 2,084 1,529 73.4 1,475 1,392 94.430 to 44 years 3,808 2,739 71.9 2,216 2,025 91.445 years and older 2,332 1,814 77.8 1,784 1,687 94.6Males 5,429 3,997 73.6 3,121 2,918 93.50 to19 years 590 459 77.8 390 376 96.420 to 29 years 1,138 835 73.4 757 709 93.730 to 44 years 2,306 1,649 71.5 1,105 1,017 92.045 years and older 1,395 1,054 75.6 869 816 93.9Females 3,872 2,924 75.5 3,158 2,948 93.40 to 19 years 487 380 78.0 414 386 93.220 to 29 years 946 694 73.4 718 683 95.130 to 44 years 1,502 1,090 72.6 1,111 1,008 90.745 years and older 937 760 81.1 915 871 95.2
Sex and age groups
TotalCases
sentCases
completedCompletion
rate (%)
Both sexes 15,580 12,787 82.10 to19 years 1,881 1,601 85.120 to 29 years 3,559 2,921 82.130 to 44 years 6,024 4,764 79.145 years and older 4,116 3,501 85.1Males 8,550 6,915 80.90 to19 years 980 835 85.220 to 29 years 1,895 1,544 81.530 to 44 years 3,411 2,666 78.245 years and older 2,264 1,870 82.6Females 7,030 5,872 83.50 to 19 years 901 766 85.020 to 29 years 1,664 1,377 82.830 to 44 years 2,613 2,098 80.345 years and older 1,852 1,631 88.1Note: This table excludes four cases for which the sex was unknown.Source: Statistics Canada, 2016 Reverse Record Check.

Statistics Canada – Catalogue no. 98-303-X2016001 53
Coverage Technical Report
7.4 Estimation
RRC estimation was divided into two parts. First, the SPs were weighted, and then the census undercoverage was calculated. Weighting involves determining the initial sampling weights of SPs, and all adjustments made to these initial weights, to create the SPs’ final weights. Weighting involves several steps that are described in Sections 7.4.1 to 7.4.5. The methodology for calculating census undercoverage is described in Section 7.4.7.
7.4.1 Calculating the initial weights
The initial weight of an SP from the 2011 missed frame was the final weight assigned to that person in the 2011 RRC when they were classified as “missed.” For SPs from the other sampling frames, initial weights were based on the inverse of the probability of being selected in the sample.
7.4.2 Non-response adjustment
To reduce statistical bias, the initial weights of respondents had to be adjusted to account for non-response. The weight of persons who could not be classified (non-respondents) was redistributed among persons who were classified (respondents). There are three types of non-response. First, there are the unidentified persons (only 10 SPs). The initial weights of unidentified persons were transferred to identified persons in each sampling stratum.
The second type of non-response involves untraced persons (2,237 SPs). The adjustment involved forming response homogeneity groups (RHGs) among unlisted persons (listed persons being the persons classified without the help of RRC collection) and transferring the weight of untraced persons to unlisted traced persons within the RHGs. The methodology for forming RHGs for the 2016 RRC was modified from the one used in previous RRCs. For the 2001, 2006 and 2011 RRCs, the RHGs were formed based on the concept of mobility (mobile and not mobile), and the adjustment factors depended on the response propensity of a subsample of listed not mobile persons. For the 2016 RRC, the concept of mobility and the subsample were not used for the adjustment for untraced persons.
The first step in creating RHGs was to group unlisted persons into main groups based on their estimated propensity to be in the target population. The groups were formed based on an analysis of the correlation between several tax indicators, particularly those for 2015 and 2016, and the final classification for unlisted traced persons. Up to six main groups were created based on the sampling frame. These main groups were also strongly correlated with response propensity. The second step in creating RHGs was to group unlisted persons based on their response propensity in each domain, with a domain being defined by crossing a sampling frame with a main group. In each domain, response propensity was analyzed using a national logistic regression model (and regional, when the data allowed it) and an analysis of multi-level, cross-frequency tables. For the models, several auxiliary variables available for both traced and untraced persons were used: variables available in the sampling frames (e.g., age, sex, relationship to other household members, country of origin, and type of non-permanent resident), variables available in the tax data for related persons (e.g., whether they were in certain files, frequency of address changes since 2011, and type of address), variables related to contact information (e.g., number and sources of telephone numbers, address availability, and link of last known address with the 2016 Census), and a few other variables. Thus, the auxiliary variables that were significantly correlated with response propensity were determined and used to form the RHGs. In most domains, the RHGs were formed within the province or territory of selection. Therefore, the adjustment consisted of transferring the weight of untraced persons to unlisted traced persons within each RHG.
The third non-response adjustment was the adjustment for unclassified persons. An unclassified person is a person who had their primary residence in a given province or territory on Census Day (thus in the census target population), but for whom it was not certain whether they were missed or enumerated. Using the same principle as with untraced persons, homogeneous groups of classified persons were formed within each sampling frame and province of classification. The adjustment consisted of transferring the weight of unclassified persons to unlisted classified persons within each homogeneous group.

54 Statistics Canada – Catalogue no. 98-303-X2016001
Coverage Technical Report
7.4.3 Weight calibration of the 2011 Census frame
For the 2011 Census frame, enumerated persons and deceased persons were calibrated to adjust for cases in which a provincial sample contained too many or not enough enumerated or deceased persons. This calibration was new for the 2016 RRC. Several linkages of the 2011 Census frame were performed to define calibration groups and control totals. First, an automated deterministic linkage applied to the vital statistics death files helped to determine the control totals per province for the deceased persons calibration group. Next, an automated deterministic linkage applied to the 2016 CCS-RDB helped to determine the control totals per province for the enumerated persons calibration group. Then, the information from tax data was updated for the persons linked to these data following the automated deterministic linkage performed prior to the stratification of this frame. This made it possible to form three other calibration groups according to the status of the persons in the tax data, and to obtain control totals for these groups. Similarly, the most recent province of residence indicated in the tax data was used to define the province of calibration. In all, 50 calibration groups were formed (five in each province), and 50 control totals were calculated. The calibration was carried out using a raking mechanism for the margins, using the 50 control totals described above as the first margin, and 36 calibration groups by age and sex as the second margin. To this end, Statistics Canada’s Generalized Estimation System (G-Est) was used.
7.4.4 Post-stratification adjustment for the territories
After the initial weight adjustment, the estimated number of enumerated persons in the territories was observed to be traditionally lower than the comparable census count. This was due to undercoverage of the census target population in health insurance files. To address this undercoverage, the weights of the SPs selected in each territory were adjusted so that the estimated number of enumerated persons equalled the comparable census count for that territory. The adjustments were made for six calibration groups (by age and sex) in each territory. In previous RRCs, there was only one calibration group per territory.
7.4.5 Adjustment for overcoverage in the 2011 Census frame
The weights of SPs from the 2011 Census frame who were enumerated more than once in 2011 were adjusted downward to account for the fact that these SPs had more than one chance of being selected.
7.4.6 Weighted distribution by classification
Table 7.4.6 shows the weighted distribution of SPs by classification and sampling frame. For definitions, see Section 7.2. Only SPs found in the CCS-RDB were classified as “enumerated.” Persons who were in the target population but not in the CCS-RDB were classified as “missed.” The remaining SPs were classified as “out of scope” (e.g., deceased or emigrated).

Statistics Canada – Catalogue no. 98-303-X2016001 55
Coverage Technical Report
7
Table 7.4.6 Weighted classification of selected persons, sample frames for Canada
Classification
Provincial strata2011
Census 2011 Missed Births ImmigrantsNon-permanent
residentsnumber % number % number % number % number %
Total 31,290,865 100.0 2,807,753 100.0 1,895,007 100.0 1,094,930 100.0 668,685 100.0
Enumerated 27,950,130 89.3 1,885,586 67.2 1,731,465 91.4 837,599 76.5 330,735 49.5Listed 27,776,637 88.8 1,872,192 66.7 1,729,645 91.3 832,592 76.0 316,387 47.3Not listed 173,493 0.6 13,394 0.5 1,820 0.1 5,007 0.5 14,349 2.1
Missed 1,721,477 5.5 554,838 19.8 125,932 6.6 159,895 14.6 271,952 40.7Listed 212,428 0.7 46,563 1.7 20,207 1.1 9,920 0.9 9,856 1.5Not listed 1,509,049 4.8 508,275 18.1 105,725 5.6 149,975 13.7 262,096 39.2
Out of scope 1,619,258 5.2 367,329 13.1 37,610 2.0 97,436 8.9 65,998 9.9Listed 1,252,754 4.0 224,800 8.0 8,963 0.5 34,087 3.1 4,389 0.7Not listed 366,504 1.2 142,529 5.1 28,647 1.5 63,349 5.8 61,609 9.2
Classification
Territorial strataTotalTerritorial frames
number % number %
Total 128,008 100.0 37,885,248 100.0
Enumerated 98,275 76.8 32,833,790 86.7Listed 97,772 76.4 32,625,224 86.1Not listed 503 0.4 208,566 0.6
Missed 21,565 16.8 2,855,660 7.5Listed 4,785 3.7 303,759 0.8Not listed 16,780 13.1 2,551,901 6.7
Out of scope 8,168 6.4 2,195,798 5.8Listed 6,126 4.8 1,531,119 4.0Not listed 2,042 1.6 664,679 1.8Source: Statistics Canada, 2016 Reverse Record Check.
.4.7 Calculating the census undercoverage
Note the following definitions:
C = published census count of the number of persons in the target population
Û = estimate of undercoverage
= estimate of the number of persons not included in C who should have been
M = estimate of the number of persons in the RRC target population who were not enumerated
= sum of the final weight of persons classified as “missed”

56 Statistics Canada – Catalogue no. 98-303-X2016001
Coverage Technical Report
X = number of persons included in C who could not be identified with certainty as “enumerated” in the RRC.
Census population undercoverage was estimated by the number (weighted) of missed persons less the number of persons excluded from the CCS-RDB:
Û = M – X
X has three components: imputations (from DCS WHIs), incomplete enumerations and late enumerations.
The SP’s address on Census Day refers to a dwelling for which an enumeration was imputed. This was the case in particular for non-response dwellings for which another household’s data were used in WHI.
Some enumerations in the census database were deemed too incomplete to be used by the RRC to determine whether an SP was enumerated. Incomplete enumerations in this context usually involve missing or invalid date of birth or name data (e.g., “?,” “Mr.,” “Unknown” or “Person 1”). An SP enumerated in this manner was classified as “missed.” This was referred to as an “RRC incomplete enumeration.”
The 2016 Census gave rise to two new types of incomplete enumerations. First, there was the imputation of data for persons living in certain types of collective dwellings (e.g., motels, hotels and campgrounds), because the census only collected the number of usual residents (no names or birth dates) for these collective dwellings. Then, because of the forest fires in Alberta during the census, the information was derived from administrative data for persons in certain dwellings in the census subdivision of Wood Buffalo. To properly assess coverage errors, these records had to be considered as incomplete enumerations.
In 2016, late enumerations were limited to persons enumerated in a single dwelling (collective in Quebec) because these persons did not appear in the census RDB from which data were extracted to create the Census Coverage Studies (CCS) database.
At the national level, X made up slightly less than half of M . The value of X decreased from 2011 because fewer people were imputed as part of WHI and because late enumerations were almost completely eliminated. The number of incomplete enumerations was similar to 2011, despite two new types being added.
Table 7.4.7 shows the national numbers for the various components of the population undercoverage estimate, namely the numbers for the three components of the X term.
Table 7.4.7 Components of the population undercoverage estimate for Canada
Components1 Number of
persons
Estimate of M 2,855,660 Total X 1,298,599 X for imputed persons 737,936 X for late enumerations 521 X for RRC incomplete enumerations 560,142 Estimate of U 1,557,061 1. M: Number of persons in the RRC target population who were not enumerated; X: Number of persons included in the published census count but who could not be identified with certainty as enumerated in the RRC; RRC: Reverse Record Check; U: Undercoverage.Source: Statistics Canada, 2016 Census Coverage Studies.

Statistics Canada – Catalogue no. 98-303-X2016001 57
Coverage Technical Report
Lastly, the variance of the undercoverage estimates was calculated as follows:
v(Û) = v( M – X ) = v( M )
)ˆ(Mv = estimated variance of M based on the RRC design.
The variance was calculated using the classic bootstrap resampling method. To that end, weights of 500 bootstrap replicates were produced.

58 Statistics Canada – Catalogue no. 98-303-X2016001
Coverage Technical Report
8. Census Overcoverage Study (COS)
8.1 Overview and methodology
Prior to 2006, the level of overcoverage caused by duplication of individuals on the census was measured by three studies, each one covering part of the overcoverage: the Automated Match Study (AMS), the Collective Dwelling Study (CDS) and the Reverse Record Check (RRC). Since 2006, given and family names have been included in the Census Response Database,7 and overcoverage is now measured with a single study: the Census Overcoverage Study (COS). Hence, the RRC is no longer used to measure overcoverage, and the CDS was discontinued. The AMS is still conducted for evaluation purposes.
As was the case with both the 2006 and 2011 overcoverage studies, the 2016 COS was based on a series of probabilistic record linkage operations and manual verification of pairs of potential overcoverage cases. These record linkage operations also involved the use of certain administrative data files.
For ease of reference, in the rest of this section, a pair of potential overcoverage cases is referred to as a pair, and a pair that has been confirmed to be the same person is referred to as a duplicate.
The 2016 COS was a statistical study in which overcoverage was estimated with a probabilistic sample selected from a frame of potential overcoverage cases. The COS involves all the steps one would find in a statistical survey:
• sampling frame construction• sample selection• data collection• processing and verification of collected data • weighting and estimation• analysis.
However, the COS differs from a statistical survey in the following ways:
• The sampling frame was constructed by means of successive probabilistic and deterministic record linkage operations.
• Collection was based on manual verification of sampled pairs of records and did not involve respondents.
The COS methodology for estimating 2016 overcoverage was based on matching persons without geographic restrictions, while the AMS8 was based on matching private households located in the same geographic area. The 2016 COS took advantage of the fact that the 2016 Census Response Database (RDB) contains respondents’ surnames and given names in two separate variables. This made it possible to produce a more precise estimate of the overcoverage caused by persons enumerated more than once on the census database. The COS used automated matching and manual verification methods. It included individuals living in collective dwellings and did not impose geographic restrictions such as those imposed on the AMS.
The census database used for the COS was the same as the database used for the RRC: the CCS-RDB. For simplicity, it is hereby referred to as the RDB.
7. In 2006, the full name (surname and given name) was recorded in a single variable; in 2011 and 2016, the surname and given name were recorded in two separate variables.
8. For a detailed description of the AMS methodology, see 2001 Census Technical Report on Coverage, Catalogue no. 92-394-XIE.

Statistics Canada – Catalogue no. 98-303-X2016001 59
Coverage Technical Report
As in 2006 and 2011, the 2016 COS sampling frame was constructed in multiple steps. The first step was an internal probabilistic record linkage in which the entire RDB was linked to itself. The second step was an external probabilistic record linkage in which the entire RDB was linked to an administrative frame (ADMIN) built from the Canadian Statistical Demographic Database (CSDD). The CSDD is an administrative database created from multiple administrative data sources for use in the Census Program.
The two probabilistic linkages were conducted with G-Link 3.2, the probabilistic record linkage system designed at Statistics Canada that uses the Fellegi-Sunter method to solve large file linkage problems when there are no direct identifiers common to both sources (Fellegi and Sunter 1969).
8.2 Construction of the sampling frame
The COS began with the construction of a sampling frame of potential overcoverage cases using probabilistic and deterministic record linkage. This work consisted of the following four steps:
1. probabilistic record linkage between the RDB and itself2. probabilistic record linkage between the RDB and the ADMIN3. extension of the sampling frame based on households4. supplement frame: additional potential overcoverage identified during evaluation of CSDD prototype.
8.2.1 Input files for the construction of the COS sampling frame
The RDB contained a little under 34 million records and included responses from individuals living in both private and collective dwellings. It contained names (including given names and surnames), demography (including date of birth and sex) and geography (including province or territory and postal code). The ADMIN was extracted from the CSDD and contained over 48 million records. As in 2011, the ADMIN included names (given name and surname), demographic information (including date of birth and sex) and geographic information (including province or territory and postal code).
The CSDD from which the ADMIN is drawn was built using multiple administrative data files. These included tax files provided by the Canada Revenue Agency; immigrant and non-permanent resident files provided by Immigration, Refugees and Citizenship Canada; birth records from vital statistics files provided by Vital Statistics; the National Routing System; and the Indian Registry, provided by Indigenous and Northern Affairs Canada.
The records of persons classified as living in one of the three territories according to the CSDD were replaced by the information from territorial health care files used as a sampling frame for the RRC, as these were believed to provide better coverage of individuals living in the territories.
The following matching variables were used in both the RDB-to-RDB linkage and the RDB-to-ADMIN linkage:
• names: given name and surname variables• demographic data: date-of-birth and sex variables• geographic data: province or territory and postal code variables.
8.2.2 Steps in constructing the COS frame
The COS frame included all pairs forming potential overcoverage cases that were outputted by G-Link following steps 1 and 2, and those identified by the extension. It also included record pairs identified by the supplement. Construction of the COS frame is illustrated in Figure 8.2.2 below:

60 Statistics Canada – Catalogue no. 98-303-X2016001
Coverage Technical Report
8.2.3 Step 1: Probabilistic RDB-RDB linkage
The purpose of Step 1 was to measure overcoverage in persons on the RDB. To optimize the record linkage, provincial and territorial name frequency classes were created to compare the given names and surnames. The name frequency classes were used as outcome levels in the concordance rules for names in G-Link 3.2.
This linkage process was based on the following series of operations:
• Create RDB-RDB potential pairs by applying selection criteria.• Compute name frequencies (for family names and given names) within each province and territory.• Create name frequency classes.• Compare the records for the potential pairs by applying concordance rules.• Calculate the weights of the results of the rule application using the EM algorithm.• Calculate provincial and territorial thresholds.• Select pairs whose weight was greater than the thresholds.
From Step 1, a linked set of 4,254,360 potential pairs was created.
8.2.4 Step 2: Probabilistic RDB-ADMIN linkage
The purpose of Step 2 was to identify additional potential overcoverage not captured by the Step 1 linkage. RDB record pairs were created from groups of multiple RDB records linked to the same ADMIN record. This matching process identified pairs where the errors in the names or date of birth were such that the RDB-RDB linkage was not able to match them when they were compared directly. It also picked out pseudo-duplicates, which were

Statistics Canada – Catalogue no. 98-303-X2016001 61
Coverage Technical Report
RDB and ADMIN records that shared many match variables with a high linkage weight, but actually represented different individuals. For this reason, a clean-up of the RDB-RDB pairs derived from the RDB-ADMIN pairs was performed.
Step 2 involved the following sequence of operations:
• Create RDB-ADMIN potential pairs by applying selection criteria.• Compute name frequencies within each province and territory.• Create name frequency classes.• Compare the records for the potential pairs by applying concordance rules.• Calculate the weights of the results of the rule application using the EM algorithm.• Calculate the provincial and territorial thresholds.• Select pairs whose weight was greater than the threshold.• Create RDB-RDB pairs from the set of RDB-ADMIN pairs above the thresholds.• Remove pairs already identified with the Step 1 linkage.• Verify and clean up the RDB-RDB pairs derived from RDB-ADMIN pairs to reduce the pseudo-duplicates.
The RDB-ADMIN linkage identified 930,120 additional pairs that were added to the set of potential pairs.
8.2.5 Step 3: Extension of the sampling frame based on households
The purpose of extending the sampling frame was to find additional overcoverage in households that contained potential overcoverage cases from Step 1 or Step 2. This phase resulted in the creation of additional RDB-RDB record pairs, which were produced in two steps.
First, a household pair was produced for each RDB-RDB person pair created in Step 1 or Step 2 by adding the other household members to it. Second, using sex and date of birth as variables, new RDB-RDB pairs were identified by comparing the persons present in the household pair. Comparison rules were applied to identify pairs that might represent overcoverage cases. The frame extension included pairs from two private households, or pairs where an individual from a private household was linked to an individual from a collective. Pairs where both records were from collectives were excluded.
As was done with the RDB-ADMIN pairs, pairs already identified in the first two steps were removed. When the duplicates were removed, the extension frame captured a further 167,980 pairs, which were added to the set of potential pairs.
8.2.6 Creation of the sampling units
Potential overcoverage cases were identified using groups of interconnected RDB records. The RDB-RDB person pairs returned by steps 1 and 2, and the extension, were pooled. Mutually exclusive record groups were created from the set of unduplicated person pairs, meaning that a record group contained all the RDB records connected by potential overcoverage, as identified in steps 1 to 3. For cases where the record groups contained more than 10 RDB records, a graph theory method was applied to reduce the group into small subgroups called “neighbourhoods” to facilitate manual verification.
8.2.7 Step 4: Supplement frame
During the evaluation of the 2016 CSDD prototype, the CSDD team identified potential duplicates in the RDB. Their list of potential duplicates was compared with the COS sampling frame constructed from steps 1 to 3. Most of the potential pairs identified by the CSDD team had been captured in the first three steps described above.

62 Statistics Canada – Catalogue no. 98-303-X2016001
Coverage Technical Report
However, some of these pairs were found to be missing from the set of potential pairs created with the first three steps. An investigation of the missing pairs found a few additional pairs not identified by the CSDD team that should have been included in the set of potential pairs. A total of 97,000 pairs were identified in this manner and were added to the COS sampling frame.
The final COS sampling frame contained a little over 3.6 million sampling units, created from approximately 5.4 million RDB-RDB pairs.
8.3 Census Overcoverage Study sample design
To meet sampling requirements, the sampling frame units were separated into four strata:
• Stratum 1: This consists of the intraprovincial units from steps 1 to 3. These are the sampling units created during steps 1 to 3 where all the RDB records that formed the pairs in the unit were in the same province or territory.
• Stratum 2: This consists of the interprovincial pairs from steps 1 to 3. These are the sampling units created during steps 1 to 3 and formed from a single pair of records from two different provinces or territories.
• Stratum 3: This consists of the interprovincial groups and neighbourhoods from steps 1 to 3. These are the sampling units created during steps 1 to 3 and formed from at least two pairs of records, covering at least two different provinces or territories. It should be noted that such a unit could contain intraprovincial pairs. For example, a group could be composed of three pairs linking RDB records in Ontario, and another pair linking an Ontario record with an Alberta record.
• Stratum 4: This consists of the pairs from Step 4. These are pairs of potential duplicates determined by the supplement. This stratum included both intraprovincial and interprovincial pairs.
8.3.1 Sample allocation
The 2016 COS manual verification budget was based on a total sample size similar to the one used in 2011—i.e., a total sample of 54,000 pairs to verify for strata 1 to 3. It was decided that, on average, 70% of a province’s sample would be intraprovincial pairs, and the rest would be interprovincial pairs. This represented a reduction in the proportion of intraprovincial pairs in the sample (which was approximately 80% in 2011), given that the 2016 frame contained more interprovincial pairs.
The sample of pairs was divided between the provinces and territories using a power allocation method, with the total number of pairs in the frame for each province and territory as its size, and x = 0.2 as its power. This made it possible to obtain precise estimates for each province, and nationally, while allowing for a sample distribution that was not too different from that of 2011. The next step involved distributing the provincial and territorial sample between the intraprovincial and interprovincial pairs. As mentioned, the ideal overall proportion was for 70% of each provincial sample to be intraprovincial pairs. A smaller proportion was used for Prince Edward Island and the three territories since the 2011 results showed that the contribution of interprovincial overcoverage was larger there. Inversely, a higher proportion was used for Quebec, Ontario and British Columbia. The same proportion was then used in the other provinces and was set to obtain the national proportion of 70%.
Once the sample size of intraprovincial and interprovincial pairs was determined for each province and territory, the next step was to divide these samples between the three strata. The sample of interprovincial pairs was separated between strata 2 and 3 based on the proportion of interprovincial pairs from the frame in each of the two strata. It was not possible to allocate the sample of intraprovincial pairs between strata 1 and 3 in the same manner. In fact, in stratum 3, the groups and neighbourhoods were composed mainly of interprovincial pairs, so selecting the desired number of intraprovincial pairs would have resulted in too many interprovincial pairs being selected. To avoid this problem, simulations showed that 85% of the sample of intraprovincial pairs had to be selected from stratum 1 to make the sample from stratum 3 usable. For Prince Edward Island and the three territories, it was practically a take-all. All the pairs from the stratum 1 frame were therefore selected there.

Statistics Canada – Catalogue no. 98-303-X2016001 63
Coverage Technical Report
For stratum 4, the sample size was set at 3,000 pairs, based on the desired level of precision, available resources and the schedules to be met when the pairs from the supplement frame were determined.
8.3.2 Sample from stratum 1
Stratum 1 was separated into three substrata within each province: pairs, groups and neighbourhoods. An optimal sample allocation based on manual verification costs was used to allocate the provincial sample of this stratum to substrata. A systematic sample of pairs sorted by linkage weight class, age group, sex, marital status, mother tongue and CMA was then selected. For groups and neighbourhoods, a simple random sample was selected. Table 8.3.2 provides the distribution of sampling units from stratum 1 in the sampling frame and in the sample for each province and territory.
8.
Table 8.3.2 Number of stratum 1 sampling units on the frame and in the sample, Canada, provinces and territories
Provinces and territories
Frame totals Sample totals
Pairs GroupsNeighbour-
hoods Total Pairs GroupsNeighbour-
hoods Total
Canada 1,165,224 192,530 172,610 1,530,364 30,481 1,702 1,420 33,603Newfoundland and Labrador 9,133 296 159 9,588 2,386 96 74 2,556Prince Edward Island 1,763 42 20 1,825 1,763 42 20 1,825Nova Scotia 14,328 626 368 15,322 2,644 137 82 2,863New Brunswick 13,844 591 309 14,744 2,604 129 60 2,793Quebec 413,625 102,703 76,085 592,413 3,284 416 308 4,008Ontario 479,444 71,845 82,517 633,806 3,947 295 392 4,634Manitoba 18,440 835 512 19,787 2,724 107 76 2,907Saskatchewan 17,175 833 415 18,423 2,532 118 53 2,703Alberta 75,638 4,261 3,448 83,347 3,445 126 118 3,689British Columbia 120,458 10,460 8,775 139,693 3,776 198 235 4,209Yukon 570 16 2 588 570 16 2 588Northwest Territories 345 8 0 353 345 8 0 353Nunavut 461 14 0 475 461 14 0 475Source: Statistics Canada, 2016 Census Overcoverage Study.
3.3 Sample from stratum 2
Sampling units from stratum 2 were all interprovincial pairs. Stratum 2 was therefore subdivided based on the province of the pair’s two CCS-RDB records. The pairs for a combination of province 1 and province 2 were then sorted according to the same variables used in stratum 1, and a systematic sample was selected. Table 8.3.3 provides the distribution of the sampling units from stratum 2 in the sampling frame and the sample for each province and territory. It must be noted that because each pair belongs to two different provinces, the sum of the number of pairs in each province and territory corresponds to twice the number of pairs at the national level, since the pairs are counted in two places.

64 Statistics Canada – Catalogue no. 98-303-X2016001
Coverage Technical Report
8.
Table 8.3.3 Number of stratum 2 sampling units on the frame and in the sample, Canada, provinces and territoriesProvinces and territories Pairs on the frame Pairs in the sample
Canada 1,029,616 3,658Newfoundland and Labrador 52,174 640Prince Edward Island 15,546 561Nova Scotia 93,331 695New Brunswick 77,998 650Quebec 316,352 490Ontario 670,953 580Manitoba 99,259 665Saskatchewan 83,571 655Alberta 293,933 495British Columbia 348,355 500Yukon 3,070 466Northwest Territories 3,147 513Nunavut 1,543 406Source: Statistics Canada, 2016 Census Overcoverage Study.
3.4 Sample from stratum 3
Stratum 3 was composed of interprovincial groups and neighbourhoods. As previously mentioned, a large number of these sampling units contained intraprovincial pairs. The challenge was therefore to select enough intraprovincial pairs, especially for the small provinces and the territories, without selecting too many interprovincial pairs or pairs of units in the large provinces. To do this, units from stratum 3 were divided in the following manner, using dominance rules based on the proportion of intraprovincial pairs belonging to the same province within interprovincial groups and neighbourhoods:
• units where at least 60% of the pairs were intraprovincial for a given province• units where between 50% and 60% of the pairs were intraprovincial for a given province• units where less than 50% of the pairs belonged to the same province.
A simulation was conducted to determine the sample size required in each substratum to obtain the targeted sample sizes for the number of intraprovincial and interprovincial pairs in each province. A simple random sample of groups and neighbourhoods was selected in each substratum. For each substratum, Table 8.3.4 presents the dominance rule applied (most frequent proportion and province), the number of sampling units (groups and neighbourhoods) in the substratum, the number of pairs making up these units, and the number of units sampled.
Substrata 1 to 11 were composed of sampling units where at least 60% of intraprovincial pairs were found in the same province or territory (there were none in Yukon or Nunavut). Substrata 13 to 16 were formed from units composed of interprovincial pairs only, and where the most frequent province or territory among all the CCS-RDB records in the unit were respectively Prince Edward Island (9911), Yukon (9960), the Northwest Territories (9961) or Nunavut (9962). Substratum 12 contained all the other units composed of interprovincial pairs only. Substrata 17 to 29 were composed of units where at least 50%, but less than 60%, of intraprovincial pairs came from a given province. Finally, substrata 30 to 42 included all the other sampling units, classified according to the most frequent province among all the intraprovincial pairs. For example, substratum 23 was composed of all units where at least 50%, but less than 60%, of intraprovincial pairs came from Manitoba.

Statistics Canada – Catalogue no. 98-303-X2016001 65
Coverage Technical Report
Table 8.3.4 Number of sampling units and pairs on the frame and number of sampled units for each substratum in stratum 3
Substratum Province or territoryNumber of sampling
units on the frameNumber of pairs in the sampling units
Number of sampled units
Total Canada 997,209 3,113,046 3,76660% or more1 10 98 374 982 11 16 56 163 12 261 982 1684 13 234 1,008 1395 24 35,259 157,968 2376 35 56,977 250,169 2367 46 208 837 1488 47 168 762 1179 48 2,108 8,465 18510 59 8,986 37,667 21411 61 1 3 112 9900 424,804 971,198 27513 9911 10,664 28,813 8114 9960 1,974 5,310 8115 9961 1,988 5,329 8116 9962 681 1,911 81At least 50% but less than 60%17 10 1,057 2,314 15218 11 174 381 10219 12 2,175 4,773 6020 13 1,614 3,667 6021 24 44,438 114,348 7822 35 112,607 301,663 9723 46 1,731 3,790 9524 47 1,262 2,784 9525 48 12,287 28,069 12926 59 27,016 69,808 11927 60 22 44 2228 61 8 16 829 62 5 10 5Less than 50%30 10 2,335 9,959 6431 11 378 1,544 7532 12 4,461 18,969 4433 13 3,783 15,606 4434 24 38,148 162,831 3035 35 96,087 422,284 3036 46 3,903 17,103 4437 47 3,089 13,033 4438 48 22,495 101,325 3039 59 73,556 347,254 30

66 Statistics Canada – Catalogue no. 98-303-X2016001
Coverage Technical Report
Table 8.3.4 Number of sampling units and pairs on the frame and number of sampled units for each substratum in stratum 3
Substratum Province or territoryNumber of sampling
units on the frameNumber of pairs in the sampling units
Number of sampled units
40 60 80 322 8041 61 55 230 5542 62 16 67 16Source: Statistics Canada, 2016 Census Overcoverage Study.
8.3.5 Sample from stratum 4
Stratum 4 contained all the record pairs determined using the supplement. Since stratum 4 was added after the groups and neighbourhoods formed by the interconnected pairs from steps 1 to 3 were created, all the sampling units from stratum 4 were treated as pairs. This stratum was substratified by province. A power allocation was used to allocate the sample of 3,000 pairs between the provinces and territories. Also, an optimal allocation, based on the expected overcoverage rates, made it possible to allocate one province’s sample between the intraprovincial and interprovincial pairs. A systematic sample of pairs from the RDB was then chosen in each substratum. For each province and territory, Table 8.3.5 presents the total number of intraprovincial and interprovincial pairs in the frame, and the number of pairs sampled. As mentioned, it is important to note that, for interprovincial pairs, the national-level total corresponds to half the sum of the numbers from each province and territory since each interprovincial pair is counted in total in two provinces.
Table 8.3.5 Number of intraprovincial and interprovincial sampling units (pairs) on the frame and in the sample, Canada, provinces and territories
Provinces and territoriesPairs on the frame Pairs in the sample
Intraprovincial Interprovincial Intraprovincial Interprovincial
Canada 74,987 22,099 2,520 548Newfoundland and Labrador 967 935 144 70Prince Edward Island 221 314 87 61Nova Scotia 1,608 1,836 163 93New Brunswick 1,314 1,377 156 81Quebec 15,803 5,922 367 95Ontario 31,264 13,927 444 128Manitoba 2,109 2,427 177 101Saskatchewan 1,886 2,192 170 99Alberta 7,831 6,982 272 122British Columbia 11,763 7,979 319 116Yukon 78 81 78 34Northwest Territories 56 113 56 53Nunavut 87 113 87 43Source: Statistics Canada, 2016 Census Overcoverage Study.

Statistics Canada – Catalogue no. 98-303-X2016001 67
Coverage Technical Report
8.4 Collection
The collection process involved manually verifying the samples of selected pair groups. Manual verification was done pair by pair. When a group or neighbourhood was sampled, all the pairs it contained were examined manually. The pairs were examined only once, even if they belonged to more than one sampled neighbourhood.
The manual verification process involved an exhaustive review of all of the information available on the CCS-RDB. As in 2011, it included the following steps:
1. comparing persons sampled from the CCS-RDB by name, sex, birth date and relationships between persons
2. comparing members of households in the CCS-RDB according to the same criteria3. evaluating evidence for or against overcoverage between the two persons in the pair to determine whether
the two records actually represent the same person4. determining the overcoverage scenario, coded only when there was verified overcoverage between non-
identical households. Overcoverage scenarios are provided in Table 8.4.
T
Table 8.4 Overcoverage scenario codes and their meaningCode Overcoverage scenario between non-identical households1.1 Student or young adult newly away from home1.2 Young adult newly away from home because of marriage or common-law relationship 1.3 Adult entering into or leaving married or common-law relationship 2.1 Child or children of parents in separate households2.2 Child or children with two relatives or adults3.1 Adult with other relatives3.2 Adult with other unrelated adults4.1 Collective dwelling5.1 OtherSource: Statistics Canada, 2016 Census Overcoverage Study.
he manual verification sample was divided into batches of 150 pairs. One batch was entirely verified by the same coder. Once a batch was verified, it was evaluated using a statistical quality control operation.
8.5 Weighting and estimation
The starting weight of a sampling unit was simply the inverse of its probability of being selected. Given that the sampling units composed of groups or neighbourhoods varied with respect to the number of pairs they contained, a calibration step was added to ensure a good representation of the number of pairs in each province and territory. In stratum 1 (intraprovincial units), the sampling weights were calibrated so the estimated number of pairs corresponded to the total number of pairs in the frame for each province and territory. In stratum 3 (interprovincial groups and neighbourhoods), the sampling weights were calibrated so the estimated number of intraprovincial and interprovincial pairs in each province and territory was equal to the corresponding total from the frame. Thus, 13 control totals were used for stratum 1, compared with 26 for stratum 3. Statistics Canada’s Generalized Estimation System (G-Est) was used for the calibration. No calibration was required for strata 2 and 4, since they contained only pairs. Table 8.5a presents the three calibration factors for each province and territory.

68 Statistics Canada – Catalogue no. 98-303-X2016001
Coverage Technical Report
T
Table 8.5a Average calibration factor (ratio of frame total to weighted estimate) by stratum and type of pair, provinces and territories
Provinces and territories Stratum 1Stratum 3
Intraprovincial Interprovincial
Newfoundland and Labrador 1.003 1.049 0.899Prince Edward Island 1.000 1.057 1.136Nova Scotia 0.998 1.071 0.945New Brunswick 0.996 0.901 1.225Quebec 1.013 0.988 0.942Ontario 1.014 1.001 1.008Manitoba 1.008 1.013 1.117Saskatchewan 1.007 1.041 0.962Alberta 1.000 0.971 0.997British Columbia 0.999 0.956 0.951Yukon 1.000 1.039 1.415Northwest Territories 1.000 1.015 1.468Nunavut 1.000 1.000 0.493Source: Statistics Canada, 2016 Census Overcoverage Study.
he results of the manual verification were processed to create overcoverage groups for estimation. Overcoverage groups were formed from all the RDB records linked by verified overcoverage. The COS estimates were obtained by adding the estimated overcoverage counted in each overcoverage group. For an overcoverage group that was a simple pair, the overcoverage count was 1. If the overcoverage group was contained in a small group of records (i.e., a group that had not been split into neighbourhoods), then the following formula was applied:
Overcoverage = number of records in the overcoverage group - 1.
For overcoverage groups split into neighbourhoods, overcoverage was counted according to the following two steps:
1. calculating the overcoverage in each neighbourhood for which the anchor (i.e., the CCS-RDB record serving as the centre of the neighbourhood) was involved in verified overcoverage cases for this overcoverage group, as follows:
Overcoverage in the neighbourhood = (number of records in the overcoverage group - 1)
number of records in the overcoverage group
2. adding the overcoverage of each neighbourhood to obtain the total overcoverage of the group.
Overcoverage for a domain was obtained by multiplying the total overcoverage of the pair, group or neighbourhood by the proportion of CCS-RDB records that were part of the domain among those that belonged to the overcoverage group.
In all the cases described above, the overcoverage calculated for a unit was multiplied by the sampling unit’s post-calibration weight to obtain the weighted estimation. The variance was estimated with G-Est, which uses Taylor linearization.
Similar to what was done in the 2006 and 2011 COS, an adjustment based on the AMS was applied to the COS estimates to take into account the overcoverage measured by the AMS outside the COS universe. The adjustment factor was calculated and applied separately for each province and territory. The final variance took this adjustment into account. Table 8.5b shows the adjustment factor applied for each province and territory, for the last three iterations of the COS.

Statistics Canada – Catalogue no. 98-303-X2016001 69
Coverage Technical Report
8
Table 8.5b AMS adjustment to the 2006, 2011 and 2016 COS estimates, provinces and territoriesProvinces and territories 2006 2011 2016
Newfoundland and Labrador 1.029 1.030 1.035Prince Edward Island 1.028 1.017 1.003Nova Scotia 1.034 1.021 1.012New Brunswick 1.040 1.071 1.037Quebec 1.026 1.016 1.008Ontario 1.040 1.020 1.015Manitoba 1.035 1.025 1.010Saskatchewan 1.039 1.010 1.006Alberta 1.058 1.018 1.026British Columbia 1.037 1.017 1.029Yukon 1.027 1.014 1.010Northwest Territories 1.039 1.169 1.015Nunavut 1.061 1.015 1.023AMS: Automated Match Study.COS: Census Overcoverage Study.Sources: Statistics Canada, 2006, 2011 and 2016 Census Overcoverage Study.
.6 Final results
8.6.1 Overcoverage by step
The contribution of each step, and of the AMS adjustment, to the 2016 COS overcoverage estimates is provided in Table 8.6.1.

70 Statistics Canada – Catalogue no. 98-303-X2016001
Coverage Technical Report
Ap
Table 8.6.1 2016 Census Overcoverage Study estimated overcoverage by step, Canada, provinces and territories
Provinces and territories
Step 1 Step 2 Step 3Estimated
numberPercentage
of totalEstimated
numberPercentage
of totalEstimated
numberPercentage
of total
Canada 602,995 85.25 1,759 0.25 36,229 5.12Newfoundland and Labrador 9,345 84.38 47 0.42 486 4.39Prince Edward Island 2,082 86.35 9 0.37 98 4.06Nova Scotia 14,375 84.25 105 0.62 788 4.62New Brunswick 14,334 86.10 42 0.25 591 3.55Quebec 159,996 90.97 367 0.21 5,619 3.19Ontario 217,852 84.02 362 0.14 14,591 5.63Manitoba 16,975 85.53 60 0.30 1,032 5.20Saskatchewan 17,235 79.60 82 0.38 2,626 12.13Alberta 60,144 82.69 253 0.35 3,853 5.30British Columbia 89,000 81.89 418 0.38 6,395 5.88Yukon 692 81.51 6 0.71 59 6.95Northwest Territories 467 83.24 4 0.71 26 4.63Nunavut 497 78.02 4 0.63 65 10.20
Provinces and territories
Step 4 AMS adjustmentEstimated
numberPercentage
of totalEstimated
numberPercentage
of total
Canada 54,845 7.75 11,508 1.63Newfoundland and Labrador 823 7.43 374 3.38Prince Edward Island 214 8.88 8 0.33Nova Scotia 1,599 9.37 196 1.15New Brunswick 1,095 6.58 586 3.52Quebec 8,519 4.84 1,385 0.79Ontario 22,759 8.78 3,724 1.44Manitoba 1,585 7.99 195 0.98Saskatchewan 1,586 7.33 122 0.56Alberta 6,637 9.12 1,851 2.54British Columbia 9,833 9.05 3,036 2.79Yukon 84 9.89 8 0.94Northwest Territories 56 9.98 8 1.43Nunavut 57 8.95 14 2.20AMS: Automated Match Study.Source: Statistics Canada, 2016 Census Overcoverage Study.
proximately 85% of the overcoverage was estimated based on possible duplicates identified in Step 1. Because the portion of the frame from Step 1 (linkage of the CCS-RDB to itself) was expanded, the identification of potential RDB duplicates through the linkage with an intermediate administrative file (Step 2) did not contribute much to the overall estimate of census overcoverage. Remember that the potential duplicates identified both in Step 1 and in Step 2 were included in the list from Step 1. The extension (Step 3) added 36,229 persons to the estimated overcoverage. This represents 6.0% of the cases identified in steps 1 and 2 combined, which is consistent with what was observed in 2011, where the extension represented 5.4% of the total estimate from steps 1 and 2. The supplement (Step 4) identified 54,845 overcovered persons. This represents 56.5% of the 97,086 pairs added

Statistics Canada – Catalogue no. 98-303-X2016001 71
Coverage Technical Report
to the COS sampling frame by the supplement. This proportion is very high, but that was to be expected given that the goal of the supplement was to add pairs that had been flagged as likely to be RDB duplicates but that were missing from steps 1 to 3. The AMS adjustment added 11,508 persons to the overcoverage estimate, which represents 1.6% of the final estimate.
Step 1 contributed less to the total provincial or territorial estimate for Nunavut (78.0%) and Saskatchewan (79.6%), where the contribution from the extension was higher than elsewhere. However, the contribution from Step 1 was higher for Quebec (91.0%), where the contributions from the extension and the supplement were the lowest among all jurisdictions.
8.6.2 Distribution of overcoverage by scenario
The overcoverage results by scenario are presented in Table 8.6.2. The overcoverage scenario codes were provided in Section 8.4. As noted previously, the overcoverage scenario was coded only when there was overcoverage between non-identical households.

72 Statistics Canada – Catalogue no. 98-303-X2016001
Coverage Technical Report
Provinces and territories
Overcoverage scenario2.2 3.1 3.2 4.1 5.1
Child or children with two relatives
or adultsAdult with
other relatives
Adult with other unrelated
adultsCollective
dwelling Otherpercent
Canada 3.9 10.1 4.0 8.1 4.6Newfoundland and Labrador 6.0 5.9 3.6 4.8 4.4Prince Edward Island 5.9 4.1 2.8 4.4 2.7Nova Scotia 3.1 4.3 2.0 7.5 5.5New Brunswick 5.7 6.7 1.8 9.2 5.2Quebec 1.7 3.9 2.5 8.2 3.9Ontario 5.3 15.8 3.8 7.0 4.4Manitoba 5.4 8.8 3.7 12.6 4.2Saskatchewan 5.4 5.8 3.4 9.0 3.3Alberta 5.0 13.6 7.0 6.5 4.4British Columbia 2.5 9.7 7.5 12.0 7.8Yukon 4.5 16.0 3.2 6.9 12.2Northwest Territories 9.2 11.6 6.3 7.2 14.9Nunavut 22.8 17.0 2.9 6.4 11.0Source: Statistics Canada, 2016 Census Overcoverage Study.
Table 8.6.2 Distribution of 2016 Census Overcoverage Study estimated overcoverage by scenario, Canada, provinces and territories
Provinces and territories
Overcoverage scenario1.1 1.2 1.3 2.1
Student or young adult newly away
from home
Young adult newly away from
home because of marriage or
common-law relationship
Adult entering into or leaving
married or common-law relationship
Child or children of parents
in separate households
percent
Canada 18.8 4.3 3.8 42.4Newfoundland and Labrador 26.8 3.6 5.5 39.4Prince Edward Island 25.2 3.7 2.8 48.4Nova Scotia 25.3 5.3 4.2 42.8New Brunswick 24.0 4.7 4.9 37.8Quebec 14.8 7.1 1.9 56.0Ontario 22.1 3.3 5.1 33.1Manitoba 16.9 2.6 5.1 40.8Saskatchewan 16.5 0.8 4.6 51.1Alberta 17.8 3.2 2.7 39.8British Columbia 17.5 1.6 5.3 36.1Yukon 10.3 1.9 2.5 42.4Northwest Territories 14.0 5.2 2.9 28.7Nunavut 9.0 6.9 7.3 16.8

Statistics Canada – Catalogue no. 98-303-X2016001 73
Coverage Technical Report
As in 2011, the “one or more children of parents in separate households” scenario, where two separated or divorced parents both record their children in their respective survey questionnaires, was observed the most often. This was the case in every province and territory except Nunavut. The “other” category was used less often in 2016 compared with five years earlier. In 2011, “other” was the most frequent scenario for Nunavut and British Columbia. In 2016, British Columbia still had the highest proportion of “other” among the 10 provinces, but the rate was one-third of what it was in 2011.
At the national level, the two most frequent other scenarios remained “student or young adult who recently left the family home” and “adult with other relatives.” There were more cases of overcoverage between a private dwelling and a collective dwelling (scenario 4.1) in 2016 compared with 2011 (8.1% vs. 2.5%). In 2016, the extension was also applied to the comparison of households where one member included in a pair identified in step 1 or 2 lived in a private dwelling and where the other member lived in a collective household, whereas in 2011, the extension was limited to the comparison of private dwellings. However, this change explains only a small portion of the increase. Many of the cases observed in 2011 were likely coded in the “other” category, but confirming this hypothesis would require a return to data from the 2011 COS manual verification, which was not done. The same reasoning could be applied to the proportion of children of parents in separate households: there was not such a large increase in the number of separated parents between 2011 and 2016; further investigation would be required to determine how much of this change was from coding and how much was from a real change in the behaviour of separated parents enumerating their children.

74 Statistics Canada – Catalogue no. 98-303-X2016001
Coverage Technical Report
9. Estimation
Estimation for the DCS, the RRC and the COS is covered in Section 6.2, Section 7.4 and Section 8.5, respectively. This section describes how the results of census coverage studies are combined to produce estimates of population undercoverage (U), population overcoverage (O) and population net undercoverage (N) in different domains. The impact of sampling errors on the quality of the estimates is also measured by an estimated standard error for each estimate. Reverse Record Check (RRC) results and census data are used to produce undercoverage estimates, while the Census Overcoverage Survey (COS) results estimate overcoverage. Net undercoverage is the difference between undercoverage and overcoverage. This section expands on how these estimates and the associated standard errors are calculated.
The following definitions are used:
C = published census count of the number of persons in the target population
U = undercoverage estimate
= estimated number of persons not included in C who should have been included
O = overcoverage estimate
= estimated number of enumerations included in C that should not have been included
N = net undercoverage estimate
= estimated number of enumerations not included in C that should have been included, less the number of enumerations included in C who should not have been included
= OU ˆˆ −
T = estimated number of persons in the census target population based on census enumerations and the estimate of population net undercoverage
= ˆC Nˆ
UR = estimated undercoverage rate
= NC
UTU
ˆˆ
*100ˆˆ
*100+
=
ˆOR = estimated overcoverage rate
= NC
OTO
ˆˆ
*100ˆˆ
*100+
=
ˆNR = estimate of net undercoverage rate
= NCOU
TN
ˆˆˆ
*100ˆˆ
*100+−=
U is calculated using RRC results and census data, and Ô is produced from the COS, as shown below:

Statistics Canada – Catalogue no. 98-303-X2016001 75
Coverage Technical Report
T
Table 9.1 Components of the population coverage error estimates for CanadaComponents1 Number of persons
Estimate of U 1,557,061 Estimate of O 707,335 Estimate of N 849,726 C 35,151,728 C + estimate of N 36,001,454 1. U: Undercoverage; O: Overcoverage; N: Net undercoverage; C: Published census count.Source: Statistics Canada, 2016 Census Coverage Studies.
he estimated standard errors are defined as follows:
By definition, we have ˆ ˆ( )v U v M (refer to Section 7.4.7).
ˆ( )v M = estimated variance of M based on the RRC design
ˆ( )v O = estimated variance of O based on the COS design
Therefore:
se ˆ ˆ( ) ( )se U v M
se ( ) ( ) ( )OvTUMv
TTUTURse U
ˆˆˆˆ
ˆˆˆ2ˆˆˆ
4
2
4
22
+
−+=
se ˆ ˆ( )se O v O
se 2 2 2
4 4
ˆ ˆˆ ˆ ˆ2 ˆˆ ˆ( ) ( )ˆ ˆOO U T OTse R v M v OT T
se ˆˆ ˆ( ) ( )se N v M v O
se ( ) [ ])ˆ()ˆ(ˆˆ)ˆˆ(2ˆ)ˆˆ(ˆ
4
222
OvMvT
TOUTOURse N +
−−+−=

76 Statistics Canada – Catalogue no. 98-303-X2016001
Coverage Technical Report
10. Evaluation of coverage studies
10.1 Reverse Record Check
10.1.1 Introduction
The results of the largest coverage study, the Reverse Record Check (RRC), can be assessed by comparing its estimates with data on the same characteristics from other sources, such as the 2016 Census database and administrative data used by the Demographic Estimates Program (DEP). The purpose of making comparisons with RRC estimates is to evaluate the RRC estimates and to quantify conceptual and measurement differences.
Despite some conceptual differences between the RRC and the 2016 Census, the RRC estimates of persons enumerated in the 2016 Census can be compared with the census counts. To make the two numbers comparable, certain adjustments were first made to the census counts.
Estimates of the components of intercensal growth can be compared with estimates from other sources. The RRC estimates of the number of persons who died between the 2011 Census and the 2016 Census can be compared with the counts from vital statistics files. Estimates of net interprovincial migration calculated by the DEP based on Canada Revenue Agency data can be compared with RRC estimates. Lastly, RRC estimates of population growth components can be compared with similar estimates from administrative data.
10.1.2 Comparisons with census counts
Since the RRC’s single-stage stratified sampling design produces unbiased estimators, differences between RRC estimates and census counts are mainly due to sampling error in the RRC estimates, conceptual differences between the two sources, or systematic biases having impacts on the two sources, which result in an underestimate or overestimate of the characteristic being studied.
Enumerated persons
Provincial and national comparisons are presented in Table 10.1.2.1, along with the standard error of the RRC estimate and the t-value used to test the hypothesis that there is no difference between the RRC estimate and the comparable census count. The adjustments below were made in the published census counts to account for conceptual differences between the two sources:
• Adjustments based on the Dwelling Classification Survey were excluded because, while they were included in the census counts, they were not part of the RRC estimate of enumerated persons.
• The 2016 Census overcoverage estimate was subtracted because the census database contained overcovered persons, whereas the RRC estimate was based on the number of unique persons enumerated (and not on the number of enumerations).
• The estimate of the number of persons living outside Canada five years earlier (excluding intercensal immigrants and non-permanent residents) from the 2016 Census long-form questionnaire was also subtracted because the RRC estimates did not include the majority of these persons. For the same reasons, the estimated number of children aged 0 to 4 years who were born outside Canada but had Canadian citizenship was also subtracted.
• Similarly, for the provinces, the number of persons living in a territory five years earlier was subtracted because they were not covered by the RRC provincial sampling frames.
• The number of returning persons from reserves (who participated in the 2016 Census, but not in the 2011 Census) was also subtracted because the RRC estimates did not include the majority of these persons.

Statistics Canada – Catalogue no. 98-303-X2016001 77
Coverage Technical Report
N
Table 10.1.2.1 Comparison of Reverse Record Check (RRC) estimates of the number of enumerated persons and comparable census counts for Canada, provinces and territories
Provinces and territories
Enumerated persons
Difference t-value1
RRC Comparable census
countEstimated
numberStandard
error
Canada 32,735,516 58,027 32,764,831 -29,315 -0.51Newfoundland and Labrador 489,420 3,209 491,392 -1,972 -0.61Prince Edward Island 132,877 842 135,375 -2,498 -2.97Nova Scotia 866,870 6,379 871,978 -5,108 -0.80New Brunswick 701,954 5,251 705,466 -3,512 -0.67Quebec 7,753,633 27,006 7,729,824 23,809 0.88Ontario 12,629,276 44,756 12,633,458 -4,182 -0.09Manitoba 1,188,312 5,980 1,198,933 -10,621 -1.78Saskatchewan 1,025,540 6,427 1,025,469 71 0.01Alberta 3,742,897 18,899 3,716,233 26,664 1.41British Columbia 4,204,736 20,479 4,256,703 -51,967 -2.54Yukon 32,300 0 32,300 0 ...Northwest Territories 35,079 0 35,079 0 ...Nunavut 30,896 0 30,896 0 ...... not applicable1. A t-value greater than 1.96 or less than -1.96 indicates that the difference is significant at the 95% level.Sources: Statistics Canada, 2016 Reverse Record Check, 2016 Census Overcoverage Survey, 2016 Census and population estimates.
ationally, the RRC estimate of the number of persons enumerated in the 2016 Census was slightly lower than the comparable census count (-0.09%). For the 1996 to 2011 censuses, the RRC estimates were between -0.08% and 0.12%. At the provincial level, the biggest differences were observed for Prince Edward Island and British Columbia; the estimate of the number of persons enumerated as part of the RRC underestimated the comparable census counts by 2,498 and 51,967 persons respectively. These differences were statistically significant. In the other provinces, the differences were not statistically significant. In previous cycles, significant differences were also observed. The most significant differences were investigated to make sure that there was no bias in the RRC classification (including, for example, province of residence on Census Day). Other factors may also play an important role in the observed differences. Apart from sampling error, biases in the adjustments (e.g., returning Canadians) applied to the published census counts to obtain conceptually comparable figures may be responsible for the differences. RRC non-response bias may also have played a role since the non-response adjustment was designed to obtain the best result for estimating missed persons rather than enumerated persons. Regular checks and quality controls were performed for all steps in the RRC. In view of the more significant differences for Prince Edward Island and British Columbia, a more detailed investigation was conducted to ensure that the operations and estimates were not affected by any of the above-mentioned errors or problems. No such errors or problems were detected.
10.1.3 Comparison with demographic estimates
Deceased persons
Table 10.1.3.1a provides a comparison of the estimated number of persons who died during the intercensal period (May 10, 2011, to May 9, 2016) by RRC province of classification with counts from vital statistics files. The RRC estimate excludes persons who died outside Canada when the country of death is known. At the national level, the RRC estimate exceeded the vital statistics count by 52,323 persons (4.1%), and this difference was statistically significant (t-value of 2.83). At the provincial level, the greatest differences were noted in Quebec

78 Statistics Canada – Catalogue no. 98-303-X2016001
Coverage Technical Report
(19,655, or 6.3%) and Ontario (30,215, or 6.4%), and these differences were statistically significant (t-value of 2.20 and 2.10 respectively). In the other provinces, the relative differences were between -4.0% and 4.8%, and they were not statistically significant.
C
Table 10.1.3.1a Comparison of Reverse Record Check (RRC) estimated number of deceased persons and vital statistics count for the provinces
Provinces
Persons deceased May 10, 2011 to May 9, 2016
Difference t-value1
RRC Vital statistics
countEstimated
numberStandard
error
Total 1,324,335 18,485 1,272,012 52,323 2.83Newfoundland and Labrador 23,842 607 24,523 -681 -1.12Prince Edward Island 6,460 233 6,339 121 0.52Nova Scotia 45,292 1,342 44,267 1,025 0.76New Brunswick 32,414 788 33,760 -1,346 -1.71Quebec 329,265 8,950 309,610 19,655 2.20Ontario 501,900 14,364 471,685 30,215 2.10Manitoba 51,978 2,157 51,999 -21 -0.01Saskatchewan 49,021 2,389 46,771 2,250 0.94Alberta 112,555 3,296 114,820 -2,265 -0.69British Columbia 171,608 5,142 168,238 3,370 0.661. A t-value greater than 1.96 or less than -1.96 indicates that the difference is significant at the 95% level.Sources: Statistics Canada, 2016 Reverse Record Check and population estimates.
ertain reasons may explain these significant differences. Firstly, the RRC estimate may include deaths that occur abroad, which are not included in vital statistics. In the RRC, if the country of death is known and is abroad, then the death is not included in the comparison of deceased persons in Table 10.1.3.1a. However, if the person is not found in the vital statistics files and the country of death is unknown, then they would be filed by default in their most recent province of residence in Canada. This situation occurs notably for persons only presumed to be deceased in the tax data. The deceased stratum from the 2011 Census frame contains many of these persons (approximately 20,000). Some of them probably died in Canada and could perhaps be found in the vital statistics files through more detailed manual searches. However, some of these persons probably died outside the country and do not appear in the vital statistics files. Table 10.1.3.1b provides a comparison of the RRC estimate of the number of persons who died during the intercensal period (May 10, 2011, to May 9, 2016) by province of death indicated in the vital statistics files (therefore, only for persons found in these files) with vital statistics counts. The differences that had been significant (Canada, Quebec and Ontario) were no longer significant, with t-values close to 1.0. However, the difference became significant in New Brunswick (-2,031, and a t-value of -2.50). Even if these last results do not seem indicative of issues related to the RRC estimates of the number of deceased persons, a more detailed investigation was conducted to confirm that no classification or other error was involved in the operations or estimates. No such errors or problems were detected.

Statistics Canada – Catalogue no. 98-303-X2016001 79
Coverage Technical Report
I
Table 10.1.3.1b Comparison of Reverse Record Check (RRC) estimated number of deceased persons linked to vital statistics
and vital statistics count for the provinces
Provinces
Persons deceased May 10, 2011 to May 9, 2016
Difference t-value1
RRC Vital statistics
countEstimated
numberStandard
error
Total 1,290,168 17,798 1,272,012 18,156 1.02Newfoundland and Labrador 23,683 607 24,523 -840 -1.38Prince Edward Island 6,270 228 6,339 -69 -0.30Nova Scotia 44,383 1,380 44,267 116 0.08New Brunswick 31,729 812 33,760 -2,031 -2.50Quebec 316,229 8,236 309,610 6,619 0.80Ontario 488,235 14,085 471,685 16,550 1.18Manitoba 51,284 2,151 51,999 -715 -0.33Saskatchewan 48,383 2,395 46,771 1,612 0.67Alberta 111,366 3,296 114,820 -3,454 -1.05British Columbia 168,607 5,076 168,238 369 0.071. A t-value greater than 1.96 or less than -1.96 indicates that the difference is significant at the 95% level.Sources: Statistics Canada, 2016 Reverse Record Check and population estimates.
nterprovincial migration
Table 10.1.3.2 compares RRC estimates of net interprovincial migration for the intercensal period with corresponding figures calculated by the DEP based on Canada Revenue Agency (CRA) files. In general, data on interprovincial migrants were not comparable because the RRC only took into account migration flows that occurred between the sampling frame reference date (e.g., May 10, 2011, for the census frame) and Census Day in 2016, whereas the DEP estimates took annual migration into account. For this reason, only net interprovincial migration estimates are presented. Also, the stratification of the 2011 Census frame using the most recent province of residence based on tax data produced more accurate provincial estimates of persons missed by the 2016 Census, but made it more difficult to estimate through the RRC the net interprovincial migration for the sample from this census frame.
The only observed difference that was statistically significant was in Manitoba (t-value of -2.18), where the RRC estimate of net migration was significantly more negative than the DEP estimate. Both sources estimated a negative net migration, but the size differed by source. This difference could be explained by the sampling error from the 2011 Census sample, and by a larger number of recent immigrants who left the province according to the RRC. For Prince Edward Island, Quebec and Ontario, the differences were high, but not significant. As was the case for Manitoba, the RRC net migration estimate was significantly more negative than the DEP estimate for Prince Edward Island and Quebec. The analyses for these two provinces indicate that this difference was mainly caused by migrations of newly established immigrants that were not entirely captured in the tax data used by the DEP. In Ontario, the RRC estimated a slightly positive net migration, which was contrary to the negative DEP estimate. This difference could reflect the situation observed in several other provinces. The RRC could indicate interprovincial migrations of certain recent immigrants that were not measured by the DEP. In Newfoundland and Labrador, the RRC net migration was negative, but it was positive according to the CRA. However, the t-value was below 1. In the five other provinces, the RRC and CRA estimates were similar and went in the same direction.

80 Statistics Canada – Catalogue no. 98-303-X2016001
Coverage Technical Report
1
Table 10.1.3.2 Comparison of Reverse Record Check (RRC) estimates of net interprovincial migration and Canada Revenue Agency (CRA) count for the provinces
Provinces
Net interprovincial migration
Difference t-value2
RRC1
CRA count
Sample size
Estimated number
Standard error
Newfoundland and Labrador 324 -2,700 5,090 1,515 -4,215 -0.83Prince Edward Island 401 -6,633 2,372 -3,052 -3,581 -1.51Nova Scotia 562 -10,396 6,883 -10,085 -311 -0.05New Brunswick 367 -9,601 6,138 -12,078 2,477 0.40Quebec 330 -87,114 15,401 -57,895 -29,219 -1.90Ontario 1,170 3,820 24,783 -40,421 44,241 1.79Manitoba 363 -44,076 7,614 -27,459 -16,617 -2.18Saskatchewan 525 -7,034 7,311 -7,555 521 0.07Alberta 1,213 104,520 19,797 110,364 -5,844 -0.30British Columbia 943 59,214 18,291 46,666 12,548 0.691. The RRC excludes persons living in a province on May 10, 2016 who had lived in one of the three territories five years before, on May 10, 2011.2. A t-value greater than 1.96 or less than -1.96 indicates that the difference is signficant at the 95% level. Sources: Statistics Canada, 2016 Reverse Record Check and population estimates.
0.1.4 Components of population growth
The Demography Division conducted an extensive comparison of RRC estimates of the intercensal population growth components with demographic estimates derived from administrative data (this topic is also discussed in Section 10.3). The RRC estimates of the demographic components are a by-product of the RRC and therefore are not necessarily precise. However, these data provide information on population growth components, which could potentially be more related to measurement error from the DEP.
Total population growth estimates from these two sources are presented in Table 10.1.4. The estimates of returning Canadians and persons living on Indian reserves or in Indian settlements that were incompletely enumerated in 2011 and enumerated in 2016 were added to the RRC estimates to make them comparable with the DEP estimates. The DEP estimates come from a combination of several population growth components, such as births, deaths and immigration, which were subject to varying amounts of measurement error depending on the source.
At the national level, the RRC estimate is lower by 126,121 (or 6.8%) than the DEP estimate. At the provincial level, the greatest differences are noted for Quebec (-79,610) and British Columbia (34,258).

Statistics Canada – Catalogue no. 98-303-X2016001 81
Coverage Technical Report
1
Table 10.1.4 Comparison of Reverse Record Check (RRC) estimates of population growth and demographic estimates for the provinces
Provinces
Population growth May 10, 2011 to May 9, 2016
DifferenceRRC
Population estimates
estimated number
Total 1,733,333 1,859,454 -126,121Newfoundland and Labrador 1,470 5,737 -4,267Prince Edward Island 814 5,526 -4,712Nova Scotia 2,414 4,442 -2,028New Brunswick 2,929 1,635 1,294Quebec 225,069 304,679 -79,610Ontario 638,000 665,738 -27,738Manitoba 63,289 83,330 -20,041Saskatchewan 68,925 81,427 -12,502Alberta 442,575 453,350 -10,775British Columbia 287,848 253,590 34,258Sources: Statistics Canada, 2016 Reverse Record Check and population estimates.
0.2 Census Overcoverage Study
Many changes were made to the 2016 COS methodology to identify more overcoverage cases than in 2011. The evaluation to gauge the success of the 2016 COS had two objectives: to measure overcoverage not detected by the COS, and to quantify the improvement attributable to the methodological changes made since 2011. The Automated Match Study (AMS) is a useful tool to achieve both objectives since its methodology has remained essentially unchanged since 2001. It is particularly useful for addressing the significant problem of breaking down any increase in the estimated overcoverage into two components: higher overcoverage in the studied population, and additional overcoverage detected because of improvement in the COS methodology.
10.2.1 Comparison of the 2011 and 2016 AMSs
The 2016 AMS was carried out using the same methodology as the 2011 AMS, and then the two studies were compared. This made it possible to estimate the relative differences in overcoverage at several levels (e.g., national, provincial and territorial) between 2011 and 2016. The results of the comparison are shown in Table 10.2.1.

82 Statistics Canada – Catalogue no. 98-303-X2016001
Coverage Technical Report
T
Table 10.2.1 Overcoverage estimate comparison between the 2011 and 2016 Automated Match Study (AMS), Canada, provinces and territories
Provinces and territories
Estimated number of overcovered persons Relative
difference (%)2011 AMS 2016 AMS
Canada 430,702 464,993 8Newfoundland and Labrador 7,221 7,350 2Prince Edward Island 1,445 1,348 -7Nova Scotia 10,983 10,435 -5New Brunswick 12,708 11,006 -13Quebec 106,720 112,749 6Ontario 146,962 154,761 5Manitoba 11,171 12,235 10Saskatchewan 12,421 13,089 5Alberta 41,997 49,119 17British Columbia 77,951 91,772 18Yukon 643 527 -18Northwest Territories 355 273 -23Nunavut 124 329 165Sources: Statistics Canada, 2011 and 2016 Automated Match Study.
he 2016 AMS revealed that overcoverage had once again increased, as had been the case between each of the previous censuses. The 2016 AMS indicated an 8.0% increase in the estimated number of overcovered persons compared with the 2011 AMS. This is consistent with the estimate produced by the COS, which indicated a relative increase of 11.8%. The observed increase was closer across studies this time, compared with the increase observed between 2006 and 2011.
At the provincial and territorial level, the variation between estimates from the 2011 AMS and the 2016 AMS was positive for 8 of the 13 provinces and territories. The variation in estimated overcoverage between the 2011 and 2016 censuses was consistent for the AMS and COS for all provinces and territories except three—Prince Edward Island, Nova Scotia and New Brunswick—where the AMS estimate indicated a decrease in overcoverage and the COS estimate indicated an increase. From 2006 to 2011, the variation moved in opposite directions in two places, Prince Edward Island and Manitoba.
10.2.2 Comparison of the 2016 COS and the 2016 AMS
The results of the 2016 COS were compared with the results of the 2016 AMS to estimate overcoverage missed by the COS but detected by the AMS, overcoverage missed by the AMS but detected by the COS, and overcoverage identified by both studies. These kinds of differences are to be expected because of the different approaches taken in the COS (person-based) and the AMS (household-based). The comparison was carried out in two steps.
The first step was to estimate the overcoverage detected by both the AMS and the COS in the COS sampling frames, i.e., overcoverage in the AMS domain of the COS. This overcoverage was estimated by matching person pairs that were in the AMS sampling frame with duplicates in the COS sample. It was estimated using the COS sample.
The second step was to estimate overcoverage detected by the AMS, but not by the COS. This overcoverage was equal to the total overcoverage for all AMS household pairs that contained no COS person pairs. It was estimated by matching the COS person pairs with the duplicates in the AMS sample. Unmatched AMS duplicates were the portion not detected by the COS.

Statistics Canada – Catalogue no. 98-303-X2016001 83
Coverage Technical Report
The results of comparing the COS with the AMS are presented in Table 10.2.2.
T
Table 10.2.2 Comparison of the 2016 Census Overcoverage Study (COS) and 2016 Automated Match Study (AMS)
COS universe AMS universeEstimated overcoverage: 695,828 Estimated overcoverage: 464,993
Overcoverage common to both studies (COS and AMS)
433,140 62.2% of the COS total
Overcoverage common to both studies (COS and AMS)
453,484 97.5% of the AMS total
Overcoverage found by the COS, but NOT by the AMS
262,688 37.8% of the COS total No overcoverage found in the AMS
No overcoverage found in the COS Overcoverage found by the AMS, but NOT by the COS
11,508 2.5% of the AMS total
Sources: Statistics Canada, 2016 Automated Match Study and 2016 Census Overcoverage Study.
he left side of Table 10.2.2 contains the national estimates based on the COS sample:
• overcoverage in the COS frame: 695,828• overcoverage in the COS initial frame and the AMS frame: 433,140, or 62.2% of the total overcoverage
detected using the COS• overcoverage in the COS frame but not in the AMS frame: 262,688, or 37.8% of the total overcoverage
detected using the COS.
The right side contains the following national estimates based on the AMS sample:
• overcoverage in the AMS frame: 464,993• overcoverage in the COS frame and the AMS frame: 453,484, or 97.5% of the total overcoverage detected
using the AMS• overcoverage in the AMS frame but not in the COS frame: 11,508, or 2.5% of the total overcoverage
detected using the AMS.
As shown in Table 10.2.2, the COS and AMS can both be used to estimate the overcoverage covered by the two studies. For this common portion, the AMS estimate exceeds the COS estimate by 20,344. The two estimates are consistent with each other, and their difference is not statistically significant at the 95% confidence level.
10.3 Demographic estimates
10.3.1 Error of closure
Statistics Canada’s DEP determines provincial and territorial population counts on Census Day by summing census population counts, estimates of census net undercoverage (CNU) and the population estimate for incompletely enumerated Indian reserves. The DEP then extends these adjusted counts to July 1, and they become the base for postcensal demographic estimates.
When determining these adjusted counts, the DEP evaluates the quality of the postcensal estimates that it produced in the five-year period preceding the census. The evaluation focuses on the difference between the postcensal estimates for Census Day and the adjusted population count for this census. This difference is referred to as the error of closure. The detailed examination of this error is the main quality measure of the postcensal estimates.

84 Statistics Canada – Catalogue no. 98-303-X2016001
Coverage Technical Report
Table 10.3.1 shows the errors of closure for 2006, 2011 and 2016 by province and territory, and for Canada. Note that a positive error of closure means that the postcensal demographic estimate is higher than the adjusted census count. At the national level, the error of closure for 2016 was 110,310, for an error rate of 0.31%. The national demographic estimates therefore overestimated Canada’s population. The error and error rate in 2016 were lower than in 2011, but higher than in 2006.9 Five provinces had errors of closure greater than 1% or less than -1% in 2016: Prince Edward Island (1.88%), Quebec (1.05%), Saskatchewan (1.06%), Alberta (1.05%) and British Columbia (-2.07%). By comparison, in 2011, four provinces and two territories had similar errors of closure. In 2016, seven provinces and one territory had larger errors of closure (in absolute value terms) than in 2011.
1
Table 10.3.1 Error of closure for Canada, provinces and territories, 2006, 2011 and 2016
Provinces and territories2006 2011 2016
number rate (%) number rate (%) number rate (%)
Canada 32,129 0.10 144,554 0.42 110,310 0.31Newfoundland and Labrador -1,641 -0.32 -11,106 -2.12 975 0.18Prince Edward Island -8 -0.01 2,169 1.51 2,745 1.88Nova Scotia -4,328 -0.46 4,819 0.51 6,673 0.71New Brunswick 2,681 0.36 1,446 0.19 -6,100 -0.80Quebec 21,219 0.28 -24,472 -0.31 86,265 1.05Ontario 16,311 0.13 108,846 0.82 60,683 0.44Manitoba -5,987 -0.51 21,425 1.74 3,644 0.28Saskatchewan -3,784 -0.38 -7,871 -0.74 11,960 1.06Alberta -51,338 -1.51 -3,378 -0.09 44,099 1.05British Columbia 61,367 1.45 52,356 1.17 -100,403 -2.07Yukon -1,031 -3.20 103 0.29 -317 -0.83Northwest Territories -924 -2.14 700 1.61 -58 -0.13Nunavut -408 -1.33 -483 -1.42 144 0.39Source: Statistics Canada, Demography Division.
0.3.2 Accuracy of postcensal estimates
For the purposes of producing the DEP estimates, the census coverage studies are used to adjust census counts for CNU. However, since these studies are based in part on sample surveys, the CNU results contain some statistical variability attributable to sampling. To determine whether the errors of closure discussed above are statistically significant, the standard error of the adjusted census counts must be taken into account. Moreover, since the 2011 adjusted census counts were used as the base population for the 2011 to 2016 postcensal estimates, a standard error that combines the statistical variability of the adjusted census counts for 2011 and 2016 was calculated for Canada and for each province and territory.
9. Errors of closure for 2006 and 2011 are calculated using postcensal estimates from the 2006 and 2011 censuses, updated in 2018 following a revision of the components.

Statistics Canada – Catalogue no. 98-303-X2016001 85
Coverage Technical Report
Table 10.3.2 shows the 2016 error of closure for Canada, the provinces and territories; the combined standard error of the 2011 and 2016 adjusted census counts; and the t-value.10 The error of closure is statistically significant at a 95% confidence level for Prince Edward Island, Quebec, Alberta and British Columbia. For these provinces, the variability attributable to sampling of the 2011 and 2016 adjusted census counts therefore does not explain the majority of the error of closure.
T
Table 10.3.2 Impact of the adjusted censuses’ statistical variability on the accuracy of demographic estimates, for Canada, provinces and territories, 2011 to 2016
Provinces and territoriesError of closure
Combined standard error of the 2011 and 2016
adjusted censusest-value1number
Canada 110,310 64,314 1.72Newfoundland and Labrador 975 3,197 0.31Prince Edward Island 2,745 1,186 2.31Nova Scotia 6,673 5,692 1.17New Brunswick -6,100 3,762 -1.62Quebec 86,265 28,327 3.05Ontario 60,683 49,534 1.23Manitoba 3,644 7,091 0.51Saskatchewan 11,960 7,067 1.69Alberta 44,099 20,627 2.14British Columbia -100,403 21,727 -4.62Yukon -317 361 -0.88Northwest Territories -58 415 -0.14Nunavut 144 655 0.221. A t-value either greater than 1.96 or less than -1.96 indicates that the difference is signficant at the 95% level. Source: Statistics Canada, Demography Division.
he components of population growth estimated by the DEP were compared with those from other sources, mainly the RRC, to determine the components that could be more closely linked to the error of closure. This analysis focused on the four provinces for which the error was statistically significant. Interprovincial migration, particularly that of recent immigrants, could explain part of the error of closure calculated for Prince Edward Island and Quebec. In addition to the variability in measuring the net coverage error, several components of population growth could help to explain the error calculated for Alberta and British Columbia. However, it is difficult to identify a primary factor. Lastly, emigration generally remains a demographic phenomenon that is particularly difficult to measure.
10. If the t-value is greater than 1.96 or less than -1.96, the DEP estimate is statistically different from the adjusted census count at a 95% confidence level.

86 Statistics Canada – Catalogue no. 98-303-X2016001
Coverage Technical Report
11. Historical estimates of population coverage error
11.1 Estimates
This section presents historical estimates of population coverage error. Chart 11.1a shows the estimated population undercoverage rate UR for the 1971 Census to the 2016 Census, as well as the estimated population overcoverage rate OR and the estimated population net undercoverage rate NR for the 1991 Census to the 2016 Census. Overcoverage and net undercoverage begin in 1991 because the overcoverage rate was first estimated for the 1991 Census, after an experimental study was conducted for the 1986 Census.
Sources: Statistics Canada, 1971 to 2016 Census Coverage Studies.
rate (%)
Chart 11.1aEstimated rates of population coverage error for Canada, 1971 to 2016 censuses
0.0
0.5
1.0
1.5
2.0
2.5
3.0
3.5
4.0
4.5
5.0
1971 1976 1981 1986 1991 1996 2001 2006 2011 2016
Census year
Undercoverage Overcoverage Net undercoverage
Data Table for Chart 11.1a
Census year
Estimated undercoverage rate
Estimated overcoverage rate
Estimated net undercoverage rate
rate (%)1971 1.93 .. ..1976 2.04 .. ..1981 2.01 .. ..1986 3.21 .. ..1991 3.43 0.56 2.871996 3.18 0.74 2.442001 3.95 0.96 2.992006 4.26 1.59 2.672011 4.07 1.85 2.222016 4.32 1.96 2.36.. not available for a specific reference periodSources: Statistics Canada, 1971 to 2016 Census Coverage Studies.

Statistics Canada – Catalogue no. 98-303-X2016001 87
Coverage Technical Report
Population coverage error is a major data quality concern; undercoverage has more than doubled since 1981, and overcoverage is two-and-a-half times higher than it was in 1996. Changes in net undercoverage from census to census reflect changes in undercoverage and overcoverage, which in turn reflect changes in the demographic situation, in the living arrangements of Canadians, in census methodology, and in the methodology of the coverage studies. The last issue is discussed in Section 11.2.
As shown in Chart 11.1a, the undercoverage rate increased slightly in 2016, while the overcoverage rate changed very little. The undercoverage rate changed little in the 1971 to 1981 censuses, before increasing 1.2 percentage points in the 1986 Census. It held relatively steady from 1986 to 1996, then increased again by 0.78 percentage points in 2001. It remained fairly stable again in the censuses from 2001 to 2016, with alternating small increases and declines. As mentioned, some of these fluctuations, including the increase observed in 2016, can be explained by the improvements made to the coverage study methodology described in Section 11.2.
The overcoverage rate has increased in each census since it was first measured. The largest recorded increase in the overcoverage rate was from 0.96% to 1.59% between 2001 and 2006. In 2016, the rate peaked at 1.96%, although the increase from 2011 was not statistically significant.
In 2016, net undercoverage increased slightly, following declines in the previous two censuses, but it was still the second lowest rate since the inclusion of net undercoverage in the census, and the increase over 2011 was not statistically significant.
An examination of undercoverage since the 1981 Census shows that the increase observed in the 1986 Census led to the creation of the Address Register (AR) for the 1991 Census. The AR provided a separate list of urban dwellings that should have been enumerated. For the 1996 Census, the use of enumerators instead of self-enumeration in some central parts of large cities reduced undercoverage. In addition, moving Census Day from early June to mid-May helped to control undercoverage because people were more likely to be at home and less likely to be moving. In 2006, mailing out the questionnaires in urban areas reduced the number of employees required for collection. The introduction of online questionnaires also reduced data capture problems. In 2011, the adoption of wave methodology made it possible to target census follow-up activities more effectively, and a sharp increase in online responses further reduced data capture problems. The elimination of the long-form questionnaire probably resulted in a slight decrease in the census non-response rate. In 2016, the reintroduction of the mandatory long-form questionnaire, the upward trend in online responses, and the movement of public support for the census reduced the census non-response rate and improved the overall quality of the census.
Estimates of undercoverage are presented in Table 11.1a and Table 11.1b. Note that 1971 is not included in Table 11.1b because estimates were produced for different age groups for persons older than 24.

88 Statistics Canada – Catalogue no. 98-303-X2016001
Coverage Technical Report
Table 11.1a Estimated population undercoverage rates and standard errors for Canada, provinces and territories, 1971 Census to 2016 Census1
Provinces and territories
1971 1976 1981Estimated
rateStandard
errorEstimated
rateStandard
errorEstimated
rateStandard
errorpercent
Canada 1.93 0.09 2.04 0.10 2.01 0.09Newfoundland and Labrador 2.25 0.72 1.10 0.39 1.74 0.45Prince Edward Island 1.23 1.13 0.38 0.25 1.17 0.54Nova Scotia 1.33 0.45 0.86 0.34 1.05 0.34New Brunswick 1.65 0.56 2.16 0.37 1.81 0.30Quebec 2.10 0.19 2.95 0.25 1.91 0.21Ontario 1.68 0.12 1.52 0.17 1.94 0.14Manitoba 1.13 0.38 1.07 0.33 0.98 0.35Saskatchewan 1.00 0.37 1.33 0.34 0.99 0.37Alberta 2.55 0.44 1.49 0.26 2.54 0.36British Columbia 2.89 0.39 3.13 0.31 3.16 0.33Yukon .. .. .. .. .. ..Northwest Territories .. .. .. .. .. ..Nunavut ... … … … … …
Provinces and territories
1986 1991 1996Estimated
rateStandard
errorEstimated
rateStandard
errorEstimated
rateStandard
errorpercent
Canada 3.21 0.13 3.43 0.12 3.18 0.09Newfoundland and Labrador 1.92 0.33 2.47 0.30 2.45 0.29Prince Edward Island 2.14 0.80 1.67 0.23 1.76 0.28Nova Scotia 2.15 0.34 2.25 0.36 2.70 0.27New Brunswick 2.71 0.33 3.71 0.42 2.49 0.28Quebec 2.91 0.31 3.18 0.20 2.46 0.18Ontario 3.43 0.19 4.23 0.28 3.40 0.18Manitoba 2.94 0.40 2.31 0.36 2.55 0.29Saskatchewan 2.38 0.37 2.15 0.32 3.30 0.32Alberta 3.00 0.32 2.51 0.27 2.99 0.24British Columbia 4.48 0.36 3.42 0.24 4.58 0.24Yukon .. .. 4.12 0.58 3.92 0.51Northwest Territories .. .. 5.73 0.57 4.28 0.67Nunavut … … … … 6.54 0.63

Statistics Canada – Catalogue no. 98-303-X2016001 89
Coverage Technical Report
Table 11.1a Estimated population undercoverage rates and standard errors for Canada, provinces and territories, 1971 Census to 2016 Census1
Provinces and territories
2001 2006 2011 2016Estimated
rateStandard
errorEstimated
rateStandard
errorEstimated
rateStandard
errorEstimated
rateStandard
errorpercent
Canada 3.95 0.13 4.26 0.17 4.07 0.16 4.32 0.11Newfoundland and Labrador 2.43 0.32 2.62 0.54 3.70 0.53 3.94 0.36Prince Edward Island 1.89 0.53 3.04 0.52 3.90 0.62 4.01 0.57Nova Scotia 3.44 0.41 4.02 0.54 4.04 0.54 3.70 0.30New Brunswick 3.57 0.42 3.56 0.43 2.64 0.43 4.24 0.34Quebec 2.93 0.26 2.46 0.32 2.99 0.29 2.57 0.21Ontario 4.56 0.25 5.18 0.34 4.47 0.32 4.63 0.22Manitoba 3.49 0.43 4.32 0.57 3.11 0.48 3.95 0.35Saskatchewan 3.18 0.37 3.81 0.50 4.43 0.57 4.99 0.37Alberta 3.18 0.33 4.74 0.49 5.11 0.45 4.51 0.30British Columbia 5.30 0.34 4.83 0.41 4.31 0.41 6.31 0.31Yukon 5.59 1.16 7.23 0.64 6.30 0.81 8.42 0.45Northwest Territories 9.10 0.80 5.74 0.57 5.99 0.69 7.83 0.53Nunavut 5.07 1.39 5.55 0.60 7.39 1.65 4.25 0.59.. not available for a specific reference period ... not applicable1. Excludes incompletely enumerated Indian reserves. The 1991 Census and subsequent censuses include non-permanent residents and territories. Figures include revisions to the original 1986 publication. Figures exclude estimates of persons missed in dwellings misclassified as unoccupied in 1971 and 1976. Sources: Statistics Canada, 1971 to 2016 census coverage studies.

90 Statistics Canada – Catalogue no. 98-303-X2016001
Coverage Technical Report
Table 11.1b Estimated population undercoverage rates and standard errors, sex and age group for Canada, 1976 Census to 2016 Census1,2
Sex and age group
1976 1981 1986Estimated
rateStandard
errorEstimated
rateStandard
errorEstimated
rateStandard
errorpercent
Both sexes 2.04 0.10 2.01 0.09 3.21 0.130 to 4 years 2.31 0.28 1.21 0.22 2.14 0.495 to 14 years 1.20 0.16 1.23 0.21 2.08 0.2615 to 17 years2 1.99 0.38 2.96 0.52 3.58 0.6018 to 19 years .. .. .. .. .. ..20 to 24 years 5.31 0.38 5.51 0.29 8.66 0.4625 to 34 years 2.85 0.28 2.31 0.28 4.51 0.3535 to 44 years 1.54 0.26 2.20 0.26 2.32 0.3145 to 54 years 1.22 0.33 0.81 0.23 1.58 0.2955 to 64 years 0.92 0.20 0.91 0.29 2.06 0.3165 years and older 1.20 0.25 0.71 0.30 1.76 0.31Males 2.46 0.17 2.37 0.13 3.75 0.160 to 4 years 2.53 0.46 1.32 0.33 2.22 0.675 to 14 years 1.14 0.21 1.27 0.29 1.98 0.3215 to 17 years2 1.93 0.48 3.12 0.68 4.09 0.7418 to 19 years .. .. .. .. .. ..20 to 24 years 5.99 0.52 6.03 0.48 10.36 0.5725 to 34 years 3.64 0.46 2.70 0.44 5.43 0.4535 to 44 years 2.33 0.48 3.42 0.40 3.29 0.5145 to 54 years 1.63 0.41 1.21 0.38 1.95 0.5255 to 64 years 1.28 0.34 0.91 0.40 1.88 0.4765 years and older 1.90 0.44 0.69 0.47 1.57 0.50Females 1.61 0.10 1.65 0.12 2.68 0.170 to 4 years 2.07 0.36 1.10 0.33 2.06 0.625 to 14 years 1.26 0.27 1.19 0.31 2.20 0.3315 to 17 years2 2.05 0.51 2.80 0.73 3.05 0.7618 to 19 years .. .. .. .. .. ..20 to 24 years 4.62 0.48 4.98 0.43 6.89 0.7225 to 34 years 2.03 0.38 1.92 0.32 3.59 0.4535 to 44 years 0.72 0.24 0.93 0.31 1.33 0.3245 to 54 years 0.81 0.38 0.41 0.26 1.20 0.3555 to 64 years 0.58 0.25 0.92 0.34 2.23 0.5065 years and older 0.64 0.38 0.71 0.42 1.89 0.44
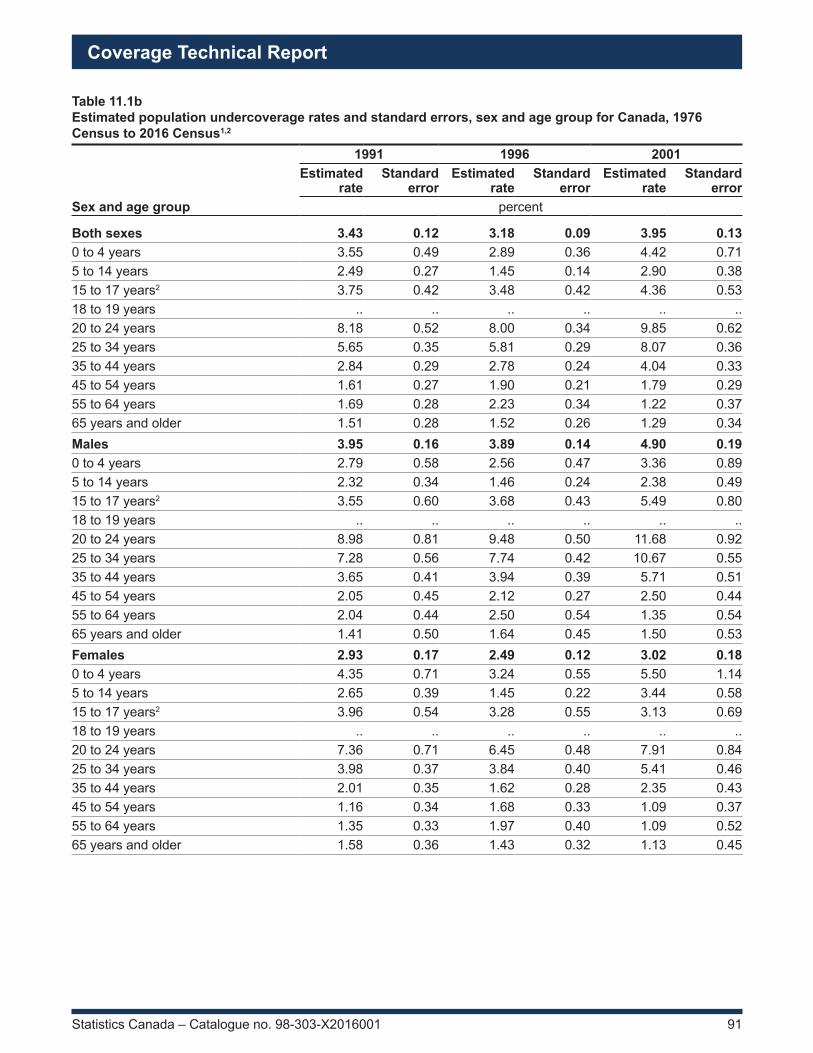
Statistics Canada – Catalogue no. 98-303-X2016001 91
Coverage Technical Report
Table 11.1b Estimated population undercoverage rates and standard errors, sex and age group for Canada, 1976 Census to 2016 Census1,2
Sex and age group
1991 1996 2001Estimated
rateStandard
errorEstimated
rateStandard
errorEstimated
rateStandard
errorpercent
Both sexes 3.43 0.12 3.18 0.09 3.95 0.130 to 4 years 3.55 0.49 2.89 0.36 4.42 0.715 to 14 years 2.49 0.27 1.45 0.14 2.90 0.3815 to 17 years2 3.75 0.42 3.48 0.42 4.36 0.5318 to 19 years .. .. .. .. .. ..20 to 24 years 8.18 0.52 8.00 0.34 9.85 0.6225 to 34 years 5.65 0.35 5.81 0.29 8.07 0.3635 to 44 years 2.84 0.29 2.78 0.24 4.04 0.3345 to 54 years 1.61 0.27 1.90 0.21 1.79 0.2955 to 64 years 1.69 0.28 2.23 0.34 1.22 0.3765 years and older 1.51 0.28 1.52 0.26 1.29 0.34Males 3.95 0.16 3.89 0.14 4.90 0.190 to 4 years 2.79 0.58 2.56 0.47 3.36 0.895 to 14 years 2.32 0.34 1.46 0.24 2.38 0.4915 to 17 years2 3.55 0.60 3.68 0.43 5.49 0.8018 to 19 years .. .. .. .. .. ..20 to 24 years 8.98 0.81 9.48 0.50 11.68 0.9225 to 34 years 7.28 0.56 7.74 0.42 10.67 0.5535 to 44 years 3.65 0.41 3.94 0.39 5.71 0.5145 to 54 years 2.05 0.45 2.12 0.27 2.50 0.4455 to 64 years 2.04 0.44 2.50 0.54 1.35 0.5465 years and older 1.41 0.50 1.64 0.45 1.50 0.53Females 2.93 0.17 2.49 0.12 3.02 0.180 to 4 years 4.35 0.71 3.24 0.55 5.50 1.145 to 14 years 2.65 0.39 1.45 0.22 3.44 0.5815 to 17 years2 3.96 0.54 3.28 0.55 3.13 0.6918 to 19 years .. .. .. .. .. ..20 to 24 years 7.36 0.71 6.45 0.48 7.91 0.8425 to 34 years 3.98 0.37 3.84 0.40 5.41 0.4635 to 44 years 2.01 0.35 1.62 0.28 2.35 0.4345 to 54 years 1.16 0.34 1.68 0.33 1.09 0.3755 to 64 years 1.35 0.33 1.97 0.40 1.09 0.5265 years and older 1.58 0.36 1.43 0.32 1.13 0.45

92 Statistics Canada – Catalogue no. 98-303-X2016001
Coverage Technical Report
Table 11.1b Estimated population undercoverage rates and standard errors, sex and age group for Canada, 1976 Census to 2016 Census1,2
Sex and age group
2006 2011 2016Estimated
rateStandard
errorEstimated
rateStandard
errorEstimated
rateStandard
errorpercent
Both sexes 4.26 0.17 4.07 0.16 4.32 0.110 to 4 years 4.07 0.65 3.36 0.62 3.79 0.515 to 14 years 3.10 0.46 2.61 0.42 2.94 0.3715 to 17 years2 1.56 0.60 3.83 0.85 4.35 0.7818 to 19 years 8.86 1.58 6.28 0.93 7.71 1.2520 to 24 years 10.50 0.74 9.60 0.69 9.64 0.5825 to 34 years 9.43 0.56 8.96 0.48 8.60 0.4235 to 44 years 5.36 0.50 4.66 0.45 5.07 0.4145 to 54 years 2.64 0.43 2.95 0.42 3.86 0.3955 to 64 years 0.95 0.53 1.02 0.41 2.21 0.4265 years and older 0.21 0.40 1.19 0.45 0.77 0.29Males 5.51 0.26 5.07 0.24 5.27 0.180 to 4 years 4.24 0.95 3.14 0.82 4.22 0.685 to 14 years 3.04 0.64 3.00 0.62 2.35 0.5415 to 17 years2 1.88 0.88 4.31 1.13 4.55 1.1118 to 19 years 10.06 2.45 5.42 1.19 7.38 1.8220 to 24 years 12.21 1.12 9.37 0.88 11.46 0.8825 to 34 years 11.42 0.86 10.54 0.73 10.44 0.6335 to 44 years 7.77 0.79 6.34 0.68 6.24 0.6345 to 54 years 4.14 0.69 4.69 0.66 5.16 0.5955 to 64 years 2.13 0.77 2.58 0.69 3.11 0.6765 years and older -0.05 0.56 1.32 0.60 1.23 0.41Females 3.04 0.23 3.08 0.22 3.39 0.180 to 4 years 3.88 0.92 3.59 0.95 3.34 0.875 to 14 years 3.17 0.66 2.20 0.57 3.56 0.5615 to 17 years2 1.23 0.83 3.31 1.28 4.13 1.0618 to 19 years 7.58 1.96 7.17 1.45 8.07 1.7720 to 24 years 8.70 0.98 9.83 1.07 7.66 0.7725 to 34 years 7.43 0.73 7.37 0.63 6.71 0.5635 to 44 years 2.90 0.61 2.99 0.58 3.93 0.5345 to 54 years 1.13 0.51 1.21 0.52 2.56 0.5555 to 64 years -0.22 0.73 -0.52 0.44 1.32 0.5065 years and older 0.40 0.56 1.08 0.66 0.39 0.42.. not available for a specific reference period1. Excludes incompletely enumerated Indian reserves. The 1991 Census and subsequent censuses include non-permanent residents and territories. Rates include revisions to the original 1986 publication. Rates exclude estimates of persons missed in dwellings misclassified as unoccupied in 1976. 2. Data for all years except 2006, 2011 and 2016 are for persons aged 15 to 19.Sources: Statistics Canada, 1976 to 2016 census coverage studies.

Statistics Canada – Catalogue no. 98-303-X2016001 93
Coverage Technical Report
The following can be observed from these tables:
Undercoverage is usually higher in the three territories, except in Nunavut, where the undercoverage rate was close to the national rate in 2016. Among the provinces, undercoverage is generally higher in British Columbia and Ontario. However, in recent censuses, the undercoverage rate in Alberta and Saskatchewan has been close to Ontario’s rate, and has even exceeded it a few times. Between 1971 and 2001, British Columbia was the province with the highest undercoverage rate in every census, except in 1991, when Ontario had the highest rate. Ontario had the highest rate in 2006 as well, while Alberta had it in 2011. In 2016, British Columbia had the highest rate again, followed by Saskatchewan. Undercoverage rates for Quebec and the Atlantic provinces tend to be lower than the national rate.
Undercoverage was higher for young adults and higher for males than for females. Thus, there are two persistent demographic trends. First, undercoverage for males is higher than undercoverage for females. Second, undercoverage is higher for young adults, especially those who have never been married, regardless of sex (Dolson 2012). As shown in Chart 11.1b, undercoverage for males was higher than undercoverage for females for every census since 1971 (increasing from 2.27% to 5.27% for males and from 1.59% to 3.39% for females). Chart 11.1b also shows that undercoverage for young men aged 20 to 24 was higher than undercoverage for all males. This was also the case for women aged 20 to 24, but the rate for women aged 20 to 24 was lower than the rate for men in the same age group in every census except 2011, when the rates were 9.83% and 9.37%, respectively. The undercoverage rate for young women peaked at 9.83% in 2011 and then dropped to 7.66% in 2016. In contrast, the rate for young men was at its lowest point in 20 years in 2011 and increased 2.09 percentage points in 2016. The undercoverage rates for adults aged 25 to 34 were also high. The undercoverage rate was higher for young adults, partly because of their less stable living arrangements. Young adults are more likely to change their living arrangements than older adults or children because they are moving away from home to work or to attend a postsecondary institution, or they are moving in with friends or spouses.
Sources: Statistics Canada, 1971 to 2016 Census Coverage Studies.
undercoverage rate (%)
Chart 11.1bEstimated rates of population undercoverage, by sex and age group for Canada, 1971 to 2016 censuses
Census year
0
2
4
6
8
10
12
14
1971 1976 1981 1986 1991 1996 2001 2006 2011 2016
All males All females Males 20 to 24 Females 20 to 24

94 Statistics Canada – Catalogue no. 98-303-X2016001
Coverage Technical Report
Data Table for Chart 11.1b
Census yearAll males All females Males 20 to 24 Females 20 to 24
undercoverage rate (%)1971 2.27 1.59 4.97 4.011976 2.46 1.61 5.99 4.621981 2.37 1.65 6.03 4.981986 3.75 2.68 10.36 6.891991 3.95 2.93 8.98 7.361996 3.89 2.49 9.48 6.452001 4.90 3.02 11.68 7.912006 5.51 3.04 12.21 8.712011 5.07 3.08 9.37 9.832016 5.27 3.39 11.46 7.66Sources: Statistics Canada, 1971 to 2016 Census Coverage Studies.

Statistics Canada – Catalogue no. 98-303-X2016001 95
Coverage Technical Report
Estimates of overcoverage rates are presented in Table 11.1c and Table 11.1d.
Table 11.1c Estimated population overcoverage rates and standard errors for Canada, provinces and territories, 1991 Census to 2016 Census1
Provinces and territories
1991 1996 2001Estimated
rateStandard
errorEstimated
rateStandard
errorEstimated
rateStandard
errorpercent
Canada 0.56 0.04 0.74 0.04 0.96 0.05Newfoundland and Labrador 0.48 0.09 0.77 0.12 0.63 0.10Prince Edward Island 0.74 0.15 0.91 0.14 0.92 0.18Nova Scotia 0.36 0.09 0.47 0.07 0.81 0.14New Brunswick 0.46 0.09 0.60 0.10 0.89 0.19Quebec 0.51 0.07 0.85 0.08 1.03 0.10Ontario 0.59 0.07 0.67 0.07 0.88 0.09Manitoba 0.45 0.11 0.88 0.15 0.80 0.15Saskatchewan 0.35 0.08 0.55 0.11 1.06 0.20Alberta 0.51 0.09 0.59 0.10 0.89 0.13British Columbia 0.68 0.10 0.89 0.09 1.26 0.12Yukon 0.29 0.07 0.70 0.17 0.86 0.16Northwest Territories 0.29 0.07 1.32 0.22 1.00 0.11Nunavut … … 0.99 0.22 0.59 0.10
Provinces and territories
2006 2011 2016Estimated
rateStandard
errorEstimated
rateStandard
errorEstimated
rateStandard
errorpercent
Canada 1.59 0.01 1.85 0.02 1.96 0.04Newfoundland and Labrador 1.63 0.05 1.76 0.04 2.09 0.07Prince Edward Island 1.66 0.06 1.54 0.04 1.65 0.07Nova Scotia 1.40 0.03 1.72 0.04 1.81 0.07New Brunswick 1.41 0.03 2.12 0.05 2.18 0.08Quebec 1.66 0.02 2.07 0.03 2.15 0.12Ontario 1.49 0.02 1.67 0.04 1.87 0.08Manitoba 1.42 0.04 1.35 0.04 1.51 0.06Saskatchewan 1.53 0.04 1.65 0.04 1.91 0.14Alberta 1.47 0.02 1.70 0.05 1.74 0.06British Columbia 1.96 0.03 2.28 0.05 2.24 0.07Yukon 1.62 0.08 2.45 0.05 2.22 0.08Northwest Territories 1.98 0.08 1.44 0.11 1.25 0.06Nunavut 1.44 0.07 1.17 0.07 1.73 0.07… not applicable1. Excludes incompletely enumerated Indian reserves. Figures include non-permanent residents. Sources: Statistics Canada, 1991 to 2016 census coverage studies.

96 Statistics Canada – Catalogue no. 98-303-X2016001
Coverage Technical Report
Table 11.1d Estimated population overcoverage rates and standard errors, sex and age groups for Canada, 1996 Census to 2016 Census1,2
Sex and age groups
1996 2001 2006Estimated
rateStandard
errorEstimated
rateStandard
errorEstimated
rateStandard
errorpercent
Both sexes 0.74 0.04 0.96 0.05 1.59 0.010 to 4 years 0.61 0.10 0.96 0.18 1.35 0.075 to 14 years 0.96 0.09 1.52 0.15 2.24 0.0715 to 17 years3 1.24 0.15 1.85 0.26 2.33 0.1418 to 19 years .. .. .. .. 2.65 0.1720 to 24 years 2.44 0.28 2.66 0.32 2.88 0.1125 to 34 years 0.66 0.08 0.92 0.09 1.43 0.0635 to 44 years 0.38 0.06 0.49 0.06 1.05 0.0545 to 54 years 0.48 0.11 0.39 0.04 1.13 0.0555 to 64 years 0.52 0.11 0.38 0.05 1.24 0.0665 years and older 0.36 0.07 0.77 0.21 1.60 0.06Males 0.70 0.04 0.92 0.06 1.62 0.020 to 4 years 0.52 0.09 0.69 0.07 1.35 0.095 to 14 years 0.99 0.15 1.59 0.21 2.25 0.1015 to 17 years3 1.12 0.24 1.45 0.31 2.37 0.2018 to 19 years .. .. .. .. 2.28 0.2120 to 24 years 2.34 0.34 2.44 0.45 2.75 0.1525 to 34 years 0.65 0.11 1.03 0.14 1.51 0.0835 to 44 years 0.38 0.06 0.46 0.06 1.10 0.0645 to 54 years 0.35 0.07 0.34 0.03 1.16 0.0755 to 64 years 0.37 0.12 0.33 0.04 1.30 0.0965 years and older 0.33 0.02 0.74 0.21 1.69 0.10Females 0.77 0.06 1.00 0.08 1.56 0.010 to 4 years 0.69 0.18 1.25 0.36 1.35 0.105 to 14 years 0.92 0.14 1.44 0.21 2.23 0.1015 to 17 years3 1.36 0.29 2.27 0.43 2.28 0.1918 to 19 years .. .. .. .. 3.04 0.2820 to 24 years 2.55 0.46 2.89 0.46 3.01 0.1725 to 34 years 0.66 0.11 0.81 0.12 1.35 0.0835 to 44 years 0.37 0.10 0.53 0.11 0.99 0.0645 to 54 years 0.61 0.20 0.43 0.07 1.11 0.0655 to 64 years 0.66 0.19 0.42 0.09 1.18 0.0765 years and older 0.38 0.11 0.80 0.33 1.53 0.08

Statistics Canada – Catalogue no. 98-303-X2016001 97
Coverage Technical Report
Table 11.1d Estimated population overcoverage rates and standard errors, sex and age groups for Canada, 1996 Census to 2016 Census1,2
Sex and age groups
2011 2016Estimated
rateStandard
errorEstimated
rateStandard
errorpercent
Both sexes 1.85 0.02 1.96 0.040 to 4 years 1.61 0.10 1.76 0.195 to 14 years 2.79 0.10 3.49 0.2015 to 17 years3 2.98 0.23 3.25 0.3518 to 19 years 3.37 0.27 3.27 0.4020 to 24 years 3.11 0.13 3.51 0.2625 to 34 years 1.69 0.08 2.19 0.1735 to 44 years 1.23 0.06 1.12 0.1145 to 54 years 1.36 0.06 1.18 0.1055 to 64 years 1.50 0.07 1.44 0.1465 years and older 1.64 0.08 1.55 0.10Males 1.86 0.04 1.95 0.070 to 4 years 1.65 0.13 1.56 0.245 to 14 years 2.77 0.14 3.50 0.2815 to 17 years3 3.04 0.27 4.14 0.5818 to 19 years 3.06 0.33 2.56 0.4420 to 24 years 3.03 0.19 3.27 0.3725 to 34 years 1.75 0.11 2.29 0.2435 to 44 years 1.26 0.09 1.21 0.1645 to 54 years 1.32 0.09 1.17 0.1355 to 64 years 1.54 0.11 1.22 0.2065 years and older 1.68 0.14 1.47 0.15Females 1.83 0.04 1.98 0.070 to 4 years 1.57 0.15 1.96 0.315 to 14 years 2.81 0.15 3.49 0.2915 to 17 years3 2.93 0.38 2.32 0.3818 to 19 years 3.69 0.43 4.02 0.6820 to 24 years 3.19 0.18 3.77 0.3825 to 34 years 1.63 0.11 2.08 0.2335 to 44 years 1.20 0.10 1.04 0.1645 to 54 years 1.39 0.09 1.19 0.1455 to 64 years 1.46 0.10 1.66 0.2065 years and older 1.60 0.10 1.63 0.14.. not available for a specific reference period1. Estimates by sex and age group not available for the 1991 Census.2. Excludes incompletely enumerated Indian reserves. 3. Data for 1996 and 2001 are for persons aged 15 to 19.Sources: Statistics Canada, 1996 to 2016 census coverage studies.

98 Statistics Canada – Catalogue no. 98-303-X2016001
Coverage Technical Report
The following can be observed from these tables:
Overcoverage is consistently higher for British Columbia than for the other provinces. British Columbia has been the province with the highest rate of population overcoverage for the past five censuses. Of the three territories, Yukon had the highest overcoverage rate for the second consecutive census, whereas the Northwest Territories had the highest rate from 1996 to 2006. Overcoverage was up in the majority of provinces and territories in 2016, but the increases were generally less pronounced than in 2011. The Northwest Territories and Manitoba had the lowest rates, at 1.25% and 1.51%, respectively. They also had two of the three lowest rates in 2011.
Overcoverage was more common for school-aged children and young adults. In addition, the 5 to 17 and 18 to 24 age groups had higher overcoverage rates. For school-aged children, this situation was largely due to the fact that children whose parents do not live together are often enumerated by both parents. Overcoverage for young adults is probably attributable to the same less stable living arrangements that can also lead to undercoverage. Nationally, overcoverage rates were above 3% for young adults (18 to 24) and for youth aged 5 to 17. The 5 to 14 age group saw the largest increase in overcoverage relative to 2011.
11.2 Changes in the design of population coverage studies
Because of differences in the design of the coverage studies over time, the rates in Table 11.1a, Table 11.1b, Table 11.1c and Table 11.1d are not strictly comparable. A list of the methodological changes made since 1976 is provided below. It is worth noting that the fundamentals of the RRC approach to measuring undercoverage have not changed much since the 1966 Census. A sample is selected from frames that cover the target population independent of the census. Census records are then checked (Reverse Record Check) to determine whether the sampled persons were actually enumerated. More changes were made to the overcoverage measurement. Multiple studies were carried out in 1991, 1996 and 2001. In 1996, the RRC scope was expanded to include overcoverage. In 2006, the RRC was no longer used to estimate overcoverage, and a new study was introduced to measure all overcoverage cases based on probabilistic and exact matches using name, date of birth and sex.
2016 Census coverage studies:
a. For the RRC census frame, the stratification was based on the province of residence, which was updated using tax data. Also, a deceased stratum was determined prior to sample selection. These improvements made for a more efficient sample.
b. An “administrative” household was created using tax data for each selected person from the RRC to make processing and tracing more efficient.
c. The RRC non-response adjustment for untraced persons no longer uses the subsample. The adjustment is made within response homogeneity groups composed of persons with similar probabilities of being in the target population and responding to the survey, as estimated with available data for both respondents and non-respondents. Since the non-response adjustment model was finalized after collection, the subsample that was used for the adjustment for untraced persons in previous RRCs was still sent to collection, but was not used. It will not be required for the next RRCs.
d. A calibration was performed to adjust the weights from the census frame when a provincial sample contained too many or not enough enumerated or deceased persons. For the three territories, a calibration to the comparable number of enumerated persons was performed, like in previous RRCs, except it was done separately for six age–sex groups in each territory, rather than using a single overall calibration group for each of them, as had been done in the past.
e. Hierarchical deterministic waves were used to form blocks for the probabilistic linkages for steps 1 and 2 of the COS to improve frame coverage.
f. The linkage rules for steps 1 and 2 were expanded to identify as many potential overcoverage cases as possible.

Statistics Canada – Catalogue no. 98-303-X2016001 99
Coverage Technical Report
g. Although Step 3 (extension) of the COS was restricted to private household pairs in 2011, it was expanded to include the household pairs produced for each person pair created in steps 1 and 2 and for which one of the two households was in a collective dwelling.
h. Instead of being created separately for each step, the groups of records that could represent the same person were created by combining steps 1, 2 and 3 of the COS to better account for cases of multiple overcoverage.
Like every RRC since 1996, the 2016 RRC did not estimate the number of persons missed on incompletely enumerated Indian reserves and Indian settlements. For more information on this subject, see Section 12.2.
2011 Census coverage studies:
a. The 2011 RRC was very similar to the 2006 RRC. To make it more efficient, some changes were introduced, including improvements in the monster match program, more effective strategies for searching the census RDB, and the use of new birth frames.
b. For the first time, the census frame sample weighting considered the overcoverage in the census frame.c. With automated methods, it was possible to use provincial and territorial parameters instead of national
parameters to develop the COS frame.
2006 Census coverage studies:
For the RRC and the COS, the name field added to the 2006 Census RDB was used optimally in matching and searching. In addition:
a. The measurement of overcoverage was restricted to the COS. The RRC methodology was subsequently changed so that not all cases were sent for field collection. Since 2006, the RRC has had a processing step that is carried out prior to collection to determine whether collection is required. The version of the census RDB used for the census coverage studies (CCS-RDB) was searched for the sampled persons using information from the sampling frames and various update sources, such as tax data. If the search located the sampled person in the CCS-RDB, collection was not required. The only exception was a sample of persons that had been located to collect data required for the non-response adjustment.
b. The three coverage studies conducted in 2001 to measure overcoverage were replaced by the COS in 2006. The COS used a different methodology from the one used in previous overcoverage studies. Essentially, it employed a linkage technique based on surnames, given names, sex and date of birth and manual verification to measure overcoverage.
2001 Census coverage studies:
a. The institutional component of the Collective Dwelling Study (CDS) was dropped, and overcoverage estimates for this population were produced by the RRC.
b. The Dwelling Classification Study (DCS) replaced the Vacancy Check (VC), which was used in previous censuses to check the classification of dwellings that the enumerator had determined to be unoccupied. The DCS is an extension of the VC, which estimated the number of persons living in non-response dwellings.

100 Statistics Canada – Catalogue no. 98-303-X2016001
Coverage Technical Report
1996 Census coverage studies:
a. The 1996 RRC did not estimate the number of persons missed on incompletely enumerated Indian reserves.
b. The Temporary Residents Study was cancelled because of concerns about data quality, and because it was recognized that the RRC would measure this type of undercoverage appropriately.
c. First, a measure of overcoverage that was more comprehensive than the 1991 measure was produced by incorporating the Private Dwelling Study (PDS) into the RRC so that each sampled person could be identified as having been enumerated more than once. This approach resulted in an increase in the number of addresses to be processed where overcoverage could have occurred. Also, compared with 1991, the AMS was expanded substantially so that overcoverage could be determined not only for an enumeration area (EA), but also for a large region (Atlantic provinces, Quebec, Ontario, Western Canada and the territories).
1991 Census coverage studies:
a. Non-permanent residents were included in the target population for the first time.b. Following experimental studies in 1986, the measurement of population overcoverage began in 1991.
The results of three studies—the PDS, the CDS and the AMS—were combined to form a comprehensive estimate.
1986 Census coverage studies:
The rates shown in Table 11.1a and Table 11.1b for the 1986 Census differ from the results published in the User’s Guide to the Quality of 1986 Census Data: Coverage, which included revisions made after the 1986 publication, when incompletely enumerated reserves were considered missed. In the original 1986 publication, they were counted as “enumerated” since provincial data included an estimate of persons missed for Indian reserves.
1976 Census coverage studies:
Census data did not include an estimate from the VC of persons missed in dwellings incorrectly classified as unoccupied. The 1976 population undercoverage rate would have been 1.78% if it had included the results of the 1976 VC. There was no VC in the 1971 Census.
For more details on the history of coverage studies, see Dolson (2010).

Statistics Canada – Catalogue no. 98-303-X2016001 101
Coverage Technical Report
12. Special topics
12.1 Collection undercoverage
Up to this point, this report focused on undercoverage in the census population counts. This section deals with the concept of Census of Population collection undercoverage. It is useful to expand the concept of undercoverage to include persons not enumerated for any reason. Undercoverage is defined as the number of persons not included in the census counts. As discussed in Section 3.3, the census counts C are composed of two elements: C E I , where E = the number of enumerations and I = the number of persons imputed.
Undercoverage, therefore, represents only part of all persons who were not listed on a census form but should have been. It does not include persons who were not enumerated either because no census form was returned for the dwelling (non-response dwelling) or because the dwelling was erroneously classified as unoccupied (occupied dwelling misclassified as vacant) and was not covered by non-response follow-up.
Also discussed in Section 3.3, an estimate of the actual number of persons in the census target population T is given by:
ˆˆ ˆ ˆT C N C U O
If we combine these two equations, we get:
ˆ ˆˆ ˆ ˆ ˆT C N C U O E I U O
This formulation of T has three components:
E = the number of persons listed on a census form11 (enumerations)
O = an estimate of the number of excess enumerations12
ˆI U = an estimate of the number of persons who were not listed on a census form but should have been.
The last component, ˆI U , is an estimate of the number of persons missed in the census for any reason. The Census of Population collection undercoverage, (L), refers to persons not enumerated for any reason. The estimate of census collection undercoverage is given by:
ˆ ˆL I U
The corresponding estimate of the Census of Population collection undercoverage rate is:
ˆ ˆˆ 100 * 100*ˆ ˆLL I URT C N
11. It is possible that some of the persons listed on a census form may not appear in the final census database. Therefore, the term “persons listed on a census form” is used in this section to refer to persons in the final census database.
12. Most cases of overcoverage involve duplicate enumerations, where the same person appears twice in the database. However, in a small number of cases, the same person can appear more than twice. The variable O denotes the estimate of the number of excess enumerations rather than the number of persons involved in multiple enumerations.

102 Statistics Canada – Catalogue no. 98-303-X2016001
Coverage Technical Report
Census of Population net collection undercoverage can be calculated by subtracting overcoverage O from L :
ˆ ˆˆ ˆ ˆ ˆT C N E I U O E L O
Although net collection undercoverage cannot be applied to census data to adjust for coverage error, L and ˆLR
provide a broader picture of how well the census was able to enumerate the target population. In fact, they include persons not enumerated, whether or not they were taken into account in the census through imputations. Table 12.1 shows the 2016 Census of Population collection undercoverage estimates L and ˆ
LR , and the population undercoverage estimates U and ˆ
UR (also see Table 1.3). It also shows their estimated standard errors. The results are shown by province or territory and for Canada, and by age group and sex. At the national level, the 2016 Census collection enumerated 93.63% of the target population ( ˆ100 LR ), whereas the official published 2016 Census count represented 95.68% of the persons who should have been included in this figure ( ˆ100 UR ). The difference between these two rates is simply attributable to the inclusion of the imputations in ˆ
LR . The 2011 Census enumerated 93.65% of the target population, when 95.93% of the persons who should have been included in the official 2011 Census counts were included. Therefore, the 2016 Census collection enumerated the same percentage of the target population as the previous census, and there were fewer imputations than in 2011.
Table 12.1 Estimated population collection undercoverage, population undercoverage and standard errors for various characteristics, 2016 Census
Characteristics
Population collection undercoverage Population undercoverageEstimated
numberStandard
errorEstimated
rate (%)Standard error (%)
Estimated number
Standard error
Estimated rate (%)
Standard error (%)
Canada 2,294,997 41,050 6.37 0.11 1,557,061 41,050 4.32 0.11
Provinces and territoriesNewfoundland and Labrador 31,562 1,982 5.96 0.35 20,848 1,982 3.94 0.36Prince Edward Island 8,676 864 5.93 0.56 5,875 864 4.01 0.57Nova Scotia 53,714 2,965 5.71 0.30 34,872 2,965 3.70 0.30New Brunswick 47,699 2,701 6.25 0.33 32,382 2,701 4.24 0.34Quebec 359,668 18,074 4.39 0.21 211,077 18,074 2.57 0.21Ontario 895,268 31,508 6.47 0.21 640,831 31,508 4.63 0.22Manitoba 79,409 4,772 6.06 0.34 51,742 4,772 3.95 0.35Saskatchewan 84,444 4,375 7.45 0.36 56,494 4,375 4.99 0.37Alberta 283,307 13,293 6.77 0.30 188,706 13,293 4.51 0.30British Columbia 436,767 16,215 9.01 0.30 305,948 16,215 6.31 0.31Yukon 4,440 188 11.61 0.44 3,219 188 8.42 0.45Northwest Territories 5,948 255 13.30 0.49 3,500 255 7.83 0.53Nunavut 4,093 228 11.10 0.55 1,565 228 4.25 0.59
Sex and age groupBoth sexes, all ages 2,294,997 41,050 6.37 0.11 1,557,061 41,050 4.32 0.110 to 4 years 105,966 10,269 5.47 0.50 73,537 10,269 3.79 0.515 to 14 years 180,455 15,125 4.60 0.37 115,279 15,125 2.94 0.3715 to 17 years 72,117 9,823 5.99 0.77 52,294 9,823 4.35 0.7818 to 19 years 82,426 11,878 9.42 1.23 67,506 11,878 7.71 1.2520 to 24 years 275,310 15,422 11.52 0.57 230,347 15,422 9.64 0.58

Statistics Canada – Catalogue no. 98-303-X2016001 103
Coverage Technical Report
Table 12.1 Estimated population collection undercoverage, population undercoverage and standard errors for various characteristics, 2016 Census
Characteristics
Population collection undercoverage Population undercoverageEstimated
numberStandard
errorEstimated
rate (%)Standard error (%)
Estimated number
Standard error
Estimated rate (%)
Standard error (%)
25 to 34 years 528,131 22,742 10.71 0.41 424,019 22,742 8.60 0.4235 to 44 years 331,357 20,305 7.01 0.40 239,817 20,305 5.07 0.4145 to 54 years 306,879 21,216 5.93 0.39 199,652 21,216 3.86 0.3955 to 64 years 224,065 21,011 4.53 0.41 109,145 21,011 2.21 0.4265 years and older 188,291 17,172 3.20 0.28 45,465 17,172 0.77 0.29Males, all ages 1,303,844 34,853 7.30 0.18 941,799 34,853 5.27 0.180 to 4 years 58,617 7,140 5.86 0.67 42,169 7,140 4.22 0.685 to 14 years 80,292 10,944 4.02 0.53 46,881 10,944 2.35 0.5415 to 17 years 38,094 7,153 6.21 1.09 27,918 7,153 4.55 1.1118 to 19 years 40,736 8,857 9.05 1.79 33,232 8,857 7.38 1.8220 to 24 years 165,697 12,392 13.29 0.86 142,866 12,392 11.46 0.8825 to 34 years 313,678 17,559 12.57 0.62 260,481 17,559 10.44 0.6335 to 44 years 192,359 15,790 8.22 0.62 145,997 15,790 6.24 0.6345 to 54 years 186,765 16,114 7.24 0.58 133,156 16,114 5.16 0.5955 to 64 years 131,573 16,959 5.38 0.66 76,049 16,959 3.11 0.6765 years and older 96,033 11,254 3.57 0.40 33,050 11,254 1.23 0.41Females, all ages 991,153 33,151 5.46 0.17 615,262 33,151 3.39 0.180 to 4 years 47,349 8,465 5.04 0.86 31,368 8,465 3.34 0.875 to 14 years 100,163 11,173 5.21 0.55 68,398 11,173 3.56 0.5615 to 17 years 34,023 6,540 5.77 1.04 24,376 6,540 4.13 1.0618 to 19 years 41,690 8,159 9.81 1.73 34,274 8,159 8.07 1.7720 to 24 years 109,612 9,473 9.59 0.75 87,480 9,473 7.66 0.7725 to 34 years 214,454 14,560 8.81 0.55 163,539 14,560 6.71 0.5635 to 44 years 138,998 13,180 5.82 0.52 93,820 13,180 3.93 0.5345 to 54 years 120,114 14,635 4.62 0.54 66,496 14,635 2.56 0.5555 to 64 years 92,492 12,585 3.70 0.48 33,096 12,585 1.32 0.5065 years and older 92,258 13,484 2.88 0.41 12,415 13,484 0.39 0.42Sources: Statistics Canada, 2016 Census and 2016 Reverse Record Check.
12.2 Participation of Indian reserves and Indian settlements
12.2.1 Introduction
In 2016, there were 984 Indian reserves and Indian settlements, 14 of which were considered incompletely enumerated. For the 14 incompletely enumerated reserves and settlements, dwelling enumeration either was not permitted or was interrupted before it could be completed. There were no 2016 data for the incompletely enumerated Indian reserves and Indian settlements and, as a result, they were not included in any calculations. In the 2011 Census, 31 Indian reserves and Indian settlements were declared incompletely enumerated and, of these, 22 took part in the 2016 Census. In 2006, there were 22 incompletely enumerated Indian reserves and Indian settlements.
Further information can be found here: Incompletely enumerated Indian reserves and Indian settlements.

104 Statistics Canada – Catalogue no. 98-303-X2016001
Coverage Technical Report
The estimates for incompletely enumerated Indian reserves and Indian settlements were based on a model. Since no reliable source is available to verify the assumptions used in the models, these estimates must be used with caution.
12.2.2 Incompletely enumerated Indian reserves and Indian settlements
For 14 incompletely enumerated Indian reserves and settlements, the 2016 Census was not able to produce population counts, and the coverage studies could not directly estimate net population undercoverage. This was because of limited 2016 Census data. The counts and net undercoverage were estimated using approximations.
To estimate census population counts, a model-based methodology was used for these incompletely enumerated Indian reserves and settlements. For the estimation model, the linear regression was constructed using all Indian reserves that were completely enumerated in both the 2011 and the 2016 censuses. The model assumed that the 2016 Census count was a linear function of the 2011 Census count for all provinces, with separate estimates for the intercept and the regression parameters for each province. The model was evaluated for the basic regression assumptions: independence of errors, homogeneity of variances and normality of errors. For each of the 14 incompletely enumerated reserves, the input variable for the regression model was either the actual census count in 2011 or the best predicted census count from the 2011 model. The output of the model was the estimated census count in 2016 for these 14 communities. The resulting estimates should be used with caution as they are based entirely on a model whose assumptions cannot be verified. The validity of these model-based estimates depends on the extent to which the model assumptions capture the true underlying situation.
In the 2011 Census, 31 reserves, with approximately 37,000 persons, were classified as “incompletely enumerated”. Among the 14 reserves and settlements used in the model-based estimates in the 2016 Census, 4 were considered to have been completely enumerated in the 2011 Census, while the other 10 were classified as “incompletely enumerated” or “refusal”. The total population for the 14 incompletely enumerated Indian reserves and settlements for which model-based estimates were produced was estimated at 27,790—a decrease from 2011.
The estimated population counts for the 14 incompletely enumerated Indian reserves and settlements are subject to coverage errors, just like the census population counts for the rest of the country. Net undercoverage for these 14 areas was estimated by calculating the net undercoverage rate for all completely enumerated reserves in each province, and then applying that rate to the estimated census count of all the incompletely enumerated Indian reserves and settlements in the province.
The demographic estimates for incompletely enumerated Indian reserves and Indian settlements were not included in the estimates of undercoverage, collection undercoverage, overcoverage and net undercoverage presented in this report because they were based on a model, not on census coverage studies. In addition, they do not provide the same level of detail (e.g., estimates by mother tongue or marital status) as the other estimates.
The demographic estimates for incompletely enumerated Indian reserves and Indian settlements by province and territory can be found in Table 1 of the “Data quality concepts and methodology” section in the following demographic estimates publication: Annual Demographic Estimates: Canada, Provinces and Territories, 2018 (Total Population only), catalogue number 91-215-X.

Statistics Canada – Catalogue no. 98-303-X2016001 105
Coverage Technical Report
Appendix A ‒ Whom to include in the census questionnaire
The following instructions were provided on page 3 of the 2016 Census short- and long-form questionnaires to help determine who should be included in the questionnaire.
1. Whom to include in Step B
• All persons who have their main residence at this address on May 10, 2016, including newborn babies, roommates and persons who are temporarily away,
• Canadian citizens, landed immigrants (permanent residents), persons asking for refugee status (refugee claimants), persons from another country with a work or study permit and family members living here with them,
• Persons staying at this address temporarily on May 10, 2016, who have no main residence elsewhere.
2. Where to include persons with more than one residence
• Children in joint custody should be included in the home of the parent where they live most of the time. Children who spend equal time with each parent should be included in the home of the parent with whom they are staying on May 10, 2016.
• Students who return to live with their parents during the year should be included at their parents’ address, even if they live elsewhere while attending school or working at a summer job.
• Spouses or common-law partners temporarily away who stay elsewhere while working or studying should be listed at the main residence of their family, if they return periodically.
• Persons in an institution for less than six months (for example, in a home for the aged, a hospital or a prison) should be listed at their usual residence.

106 Statistics Canada – Catalogue no. 98-303-X2016001
Coverage Technical Report
Appendix B ‒ Reverse Record Check survey questionnaire
2016 Reverse Record Check, Census Quality Survey
Response by selected person

Statistics Canada – Catalogue no. 98-303-X2016001 107
Coverage Technical Report
Bibliography
Parenteau, M. 2017. “Processus de traitement de la Contre-vérification des dossiers de 2016.” Meeting of the Federal-Provincial-Territorial Committee on Demography, December 12 to 14, 2017, Statistics Canada, Ottawa, Ontario, 45 slides.
Farr, H. 2018. “The 2016 Dwelling Classification Survey.” Meeting of the Federal-Provincial-Territorial Committee on Demography, April 18 and 19, 2018, Statistics Canada, Ottawa, Ontario, report.
Fellegi, I.P. and A.B. Sunter. 1969. “A theory for record linkage.” Journal of the American Statistical Association, Vol. 64, no. 328, p. 1183–1210.
Dolson, D. 2010. “Census coverage studies in Canada: A history with emphasis on the 2011 Census.” Proceedings of the Section on Survey Research Methods, American Statistical Association.
Dolson, D. 2012. “Errors of non-observation: Dwelling non-response and coverage error in traditional censuses.” Proceedings of the Section on Survey Research Methods, American Statistical Association.