cover sheet - qut eprintseprints.qut.edu.au/4133/1/4133.pdf · explanation of the mechanism by...
TRANSCRIPT

COVER SHEET
Lowe, D and Skitmore, R.M. (2001) Human effects in construction contract price forecasting: experience and experiential learning styles. Journal of Construction Engineering and Management 127(6):pp. 485-493. Copyright 2001 American Society of Civil Engineers. Accessed from: http://eprints.qut.edu.au/archive/00004133

HUMAN EFFECTS IN CONSTRUCTION CONTRACT PRICE FORECASTING: EXPERIENCE AND EXPERIENTIAL LEARNING STYLES David J. Lowe and R. Martin Skitmore Please address all correspondence to: Prof Martin Skitmore School of Construction Management and Property Queensland University of Technology Gardens Point Brisbane Q4001 Australia Version 5 (17 March, 2001)

Word Count Typical Page (page 4) 256 Main text 23 pages x 256 = 5888 References 9 pages x 150 = 1350 Appendix 5 pages x 256 = 1280 Tables 1 page @ 1260 = 1260 ---- Total 9778 ====

HUMAN EFFECTS IN CONSTRUCTION CONTRACT PRICE FORECASTING: EXPERIENCE AND EXPERIENTIAL
LEARNING STYLES ABSTRACT This paper reports on a fully structured interview survey, using a multi-sectional questionnaire, of experienced construction contract price forecasters. The aim of the research was to investigate the relationship between the accuracy of ‘early-stage’ forecasts and experience (defined in terms of the forecasters' length of service as a forecaster and the number of forecasts prepared), learning styles and approaches-to-learning. The results show that, while the forecasters rated experience very highly, the relationships between their ability to learn from experience, measured in terms of individual learning styles and approaches-to-learning, and the quality of their forecasts were found to be very different from those anticipated. No significant correlations were found between forecasting accuracy and the experience measures used, except for the approaches-to-learning dimensions labelled 'Risk-taking', 'Insecurity' and 'Self-confidence'. The results for the 'Insecurity' and 'Self-confidence' dimensions suggest that balanced forecasters, i.e., those who were neither insecure nor overconfident, produce more consistent forecasts. Similarly, the results for the 'Risk-taking' dimension indicate that high-risk takers tend to underestimate, while those who are more conservative tend to overestimate contract prices. Keywords: Estimating, accuracy, learning styles, experience. INTRODUCTION Forecaster ‘experience’ has long been believed to have a significant effect on the accuracy of construction contract price forecasts and, therefore, in the development of the expertise that underlies professional judgement (eg. Grieg, 1981; Ogunlana, 1989; Fellows, 1996). In previous empirical studies, experience has been measured by the number of years the forecaster has been making forecasts and the number and types of projects for which forecasts have been made (Skitmore 1985; Skitmore et al., 1990, 1994). There exist, however, other necessary factors involved in the acquisition of knowledge and expertise in addition to the mere passage of time in practice (Skitmore et al., 1990). One of these concerns the way that people learn from experience - sometimes known as experiential learning style (eg. Kolb, 1976, 1984). If we were to know the most appropriate learning style, or set of learning styles, that are associated with the most accurate forecasts, forecasters might be encouraged to develop such a style, if that is possible. At least we would have an appreciation of the risks involved when forecasters of a certain learning style are at work. This paper reports on an investigation into the relationship between experiential learning and early-stage construction contract price forecasting accuracy. Subsidiary objectives were to: • To assess individual forecasting accuracy; • To replicate previous work investigating the relationships between forecasting accuracy
and measures of length of service of forecasters and the number of previous similar forecasts prepared;
• To investigate relationships between forecasting accuracy and the subscales of Kolb's revised learning style inventory and the underlying dimensions of an ‘approaches-to-learning’ questionnaire.
2
2
FORECASTING EXPERIENCE The benefits of 'experience' are allpervasive in construction industry folklore and frequently cited in standard texts for price forecasting practice (Ashworth and Skitmore, 1983). This has been confirmed by several questionnaire surveys in which experience is consistently rated highly by forecasters (eg. Grieg, 1981; Ogunlana 1989; Oteifa and Baldwin, 1991; Fellows, 1996). Questionnaires also found that forecasters prefer to use individual data and experience (Grieg, 1981; Skitmore, 1985; Fellows, 1996). Similarly, Ogunlana (1989) found that experience and expertise in price forecasting were perceived to be related to: • the ability to select relevant price/cost data; • the ability to establish price/cost relationships and design parameters; and • intuitive abilities necessary for adjusting rates acquired through familiarity with projects. Experimental work by Jupp and McMillan (1981) found systematic bias (mean errors) and consistency (standard deviations) differences between forecasters and suggested that these might be attributable to differences in the forecasters’ experience – the most experienced being the most accurate – but without any form of rigorous testing. Skitmore (1985) and Skitmore et al. (1990), in developing this approach further and on a larger scale, were able to confirm Jupp and McMillan’s findings statistically, demonstrating a clear link between forecasting accuracy and the number of previous similar forecasts made by the forecaster. Skitmore et al. (1990) also examined relationships between several attitudinal variables and measures of forecasting bias, consistency and accuracy but found the results difficult to interpret due to the lack of a suitable theoretical framework. A few ad hoc theories have been proposed. Morrison (1984), for example, has suggested that an increase in forecasting accuracy is dependent upon the means by which knowledge and experience gained on previous projects is related to future work. Brandon and Newton (1986), Brandon et al (1988) and Brandon (1990) for example, in considering the possibilities for developing an expert system for price forecasting, have developed this further in linking forecasting experience to professional judgement and professional expertise, the ‘expert’ being said to use imagination, knowledge and experience to 'fill in the gaps' within incomplete project information. Neither of these theories however offers any explanation of the mechanism by which expertise is acquired. Skitmore and Lowe (1995) have recently suggested that forecasting experience is acquired over time by learning from colleagues and through the rectification of errors of judgement made on past projects. Practitioners however rarely do this in a formal way (Flanagan, and Norman, 1983) and many commentators (eg. Ogunlana 1989, 1991) believe that forecasters generally underutilise whatever feedback is available. In other words, they do not learn sufficiently from their experiences – a view that is clearly inconsistent with the ‘importance-of-experience’ assertion. If ‘experience’ is so strongly believed to be an important factor in determining forecasting accuracy, why is learning from experience taken so lightly (at least in a formal sense)? For practical progress to be made, Lowe and Skitmore (1995) recommend investigating the crucial question of how what is learned from experience may be acquired in an efficient and

3
3
effective way. Research to date indicates that specific experience, such as experience in forecasting the contract prices of projects of a similar type and size, is important. However, the lack of any coherent theoretical framework makes such naive empirical approaches increasingly questionable. The theory of experiential learning offers a solution to this problem as, in treating learning as a continuous cycle of development, it coincides with the view that the acquisition of expertise is an ongoing process, involving long and consistent practice. This is described in the next section. EXPERIENTIAL LEARNING Experiential learning refers to a spectrum of meanings, practices and ideologies (Warner Weil and McGill, 1989); is rooted in doing and experience (Hutton, 1989); and takes place when changes in judgements, feelings, knowledge, or skills result from an individual living through an event or events (Chickering, 1976). It is considered to be synonymous with meaningful discovery (Boydell, 1976), while Kolb (1984) defines it as "the process whereby knowledge is created through the transformation of experience" and occurs " through the active extension and grounding of ideas and experience in the external world and through internal reflection about the attributes of these experiences and ideas." Kolb's experiential learning model comprises the cycle of concrete experience, observation and reflection, formation of abstract concepts and generalisations and testing implications of concepts in new situations (Kolb, 1976). Learning styles and approaches to learning Rogers (1986) maintains that all adults are engaged in a continuous process of lifelong learning and have developed individual strategies and patterns of learning. Smith (1982) believes that these strategies and patterns "... enable us to deal successfully with the myriad stimuli that come our way. They permit us to conceptually organise our environment, they help pattern our behaviour, and they constitute a major component of learning style." Further, individual learning styles affect how people learn, make decisions, solve problems, and their lifestyle in general (Wolfe and Kolb, 1984). Kolb et al. (1979) postulate four learning orientations that relate to the four stages of Kolb's (1976) experiential learning model. Concrete Experience - an experience-based, involved approach to learning; Reflective Observation - an observation-based, impartial approach to learning; Abstract Conceptualisation - a conceptually-based, analytical approach to learning; and Active Experimentation - an action-based, active approach to learning. Similarly, Honey and Mumford (1986) define four similar learning styles: activists, reflectors, theorists and pragmatists. There is some disagreement over the exact nature of learning styles. Kolb (1981) suggests that preferred learning styles are not fixed traits but preferences that may vary from time to time and situation to situation. Freedman and Stumpf (1980, 1981), Pask (1988) and Ruble and Stout (1991) argue, however, that they should be considered as relatively stable personal dispositions, especially when the learning environment remains relatively stable over time Entwistle et al. (1979), Ramsden (1988) and Biggs (1988) draw a distinction between style and strategy or approach: A learning style is a broader characterisation of an individual's preferred way of tackling learning tasks generally (Entwistle et al., 1979); a stable way of

4
4
approaching tasks, that is, an individual characteristics (Biggs, 1988) that partly controls and organises more-fluid cognitive strategies (Ramsden, 1988). Whereas, a learning strategy or approach is a description of the way an individual chooses to tackle a specific learning task (Entwistle et al., 1979; Biggs, 1988) in the light of its perceived demands (Entwistle et al., 1979) and are amenable to change through intervention (Ramsden, 1988). "The capacity for learning arises out of the range and flexibility of strategies and tactics which we can bring to the process of learning" (Harri-Augstein and Thomas, 1991). Most people, however, are not consciously aware of how or why they learn (Wankowski, 1991). There are a variety of theories expounded on the influence of learning strategies or approaches. Pask (1976) distinguishes between 'Serialist or 'Holistic' approaches to learning. The serialist approach is to string a sequence of cognitive structures together, while the holist in contrast, remembers and recalls material as a whole. Alternatively, Kagan discovered an impulsivity-reflectivity dimension to individual learning (Lovell, 1980). Measurement of learning styles Several learning style diagnostic instruments have been devised. The three most commonly used instruments are: Kolb's (1976) Learning Style Inventory a self-report, forced choice ipsative questionnaire, created to measure the individual learning styles derived from experiential learning theory. Many studies, however, have reported low alpha coefficients (Merritt and Marshall, 1984; Sims, et al., 1986; Wilson, 1986; Ruble and Stout, 1991) and poor test-retest reliabilities (Freedman and Stumpf, 1978 & 1980; Wilson, 1986; Atkinson, 1991). Honey and Mumford's (1986) Learning Styles Questionnaire requires respondents to either agree or disagree with 80 statements or in its shortened form 40 statements (Honey and Mumford, 1989b). Factor analysis, however, found no support the four hypothesised dimensions (Allinson and Hayes, 1988), while Fung et al. (1993) report low alpha coefficients for the shortened form and their factor analysis of the forty items did not reveal any coherent factor structure. Kolb's (1985) Learning Style Inventory is a self-descriptive instrument, forced choice ipsative questionnaire containing twelve sets of four sentence endings, which the respondents have to rank-order in a way that best describes their learning style. Like the original it is designed to measure the degree to which individuals display the learning styles derived from experiential learning theory (Smith and Kolb, 1986). Studies report substantially improved internal consistency (Smith and Kolb, 1986; Sims et al. 1986 and Veres et al. 1987) and improved test-retest reliabilities (Sims et al. 1986) compared to its predecessor. Despite these improvements, a randomised version of the instrument is suggested (Ruble and Stout, 1991; Sims et al. 1986 and Veres et al. 1987), which may overcome some of the problems of a columnar response set. Also, Cornwell et al. (1991) and Geiger et al. (1992) recommended the investigation of a non-ipsative version of the inventory. Geiger et al's (1993) experimentation with a normative version of the inventory indicates the same relative learning style preference as the ipsative versions. Further they, confirm the existence of four separate learning abilities as factor analysis of the normative items found strong support for the four separate learning abilities.
5
5
Measurement of learning strategies/approaches There are several instruments designed to measure learning strategies and approaches to learning. These include the Approaches to Studying Questionnaire (Entwistle and Ramsden, 1983), which is also available in a short form based on 32 items and an even shorter version, based on eighteen items. The latter measures three dimensions: an achieving orientation, a reproducing orientation and a meaning orientation. This form has been used in an extensive investigation into improving the quality of student learning (Gibbs, 1992). Honey and Mumford (1989a) have developed the Learning Diagnostic Questionnaire designed to give a 'rounded picture' of what is involved in being an effective learning opportunist. Boyatzis and Kolb (1991) have developed the Learning Skills Profile, which is a typology of skills based upon a framework of learning styles and experiential learning theory, rather than a framework of job performance or personality construct. Application of learning styles It has been suggested that those who show greatest career potential will excel at every stage of Kolb's cycle of learning. Kolb et al. (1979), Kolb (1984) and Smith and Kolb (1986) suggest that type of learning style might correlate with interest and success within certain jobs and disciplinary fields. Armstrong and McDaniel (1986) found that subjects with more reflective cognitive styles do better in problem-solving tasks. While, Allinson and Hayes (1990) found that high-flier managers score higher than their low-flier colleagues on both a Theorist/Pragmatist dimension and an Activist and negatively loaded Reflector dimension. EMPIRICAL FINDINGS A fully structured interview survey was conducted (see Appendix A for details). The results are described as follows: Experience profile Position within the company/practice: 40 of the respondents were partners or director of their organisation (47.6%), 20 were associates (23.8%), 20 were principal or senior quantity surveyors (23.8%) and 4 were quantity surveyors (4.8%). The subjects therefore predominantly held senior positions within their organisations. Experience (Length of time): The length of time the subjects had been providing general forecasting advice was a mean of 17.8 years (SD 6.9). This is comparable with the length of corporate membership of the RICS. The results (Table 1) suggest that the subjects specialised after approximately four years general forecasting experience. This is illustrated by a median difference of four years and a mean difference of 3.64 years experience respectively. Experience (Number of forecasts): Data were obtained to provide variables to test the correlation between the number of previous similar forecasts with forecasting accuracy. It also reveals information on the proportion of general forecasts to those for the forecasters’ area of specialisation. The results presented in Table 2 show a declining number of forecasts prepared outside their area of specialisation e.g. 70.6% in total, 83.8% in the last five years and 85.4% in the last year (means for areas of specialisation expressed as a percentage of the general means).

6
6
All the interviewees were of an appropriate level of experience and seniority, thus producing a homogeneous sample (Rosenthal and Rosnow, 1991) sufficiently large enough to allow statistical analysis. Individual forecasting accuracy Summary statistics for the dependent variables that measure bias, consistency and accuracy are presented in Table 3. Those for bias (RMEAN, PMEAN and LMEAN) indicate a general tendency for the subjects to overestimate the price of the projects by a mean of 30.58/m2 (RMEAN), which equates to 11.63% (PMEAN). Skitmore et al's (1990) previous results showed a tendency to underestimate the price of the projects by a mean of 20.97/m2 (RMEAN), which equates to 1.00% (PMEAN). Summary statistics for consistency (RSD, PSD and LSD) reveal slightly more consistent forecasts when compared to the Skitmore et al’s (1990). For example, the estimated population standard deviation of the percentage difference between the forecast and lowest bid value (PSD) equalled 26.85%, compared to Skitmore et al's. (1990) 27.95%. Summary statistics for accuracy (CV, RABS, PABS, LABS, RRMS, PRMS and LRMS) reveal slightly less accurate forecasts when compared to the results obtained by Skitmore et al. (1990). For example, the arithmetic mean of the modulus percentage errors (PABS) equalled 27.96% compared to the 20.82% of Skitmore et al. (1990). As with Skitmore et al. (1990) and Birnie (1993), there was a tendency for subjects to be over optimistic of their forecasting ability, their mean predicted accuracy level had been 8.89%. To examine the effects of the characteristics of the people on the accuracy of their forecasts, it was first necessary to remove any project ‘effects’ to avoid the possibility of confounded results. Despite several studies examining project effects, no general formulation has yet been found. As a result, it was necessary to make an empirical adjustment for project effects from the sample used. A two-way ANOVA of the data indicated there to be significant differences (p<0.01) in the mean forecast errors among the fifteen projects and five project types. As with the Skitmore et al (1990) study, however, with only fifteen different projects involved, there was insufficient data to do this by statistical partialling. In contrast with their study, where no adjustment was made, the data in this investigation were adjusted by deducting the mean error for each project so that the average error for each project was zero. As Levine’s test also found these adjusted data to be significantly heterogeneous (p<0.01), the errors were finally converted to z-scores by further adjusting the errors for each project by dividing by their standard deviation for that project. A further nine summary statistics (RMEAN, LMEAN, RSD, LSD, CV, RABS, LABS, RRMS and LRMS) were then recalculated based on the modified data. The four variables based on the percentage error were not included as they produced identical results to those based on the raw error. Relationship between forecasting accuracy and experience Pearson's correlation coefficients and Spearman's rank correlation coefficients were computed between the nine measures of forecasting ability and measures of experience generated from Part A of the questionnaire. No significant bias, consistency or accuracy trends were found corresponding with the number of years the subjects had been early-stage

7
7
forecasters, the number of years the subjects had specialised as early-stage forecasters, the number of years the subjects had been corporate members of the RICS, the total number of forecasts prepared or the total number of forecasts prepared for the area of specialisation. No significant trends were found between the measures of bias and either the measures of length of service as an early-stage forecaster or the number of forecasts produced by the subjects. These results support those of Skitmore et al. (1990) in that length of service as forecasters does not appear to be associated with the level of subjects’ forecasts. Concerning the number of projects undertaken by the subjects, Skitmore et al's (1990) results had suggested that greater overall job experience leads to higher forecasts, while they found no trend in bias with short term experience. This finding, however, was not supported by this investigation. No significant trends were found between the measures of consistency and either the measures of length of service as an early-stage forecaster or the number of forecasts produced by the subjects. In respect to the measures of length of service as a forecaster, the results confirm those obtained by Skitmore et al. (1990), who also found no significant relationship. Concerning the number of projects undertaken by the subjects, Skitmore et al. (1990) found that consistency clearly improved linearly with job experience, with a tendency for less variability in consistency between subjects with more medium to short term experience. The results from this investigation provide no corroborative support for such a relationship. The degree of accuracy of the subjects' forecasts was found to: improve as the number of forecasts prepared in the last twelve months (NREST1YR) increased (RABS, RRMS both significant at the 1% level, LABS, LRMS and CV all significant at the 5% level; improve as the number of forecasts prepared for their area of specialisation in the last twelve months (NRESTSP1YR) increased (RRMS significant at the 1% level, RABS, LABS, LRMS and CV all significant at the 5% level); improve as the number of forecasts prepared in the last five years (NREST5YRS) increased (RABS, RRMS and LRMS all significant at the 5% level); and improve as the number of forecasts prepared for their area of specialisation in the last five years (NRESTSP5YR) increased (RRMS significant at the 5% level). Three equal subgroups were created based on the degree of accuracy: group 1 - subjects with the highest degree of accuracy (n = 27), group 2 – subjects with a moderate degree of accuracy (n = 27) and group 3 - subjects with the lowest degree of accuracy (n = 27). Kruskal Wallis one-way analysis of variance found significant differences in the number of forecasts prepared in the last twelve months (NREST1YR) and the number of forecasts prepared for their area of specialisation in the last twelve months (NRESTSP1YR) for subgroups based upon the subjects’ forecasting accuracy. Further investigation revealed, for both measures, that the number of forecasts prepared by group 1 (subjects with the highest degree of accuracy) was significantly higher than that of group 3 (subjects with the lowest degree of accuracy), both significant at the 5% level. The results support those of Skitmore et al. (1990) in that length of service as a forecaster does not appear to be associated with the accuracy of subjects’ forecasts. Concerning the number of projects undertaken by subjects, the results of this study only partly agree with those obtained by Skitmore et al. (1990). They found accuracy to clearly improve linearly

8
8
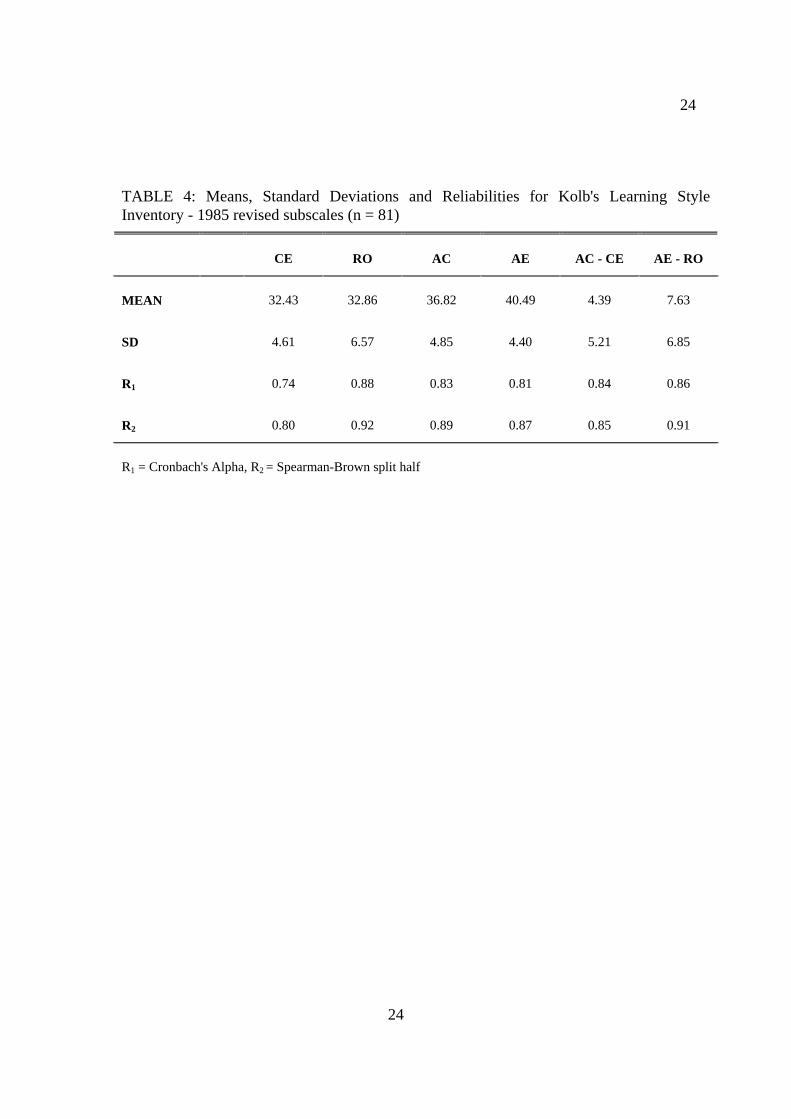
with job experience, with a tendency for less variability in accuracy between subjects with more medium and short term job experience. Accuracy was, therefore, found to improve not only with greater short term and medium term job experience, as in this investigation, but also with greater overall job experience. Relationships between forecasting accuracy and learning styles The measures of bias, consistency and accuracy were correlated with the LSI - 1985 subscales and the approaches to learning questionnaire (ALQ) factor scores. This analysis was also exploratory in nature and is, therefore, interpreted by reference to significance levels. Also, the subscales and factor scores were tested for differences between subgroups based on the level of forecasting accuracy. Individual Learning Styles The means, standard deviations and reliability coefficients for the LSI - 1985 subscales are presented in Table 4. They reveal the following order of preference: Active Experimentation (AE), Abstract Conceptualisation (AC), Reflective Observation (RO) and Concrete Experience (CE), based on the descending order of mean subscale scores. The alpha reliability estimates were similar to those obtained by Geiger et al. (1993), ranging from 0.74 to 0.88, while the split-half reliability estimates range from 0.80 to 0.92 for the four main subscales scores. This indicates that the inventory is internally consistent. No significant bias, consistency or accuracy trends with the CE, AE, AC-CE and AE-RO dimensions were found. No significant trends were found between the subjects’ learning style subscale scores and measures of bias and no significant trends were found between the subjects’ learning style subscale scores and measures of consistency except the degree of consistency of the subjects’ forecasts was found to deteriorate as the Abstract Conceptualisation subscale score increased (LSD significant at the 5% level). However, Lilliefors (Kolmogrow-Smirnov) test of normality indicated that a non-parametric test was more appropriate. The relationship was not, however, significant when Spearman's correlation coefficient was calculated. The degree of accuracy was found to: deteriorate as the subscale score for Reflective Observation increased (RABS, LABS, RRMS and LRMS all significant at the 1% level) and deteriorate as the Abstract Conceptualisation subscale score increased (LABS and LRMS both significant at the 5% level). Also, the investigation found no significant differences in the learning style subscales scores for subgroups based upon the subjects’ forecasting accuracy. These results indicate a homogeneous group in terms of learning styles. Approaches to Learning Initially, principal components extraction with varimax rotation was used to determine the underlying dimensions of the 24 items of the ALQ. The number of factors extracted dictated by Kaiser's criterion. This produced an eight-factor solution that did not meet the criteria of a simple structure as many variables were complex. A scree plot indicated that the true number of factors lay between five and seven factors. Seven, six and five factor solutions were carried out, and after inspecting the factor loadings matrices the six-factor solution was

9
9
computed. The initial eigenvalues ranged from 4.91 for factor one to 1.28 for factor six and the solution accounted for 56.8% of the variance. The final solution was generated using principal factor extraction with an oblique (Oblimin) rotation. The six-factor solution accounts for 43.7% of the total variance in the ALQ. The internal consistencies of the six factors were measured by the squared multiple correlations. At 0.84 for factor one, 0.78 for factor two, 0.83 for factor three, 0.68 for factor four, 0.77 for factor five and 0.77 for factor six they were internally consistent. Variables were ordered and grouped by size and interpretive labels suggested. Factor one 'Risk-taking' is associated with the ability to take risks, see connections, adjust quickly, and convert ideas into action and openness. Factor two 'Self-management' is associated with the ability to assess ones own development needs, analyse, and formulate action plans and review performance. Factor three 'Proactivity' or proactive experiential learner is associated with making a conscious effort to learn from experience, question things or investigate new concepts. Factor four 'Insecurity' is associated with the ability to analyse the success of others, share experiences, adjusting quickly but not converting criticism into constructive suggestions for improvement. Factor five 'Passivity' or passive experiential learner is associated with making a conscious effort to learn from experience, listening and adjusting quickly, but not questioning things. Finally, factor six 'Self-confidence' is associated with recognising and adjusting to errors, accepting help or asking questioning. Six factor scores were generated using the regression method. The correlation matrix for the ALQ factor scores and the nine measures of forecasting ability revealed no significant bias, consistency or accuracy trends with the Approach C: Proactivity and Approach E: Passivity factor scores. The level of the subjects’ forecasts was found to decrease as the factor score for Approach A (Risk-taking) increased (RMEAN and LMEAM both significant at the 5% level). The degree of consistency of the subjects’ forecasts was found to deteriorate as the Approach F (Self-confidence) factor score increased (RSD and LSD both significant at the 0.1% level). Further, the degree of consistency of the forecasts was also found to deteriorate as the Approach D (Insecurity) factor score increased (RSD and LSD both significant at the 1% level). No significant trends were found between the subjects’ ALQ factor scores (Approaches A, C, D, E and F) and measures of accuracy. However, the degree of accuracy of the forecasts was found to deteriorate as Approach B (Self-management) factor score increased (LABS significant at the 5% level). Analysis of variance found no significant differences in the ALQ factor scores for subgroups based upon the subjects’ forecasting accuracy except Approach F (Self-confidence). For Approach F the mean score of subjects with the highest degree of accuracy (group 1) was significantly lower than that of subjects with a moderate degree of accuracy (group 2), significant at the 5% level.

10
10
The findings above indicate that, while there appears to be little or no relationship between approaches-to-learning and measures of bias and accuracy in the subjects’ forecasts, with the exception of Risk-taking and possibly Self-management, there does appear to be an association between approaches to learning and measures of consistency. The consistency of the early-stage forecast deteriorates as the subjects’ preference for the Self-confidence and Insecurity approaches increase. DISCUSSION The proliferation of measures of forecasting performance over complicates what should be a straightforward study of forecasting accuracy. All of these measures have been used in past research, or occur in the literature, and hence their appearance in this research. It should be noted though that the group of 'accuracy' measures (CV, RABS, LABS, RMS, and LRMS) is all a mixture of bias and consistency. It is therefore impossible when using these measures to determine whether the cause of the error is due mainly to bias or consistency effects. Increases in the coefficient of variation for example may be due to increasing biased forecasts or increasing inconsistent forecasts. It would seem to be more appropriate therefore to refer solely to bias and consistency measures, as these contain more information as well as entirely subsuming the ‘accuracy’ measures. Of the remaining triples of bias and consistency measures (RMEAN-PMEAN-LMEAN and RSD-PSD-LSD), the difference is purely due to whether we wish to model the errors as differences or proportions (percentage and logs being equivalently proportional). The choice is important, as a trend that is not significant for a difference measure may be significant for a proportional measure and vice versa. An example of this is where the independent variable NRYRSRICS is significantly correlated (Pearson’s r=0.254) with LSD but not with RSD (Pearson’s r=0.166). In the absence of any theory, the choice between the two groups of measures is arbitrary. Our suggestion is that the simplest model should prevail, that is, one that does not involve transformations or significant correlations. In the above example the decision is easy, as the untransformed variable, RSD, is also the uncorrelated variable. Applying this reasoning then provides the unexpected result that there is no significant correlation or association between forecasting accuracy and experience (RMEAN and RSD are not significantly correlated with any of the ‘experience’ variables used). This is a major difference between the results of this study and Skitmore et al’s (1990) earlier study, of which this is a partial replication. There are two possible reasons for this. One is that the earlier study did not attempt to remove ‘project effects’ prior to analysing experience, so it could be that project effects were confounding the results of the earlier study. The second is that the discrepancy between the two studies is perhaps due to differences in market conditions when the data were collected. In 1987, when Skitmore et al. collected their data, there was a rising market, while in 1995, when the data for this study was obtained, the market was relatively stable. This would obviate the need for the currency of knowledge implied by the job experience variable and explain the differences between the two studies. Applying the same rationale to the learning style results also confirms the RMEAN-RSD models as being the most appropriate for both the Kolb inventory and the ‘approaches-to-learning’ questionnaire. On this basis, Kolb’s inventory provides no significant correlations, an unexpected result as Kolb (1984) has suggested the type of learning style may correlate with success within certain jobs. It has also been suggested that those who show the greatest
11
11
career potential will excel at every stage of Kolb's cycle of learning (Kolb et al. 1979). The findings above again suggest that, in terms of forecasting bias and consistency, this is not so. The ‘approaches-to-learning’ questionnaire however indicates three important factors: Insecurity and Self-confidence - that are significantly correlated by both the parametric (Pearson’s) and nonparametric (Spearman’s) tests; and Risk-taking - that is correlated by the parametric test. The results for the 'Insecurity' factor score indicate that people who are more insecure, lacking confidence or perhaps oversensitive are less consistent. Similarly, the results for the 'Self-confidence' factor score suggest that those individuals who are overconfident, again, produce less consistent forecasts. This implies that balanced forecasters who are neither too insecure nor overconfident produce more consistent forecasts. It is not difficult to offer reasons for this finding. Being overly sensitive is likely to result in overresponses in the form overcorrections of past errors or varied advised from colleagues. The notion of the balanced forecaster is also corroborated by the ‘steady’ image of the quantity surveyor in general. The results for the 'Risk-taking' factor score, indicate that high risk takers tend to underestimate, while those who are more conservative tend to overestimate contract prices. Again, the reasons for this are clear enough. In construction contract price forecasting, clients (especially commercial clients) are much more concerned about budget overruns (underestimates) than underruns (overestimates) as overruns may make turn an originally profitable project into one that is not financially sustainable. The cautious forecaster therefore tends to err, in the parlance of forecasters, ‘on the high side’. This however is still less than ideal as clients in this case tend to regret missing an opportunity to spend a little more on quality etc, especially if the forecast has forced some design change cost-cutting. Again, the archetypal ‘steady’ balanced forecasters appear to provide the best results. CONCLUSIONS The aim of the research was to investigate the relationship between early-stage forecasting accuracy and (1) the experience of the forecaster (measured in terms of length of service as a forecaster and the number of forecasts prepared) and (2) experiential learning styles (measured in terms of learning styles - a revised version of Kolb’s (1985) Learning Style Inventory - and other approaches-to-learning). Contrary to expectations, no significant correlations were found between forecasting accuracy and (1) experience and (2) experiential learning styles as measured by Kolb's inventory. It is possible, however, that the unusually stable market conditions in the construction industry at the time of the study may account for the differences between this and previous work. Contrary to the predictions in the literature, simultaneously high scores on all four learning styles did not correlate with the forecasting performance. Also, despite references within existing literature that indicated that learning style might correlate with interest and success within certain professions (Smith and Kolb, 1986) or that career success is related to excellence in every stage of the learning cycle (Kolb et al. 1979), this study produced little support for a relationship between forecasting performance, as measured in terms of bias, and any approach to or style of learning, with the exception of one approach-to-learning dimension. Also contrary to expectation, a balanced set of medium scores was found to be more appropriate than any high scores on individual learning style factors.

12
12
The approaches to learning dimensions labelled 'Risk-taking', 'Insecurity' and 'Self-confidence' were, on the other hand, found to be significant. The results for the 'Insecurity' and 'Self-confidence' dimensions suggest that balanced forecasters who were neither too insecure nor overconfident produce more consistent forecasts. The results for the 'Risk-taking' dimension indicate that high-risk takers tend to underestimate, while those who are more conservative tend to overestimate contract prices. These results will be unsurprising to construction industry personnel, who are very familiar with the ‘steady’ image of the quantity surveyors who carry out the early-stage forecasting function. What is perhaps most surprising, except to the quantity surveyors themselves, is that this image is fully vindicated by this study. REFERENCES Allinson, C.W. and Hayes, J. (1988) An Alternative to Kolb's Inventory The Journal of Management Studies, Oxford, UK, 25 (3) 269-81. Allinson, C.W. and Hayes, J. (1990) Validity of the Learning Styles Questionnaire Psychological Reports, Missoula, 67 859-66. Armstrong, P. and McDaniel, E. (1986) Relationships between learning styles and performance on problem-solving tasks Psychological Reports, Missoula, 59 1135-8. Atkinson, G. (1991) Kolb's Learning Style Inventory: A Practitioner's Perspective Measurement and Evaluation in Counseling and Development, Alexandria, VA, 23:1 149-61. Biggs, J. (1988) Approaches to Learning and to Essay Writing in Learning Strategies and Learning Styles (edited by R.R. Schmeck) Plenum Press, New York Birnie, J.W. (1993) A behavioural study using decision analysis of building cost prediction by chartered quantity surveyors, PhD thesis, University of Ulster, UK. Boyatzis, R.E. and Kolb, D.A. (1991) Assessing Individuality in Learning: the learning skills profile Educational Psychology, Washington, DC, 11(3) and 4 279-95. Boydell, T. (1976) Experiential Learning, Manchester Monographs, University of Manchester, Manchester, UK,. Brandon, P.S. and Newton, S. (1986) Improving the Forecast, Chartered Quantity Surveyor, London, UK, May 24-6. Brandon, P.S. (1990) The Development of an expert system for the strategic planning of construction projects Construction Management and Economics, London, UK, 8(3) 285-300. Brandon, P.S., Basden, A., Hamilton, I.W. and Stockley, J.E. (1988) Expert Systems: Strategic Planning of Construction Projects RICS/Alvey Research on the Application of

13
13
Expert Systems to Quantity Surveying, Department of Surveying, University of Salford, Salford, UK. Chickering, A.W. (1976) Developmental Change as a Major Outcome in Experiential Learning: Rationale, Characteristics and Assessment (edited by M.T. Keaton and Associates) Jossey Bass, San Francisco, CA. Cornwell, J.M., Manfredo, P.A. and Dunlap, W.P. (1991) Factor analysis of the 1985 revision of Kolb's Learning Style Inventory Educational and Psychological Measurement, Ann Arbor, Mich, 51 455-62. Entwistle, N., Hanley, M. and Hounsell, D. (1979) Identifying distinctive approaches to studying Higher Education, Amsterdam, 8 365-80. Entwistle, N.J. and Ramsden, P. (1983) Understanding Student Learning Croom Helm, London, UK. Fellows, R. (1996) Monte Carlo simulation of construction costs using subjective data: comment. Construction Management and Economics, London, UK, 14 457-60. Flanagan, R. and Norman, G. (1983) The accuracy and monitoring of quantity surveyors’ price forecasting for building work. Construction Management and Economics, London, UK, 1 157-80. Freedman, R.D. and Stumpf, S.A. (1978) What Can One Learn from the Learning Style Inventory? Academy of Management Review, Mississippi State, Miss, 21(2) 275-82. Freedman, R.D. and Stumpf, S.A. (1980) Learning Style Theory: Less than Meets the Eye Academy of Management Review, Mississippi State, Miss, 5(3) 445-7. Freedman, R.D. and Stumpf, S.A. (1981) Learning Style Inventory: Still Less than Meets the Eye Academy of Management Review, Mississippi State, Miss, 6(2) 297-9. Fung, Y.H., Ho, A.S.P. and Kwan, K.P. (1993) Reliability and validity of the Learning Styles Questionnaire British Journal of Educational Technology, London, UK, 24(1) 12-21. Geiger, M.A., Boyle, E.J. and Pinto, J.K. (1992) A factor analysis of Kolb's revised Learning Style Inventory Educational and Psychological Measurement, Ann Arbor, Mich, 52 753-59. Geiger, M.A., Boyle, E.J. and Pinto, J.K. (1993) An examination of ipsative and normative versions of Kolb's revised Learning Style Inventory Educational and Psychological Measurement, Ann Arbor, Mich, 53 717-26. Gibbs, G. (1988) Learning by doing - A guide to teaching and learning methods, Further Education Unit, London, UK.

14
14
Gibbs, G. (1992) Improving the quality of student learning, Technical & Educational Services, Bristol. UK. Grieg, M.D. (1981) Construction cost advice, Is the customer satisfied? A study of construction cost forecasting and level of client satisfaction. MSc report, Department of Building, Heriot-Watt University, Edinburgh, UK. Harri-Augustein, S. and Thomas, L. (1991) Learning Conversations: The Self-organised Learning Way to Personal and Organisational Growth Routledge, London, UK. Honey, P. and Mumford, A. (1986) The Manual of Learning Styles Peter Honey, Maidenhead, UK. Honey, P. and Mumford, A. (1989a) The Manual of Learning Opportunities P. Honey and A. Mumford, Maidenhead, UK. Honey, P. and Mumford, A. (1989b) Trials and Tribulations Education Guardian, Manchester, UK, Tue 19 Dec. Hutton, M. (1989) Learning from Action: A Conceptual Framework in Making Sense of Experiential Learning (edited by S. Warner Weil and I. McGill) The Society for Research into Higher Education and Open University Press, Buckingham, UK. Jupp, B.C. and McMillan, V. (1981) The reliability of cost data, Cost Forum conference, School of Construction, South Bank University (formerly Polytechnic of the South Bank, London, UK, Jun. Kolb, D.A. (1976) The Learning Style Inventory: Technical Manual McBer & Co., Boston, Mass. Kolb, D.A. (1981) Experiential Learning Theory and The Learning Style Inventory: A Reply to Freedman and Stumpf Academy of Management, Mississippi State, Miss, 6(2) 289-96. Kolb, D.A. (1984) Experiential Learning: Experience as the Source of Learning and Development, Prentice-Hall, New Jersey. Kolb, D.A. (1985) Learning Style Inventory: Technical Manual Revised edition McBer & Co., Boston, Mass. Kolb, D.A., Rubin, K.M. and McIntyre, J.M. (1979) Organisational Psychology: An experimental Approach 3rd Ed, Prentice-Hall, New Jersey Lovell, R.B. (1980) Adult Learning Croom Helm, London, UK. Merritt, S.L. and Marshall, J.C. (1984) Reliability and construct validity of ipsative and normative forms of the Learning Style Inventory Educational and Psychological Measurement, Ann Arbor, Mich, 44 463-72.

15
15
Morrison, N. (1984) The accuracy of quantity surveyors cost estimating Construction Management and Economics, London, UK, 2(1) 57-75. Morrison, N. and Stevens, S. (1980) Construction Cost Data base 2nd annual report of research project by Department of Construction Management, University of Reading, UK. Mumford, A.C. (1980) Making Experience Pay - Management Success through effective Learning McGraw - Hill, London, UK. Ogunlana, S.O. (1989) Accuracy in Design Cost Estimating PhD thesis, Department of Civil Engineering, Loughborough University of Technology, Loughborough, UK. Ogunlana, S.O. (1991) Learning from experience in design cost estimating Construction Management and Economics, London, UK, 9(3) 133-50. Oteifa, S.A. and Baldwin, A. (1991) Estimators' tasks and computer-aided estimating systems: A survey of FCEC member companies Construction Management and Economics, London, UK, 9 543-52. Pask, G. (1976) "Styles and Strategies of Learning" British Journal of Educational Psychology, London, UK, 46 pp 128-148 Pask, G. (1988) Learning Strategies, Teaching Strategies, and Conceptual or Learning Style in Learning Strategies and Learning Styles (edited by R.R. Schmeck) Plenum Press, New York. Ramsden, P. (1988) Context and Strategy: Situational Influences on Learning in Learning Strategies and Learning Styles (edited by R.R. Schmeck) Plenum Press, New York. Richardson, J.T.E. (1990) Reliability and replicability of the Approaches to Studying Questionnaire Studies in Higher Education, Oxford, UK, 15(2) 155-68. Rogers, A. (1986) Teaching Adults Open University Press, Buckingham, UK. Rosenthal, R. and Rosnow, R.L. (1991) Essentials of Behavioural Research: Methods and Data Analysis McGraw-Hill, New York. Ruble, T.L. and Stout, D.E. (1991) Reliability, classification stability, and response-set bias of alternate forms of the Learning-Style Inventory (LSI-1985) Educational and Psychological Measurement, Ann Arbor, Mich, 51 481-89. Sims, R.R., Veres, J.G., Watson, P. and Buckner, K.E. (1986) The reliability and classification stability of the Learning Style Inventory Educational and Psychological Measurement, Ann Arbor, Mich, 46 753-60.
16
16
Skitmore, R.M. (1985) The Influence of Professional Expertise in Construction Price Forecasting, Dept of Civil Engineering, Salford University, Salford, UK. Skitmore, R.M. and Lowe, D.J. (1995) Human factors in estimating. In Project cost estimating (edited by N.J. Smith) Thomas Telford Limited, London, UK. Skitmore, R.M., Stradling, S., Tuohy, A. and Mkwezalamba, H. (1990) The Accuracy of Construction Price Forecasts, Department of Surveying, Salford University, Salford, UK. Skitmore, R.M., Stradling, S.G. and Tuohy, A.P. (1994) Human effects in early-stage construction contract price forecasting. IEEE Transactions on Engineering Management New York, NY, 42(1) 29-40. Smith, D.M. and Kolb, D.A. (1986) User's Guide for the Learning-Style Inventory, McBer and Company, Boston, Massachusetts. Smith, R.M. (1982) Learning How to Learn: Applied Theory for Adults The Open University Press, Milton Keynes, UK. Veres, J.G., Sims, R.R., and Shake, L.G. (1987) The reliability and classification stability of the Learning Style Inventory in corporate settings Educational and Psychological Measurement, Ann Arbor, Mich, 47 1127-133. Wankowski, J. (1991) Assisting the Individual Student with Study Difficulties in Helping Students to Learn: Teaching, Counselling, Research (edited by K. Raaheim, J. Wankowski and J. Radford) The Society for Research into Higher Education and Open University Press, Buckingham, UK. Warner Weil, S. and McGill, I. (1989) A Framework for Making Sense of Experiential Learning in Making Sense of Experiential Learning: Diversity in Theory and Practice (edited by S. Warner Weil and I. McGill SRHE & Open University Press, Buckingham, UK. Wilson, D.K. (1986) An investigation of the properties of Kolb's Learning Style Inventory Leadership and Organization Development Journal, Bradford, West Yorks, UK, 7(3) 3-15. Wolfe, D.M. and Kolb, D.A. (1984) Career Development, Personal Growth, and Experiential Learning in Organisational Psychology 4th Ed (edited by D.A. Kolb, I.M. Rubin and J.M. McIntyre) Prentice Hall, New Jersey.

17
17
APPENDIX A: DETAILS OF EMPIRICAL STUDY Sample The population for the investigation was experienced early-stage construction contract price forecasters (quantity surveyors) based within Greater Manchester, Central Lancashire and South Lakeland. The area of study was selected as representative of NorthWest England. It was felt that the area represented a relatively homogeneous group that would reduce the effect of locational differences on the subjects' forecasts. Ultimately, 84 practitioners from 77 practices took part. This represents 45% of the target organisations. Questionnaire The interviewees were required to complete a three-part questionnaire comprising: Part A: an experience profile, provided information concerning the position of the subjects within their organisations, a self assessment of their forecasting ability and general information relating to their forecasting specialisation and workload. Part B: was designed to reflect an approach by a prospective client for an early-stage price forecast. In what was essentially a replication of part of Skitmore et al’s (1990) study, subjects were asked to choose their specific area of specialisation from a list of the five most common building types: industrial buildings, office developments, health centres, schools or residential developments. They were then required to assess the likely price (lowest bid) of three different buildings, based on a drawing, a brief specification outline and project specific details (the building type, type of client, gross floor area, number of storeys, functional unit). The subjects were asked to state their chosen location for the project, within the NorthWest region of the UK, enabling conversion to a regional norm by using the BCIS location factor index. The forecast took the form of a price per square metre of floor area value, exclusive of external works, fees, furniture and land, and the subjects were also asked to provide an assessment of the expected accuracy of their forecast. The fifteen target projects were selected from the BCIS cost analysis files. The lowest tender received for each project was updated by means of the BCIS Tender Price Index. The question of validity was addressed when formulating this section of the questionnaire. Care was taken to ensure that the information contained within it mirrored 'real life'. A pilot study had established what information was usually available to practitioners at this stage of the design process. While it is acknowledged that the information would not be transmitted in such a tabulated format, all subjects confirmed the appropriateness of the type, amount and level of information provided. To overcome the possibility of potential inaccuracies within the BCIS location price index biasing the results, all the projects used in the investigation were from the NorthWest region. Care was taken, therefore, to exclude from the survey practitioners who had been involved in the live projects. Similarly, all but one interviewee selected a location within the NorthWest for their forecast. Most of the forecasts (64%) were given as NorthWest region, having a factor of 1.00, Greater Manchester (17%), having a factor of 1.02. Both regional factors were based on large sample sizes. Further, for 90% of the forecasts the regional factor for the chosen location fell within 1.00 to 1.02.

18
18
Part C: contained a revised randomised version of Kolb's (1985) Learning Style Inventory (LSI - 1985) and an approaches to learning at work questionnaire (ALQ). The original scoring method of Kolb's LSI - 1985 was replaced by a four-point agreement scale. The rationale for this was to remove the ipsative nature of the inventory. The choice of a four-point scale was dictated by a desire to force a choice between agreement/disagreement with each item. The ALQ required the subjects to rate the strength of their agreement to twenty-four statements on a five-point agreement scale. The statements were derived from Kolb et al's (1979) guide for analysis of personal problem solving processes; Kolb's (1984) adaptive competencies and work abilities; Mumford's (1980) skills involved in effective learning behaviour and the rational approach to learning; Honey and Mumford's (1989a) knowledge and skills items and abilities of the ideal learner; Richardson (1990) Approaches to studying questionnaire; Smith's (1982) post project analysis form and Gibbs' (1988) abilities associated with each stage of the learning cycle. Analysis Part A: descriptive statistics were calculated for each question. Part B: the forecasting data was analysed as Skitmore et al (1990) with a variety of summary statistics to represent bias, consistency, and accuracy (see below). Part C: The mean, standard deviation and internal consistency coefficients (using Cronbach's alpha and the Spearman-Brown split-half reliability test) were calculated for the subscale scores of Kolb's revised LSI - 1985 . A six ("k") factor analysis was performed for the ALQ and factor scores generated. The measures of bias, consistency and accuracy were then correlated, using Pearson's product moment and Spearman's rank correlation, with the subscale from Kolb's revised LSI - 1985 and the factor scores of the ALQ. The subscale and factor scores were then analysed for differences between subgroups based on the level of forecasting accuracy by means of one-way analysis of variance (ANOVA) and its equivalent non-parametric test. Summary statistics representing bias, consistency and accuracy Thirteen summary statistics representing bias, consistency and accuracy were generated from the subjects’ forecasts. Measures representing bias: Three measures were used to represent the relationship between the forecast and the lowest bid in terms of bias: • the raw difference between the forecast and the lowest bid (Raw Error) was calculated for
each project individually and collectively. The summary statistic used to represent this measure was the arithmetic mean (RMEAN);
• the percentage difference between the forecast and lowest bid (% Raw Error) was calculated for each project individually and collectively. The summary statistic used to represent this measure was the arithmetic mean (PMEAN); and
• the difference between the log forecast and the log lowest bid (Log Raw Error) was calculated for each project individually and collectively. The summary statistic used to represent this measure was the arithmetic mean (LMEAN).
Measures representing consistency: Three measures were used to represent the relationship between the forecast and the lowest bid in terms of consistency:

19
19
• the estimated population standard deviation of the raw difference between the forecast and the lowest bid values (RSD);
• the estimated population standard deviation of the percentage difference between the forecast and lowest bid values (PSD); and
• the estimated population standard deviation of the arithmetic mean of the log forecast and log lowest bid (LSD).
Measures representing accuracy: Seven measures were used to represent the relationship between the forecast and lowest bid in terms of accuracy: • the estimated population coefficient of variation (CV); • the raw absolute mean or the arithmetic mean of the modulus raw errors (RABS); • the percentage absolute mean or the arithmetic mean of the modulus percentage errors
(PABS); • the log absolute or the arithmetic mean of the differences of the log forecasts and the log
lowest bids (LABS); • the raw root mean square (RRMS); • the percentage root mean square or the root mean square of the percentage errors
(PRMS); and • the log root mean square or the root mean square of the differences between the log forecasts and log lowest bids (LRMS).

20
20
CAPTIONS TO TABLES TABLE 1: Modes, medians, means and standard deviations for the length of experience
(n = 84) and RICS membership (n = 73) TABLE 2: Means and standard deviations for the number of early-stage forecasts
produced in total, the last five years and last year TABLE 3: Summary of dependent variables TABLE 4: Means, Standard Deviations and Reliabilities for Kolb's Learning Style
Inventory - 1985 revised subscales (n = 81)

21
21
TABLE 1: Modes, medians, means and standard deviations for the length of experience (n = 84) and RICS membership (n = 73)
Mode
Median
Mean
SD
Kurtosis
Skewness
Generally
20
16
16.67
7.79
-0.07
0.45
Area(s) of specialism
20
12
13.03
7.20
-0.65
0.49
RICS Membership
8
16
16.69
9.02
-1.04
0.25

22
22
TABLE 2: Means and standard deviations for the number of early-stage forecasts produced in total, the last five years and last year
Total
(n = 56)
Total last 5 years
(n = 75)
Total last year
(n = 82)
Mean
SD
Mean
SD
Mean
SD
Generally
374.82
621.78
94.08
117.62
19.13
22.61
Area(s) of specialism
264.75
400.76
78.75
113.72
16.34
22.44

23
23
TABLE 3: Summary of dependent variables
Projects 1 - 3
No. of cases
Mean
Standard
Error
Standard Deviation
Kurtosis
Skewness
RMEAN
81
30.58
14.19
127.74
0.33
0.47
PMEAN
81
11.63
3.03
27.22
2.49
1.05 B
ias
LMEAN
81
0.06
0.03
0.23
-0.26
0.07
RSD
81
105.02
5.55
49.92
0.86
1.01
PSD
81
26.85
2.55
22.97
10.98
2.81
Con
sist
ency
LSD
81
0.23
0.02
0.14
1.00
1.11
CV
81
14.41
0.88
7.91
0.35
0.77
RABS
81
123.25
7.97
71.77
2.61
1.54
PABS
81
27.96
2.06
18.51
8.63
2.21
LABS
81
0.25
0.01
0.13
0.58
0.69
RRMS
81
141.40
8.70
78.28
2.39
1.52
PRMS
81
33.18
2.73
24.54
13.34
2.94
Acc
urac
y
LRMS
81
0.29
0.02
0.14
1.62
0.88
24
24
TABLE 4: Means, Standard Deviations and Reliabilities for Kolb's Learning Style Inventory - 1985 revised subscales (n = 81)
CE
RO
AC
AE
AC - CE
AE - RO
MEAN
32.43
32.86
36.82
40.49
4.39
7.63
SD
4.61
6.57
4.85
4.40
5.21
6.85
R1
0.74
0.88
0.83
0.81
0.84
0.86
R2
0.80
0.92
0.89
0.87
0.85
0.91
R1 = Cronbach's Alpha, R2 = Spearman-Brown split half