covalent functionalization of graphene oxide with proteins
TRANSCRIPT
Covalent functionalization of graphene oxide with proteins
M.Sc. thesis
University of Jyväskylä
Department of Chemistry
3.6.2021
Elsa Korhonen


i
Abstract
The literature part of the master’s thesis focuses on introducing potential functionalization
methods for the covalent attachment of proteins on graphene oxide (GO) surfaces. The
experimental part aimed at the covalent immobilization of horseradish peroxidase (HRP) on the
laser-oxidized graphene-based microchip. Based on the preliminary studies with graphene
oxide flakes, both crosslinker systems, glutaraldehyde (GA) and APTES-glutaraldehyde,
resulted in a similar outcome of the HRP immobilization. The thermogravimetric analysis and
FTIR spectroscopic results suggested the formation of covalent bonds between the components
of the GO-crosslinker-HRP systems.
The GA-based crosslinking method was chosen for the protein immobilization studies with the
graphene-based microchip. From the atomic force microscopy (AFM) images of the microchip
after the treatment with GA and HRP solutions (in PBS buffer), line-shaped structures and
elevated dots could be observed, assigned to be GA crosslinkers and HRP protein molecules,
respectively. The Raman spectra of the oxidized areas showed shifting of the D, G, and 2D
bands towards lower Raman shifts after HRP immobilization, which agree with the former
results, indicating a successful immobilization of HRP. Also, the D band areas of the oxidized
regions increased after HRP immobilization, suggesting an increased number of defects in the
graphene lattice. Based on the AFM and Raman spectroscopy results from the experiments with
the chip, the covalent attachment of HRP to the chip’s surface via GA crosslinker could not be
fully proved.

ii
Tiivistelmä
Pro gradu -tutkielman kirjallisuusosassa perehdyttiin menetelmiin, jotka voisivat soveltua
proteiinien kiinnittämiseen grafeenioksidin pintaan kovalenttisen sitoutumisen kautta.
Kokeellisessa osassa oli tavoitteena kiinnittää linkkerimolekyylien avulla
piparjuuriperoksidaasi (HRP) -entsyymimolekyylejä laserilla hapetetun grafeenin pintaan.
Alustavissa kokeissa testattiin kahta menetelmää HRP:n kiinnittämiseksi
grafeenioksidihiutaleisiin. Menetelmät erosivat käytettyjen linkkerimolekyylien suhteen.
Ensimmäisessä menetelmässä käytettiin glutaraldehydiä ja toisessa APTES:sta ja
glutaraldehydistä muodostuvaa linkkeriä. Termogravimetrinen analyysi ja FTIR-mittausten
tulokset viittasivat kovalenttisten sidosten muodostumiseen grafeenioksidin ja linkkerien sekä
linkkerien ja HRP:n välille. Glutaraldehydiin perustuva menetelmä valittiin varsinaiseen
kokeeseen, jossa käytettiin laserilla käsiteltyä grafeenipohjaista mikrosirua. Mikrosirusta
otetuista AFM-kuvista havaittiin kohonneita viivamaisia ja pistemäisiä rakenteita
funktionalisoinnin jälkeen, joiden pääteltiin olevan glutaraldehydiketjuja ja HRP-
proteiinimolekyylejä. Mikrosirun hapetetuista alueista mitatut Raman-spketrit viittasivat
muutoksiin hapetetun grafeenin elektronirakenteessa: D-, G- ja 2D-vöiden Raman-siirtymät
pienenenivät ja D-vyön pinta-ala kasvoi funktionalisoinnin jälkeen. Muutosten pääteltiin
johtuvan grafeenioksidin ja linkkerien tai HRP:n välisistä vuorovaikutuksista. Tulosten
perusteella ei kuitenkaan voitu varmistaa HRP:n kovalenttista kiinnittymistä mikrosirun
grafeenioksidipintaan glutaraldehydin välityksellä.

iii
Preface
The literature part of the master’s thesis was started in June 2020 and was completed in May
2021. The experimental part was carried out at the Nanoscience Center at the University of
Jyväskylä from August 2020 to December 2020. The topic was defined to concentrate on
covalent protein immobilization methods, which could be used for the preparation of functional
materials for biomedical applications. I would like to thank Professor Maija Nissinen for
supervising my master’s thesis and Doctoral Researcher Johanna Schirmer for supervising the
experimental work. I would also like to thank Dr Manu Lahtinen for carrying out
thermogravimetric analysis from the graphene oxide flake samples.

iv
Table of Contents
Abstract ...................................................................................................................................... i
Tiivistelmä ................................................................................................................................. ii
Preface ...................................................................................................................................... iii
Table of Contents .................................................................................................................. viv
Abbreviations ........................................................................................................................... vi
LITERATURE PART.............................................................................................................. 1
1 Introduction ........................................................................................................................... 1
2 Graphene oxide ...................................................................................................................... 3
2.1 Chemical structure ............................................................................................................ 3
2.2 Preparation methods ......................................................................................................... 6
2.3 Reactivity .......................................................................................................................... 8
2.4 Characterization methods of functionalized GO materials ............................................. 10
3 GO-protein interactions ...................................................................................................... 14
3.1 Structure of proteins ....................................................................................................... 14
3.2 Non-covalent interactions ............................................................................................... 15
3.2.1 Examples of protein immobilization ........................................................................ 17
3.3 Covalent interactions ...................................................................................................... 20
4 Covalent functionalization of GO ...................................................................................... 22
4.1 Diimide-activated amidation .......................................................................................... 22
4.2 Carboxylation and amination.......................................................................................... 24
4.3 Crosslinking .................................................................................................................... 26
4.3.1 Glutaraldehyde ......................................................................................................... 26
4.3.2 Silane crosslinkers ................................................................................................... 31
4.4 Click reactions ................................................................................................................ 33
4.4.1 Copper-catalyzed azide-alkyne cycloaddition (CuAAC) ........................................ 33
4.4.2 Double functionalization .......................................................................................... 35
4.4.3 Staudinger ligation reaction ..................................................................................... 39
4.4.4 Azide and alkyne labeling of proteins ..................................................................... 40
4.4.5 Thiol-ene click reaction ........................................................................................... 42
5 Immobilization of ECM proteins ....................................................................................... 44
5.1 Collagen .......................................................................................................................... 44
5.2 Laminin ........................................................................................................................... 46
6. Summary ............................................................................................................................. 48
EXPERIMENTAL PART ..................................................................................................... 50

v
7. Motivation ........................................................................................................................... 50
8. Materials and methods....................................................................................................... 52
8.2 Characterization of GO materials ................................................................................... 52
8.3 Preparation of PBS ......................................................................................................... 54
8.4 Preparation of HRP solution ........................................................................................... 54
8.5. Immobilization of HRP on GO flakes ........................................................................... 55
8.5.1 via glutaraldehyde .................................................................................................... 55
8.5.2 via APTES and glutaraldehyde ................................................................................ 56
8.6 Immobilization of HRP on the graphene-based microchip via glutaraldehyde .............. 58
9. Results and discussion ........................................................................................................ 59
9.1 Immobilization of HRP on GO flakes ............................................................................ 59
9.1.1 FTIR ......................................................................................................................... 63
9.1.2 Raman ...................................................................................................................... 69
9.1.3 Thermogravimetric analysis ..................................................................................... 70
9.2 Immobilization of HRP on the graphene-based microchip ............................................ 73
9.2.1 AFM ......................................................................................................................... 74
9.2.2 Raman mapping ....................................................................................................... 76
10. Conclusions ....................................................................................................................... 81
References ............................................................................................................................... 83
Appendices ................................................................................................................................ 1

vi
Abbreviations
6-(azidomethyl)-2-pyridinecarbaldehyde
atomic force microscopy
3-aminopropyltriethoxysilane
3-aminopropyltrimethoxysilane
bovine serum albumin
chymotrypsin
chemically reduced graphene oxide
copper-catalyzed azide-alkyne cycloaddition
differential scanning calorimetry
1-ethyl-3-(3-dimethyl aminopropyl) carbodiimide
extracellular matrix
expressed protein ligation
Fourier transform infrared
glutaraldehyde
graphene oxide
horseradish peroxidase
lactoperoxidase
methylene blue
meta-chloroperoxybenzoic acid
azide
N-hydroxysuccinimide
oxalate oxidase
phosphate-buffered saline
poly(3,4-ethylene dioxythiophene)
6AMPC
AFM
APTES
APTMS
BSA
ChT
CRGO
CuAAC
DSC
EDC/EDAC
ECM
EPL
FTIR
GA
GO
HRP
LPO
MB
mCPBA
N3
NHS
OxOx
PBS
PEDOT

vii
PEG
pI
RGD
TEM
TGA
polyethylene glycol
isoelectric point
peptide of arginine, glycine and aspartic acid
transmission electron microscopy
thermogravimetric analysis

1
LITERATURE PART
1 Introduction
Graphene oxide (GO) is an attractive material for biomedical applications over other carbon-
based materials, owing to its better biocompatibility and ability to interact with biological cells
and tissues. GO’s good biocompatibility is based on its small size (one atom thick layer), large
surface area, hydrophilicity, mechanical properties resembling the mechanical behavior of
biological tissues, and the ease of functionalization with molecules, such as biomolecules.
Therefore, functionalized GO materials have numerous potential applications in biomedical
fields, such as in drug delivery, biosensing, bioimaging, cancer therapy, tissue engineering, and
regenerative medicine.1,2
Biomaterials used in neural tissue engineering and regenerative medicine must mimic the
natural environment of neurons, the extracellular matrix (ECM). Neurons need specific physical
and chemical cues for their normal growth and biological functions. GO’s electrical
conductivity and oxygen-containing groups for functionalization with biological molecules
make it advantageous material for nerve regeneration and neural interfacing applications.3,4
Conductivity of GO improves neural cell-cell interactions, enhancing growth and regeneration
of nervous tissue. In addition, the structural flexibility of GO enhances its ability to interact
with cells and biomolecules, which further improves its biocompatibility.5
Although GO is a biocompatible material, it also has challenges in biomedical applications,
such as cytotoxicity, biodistribution (non-biodegradability), and inflammatory responses.
These problems can be solved by modifying GO to resemble the natural microenvironment of
neurons by functionalizing it with biomolecules, such as ECM proteins. By functionalizing GO
with ECM proteins, a three-dimensional substrate for the attachment and growth of neurons can
be achieved. Also, by attaching cell adhesive molecules on the GO surfaces, biocompatibility
towards neural cells can be enhanced.3,5 Studies related to covalent GO functionalization with
ECM proteins are scarce but utilization of other proteins, such as enzymes, have been widely
published.

2
This master’s thesis focuses on introducing covalent functionalization protocols of GO, which
could be applicable for attaching proteins (compatible with nervous tissue) on the laser-
oxidized graphene-based microchip. The literature part starts by introducing chemical
properties and preparation methods of GO, and the most common methods used for the
characterization of functionalized GO materials. Then, weak and covalent GO-protein
interactions are presented with highlighting proteins’ chemical moieties participating in those
interactions. Chapter 4 focuses on covalent protein immobilization methods on GO and their
preceding chemical modification methods. The literature part ends with examples of ECM
protein immobilization on GO. The experimental part aimed at the covalent immobilization of
horseradish peroxidase (HRP) on the laser-oxidized graphene-based microchip using
glutaraldehyde as a crosslinker. Preliminary experiments with GO flakes using two different
crosslinker systems are also reported.

3
2 Graphene oxide
GO is a graphene derivative with a honeycomb-like plane of sp2 hybridized carbons. Graphene
consists of an aromatic delocalized π-system network, making it a hydrophobic and inert
material. Pristine graphene sheets have poor dispersibility in organic solvents, and they
aggregate easily in aqueous solutions. GO is an oxidized form of graphene, with many
advantages compared with pristine graphene. Because of oxygen-containing functional groups,
GO has versatile opportunities for covalent functionalization, and it is well dispersible in water
and polar organic solvents. Homogenous dispersal of graphene derivatives in aqueous solutions
is crucial in the preparation and some applications of functional nanomaterials.6,7
2.1 Chemical structure
So far, any uncontroversial model to define the exact structure of GO has not been successfully
developed. The most significant reasons for it are the nonstoichiometric atomic composition of
GO and the lack of proper characterization methods.6 Also, the number and chemical nature of
functional groups are highly dependent on the preparation method and starting material used.8,9
It is commonly accepted that GO monolayers contain mainly OH and epoxy groups on their
basal plane and COOH groups on the edges,6 but the real structure is more complicated. Also,
attached OH groups can disrupt an otherwise flat surface morphology of GO sheets.10
Some proposed structural models for graphite oxide and GO are presented in this chapter.
Chemically graphite oxide and GO are quite similar, but their structures differ. Graphite oxide
is a stacked, multilayered structure of GO sheets, whereas GO exist as monolayers or few-
layered stacks. GO can be produced from graphite oxide through exfoliation by sonication or
intensive stirring. Especially sonication can cause damage to GO sheets leading to significant
differences in their sizes.6

4
The most cited and well-known model describing the graphite oxide structure is the Lerf-
Klinowski model (1998).10,11 The Lerf-Klinowski model classifies the structure of graphite
oxide into two different regions: non-oxidized aromatic regions of sp2 hybridized carbons and
highly oxidized regions where sp3 hybridized carbons dominate. The relative sizes of these
regions are determined by the oxidation degree of graphite oxide and the random distribution
of the regions.11 The highly oxidized regions of the graphite oxide’s basal plane contain OH
and epoxy groups, whereas the edges of GO layers have OH and COOH groups (Figure 1). Lerf
and Klinowski presented two structural models of graphite oxide, with and without COOH
groups.10,11 This model has been criticized because Lerf and Klinowski could not indicate the
presence of COOH groups by their nuclear magnetic resonance (NMR) spectroscopic studies,
probably owing to a low number of COOH groups.11,12
Figure 1. Two suggested structures of graphite oxide based on the Lerf-Klinowski model,
with and without COOH groups. Reprinted with permission from6, Copyright 1998, American
Chemical Society (top). Reprinted from5, Copyright 1998, with permission from Elsevier (bottom).
5
The Lerf-Klinowski model is based on NMR spectroscopic studies,11 whereas the earliest
structural models of graphite oxide were based on elemental analysis, chemical reactions, and
X-ray diffraction (XRD) methods.6 The first structural model of graphite oxide was presented
in 1939 by Hofmann and coworkers.13 Based on the model, graphite oxide consisted of
repeating units of 1,2-epoxides on the sp2 hybridized graphene plane. Six years later, in 1946,
Ruess14 proposed the model where graphite oxide consisted of the sp3 hybridized carbon plane
containing 1,3-epoxides and OH groups. In 1969, Scholz and Boehm15 suggested the model in
which graphite oxide contained hydroxyl and ketone groups but not epoxy groups.
Dekaný16 proposed a structural model of graphite oxide in 2006 using widely different
techniques (NMR, elemental analysis, XRD, FTIR, transmission electron microscopy (TEM),
electron spin resonance, and X-ray photoelectron spectroscopy). In Dekaný’s model, graphite
oxide consisted of two distinct regions forming a corrugated carbon network: trans-linked
cyclohexane chairs (1,3-epoxides and tertiary alcohols) and hexagon ribbons (cyclic ketones
and quinones) (Figure 2).16
Figure 2. a) Dekaný’s structural model of graphite oxide and b) its corrugated carbon
skeleton. Reprinted with permission from16, Copyright 2006, American Chemical Society.
In addition to highly oxidized and non-oxidized regions of GO layers (the Lerf-Klinowski
model), there may also be defected sites in graphene lattice. Defects can form due to harsh
reaction conditions or overoxidation because of evolving CO and CO2 gases. Erickson et al.17

6
have imaged GO structure with TEM, which was oxidized from graphite by modified Hummers’
method18. The study proved that GO contains three different structural regions: highly oxidized
areas (82 %), graphitic regions (16 %), and hole defects (2 %).17
Although structures of graphite oxide and GO have been studied extensively, new structural
models are still presented. In 2019, Filiz et al.12 proposed a GO structure based on NMR and
FTIR studies (Figure 3), which supports the Lerf-Klinowski model, and has some similarities
with Dekaný’s model. In the proposed structure, GO also contain lactone, ketone, and quinone
groups in addition to hydroxyl, carboxylic acid, and epoxy groups. Also, some defects are
included, which may form during graphite oxidation. Edges of the defects have mainly the same
functionalities as the edges of GO sheets.12
Figure 3. A proposed structure for GO monolayer by Filiz et al.12 Reprinted from12, Copyright
2019, published by MDPI, Nanomaterials; http://creativecommons.org/licenses/by/4.0/.
2.2 Preparation methods
Graphite oxide is mainly produced from natural graphite by chemical oxidation. GO
monolayers can be exfoliated from graphite oxide using sonication in organic solvents or water.
A commonly used method to produce graphite oxide from graphite is Hummers’ method
(1958)18, in which graphite is oxidized by a mixture of sodium nitrate (NaNO3), potassium

7
permanganate (KMnO4), and concentrated sulfuric acid (H2SO4). A problem in this method is
the formation of toxic gases, NO2 and N2O4, and a low yield.18 Therefore, several modifications
or improvements of Hummers’ method have been presented. Better yields or more practical
procedures have been achieved by replacing some reagents or increasing their amount. For
example, by excluding NaNO3, increasing the amount of KMnO4 and adding phosphoric acid
(H3PO4) can be prevented the formation of toxic nitrogen gases.19
Another example is Yu et al.’s20 improved Hummers’ method with NaNO3-free protocol
(Figure 4). The method reduces the amounts of the reagents (KMnO4 and H2SO4) needed in the
synthesis by using K2FeO4 instead. In the first step (I), the intercalation compound of H2SO4
molecules and graphite forms, which starts to turn into graphite oxide by K2FeO4/ KMnO4 pre-
oxidation. In a deep oxidation step (II), more KMnO4 is added, and the intercalation compound
turns entirely into oxidized graphite. In the presence of water (step III), hydrolysis and
exfoliation of graphite oxide take place, leading to separate GO monolayers. The main steps of
this protocol are similar to the original Hummers’ method except for the addition of KMnO4 in
two steps and the use of K2FeO4. Also, this method is faster and gives better yields.20
Figure 4. A scheme of the improved Hummers’ method to prepare GO monolayers,
illustrating exfoliation of monolayers from oxidized graphite. In the article, the amounts and
places of oxidants (K2FeO4 and KMnO4) are described other way round in the text than in the
scheme. Reprinted from20, Copyright 2016, published by Springer Nature;
http://creativecommons.org/licenses/by/4.0/.

8
Pumera and coworkers9 have studied the effects of reagents used in GO’s preparation for its
chemical composition. They observed that permanganate-based oxidants result in a higher
number of oxygen groups and a higher proportion of carbonyl and carboxyl groups than
chlorate-based oxidants (e.g., Staudenmaier’s and Hofmann’s methods). Also, they found out
that the strength of nitric acid (concentrated vs. > 90 %) used in the oxidation of graphite by
chlorate-based oxidant did not significantly affect the GO’s oxidation degree.9 Hence, selecting
the oxidant for graphite oxidation can affect the relative amounts of oxygen groups of the
prepared GO.
Instead of chemical oxidation, graphene can be oxidized by the laser-induced two-photon
oxidation.21,22 The method enables tuning of oxidation levels of monolayer graphene by
controlling laser pulse energies and irradiation times. Also, shapes of oxidized areas can be
tuned by a directed laser beam with low pulse energies (~ 10 µW). Oxidation starts from point-
like areas, which eventually combine into larger oxidized areas. In addition, oxidation
probability is five times higher near the already oxidized areas than in pristine graphene.21,22
Chemical composition of laser oxidized graphene resembles chemically prepared GO, but
relative numbers of hydroxyl and epoxy groups differ: 40 % of carbons are involved in C-OH
bonds and 25 % in C-O-C bonds, whereas chemically oxidized graphene usually have more
epoxy groups. Additionally, laser oxidized graphene has a more ordered structure than
chemically prepared.23
2.3 Reactivity
Due to oxygen-containing functional groups, GO is more reactive towards covalent reactions
than pristine graphene.24 Also, GO’s surface is negatively charged in water due to partial
deprotonation of OH and COOH groups, enabling electrostatic interactions with proteins.25,26
GO can be functionalized covalently via its COOH, OH, and epoxy groups. The edges of GO
are usually the most reactive regions towards covalent reactions because there are more space
and, therefore, versatile opportunities to different bond angles.27

9
COOH groups must be activated before functionalization, which can be done by carbodiimide
formation (e.g., with EDAC) or treatment with thionyl chloride (SOCl2). The activated COOH
groups can react with amines and alcohols, forming amide and ester linkages through
carbodiimide coupling or condensation reaction. GO functionalization via its OH groups can
also be done through carbodiimide coupling with a carboxyl group-containing reagent.
Additionally, OH groups can react with trialkoxysilanes and alkyltrichlorosilanes, forming
silane linkages. GO functionalization via epoxy groups is mainly done through a ring-opening
reaction using a nucleophilic reagent, usually an aromatic, aliphatic, or polymeric amine, or
some carbanion.24
GO flakes interact with each other via non-covalent interactions, mainly through π-π stacking
or H-bonding. OH and epoxy groups on the basal plane induce stacking of GO platelets through
interlayer H-bonding (Figure 5a). Also, intralayer H-bonding can occur. When GO flakes are
in a water environment, the interlayer spacing of GO flakes increases due to intercalated water
molecules via H-bonding (Figure 5b and 5c). The number of H-bonds between GO’s functional
groups and water molecules increases as water content increases, enhancing the stacking of GO
flakes. However, the high water content in the interlayer space of GO flakes eventually results
in the degradation of GO interlayer bonds, reducing the stacking of GO flakes.28
Figure 5. a) Inter- and intralayer H-bonding of functional groups of GO flakes. b) H-bonding
between water molecules in GO’s interlayer space c) and between GO and water molecules.
The blue bar, red dash line, and gray shadow represent GO basal plane, H-bonds, and a cluster
of water molecules, respectively. Reprinted with permission from28, Copyright 2018, Springer Nature.
10
2.4 Characterization methods of functionalized GO materials
Many methods are needed to confirm the success of the covalent functionalization of GO and
the presence of protein molecules on GO surfaces. Shen et al.’s29 results of bovine serum
albumin (BSA) functionalized GO nanosheets demonstrate the importance of the wide scope of
methods to analyze the covalent protein immobilization. Protein molecules were covalently
attached to GO via a diimide-activated amidation reaction, which is described in more detail in
Chapter 4.1.29
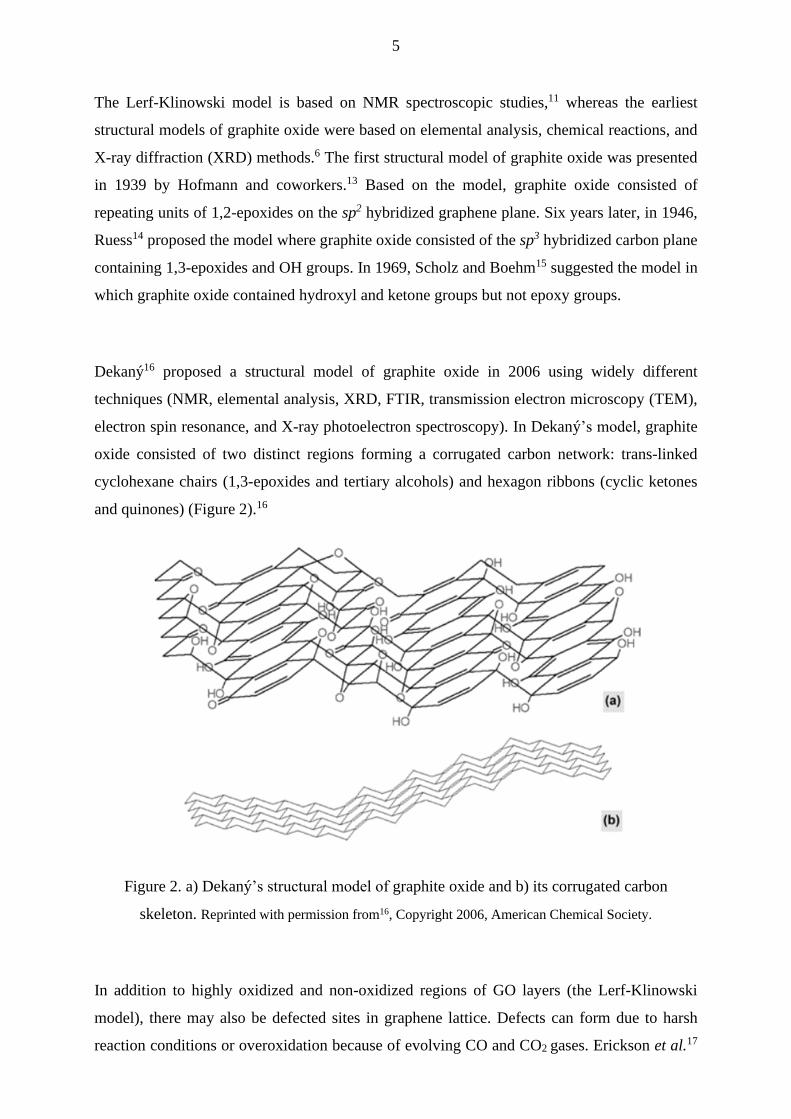
Fourier transform infrared spectroscopy (FTIR) is a useful tool to study the success of GO
covalent functionalization. The presence of possible crosslinkers or proteins attached to the GO
material can be determined by FTIR spectroscopy based on their functional groups (e.g., Si-,
COOH, and NH2 groups) and formed bonds during the functionalization (e.g., amide, ester,
ether). The characteristic IR spectrum of dried GO sheets contains peaks of O-H (~ 3450 cm-1),
C=O (~ 1650 cm-1), C-O (carboxyl group, ~ 1400 cm-1), C-O-C (~ 1250 cm-1), and C-OH (~
1100 cm-1) vibrations (Figure 6).29 After the protein immobilization (BSA), new peaks at 1690
cm- 1 (amide I; C=O, C-N), 1570 cm-1 (amide II; N-H, C-N), and 1220 cm-1 (C-N of amide
group) indicate the presence of the protein and success of the functionalization.29
Figure 6. FTIR spectra of GO sheet (bottom), free BSA (middle), and immobilized BSA on
GO (top). Reprinted with permission from29, Copyright 2010, Elsevier.

11
However, IR spectra of functionalized GO materials can be challenging to interpret due to the
overlapping peaks. Especially, IR vibrations of protein amide groups locate at the same region
as the vibration of the imine bond (C=N, commonly formed bond between aldehydes and
amines). Therefore, the separately measured reference spectra of a protein and possible
crosslinkers used may be helpful.
Thermal events of materials can be studied by thermogravimetric analysis (TGA) in controlled
conditions (temperature, heating/cooling rate, gas atmosphere, and pressure). In GO
functionalization, TGA is used to determine the structural changes of GO material after the
functionalization based on the materials’ thermal decomposition. A TG curve for GO is shown
in Figure 7. Only one main thermal event can be observed: removal of labile oxygen-containing
functional groups (mainly OH in the basal plane) around 200 ºC - 400 ºC. Also, in the range of
500 ºC - 700 ºC, more stable groups are removed. The thermal stability of GO is significantly
lower than graphite’s, but it can improve after functionalization if labile oxygen groups are
consumed during the functionalization. However, the thermal stability of BSA functionalized
GO (GOS-BSA) is lower than GO, which is probably due to the incorporation of the protein.29
Figure 7. TG curves of graphite (black), GO (red), free BSA (blue), and BSA functionalized
GO (green). Reprinted with permission from29, Copyright 2010, Elsevier.
Raman spectroscopy is commonly used to study structural defects in the graphitic lattice or
oxidation degree of GO. The most important bands in the Raman spectrum of graphene and GO

12
are D (1350 cm-1), G (1580 cm- 1), and 2D (2690 cm-1) bands. D band gives information about
defects (sp3 hybridized carbons) in the graphene lattice. In pristine graphene, the D band is
usually weak because its height is directly related to the number of the sp3 hybridized carbons.
The G band is the most intense peak in the Raman spectrum of pristine graphene, and it is
originating from the in-plane vibration of the sp2 hybridized carbons in the lattice. Based on the
shapes, positions, and a ratio (I2D/IG) of the 2D and G bands, the number of graphene layers be
concluded: For single-layer graphene, the peak shapes are sharp and symmetrical, and as the
number of layers increases, the broader and at higher wavenumber the peaks are. However, the
positions of the 2D and D bands are dependent on the laser excitation energy.30,31
Raman spectroscopy can also be used to evaluate the level of functionalization of GO when
functionalization results in the transformation of carbons’ hybridization (sp2 to sp3) and changes
in the GO’s oxidation degree. When the functionalization involves other than oxygen groups of
GO (e.g., C-C double bonds of graphitic lattice), the result can be observed by Raman
spectroscopy. The degree of disorder in graphene lattice can be concluded by calculating the
ID/IG ratio. In the low defect density, the ratio of ID/IG increases as the disorder in graphene
lattice increases. However, at higher defect density, the ratio ID/IG decreases, although the
disorder further increases.30,31 Also, an unchanged Raman spectrum after functionalization of
GO could indicate the success of the functionalization, if the functionalization does not affect
the properties of graphene lattice.
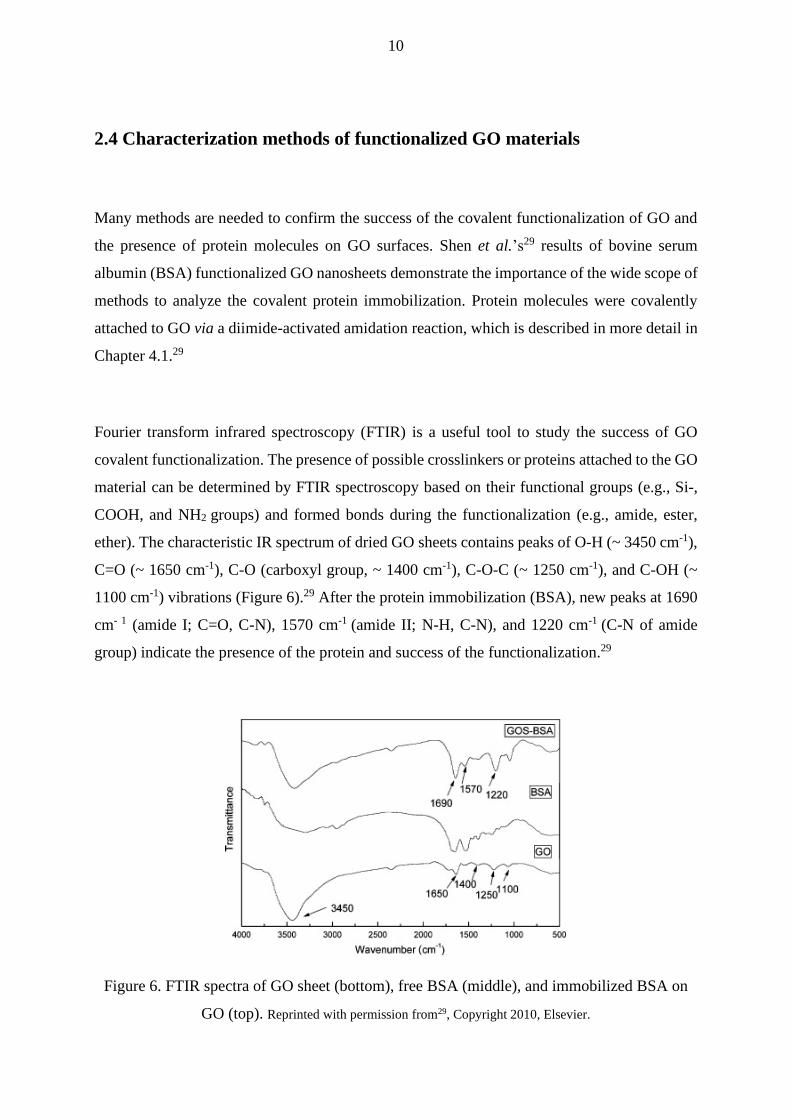
Figure 8 shows the characteristic Raman spectrum for GO. After the covalent immobilization
of BSA on GO through diimide-activated amidation, D and G bands shift about 50 cm-1 towards
lower Raman shift values. The band shifts were concluded to result from the transformation of
the structure from amorphous GO sheets to partially nanocrystalline BSA-GO material. Also,
during the functionalization, the number of sp2 hybridized carbons slightly increased, which
was confirmed by the decrease of ID/IG ratio after the functionalization (Figure 8).29
13
Figure 8. Raman spectra of pristine GO sheet (below), and immobilized BSA on GO (above).
Adapted with permission from29, Copyright 2010, Elsevier.
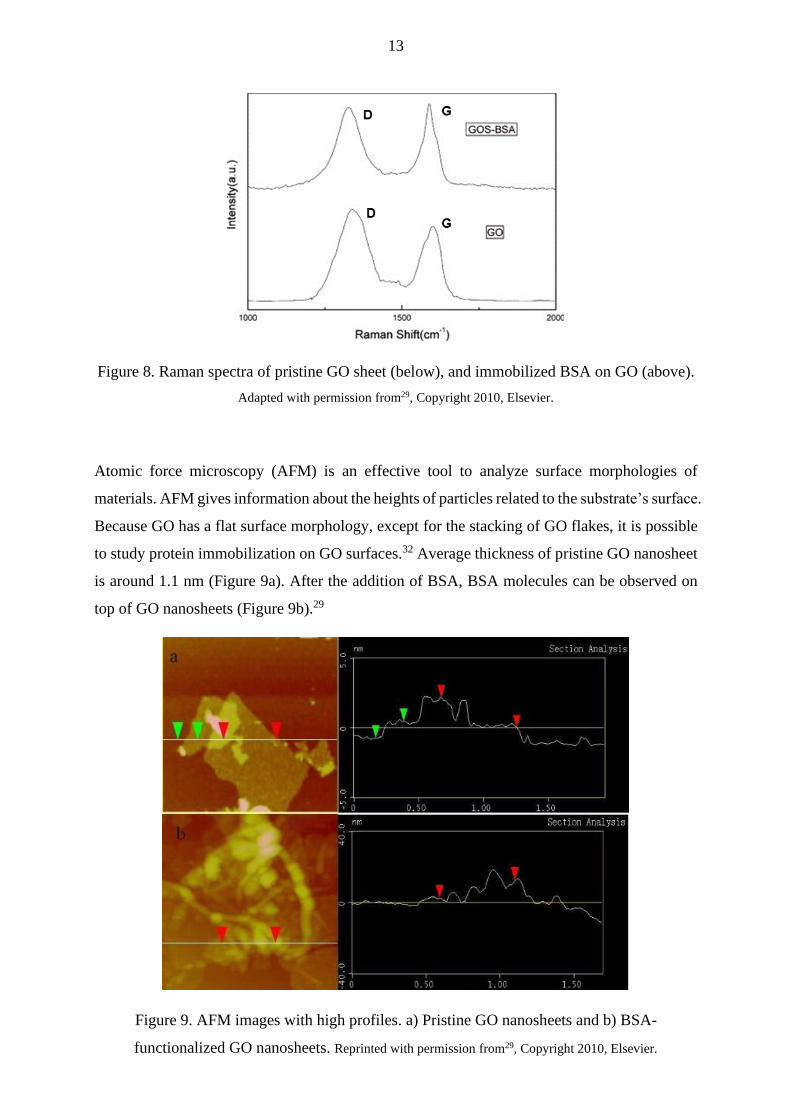
Atomic force microscopy (AFM) is an effective tool to analyze surface morphologies of
materials. AFM gives information about the heights of particles related to the substrate’s surface.
Because GO has a flat surface morphology, except for the stacking of GO flakes, it is possible
to study protein immobilization on GO surfaces.32 Average thickness of pristine GO nanosheet
is around 1.1 nm (Figure 9a). After the addition of BSA, BSA molecules can be observed on
top of GO nanosheets (Figure 9b).29
Figure 9. AFM images with high profiles. a) Pristine GO nanosheets and b) BSA-
functionalized GO nanosheets. Reprinted with permission from29, Copyright 2010, Elsevier.

14
3 GO-protein interactions
3.1 Structure of proteins
The proteins of living organisms consist of 20 amino acids, which have chemically different
side chains. Amino acids can be classified into five classes based on the chemical nature of their
side chains: non-polar aliphatic, polar, aromatic, positively charged, and negatively charged
amino acids. Amino acids are linked together via peptide bonds, forming peptide chains of
different lengths. All polypeptides have an amino terminus (N-terminus), an amino acid residue
with a free α-amino group. Similarly, polypeptides have a carboxyl terminus (C-terminus) in
their other end containing a free carboxyl group. When the molecular weight of a polypeptide
chain is above 10 kDa, it is called protein.33a
All proteins have a specific three-dimensional structure or structures, which are essential for
their function. However, structures of proteins are not static, but they can rearrange without
losing their function. A protein structure is held together mainly by weak interactions, but there
can also be some covalent disulfide bonds. In a water environment, hydrophobic interactions
are the main force stabilizing the protein structure: Hydrophobic side chains of amino acids are
directed towards the protein interior, avoiding contact with water molecules. In addition,
stabilizing hydrogen bonding and electrostatic interactions can occur.33b
Most proteins are water-soluble because of hydrophilic amino acid residues (polar or charged)
on their surfaces. However, proteins can still have some hydrophobic regions on their surfaces.
The presence of charged amino acids determines the overall charge of proteins: lysine and
arginine provide a net positive charge and aspartate and glutamate a net negative charge at
neutral pH. In addition to amino acids, proteins can also have additional chemical moieties
bound to a polypeptide chain, such as lipids, oligosaccharides, and phosphates.33a,b
Because of the exceptional structural and functional diversity of proteins, evaluating their
interactions with GO materials is problematic. However, proteins’ surface properties can be
estimated based on their size, structural stability, and chemical composition. Small and rigid

15
proteins (e.g., lysozyme, lactoglobulin) are structurally stable, whereas larger proteins (e.g.,
albumin) tend to undergo conformational changes more easily. Also, larger proteins adsorb
stronger to a surface because of the larger surface contact. A protein structure can be divided
into smaller domains based on the chemical nature of structural regions: hydrophilic or
hydrophobic, polar or non-polar, and charged or uncharged regions.34
3.2 Non-covalent interactions
GO can interact with proteins through covalent or weak interactions. Interactions involved in
non-covalent protein immobilization are highly dependent on GO’s surface morphology,
functional groups and oxidation degree, and surface chemistry of proteins. Weak interactions
participating in protein immobilization can be hydrogen bonding, electrostatic, hydrophobic,
van der Waals, and π-π interactions. Protein immobilization can retain multiple weak
interactions, or one interaction can be a driving force. Especially in hydrophobic, van der Waals,
and π-π interactions, surface area, electron density, and protein geometry have a key role in the
formation of the interactions.3,35
Electrostatic interactions can form between GO’s negatively charged oxygen functionalities
(carboxylates and hydroxylates) and positively charged protein surfaces. The charges can also
be vice versa if GO is functionalized with positively charged molecules. Because of various
oxygen-containing functional groups of GO, it can act as a hydrogen bond donor or acceptor
and form H-bonds with functional groups on proteins’ surfaces. On the other hand, hydrophobic
graphitic regions of GO enable hydrophobic and π-π interactions with proteins. For
hydrophobic interactions, the proteins must have hydrophobic amino acids on their surfaces. In
addition, π-π-stacking requires that a protein contains some π-electron systems on its surface,
such as an aromatic side chain of tryptophan residue.25,35
Amino acids, which have positively charged or aromatic side chains (Figure 10) have been
observed to adsorb onto GO via electrostatic interaction and π-π stacking interactions,
respectively.36 Order of adsorption strength was Arg > His > Lys > Trp > Tyr > Phe. Other 14

16
amino acids had minor adsorption capacity. Unlike the other six adsorbed amino acids, histidine
was observed to adsorb on GO via both electrostatic and π-π stacking interactions. The
experiments were confirmed with peptides of different amino acid sequences, showing the
importance of the above-mentioned amino acids for the adsorption. Positively charged peptides
containing some Lys and Arg residues attached to GO via electrostatic interactions, whereas
negatively charged peptides containing some aromatic His, Trp, Phe, and Tyr residues adsorbed
onto GO through π-π interactions. Additionally, negatively charged peptides containing
positive Arg residues showed some adsorption on GO, but the similar peptide without Arg
residues did not.36 The results suggest that these amino acids (Figure 10) are the central amino
acids participating in electrostatic and π-π stacking interactions in protein immobilization on
GO.
Figure 10. Amino acids with positively charged or aromatic side chains at neutral pH.
Interactions between proteins and GO can be complex because of many variables. The surface
charge of proteins is highly dependent on the pH and ion concentration of a buffer.25 Each
protein has a specific isoelectric point (pI), which is the pH in which a protein does not have
any net charge. Below protein’s pI, it has a positively charged surface, and above its pI, a
negatively charged surface. The further the pH of a solution is from the protein’s pI, the more
charges exist on the protein surface.33a Also, the density and chemical nature of oxygen-
containing groups and the size of graphitic regions of GO can vary because of different
preparation methods and storing conditions.25 Therefore, there is much variation in interactions
involved in protein immobilization on GO. GO-protein interactions are summarized in Table 1.

17
Table 1. Summary of possible weak interactions between GO and an immobilized protein
Interaction The reactive group of GO The reactive group of protein
Electrostatic Carboxylate and hydroxylate
(COO- and O-)
Positively charged amino acids
(Lys, Arg, His)
Hydrogen bonding OH, COOH and epoxy Most of the amino acids
Hydrophobic Graphitic regions (sp2
hybridized carbon network)
Hydrophobic (non-polar) and
aromatic amino acids (Trp,
Tyr, Phe, His)
π-π stacking Graphitic regions Aromatic amino acids (Trp,
Tyr, Phe, His)
3.2.1 Examples of protein immobilization
Zhang et al.37 have suggested that electrostatic interactions dominate between immobilized
protein (horseradish peroxidase, HRP) and GO. Protein immobilization was done by incubating
HRP and GO in phosphate buffer for 30 min at 4 ºC and spontaneous attachment of the protein
was confirmed by AFM. The nature of the interactions between HRP and GO was studied by
repeating the experiments with phosphate buffers of different pH levels. It was observed that at
acidic pH (< 7.2), HRP loading on GO was greater than at basic pH (> 7.2), which was
concluded to result from attractive electrostatic interactions between positively charged HRP
and negatively charged GO surface at acidic pH. It was assumed that significant electrostatic
repulsion would occur above pH 7.2 because GO sheets have a total negative charge at pH
ranges of 4 - 11, and HRP has a total negative charge above pH of 7.2. However, HRP loading
was only 30 % greater at pH 4.8 than 8.8, indicating the presence of other interactions in the
system, which were concluded to be hydrogen bonds. In addition, the biological activity of HRP
reduced after immobilization owing to possible conformational changes caused by the
immobilization.37
Zhang et al.37 also studied protein immobilization with lysozyme at pH 7, in which it has a
positively charged surface. Lysozyme has a pI of 10.3, whereas HRP has 7.2, denoting that
lysozyme has more positive charges on its surface around neutral pH than HRP. Protein loading
of lysozyme on GO was seven times greater than the HRP loading at pH 7.0, indicating that
lysozyme has more favorable surface chemistry for interaction with GO. Also, lysozyme
18
retained its biological activity as opposed to HRP. Zhang and coworkers37 concluded that the
surface charges of proteins and GO determine the interactions involved in the protein
immobilization.37
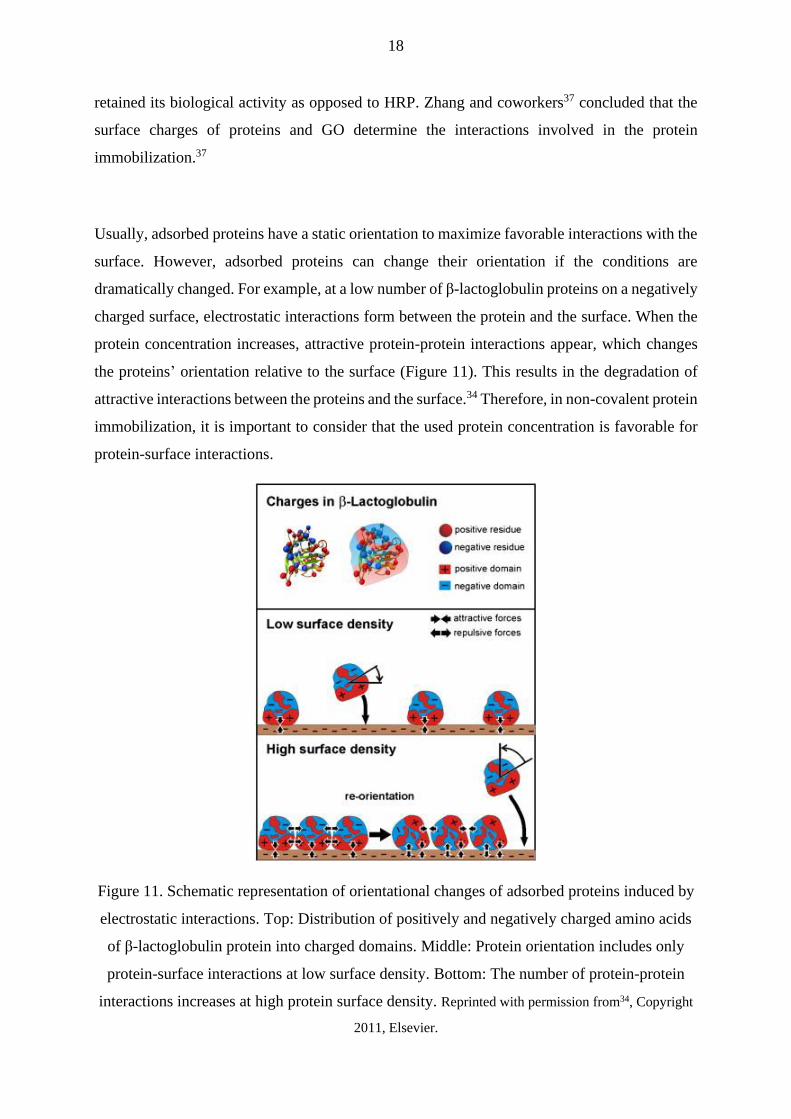
Usually, adsorbed proteins have a static orientation to maximize favorable interactions with the
surface. However, adsorbed proteins can change their orientation if the conditions are
dramatically changed. For example, at a low number of β-lactoglobulin proteins on a negatively
charged surface, electrostatic interactions form between the protein and the surface. When the
protein concentration increases, attractive protein-protein interactions appear, which changes
the proteins’ orientation relative to the surface (Figure 11). This results in the degradation of
attractive interactions between the proteins and the surface.34 Therefore, in non-covalent protein
immobilization, it is important to consider that the used protein concentration is favorable for
protein-surface interactions.
Figure 11. Schematic representation of orientational changes of adsorbed proteins induced by
electrostatic interactions. Top: Distribution of positively and negatively charged amino acids
of β-lactoglobulin protein into charged domains. Middle: Protein orientation includes only
protein-surface interactions at low surface density. Bottom: The number of protein-protein
interactions increases at high protein surface density. Reprinted with permission from34, Copyright
2011, Elsevier.
19
Strong adsorption of BSA on GO has been proved to occur mainly via hydrophobic
interactions.38 BSA (pI = 4.5) was incubated with GO in the buffer at pH 7.4. Successful BSA
immobilization was confirmed by AFM and fluorescence lifetime imaging microscopy.
Interactions between immobilized protein and GO could not be electrostatic because BSA is
negatively charged at pH 7.4. Therefore, the interactions were concluded to be hydrophobic,
which was further confirmed by fluorescence quenching experiments. Tryptophan and tyrosine
are fluorescent molecules, so hydrophobic interactions with GO can quench BSA’s
fluorescence. When the concentration of GO was increased in BSA-buffer solution, the
intensity of BSA fluorescence decreased.38
Increasing the reduction extent of GO has been suggested to reinforce the hydrophobic
interactions involved in protein immobilization.39 Chemically reduced graphene oxide (CRGO)
has fewer oxygen-containing functional groups than GO and resembles more pristine graphene.
Therefore, the importance of electrostatic interactions and H-bonding decreases because of a
lower number of hydrophilic groups. In the study, the reduction extent of GO was controlled
by the reaction time. The more GO was reduced, the higher the protein loading was. The pH of
the buffer did not affect protein loading on CRGO, indicating the absence of electrostatic
interactions.39
Proteins used in the study (HRP and oxalate oxidase (OxOx)) are water-soluble, denoting that
they have a hydrophilic surface.39 Contact angle measurements, on the other hand, confirmed
increasing hydrophobicity of GO with increasing reduction extent. These observations suggest
that conformational changes of proteins may occur during the immobilization because the
protein loading was higher on more hydrophobic CRGO than GO. In addition, the activity of
HRP reduced as the reduction extent of CRGO increased, which further confirms
conformational changes. However, decreasing activity was not observed for hydrophobic
surface-bearing OxOx.39 It is commonly accepted that water-soluble proteins can undergo
conformational changes to have the more favorable orientation of hydrophobic residues for
hydrophobic interactions with GO.25
Dichtel and coworkers40 have developed a method to immobilize a protein on GO by non-
covalent interactions without destroying its structure by hydrophobic interactions. Unmodified
GO is known to be one of the strongest inhibitors of the chymotrypsin (ChT) enzyme, which is
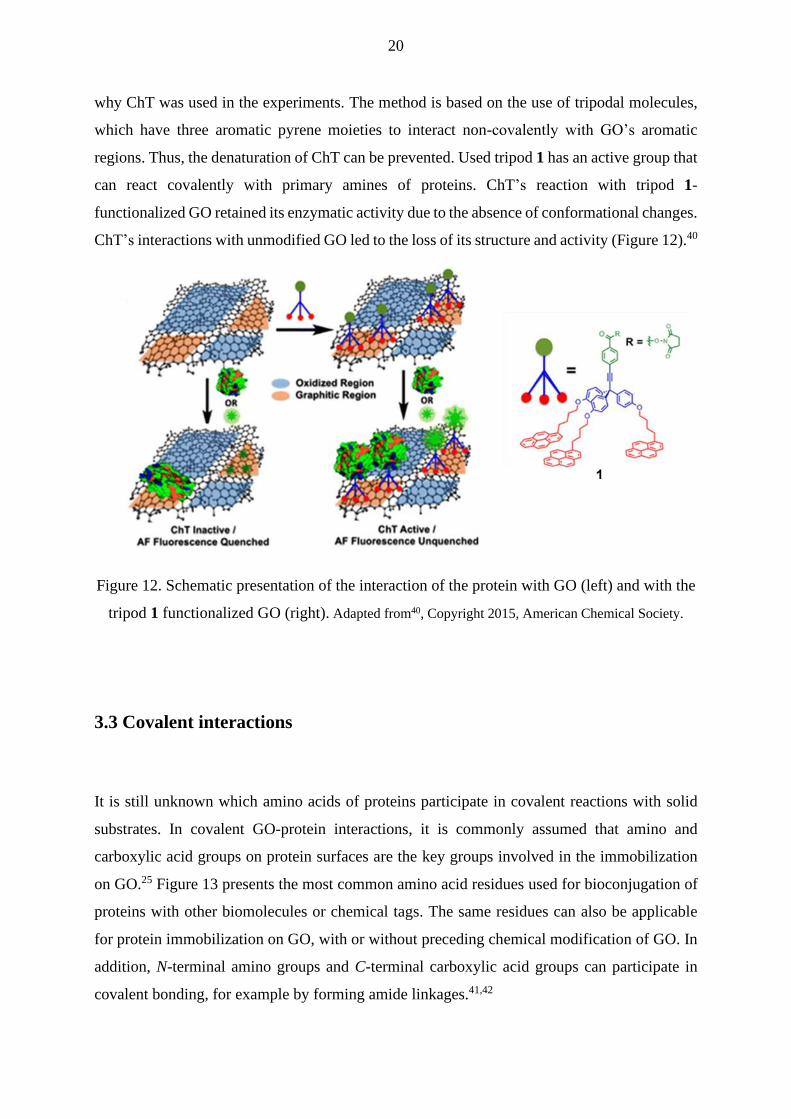
20
why ChT was used in the experiments. The method is based on the use of tripodal molecules,
which have three aromatic pyrene moieties to interact non-covalently with GO’s aromatic
regions. Thus, the denaturation of ChT can be prevented. Used tripod 1 has an active group that
can react covalently with primary amines of proteins. ChT’s reaction with tripod 1-
functionalized GO retained its enzymatic activity due to the absence of conformational changes.
ChT’s interactions with unmodified GO led to the loss of its structure and activity (Figure 12).40
Figure 12. Schematic presentation of the interaction of the protein with GO (left) and with the
tripod 1 functionalized GO (right). Adapted from40, Copyright 2015, American Chemical Society.
3.3 Covalent interactions
It is still unknown which amino acids of proteins participate in covalent reactions with solid
substrates. In covalent GO-protein interactions, it is commonly assumed that amino and
carboxylic acid groups on protein surfaces are the key groups involved in the immobilization
on GO.25 Figure 13 presents the most common amino acid residues used for bioconjugation of
proteins with other biomolecules or chemical tags. The same residues can also be applicable
for protein immobilization on GO, with or without preceding chemical modification of GO. In
addition, N-terminal amino groups and C-terminal carboxylic acid groups can participate in
covalent bonding, for example by forming amide linkages.41,42

21
Figure 13. Schematic presentation of the distribution of commonly used amino acid residues
in bioconjugation, including their average abundances and the pKa values (RNAse A
enzyme). Reprinted by permission from41, Copyright 2017, Springer Nature.
Lysine residues are the most involved in covalent reactions due to their reactive ε-amino groups
and relatively high abundance on protein surfaces. Also, α-amino groups of N-terminal amino
acid residues are usually on protein surfaces and hence involved in covalent reactions, but their
number in proteins is much lower than lysine residues. More selective covalent binding can
only be achieved by reaction only via protein’s N-terminus, especially when a protein consists
of a single polypeptide chain (one reactive α-amino group).41

22
4 Covalent functionalization of GO
Covalent and non-covalent protein immobilization can lead to the disruption of a protein
structure, which is mostly held together by non-covalent interactions, and further to protein
denaturation and loss of its biological function through conformational changes. Covalent
interactions usually enable more ordered and stable protein immobilization than weak
interactions.43 Additionally, covalent bonding enhances stability against heat, pH, solvents, and
storage.3 Although non-covalent interactions usually are weaker than covalent interactions, they
can rival some covalent bonds when they occur over a large surface.35
Protein immobilization on a solid support via weak interactions results in random protein
orientation. Although covalent protein immobilization can result in specific protein orientation
on a support, it requires that both a protein and a support have specific groups which can react
together selectively. In the case of a protein, it means that a specific chemical group is added to
a certain position of a protein so that the protein conformation and function are retained. Some
of the covalent protein immobilization protocols are based on the use of natural, unmodified
proteins, which can more often result in the loss of protein conformation after protein-GO
interactions than the use of modified proteins.44 This chapter presents both random
(crosslinking) and site-specific approaches (click reactions, Staudinger ligation) for covalent
protein immobilization on GO.
4.1 Diimide-activated amidation
Diimide-activated amidation (Figure 14) is a commonly used and relatively straightforward
method for the covalent attachment of proteins to materials. It has also been used for covalent
protein immobilization on graphitic materials such as carbon nanotubes and GO.45 The
amidation reaction occurs between activated carboxyl groups of GO and amino groups of
proteins.29 Proteins with many lysine or arginine residues on their surfaces (e.g. bovine serum
albumin) are probably favorable for the amidation due to the greater number of reactive amino

23
groups. The main disadvantage of the method is that GO may contain a low number of COOH
groups, so the functionalization will remain low.46
Figure 14. A general reaction path of diimide-activated amidation.
Protein functionalization of GO via diimide-activated amidation has three main steps (Figure
15). In the first step, COOH groups of GO are activated with N-ethyl-N'-(3-dimethyl
aminopropyl) carbodiimide (EDAC) hydrochloride forming reactive O-acylisourea
intermediate. Then, N-hydroxysuccinimide (NHS) is added forming succinimidyl intermediate
(step 2), which reacts with the amino groups of protein, forming an amide bond between
chemically modified GO and a protein (step 3).29 NHS is needed in the reaction because O-
acylisourea intermediate is very reactive in an aqueous environment, and its lifetime may not
be long enough for the reaction with a protein. Without NHS, intermolecular conjugation of
proteins rich in amino and COOH groups on their surfaces can occur.45
Figure 15. Protein immobilization on GO via diimide-activated amidation reaction. Adapted
with permission from29, Copyright 2010, Elsevier.

24
4.2 Carboxylation and amination
GO usually contains fewer COOH groups than other functionalities, and they usually locate at
the edges of GO sheets. However, more COOH groups on the basal plane of GO can be
synthesized by carboxylation of epoxy and OH groups, which enhances GO’s water solubility.
A widely used method is to treat GO with chloroacetic acid 2 under strongly basic conditions
such as sodium hydroxide-water solution (Figure 16). Chloroacetic acid 2 reacts with epoxy
groups through a ring-opening reaction forming OH and O-COOH groups. OH groups can
further react to O-COOH.47
Figure 16. General carboxylation protocol of GO with chloroacetic 2 acid and sodium
hydroxide.47
Faghihi et al.47 have studied the efficiency of the GO carboxylation method. GO carboxylation
was performed in four different chloroacetic acid concentrations (0.5, 1, 2, and 3 M) using a 4
M NaOH water solution. Quantitative amounts of COOH groups of GO and carboxylated GO
samples were estimated by methylene blue (MB) assay, as an MB molecule can interact
covalently with a COOH group. Hence, the change in MB concentration before and after the
reaction can estimate the number of COOH groups in GO. Based on the experiments, the
number of COOH groups increased significantly after carboxylation with 1 M or 2 M
chloroacetic acid.47
A large amount of COOH on the GO surface may, however, be unfavorable for covalent protein
immobilization: The GO surface can be highly negatively charged, which attracts positively
charged molecules via electrostatic interactions. Also, the folding of GO sheets can be more
probable when the number of COOH is substantial.47

25
Carboxylation of GO requires strongly basic conditions. However, strong bases, such as NaOH
with chloroacetic acid, can cause partial reduction of GO resulting in a lower number of oxygen-
containing functional groups. Bianco et al.48 have observed partial reduction of GO during
carboxylation by the same method mentioned above. C/O ratio was higher after carboxylation,
and the number of COOH groups increased, but the number of C-O bonds decreased, indicating
the removal of labile oxygen-containing groups.48
Bianco et al.48 also studied how efficient GO carboxylation is in the GO double
functionalization (Figure 17). At first, GO was functionalized with aminated PEG 3 through an
epoxide ring-opening reaction. Then, epoxy and OH groups of the amine-functionalized GO
were carboxylated, leading to a significantly lower number of amine groups than before
carboxylation. After diimide-activated amidation of COOH groups with an aminated PEG
polymer chain 3, the number of amine groups increased but was still remarkably lower than
after the first NH2-PEG functionalization. However, a more efficient NH2-PEG double
functionalization of GO was achieved without carboxylation, although the number of GO
COOH groups was lower.48
Figure 17. Double functionalization of GO via epoxide ring-opening (top) and diimide-
activated amidation after carboxylation (bottom). Reprinted from48, Copyright 2020, published by The
Royal Society of Chemistry, https://creativecommons.org/licenses/by-nc/3.0/.

26
Instead of carboxylation, GO can be aminated for further functionalization or direct reaction
with the COOH group of a protein. Epoxy groups of GO are reactive to nucleophiles and will
react through ring-opening reactions. Salvio and coworkers49 have developed a method to
synthesize amino-functionalized GO flakes. An epoxide ring-opening reaction was conducted
using sodium azide, which led to the formation of OH and azide groups. Then, azide groups
were reduced to amines using the reducing agent lithium aluminum hydride (LiAlH4). Although
the method resulted in a high degree of functionalization, its total duration only for GO
functionalization is almost one month, and the reaction can also form explosive intermediates.49
4.3 Crosslinking
4.3.1 Glutaraldehyde
Proteins can be attached to GO via chemical crosslinking, which means that a protein and GO
are connected via a crosslinker molecule. In polymer chemistry, crosslinking means covalent
linkages between the polymer chains. This idea can also be applied to the covalent protein
immobilization on GO. By using crosslinkers or spacer molecules to attach a protein to GO, its
quaternary structure and hence biological function can be retained. Crosslinkers increase the
distance between GO and protein when direct absorption via non-covalent interactions on GO
reduces.25
A widely used crosslinking agent for bioconjugation is glutaraldehyde 4 (GA; Figure 18). It has
also been used for covalent protein immobilization on GO. Advantages of using GA are good
solubility in water and organic solvents and high reactivity. However, in aqueous solutions, GA
can exist in various forms, such as monomer, dimer, or polymer chains, depending on pH and
other chemical species in the solution (Figure 18).50 Approximately 13 possible structural forms
of GA in aqueous solution complicate the prediction of its reaction outcomes. Also,
polymerization causes a problem, as it diminishes the organization of the functionalization.
However, polymerization can be avoided by using small amounts of GA relative to the quantity

27
of GO.51,52 GA polymer chains can be converted back to monomers at neutral or basic pH by
heating or sonication.50
Figure 18. Some possible structural forms of GA in the aquatic environment at different pH.50
There is still no agreement on the primary structure of GA in each pH, but many suggestions
have been presented. In some studies, commercially available GA solutions have been observed
to be mainly mixtures of GA polymers, such as forms 5-7 at neutral or alkaline pH (Figure 18).
Also, forms 8 and 9 have been suggested to exist in alkaline solutions. Only a tiny amount of
form 5 was found at acidic pH, and GA was predicted to be mainly in form 4 and its hydrated
forms 10, 12, and 13 (equilibrium between the forms). On the other hand, it has been proposed
that acidic aqueous solutions of GA could contain structures of 4, 10, and 11.50 Because of
many suggested GA structures in an aqueous solution, GA is presented as its monomer 4 in the
GO functionalization reactions for clarity.
Aldehydes react with amines forming imines and with alcohols forming hemiacetals and acetals,
depending on the stoichiometric amount of alcohol.53 Hence, in GO functionalization, GA will
react with hydroxyl groups of GO forming hemiacetal or acetal bridges (assuming that GA is
in form 4).51,52 The order of addition of GO or GA may determine how aldehyde groups of GA
react with hydroxyl groups of GO. Tan et al.51 have shown that when GA is slowly (dropwise)
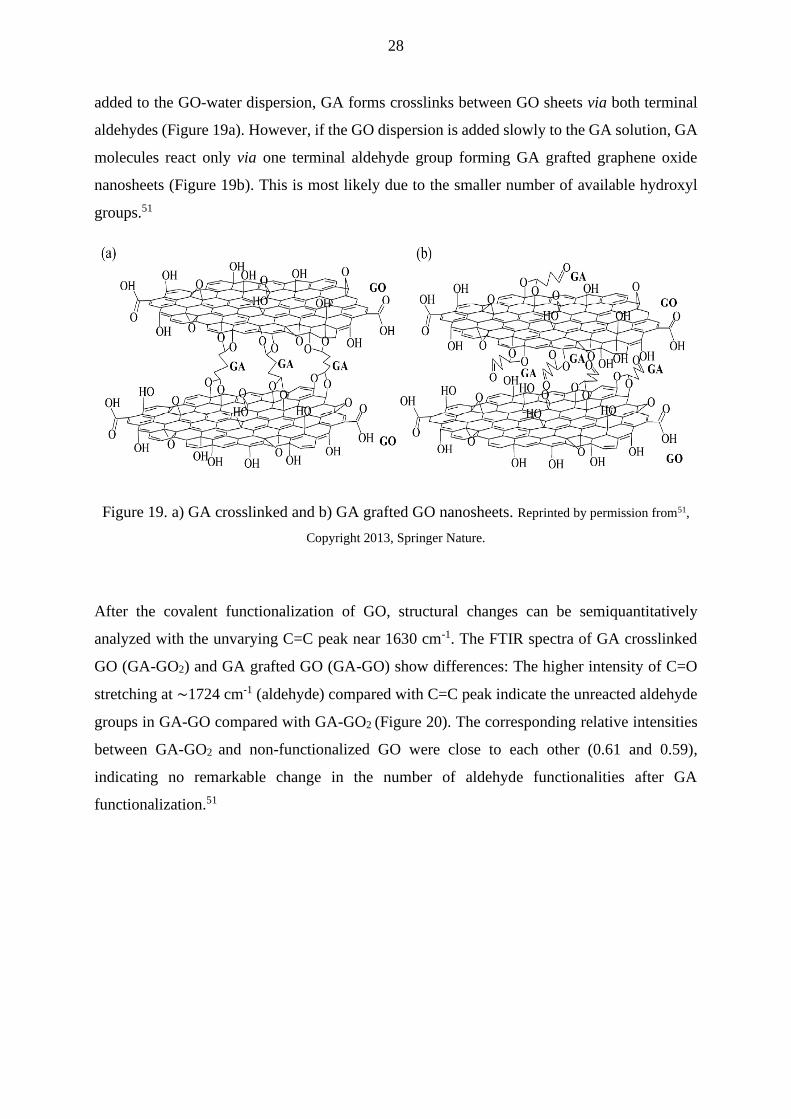
28
added to the GO-water dispersion, GA forms crosslinks between GO sheets via both terminal
aldehydes (Figure 19a). However, if the GO dispersion is added slowly to the GA solution, GA
molecules react only via one terminal aldehyde group forming GA grafted graphene oxide
nanosheets (Figure 19b). This is most likely due to the smaller number of available hydroxyl
groups.51
Figure 19. a) GA crosslinked and b) GA grafted GO nanosheets. Reprinted by permission from51,
Copyright 2013, Springer Nature.
After the covalent functionalization of GO, structural changes can be semiquantitatively
analyzed with the unvarying C=C peak near 1630 cm-1. The FTIR spectra of GA crosslinked
GO (GA-GO2) and GA grafted GO (GA-GO) show differences: The higher intensity of C=O
stretching at ~1724 cm-1 (aldehyde) compared with C=C peak indicate the unreacted aldehyde
groups in GA-GO compared with GA-GO2 (Figure 20). The corresponding relative intensities
between GA-GO2 and non-functionalized GO were close to each other (0.61 and 0.59),
indicating no remarkable change in the number of aldehyde functionalities after GA
functionalization.51

29
Figure 20. FTIR spectra of freeze-dehydrated a) GO, b) GA-GO (crosslinked), and c) GA-GO
(grafted). Reprinted by permission from51, Copyright 2013, Springer Nature.
Successful covalent binding of GA to GO can be observed from several FTIR peaks (Figure
20). The peaks at 2800-3000 cm-1 correspond probably to the C-H stretching of GA. Also, the
relative intensities of C=C (~1625 cm-1) and C-O (alkoxy, ~ 1100 cm-1) peaks increase after
GA binding, which indicates the increase in the number of alkoxy groups and suggests the
presence of covalent bonds between GA and GO.51 It has also been observed that the relative
intensities of OH-group peaks at 3300-3500 cm-1 reduced remarkably after GA or glyoxal
binding to GO. This indicates that these dialdehydes react with OH groups of GO.54
As some aldehyde groups of GA remain unreacted after the reaction with GO, they can further
react with NH2 groups of proteins, such as a free amino group in the N-terminus of the
polypeptide chain forming imine bonds (Schiff bases, enhanced in alkaline pH).55 It has been
experimentally proved that GA is most reactive towards unprotonated ε-amino groups of lysine
amino acids.56 Although most lysine residues are protonated at acidic and neutral pH, a low
number of unprotonated lysine residues are sufficient to transfer acid-base equilibrium towards
deprotonation. As polar moieties, lysine residues usually locate on protein surfaces. Lysine side
chains are generally not in enzymes’ active sites, which means that the enzyme’s conformation
and biological activity retain after modification to a lysine residue.50 Histidine and tyrosine
residues can also react with GA, but they are less reactive than free amino groups.56
30
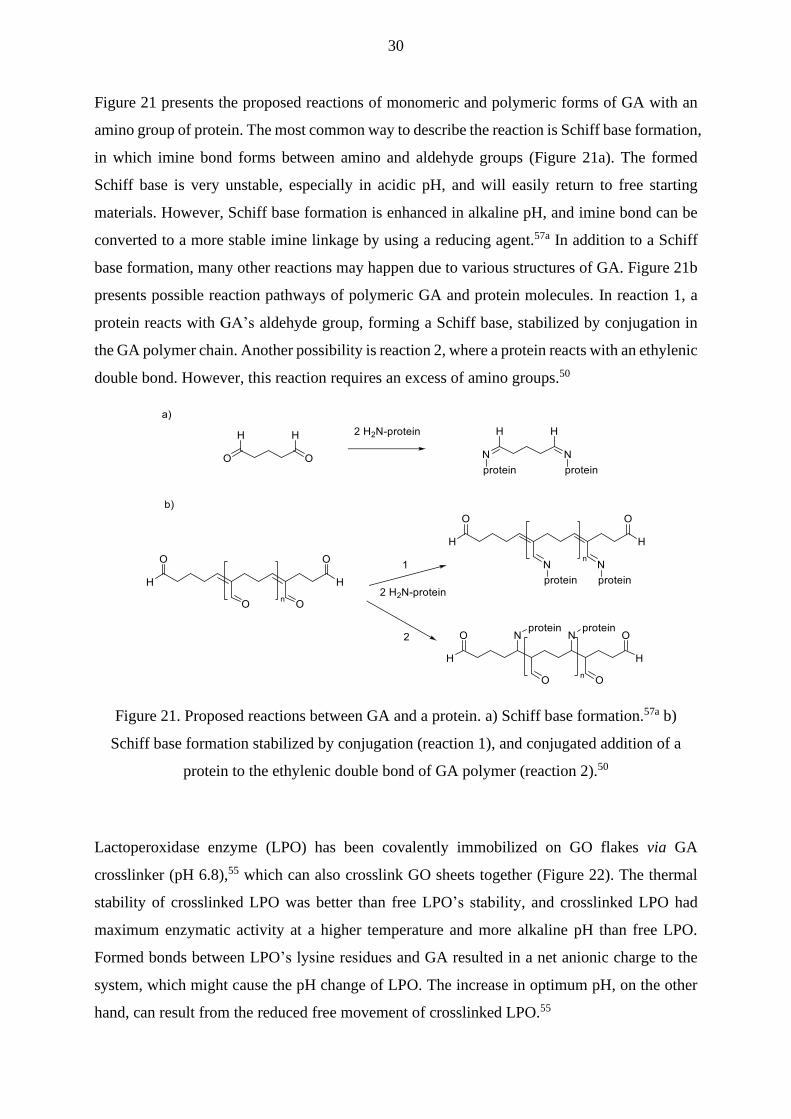
Figure 21 presents the proposed reactions of monomeric and polymeric forms of GA with an
amino group of protein. The most common way to describe the reaction is Schiff base formation,
in which imine bond forms between amino and aldehyde groups (Figure 21a). The formed
Schiff base is very unstable, especially in acidic pH, and will easily return to free starting
materials. However, Schiff base formation is enhanced in alkaline pH, and imine bond can be
converted to a more stable imine linkage by using a reducing agent.57a In addition to a Schiff
base formation, many other reactions may happen due to various structures of GA. Figure 21b
presents possible reaction pathways of polymeric GA and protein molecules. In reaction 1, a
protein reacts with GA’s aldehyde group, forming a Schiff base, stabilized by conjugation in
the GA polymer chain. Another possibility is reaction 2, where a protein reacts with an ethylenic
double bond. However, this reaction requires an excess of amino groups.50
Figure 21. Proposed reactions between GA and a protein. a) Schiff base formation.57a b)
Schiff base formation stabilized by conjugation (reaction 1), and conjugated addition of a
protein to the ethylenic double bond of GA polymer (reaction 2).50
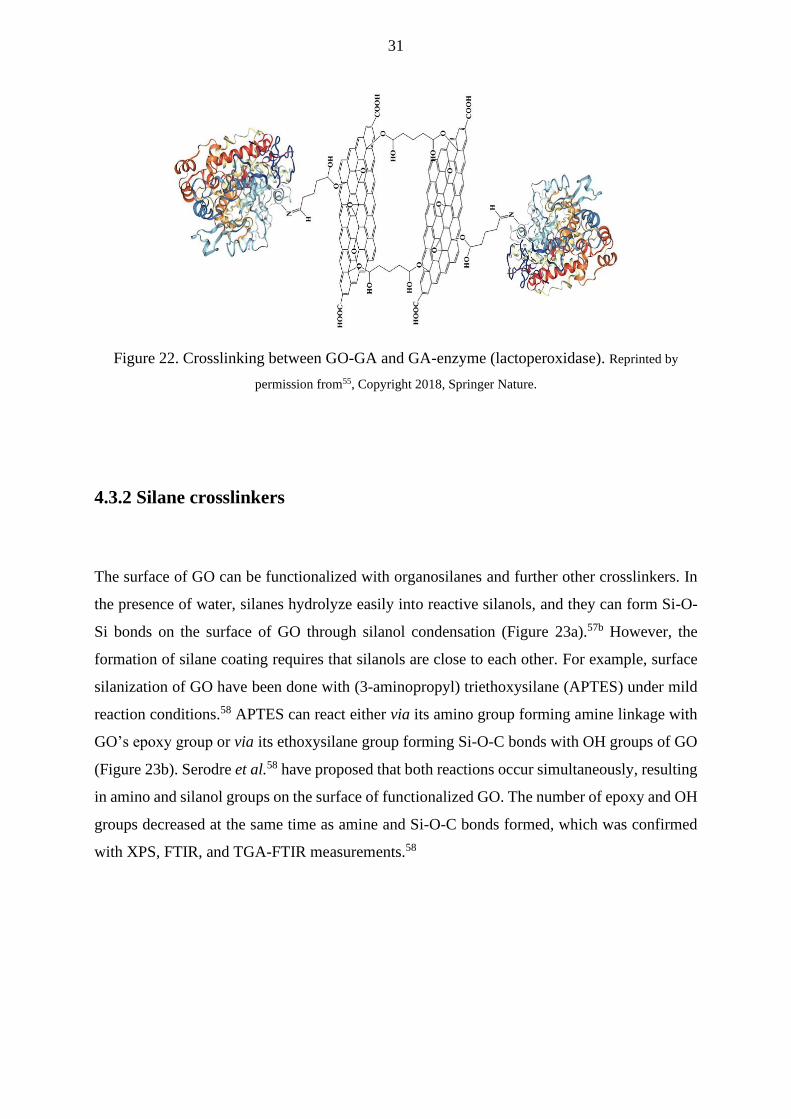
Lactoperoxidase enzyme (LPO) has been covalently immobilized on GO flakes via GA
crosslinker (pH 6.8),55 which can also crosslink GO sheets together (Figure 22). The thermal
stability of crosslinked LPO was better than free LPO’s stability, and crosslinked LPO had
maximum enzymatic activity at a higher temperature and more alkaline pH than free LPO.
Formed bonds between LPO’s lysine residues and GA resulted in a net anionic charge to the
system, which might cause the pH change of LPO. The increase in optimum pH, on the other
hand, can result from the reduced free movement of crosslinked LPO.55
31
Figure 22. Crosslinking between GO-GA and GA-enzyme (lactoperoxidase). Reprinted by
permission from55, Copyright 2018, Springer Nature.
4.3.2 Silane crosslinkers
The surface of GO can be functionalized with organosilanes and further other crosslinkers. In
the presence of water, silanes hydrolyze easily into reactive silanols, and they can form Si-O-
Si bonds on the surface of GO through silanol condensation (Figure 23a).57b However, the
formation of silane coating requires that silanols are close to each other. For example, surface
silanization of GO have been done with (3-aminopropyl) triethoxysilane (APTES) under mild
reaction conditions.58 APTES can react either via its amino group forming amine linkage with
GO’s epoxy group or via its ethoxysilane group forming Si-O-C bonds with OH groups of GO
(Figure 23b). Serodre et al.58 have proposed that both reactions occur simultaneously, resulting
in amino and silanol groups on the surface of functionalized GO. The number of epoxy and OH
groups decreased at the same time as amine and Si-O-C bonds formed, which was confirmed
with XPS, FTIR, and TGA-FTIR measurements.58

32
Figure 23. a) Reaction of GO with APTES and formation of silane coating through silanol
condensation in water. 57b b) Three possible types of reactions between APTES and GO in the
presence of water.58
Laccase enzyme has been immobilized on GO via a double crosslinker system, 3-aminopropyl
trimethoxy silane (APTMS) and GA.59 APTMS reacts with GO similarly to APTES. However,
reaction with GO’s OH groups is more favorable because it leaves free amino groups for GA
crosslinking.58 After amine functionalization, GA is added to insert aldehyde groups to GO,
which can further react with amino groups of protein, such as laccase enzyme (Figure 24).59
Figure 24. Schematic representation of laccase immobilization on GO using APTMS and GA
crosslinkers.59

33
4.4 Click reactions
Sharpless et al.60 introduced the term “click chemistry” in 2001 to describe fast, “spring-loaded”,
and highly selective organic reactions. In a typical click reaction, covalent bond forms between
carbon and a heteroatom. The reaction has a high thermodynamic driving force (> 20 kcal/mol),
enabling fast completion of the reaction. Also, click chemistry reactions have a high yield of
final products, easy purification, high stereospecificity, and simple reaction conditions.60 In
biomedical applications, four click reaction types are commonly used; cycloaddition,
nucleophilic ring-opening, non-aldol carbonylation, and carbon-carbon multiple bond addition
reactions.61 However, cycloaddition reactions are mainly utilized in functionalization of GO.
4.4.1 Copper-catalyzed azide-alkyne cycloaddition (CuAAC)
The most typical click reaction utilized in GO functionalization is copper-catalyzed
cycloaddition of azides and alkynes (CuAAC), which forms stable triazole linkage in acidic or
basic organic solvents. Copper (I) catalyst is needed in the reaction temperatures favorable for
GO and proteins. Functional groups participating in azide-alkyne cycloaddition are unreactive
toward biological molecules, such as proteins. Hence, the reaction is highly specific. Azide-
alkyne reactions have been used for protein conjugation, so it would also be applicable for
covalent protein immobilization on GO.57c
Alkynyl terminated poly(ethylene)glycol (PEG) and amino acids have been connected to azide-
functionalized GO sheets utilizing the cycloaddition approach (Figure 25). First, COOH groups
of GO were activated with EDC and NHS as in diimide-activated amidation. After that, 3-
azidopropan-1-amine 14 reacted with the modified GO by EDC condensation, resulting in
azide-functionalized GO. Then, alkynyl terminated amino acid or PEG chain was added, and
selective cycloaddition of alkyne and azide took place (Figure 25).62 This approach can be
applicable also for larger macromolecules such as proteins and enzymes because they can be
modified to have an alkyne group.44

34
Figure 25. Covalent functionalization of GO with azide and addition of amino acids and
polymers through CuAAC reaction. Adapted from the article62.
Successful covalent attachment of azide groups on GO was confirmed from the FTIR spectrum,
where the characteristic peak of azide groups at 2098 cm-1 can be observed. After the click
reaction, the azide peak disappeared, and the peak at 1100 cm-1 indicated the stretching of C-O
groups of PEG.62
The cycloaddition can also occur the other way round, between alkynyl functionalized GO and
azide functionalized peptide (Figure 26). In Shi and coworkers’ study,63 hydroxyl groups of GO
were converted to alkynyl groups through silanization with alkynyl-containing silane coupling
agent 15. The CuAAC reaction of functionalized GO and the azide-functionalized peptide was
then performed.63 The peptides used in the experiments were RGD peptides, a class of peptides
enhancing cell adhesion. The abbreviation RGD signifies that this sort of peptides always
contain an amino acid sequence of arginine (R), glycine (G), and aspartic acid (D).64

35
Figure 26. Reaction pathway of GO alkynyl-modification and azide-alkyne cycloaddition of
the modified GO and azide-functionalized peptide.63
4.4.2 Double functionalization
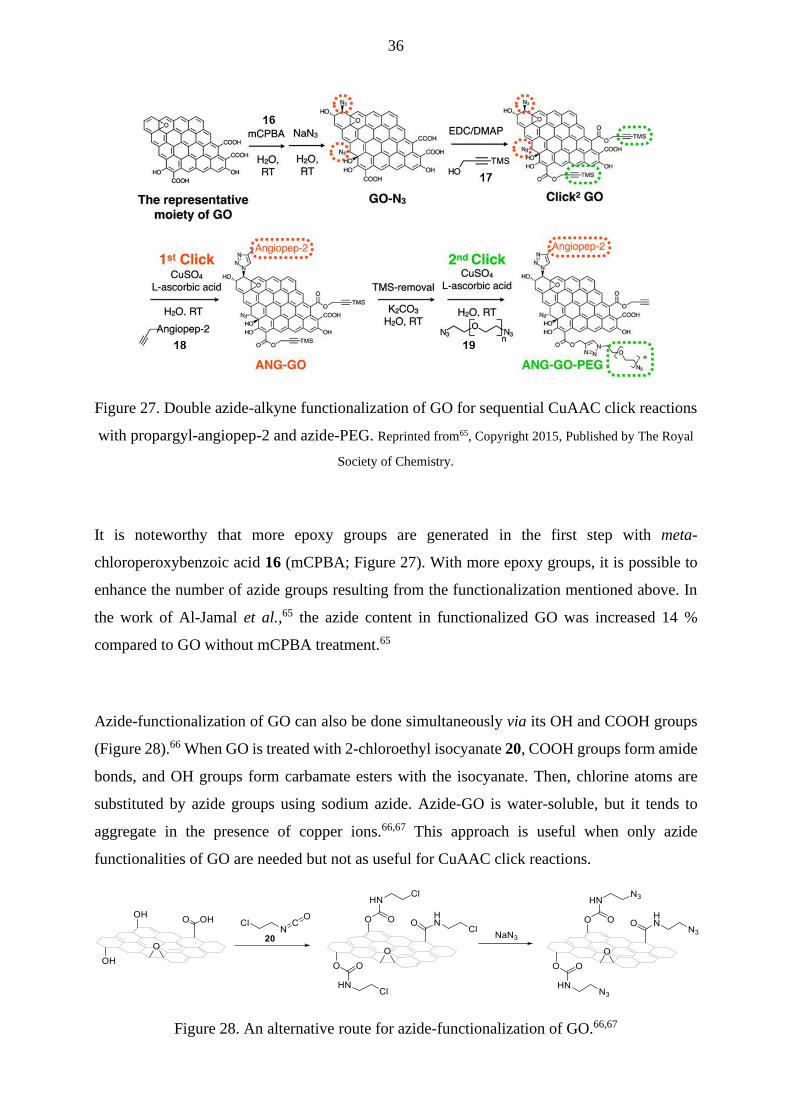
Al-Jamal et al.65 have modified GO to have both reactive sites, -N3 and alkyne groups, for
CuAAC double click reactions with propargyl-modified angiopep-2 18 and di-azide-modified
PEG 19 (Figure 27). N3 groups were directly attached to GO through a 1,2-epoxide ring-
opening reaction with NaN3. Silyl-protected alkyne moieties 17 were attached to GO’s COOH
groups. After double functionalization of GO, an alkyne-modified peptide 18 was attached to
GO via the first CuAAC click reaction. For the second click reaction with azide-PEG 19, the
silyl protecting group of GO propargyl group was removed. Both click reactions were achieved
under the same reaction conditions. The advantage of this method is that COOH groups of GO
are saved for later functionalization, such as adding alkyne functionality to GO. 65
36
Figure 27. Double azide-alkyne functionalization of GO for sequential CuAAC click reactions
with propargyl-angiopep-2 and azide-PEG. Reprinted from65, Copyright 2015, Published by The Royal
Society of Chemistry.
It is noteworthy that more epoxy groups are generated in the first step with meta-
chloroperoxybenzoic acid 16 (mCPBA; Figure 27). With more epoxy groups, it is possible to
enhance the number of azide groups resulting from the functionalization mentioned above. In
the work of Al-Jamal et al.,65 the azide content in functionalized GO was increased 14 %
compared to GO without mCPBA treatment.65
Azide-functionalization of GO can also be done simultaneously via its OH and COOH groups
(Figure 28).66 When GO is treated with 2-chloroethyl isocyanate 20, COOH groups form amide
bonds, and OH groups form carbamate esters with the isocyanate. Then, chlorine atoms are
substituted by azide groups using sodium azide. Azide-GO is water-soluble, but it tends to
aggregate in the presence of copper ions.66,67 This approach is useful when only azide
functionalities of GO are needed but not as useful for CuAAC click reactions.
Figure 28. An alternative route for azide-functionalization of GO.66,67

37
Vacchi and coworkers68 have studied the controlled double functionalization of GO via its
hydroxyl and epoxy groups. Two different strategies conducted on different GO samples were
analyzed (Figure 29). In the first approach (GO-OE → GO-OE-W), GO prepared by Hummers’
method with the average thickness of 20 nm was used. In the second approach (GO-OE → GO-
OE-EST), GO was prepared from carbon nanofibers by rolling and exfoliation into monolayers
with thicknesses of 1 nm. This GO sample was more water dispersible and contained fewer
aggregated GO sheets.68
Figure 29. Two routes for GO double functionalization with protected amine derivatives.
Adapted from68.
In the first step of double functionalization, GO’s epoxy groups react with monoprotected
triethylene glycol diamine 21 through epoxide ring-opening reaction (Figure 29). Hydroxyl
groups of the obtained GO-OE intermediate (step 1) further react with Boc-protected 4-iodo-
butylamine 22 through Williamson ether synthesis. Protecting groups of both amines can be
simultaneously removed with HCl in 1,4-dioxane. Although double functionalization was
successful, the Williamson reaction did not yield as high amine loading as an equivalent
monofunctionalization approach without an epoxide ring-opening reaction. Possible reasons for
the lower functionalization degree of the second reaction can be instability of some GO’s OH
groups or steric hindrance caused by molecules inserted into GO’s surface after the first
reaction.68

38
In another approach, the opening of epoxy groups is followed by the esterification reaction of
GO’s hydroxyl groups (Figure 29). Intermediate GO-OE reacted with synthesized 1-(2-
nitrophenyl) ethyl carbamate-protected amine 23 in the presence of coupling agents EDC and
DMAP. Two protecting groups for primary amines were used, Boc- and 1-(2-nitrophenyl) ethyl
carbamate, to enable selective amine derivatization. The final product GO-OE-EST was treated
with HCl in 1,4-dioxane to remove the Boc-protecting group. Then, 1-(2-nitrophenyl) ethyl
carbamate protection was removed by irradiating at 365 nm. As in the first approach, also here
the second reaction yielded lower amine loading than the same reaction in GO’s
monofunctionalization.68
In conclusion, the introduced double functionalized GOs could be applicable for covalent
protein immobilization, for example, via proteins’ C-terminus through amidation reaction. The
total functionalization degree of both double functionalization approaches is higher than each
functionalization individually because both OH and epoxy groups can be utilized for protein
immobilization. The second approach enables the preparation of multifunctional GO materials,
whereas the first one enhances the total amount of immobilized protein.
Also, other reactive moieties can be inserted on GO via double functionalization, such as a
benzoquinone molecule. Shi and coworkers69 have developed a method in which Boc-protected
cysteamine 24 and benzoquinone 25 are linked to GO leading to two different reactive sites for
further modifications (Figure 30). First, protected cysteamine 24 is added to GO dispersion,
forming new OH groups and thioether linkages through epoxide ring-opening reaction. Then,
benzoquinone 25 reacts with GO’s OH groups through nucleophilic substitution reaction
resulting in grafted hydroquinone on GO. Benzoquinone 25 is reactive towards amines, azides,
phosphines, and thiols (Michael addition), and it has been used to conjugate biomolecules, such
as proteins. Here, phenylalanine derivative 26 was covalently attached to GO via hydroquinone
through a nucleophilic addition reaction. 3-(pentafluorothio)-phenylalanine 26 was chosen for
the reaction because it has COOH groups, which can further react with amines or alcohols. Also,
fluorine moiety facilitated the characterization of the double functionalized GO derivatives.69
An advantage of the presented method is the diversity of possible reactions, enabling the
conjugation of various biomolecules, including proteins.
39
Figure 30. Reaction pathway for benzoquinone-based double functionalization of GO.69
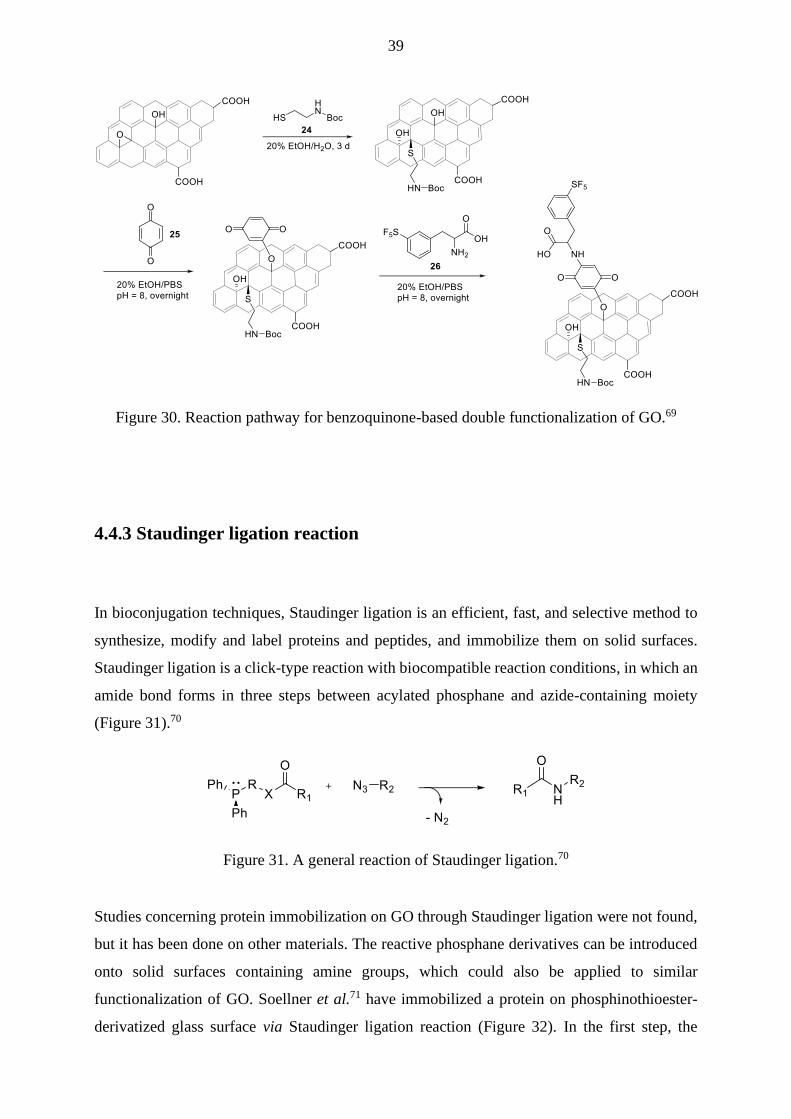
4.4.3 Staudinger ligation reaction
In bioconjugation techniques, Staudinger ligation is an efficient, fast, and selective method to
synthesize, modify and label proteins and peptides, and immobilize them on solid surfaces.
Staudinger ligation is a click-type reaction with biocompatible reaction conditions, in which an
amide bond forms in three steps between acylated phosphane and azide-containing moiety
(Figure 31).70
Figure 31. A general reaction of Staudinger ligation.70
Studies concerning protein immobilization on GO through Staudinger ligation were not found,
but it has been done on other materials. The reactive phosphane derivatives can be introduced
onto solid surfaces containing amine groups, which could also be applied to similar
functionalization of GO. Soellner et al.71 have immobilized a protein on phosphinothioester-
derivatized glass surface via Staudinger ligation reaction (Figure 32). In the first step, the

40
amine-derivatized glass surface is modified with succinimidyl (NHS) ester terminated PEG 28.
Then, phosphinothioester moiety is introduced via phosphine-containing reagent 29. Staudinger
ligation was conducted using two differently labelled peptide chains of RNase S´ enzyme,
which was followed by incubation with S-protein leading to the generation of active RNase S´
enzyme: Azido group either replacing an ε-amino group of lysine ((N3) Lys1 S15) or in the
PEG-terminus of the peptide chain (N3-PEG-S15). The Staudinger ligation of the enzyme
through lysine residue resulted in lower yield and enzymatic activity (51 % and 85 %,
respectively) than the reaction through the PEG-terminus of the enzyme (65 % and 92 %,
respectively).71
Figure 32. Phosphane group introduction to amine-containing surface and Staudinger ligation
of an enzyme to a solid surface. Reprinted with permission from71 Copyright 2003, American chemical
society.
4.4.4 Azide and alkyne labeling of proteins
Proteins can be chemically or biochemically modified to have unnatural reactive groups for
covalent reactions such as azide or alkyne groups. The presence of unnatural groups on protein
surfaces enables selective covalent reactions through these groups, typically click reactions. For

41
example, azido-moiety can be added into lysine residues or N-terminus of proteins using diazo
compound 30, which replaces protein’s primary amine group with its azide group (Figure 33).72
Figure 33. Azide labeling of protein with diazo compound 27. Adapted with permission from72.
Copyright 2009, American Chemical Society.
A more selective method to introduce azide group into protein is Inoue et al.’s73 method, in
which azide group is added specifically on protein’s N-terminal amino group (Figure 34). The
method is based on the use of bioconjugation reagents, derivatives of 6-(azidomethyl)-2-
pyridinecarbaldehyde 31 (6AMPC). 6AMPC derivatives enable both selective azide-labeling
of protein’s N-terminus and the CuACC reaction with alkynes.73
Figure 34. N-terminal azide-labeling of protein. Adapted from the article73.
Chemical alkyne-labeling of peptides has been done earlier,65 but in the case of proteins, alkyne-
labeling often requires semisynthetic or biosynthetic (e.g., genetic engineering) approaches44.
A common method to introduce chemical groups to proteins is expressed protein ligation (EPL),
in which a chemically labeled polypeptide chain is added to the N- or C-terminus of a
biologically produced protein. EPL method can also be used for the introduction of other
functional groups.74
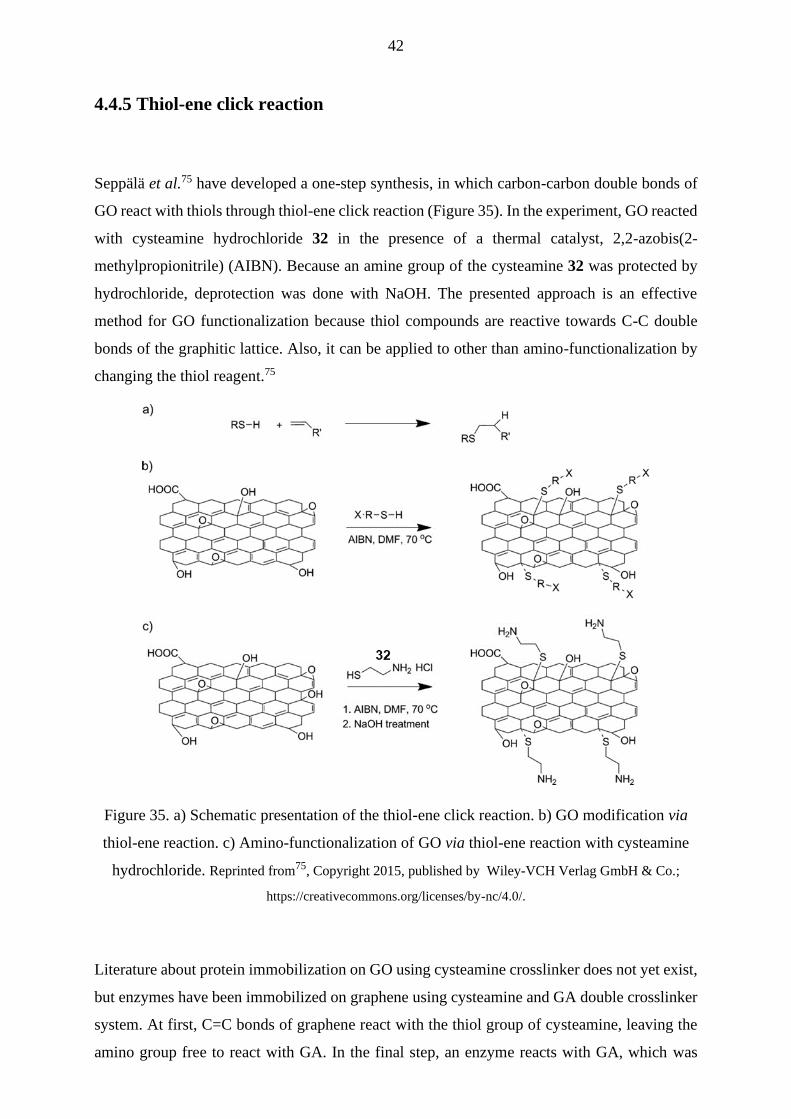
42
4.4.5 Thiol-ene click reaction
Seppälä et al.75 have developed a one-step synthesis, in which carbon-carbon double bonds of
GO react with thiols through thiol-ene click reaction (Figure 35). In the experiment, GO reacted
with cysteamine hydrochloride 32 in the presence of a thermal catalyst, 2,2-azobis(2-
methylpropionitrile) (AIBN). Because an amine group of the cysteamine 32 was protected by
hydrochloride, deprotection was done with NaOH. The presented approach is an effective
method for GO functionalization because thiol compounds are reactive towards C-C double
bonds of the graphitic lattice. Also, it can be applied to other than amino-functionalization by
changing the thiol reagent.75
Figure 35. a) Schematic presentation of the thiol-ene click reaction. b) GO modification via
thiol-ene reaction. c) Amino-functionalization of GO via thiol-ene reaction with cysteamine
hydrochloride. Reprinted from75, Copyright 2015, published by Wiley-VCH Verlag GmbH & Co.;
https://creativecommons.org/licenses/by-nc/4.0/.
Literature about protein immobilization on GO using cysteamine crosslinker does not yet exist,
but enzymes have been immobilized on graphene using cysteamine and GA double crosslinker
system. At first, C=C bonds of graphene react with the thiol group of cysteamine, leaving the
amino group free to react with GA. In the final step, an enzyme reacts with GA, which was

43
presented in more detail earlier (Chapter 4.3.1). All reaction steps were done at room
temperature and pH 8.0.76
44
5 Immobilization of ECM proteins
5.1 Collagen
Many methods that have been used for collagen crosslinking could also apply to GO-collagen
crosslinking. GA has been used to crosslink collagen chains to achieve mechanically stiff
biomaterials. GA reacts most commonly with amine groups of lysine or hydroxylysine residues
of collagen, but it can also react with histidine and arginine residues. However, these reactions
are rare because the number of arginine and histidine residues in collagen is much lower than
the number of lysine residues. Because other proteins have been covalently attached to GO
using GA crosslinker, a similar approach could also be possible for collagen. However, the
concentration of collagen must be considered. If the relative amount of collagen is significantly
higher than reactive sites of GA-GO material, crosslinking of collagen could dominate.77
Diimide-activated amidation has been widely used for collagen crosslinking with other
biomolecules or surfaces. This approach has been utilized to prepare GO-collagen aerogels,78
but it could also be applicable for collagen immobilization on GO surfaces. In the first step,
separate collagen and GO dispersions in acetic acid were prepared. Different concentrations of
GO dispersions were then mixed in 2 wt-% of collagen solutions. After sonication, molding,
and lyophilization, collagen and GO flakes were crosslinked together via amidation reaction by
EDC and NHS (Figure 36). In the final step, the mixture was freeze-dried to obtain GO-collagen
aerogels.78
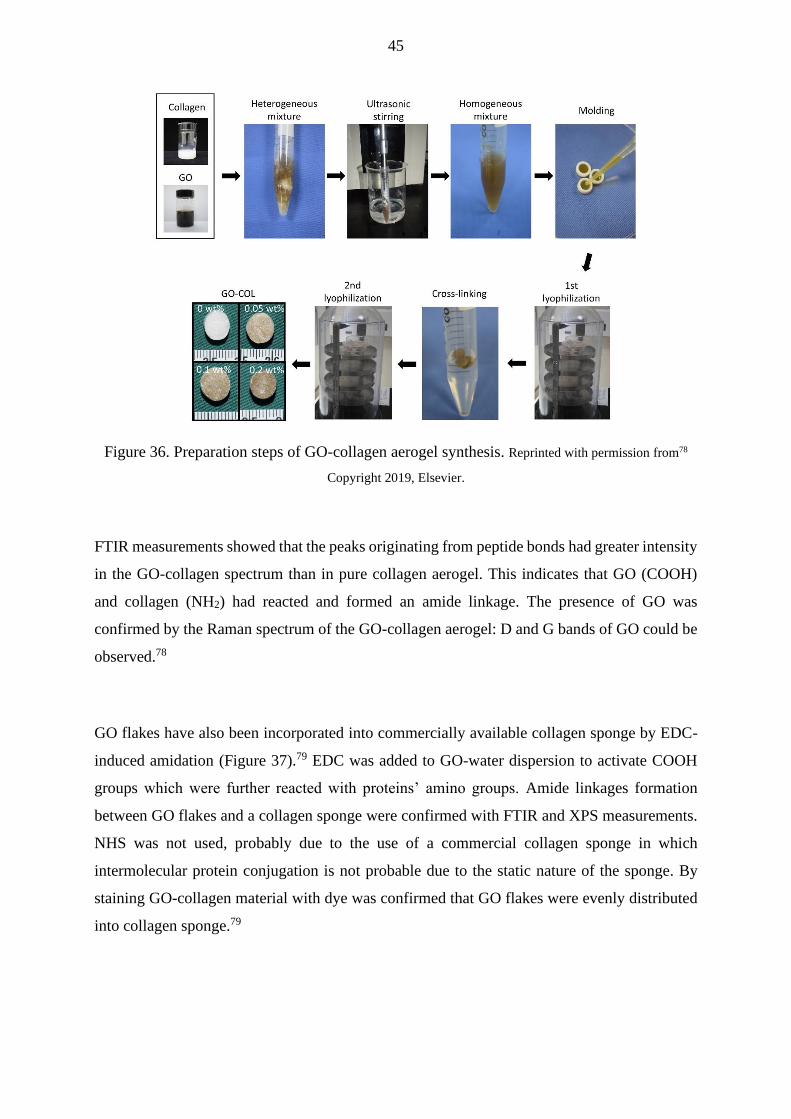
45
Figure 36. Preparation steps of GO-collagen aerogel synthesis. Reprinted with permission from78
Copyright 2019, Elsevier.
FTIR measurements showed that the peaks originating from peptide bonds had greater intensity
in the GO-collagen spectrum than in pure collagen aerogel. This indicates that GO (COOH)
and collagen (NH2) had reacted and formed an amide linkage. The presence of GO was
confirmed by the Raman spectrum of the GO-collagen aerogel: D and G bands of GO could be
observed.78
GO flakes have also been incorporated into commercially available collagen sponge by EDC-
induced amidation (Figure 37).79 EDC was added to GO-water dispersion to activate COOH
groups which were further reacted with proteins’ amino groups. Amide linkages formation
between GO flakes and a collagen sponge were confirmed with FTIR and XPS measurements.
NHS was not used, probably due to the use of a commercial collagen sponge in which
intermolecular protein conjugation is not probable due to the static nature of the sponge. By
staining GO-collagen material with dye was confirmed that GO flakes were evenly distributed
into collagen sponge.79

46
Figure 37. Preparation of GO-collagen scaffold via EDC-induced diimide-activated
amidation. Reprinted from79
, Copyright 2015 with permission from Elsevier.
5.2 Laminin
Functional neurite outgrowth domain of laminin protein (p20 peptide) has been covalently
attached on poly(3,4-ethylene dioxythiophene) (PEDOT) and GO composite film via EDC and
NHS induced diimide-activated amidation.80 PEDOT is a conducting polymer, making it
suitable for, e.g., biosensing and tissue engineering, but it does not contain any reactive
functional groups that could react with biomolecules. Therefore, the embedding of reactive GO
rich with oxygen-containing functional groups makes PEDOT more applicable to these
applications. Before adding p20 peptide, GO was embedded into the EDOT polymer network
during electropolymerization: EDOT electropolymerized onto the electrode surface from the
EDOT/GO water solution. Covalent crosslinking of laminin peptide to PEDOT/GO film was
confirmed by FTIR and XPS studies indicating the formation of amide linkages (-NH2 of
laminin, COOH of GO).80
Neural biocompatibility of the PEDOT/GO films with (non-covalently and covalently
functionalized ((p20 ADS and p20 COV, respectively)) and without laminin peptide were also
studied (Figure 38).80 The unmodified PEDOT/GO film was a favorable substrate for neural
growth and neuron attachment. The density of neurons attached to all films was similar, but
neurites were longer on the p20 COV film than unmodified and p20 ADS films.80 Earlier, p20

47
peptide has been observed to enhance neurite outgrowth when incorporating into a conducting
polymer network.81 Therefore, it was concluded that p20 enhances neurite outgrowth only when
covalently crosslinked on GO. It was suggested that weak interactions could disrupt p20 peptide
conformation in p20 ADS PEDOT/GO film, leading to loss of biological activity.80
Figure 38. Fluorescent images of neurons cultured on a) unmodified (bare), b) physically
adsorbed p20 peptide (p20 ADS), and c) covalently attached p20 peptide (p20 COV)
PEDOT/GO films. Scale bar 50 µm. d) Neuron densities growing on the PEDOT/GO films
and e) their average neurite lengths. Reproduced from75 with permission from The Royal Society of
Chemistry, conveyed through copyright clearance center.
48
6. Summary
The literature part focused on introducing the chemical properties of GO, possible interactions
between proteins and GO, and covalent functionalization methods of GO making it more
reactive towards covalent reactions with proteins. Also, some examples of protein immobilized
GO systems containing ECM proteins, collagen and laminin, were presented.
GO is a hydrophilic material with excellent mechanical properties and diverse opportunities for
chemical modification, making it a promising material for biomedical applications. Interactions
involved in the attachment of proteins to GO can be covalent or non-covalent, or both types of
interactions can be applied. In covalent protein immobilization, amide bond formation is typical
between proteins and GO. Therefore, amino groups on the protein surfaces (-NH2 of lysine or
N-terminus) are important for the covalent bond formation. Covalent protein immobilization
usually results in more specific and stable protein attachment on GO than protein
immobilization through weak interactions. However, covalent protein immobilization can result
in random or specific protein orientation relative to the GO surface, depending on the
functionalization protocol used.
Although GO contains reactive oxygen-containing functionalities, covalent protein
immobilization often requires a preceding chemical modification. COOH groups of GO can be
activated to more reactive towards forming amide bonds with proteins. The number of COOH
groups can also be increased, but there is no agreement if it will increase the final number of
immobilized proteins. Epoxy groups of GO can be modified into amino groups, which can be
beneficial for further functionalization. However, literature about protein attachment on amino-
functionalized GO was not found.
Proteins have been attached covalently on GO using crosslinker molecules of different lengths.
It has been suggested that the use of crosslinkers may retain proteins’ biological function better
than direct immobilization methods due to the increase of distance between a protein and GO.
Glutaraldehyde is a commonly used crosslinker molecule, but it tends to polymerize easily, and
it has 13 different structural forms in aqueous solutions. However, double crosslinker systems
of organosilanes and glutaraldehyde are widely used.

49
Click reactions presented in this thesis could be potential methods for covalent attachment of
proteins to GO, but so far, they have been used only for amino acids, peptides, or small proteins.
Also, for the chemical functionalization of GO, cycloaddition reactions are mainly used. Double
functionalized GO materials could potentially increase the total amount of immobilized protein
or enhance the preparation of multifunctional GO materials, e.g., the use of two different
proteins simultaneously.

50
EXPERIMENTAL PART
7. Motivation
GO can be functionalized with proteins directly29 or by using crosslinkers such as
glutaraldehyde (GA)82, (3-aminopropyl)-triethoxysilane83 (APTES) or polylysine and
polyethylene glycol polymerchains84. Crosslinker molecules act as bridges between GO and
proteins, potentially preventing the distortion of the quaternary structure of proteins. In this way,
the proteins stay far away from the GO lattice, which could interact with proteins via weak
interactions, such as hydrophobic and electrostatic interactions.25
In the experiments, horseradish peroxidase (HRP, EC 1.11.1.7) was used as a model protein for
immobilization. HRP is a peroxidase enzyme, which is isolated from the roots of the horseradish
plant. There are many isoenzymes of HRP in horseradish roots, but HRP C is the most abundant
and studied form. HRP catalyzes the oxidation of different organic and inorganic compounds
using hydrogen peroxide or other peroxides.85 HRP has been studied extensively due to its
potential for applications in medicine and biotechnology: HRP can be used, for example, as a
biosensor, in cancer therapy and clinical diagnostics,86,87 and it is used for enzyme labeling of
antibodies to improve their detection. In addition, HRP can induce biodegradation of GO
materials in the presence of hydrogen peroxide through enzymatic oxidation.88,89
Earlier, GA was commonly used for the conjugation of HRP to an antibody, as HRP has six
lysine residues (Figure 10) and three of these locate on the surface of HRP.90,91 Hence, HRP
possibly reacts with GA via its amino groups on its surface or its N-terminus.50 However, the
use of GA for bioconjugation is hard to control because it tends to polymerize. Nowadays, there
are more advanced crosslinkers for bioconjugation, but GA is still used.57a,d
The experimental part of the master’s thesis focuses on the covalent immobilization of proteins
on laser-oxidized graphene surfaces. Earlier, HRP has been attached to the laser-oxidized

51
graphene via weak interactions.92 However, HRP immobilization on the chip through covalent
interactions has not been done before. In this thesis, the experiments aimed to attach HRP
covalently on the laser-oxidized graphene-based microchips using crosslinking chemistry.
Preliminary experiments were done with GO flakes, using two different methods, which
differed in the used crosslinker systems, glutaraldehyde82 or APTES-GA83. From the GO flake
experiments, information about the formed bonds between the components in the GO-
crosslinker-HRP systems was achieved by FTIR and TGA measurements. A challenge in this
work was to prove that the protein immobilization on the GO surface was covalent.

52
8. Materials and methods
All chemicals (Table 2) were used without any further purification. HRP (Sigma Aldrich, type
IV, ≥ 250 units/mg, salt-free, lyophilized powder) was used as a model protein for the
immobilization on GO materials.
Table 2. Chemicals used in the study
Chemical Manufacturer Purity
Graphene oxide GRAPHENEA 4 mg/mL in H2O (monolayer content >
95 %)
Glutaraldehyde TCI 50 % in H2O (w/w, ~ 5.6 M)
Ethanol Altia Oyj 99.5 %
3-aminopropyltriethoxysilane TCI > 98.0 %
Sodium dihydrogen
phosphate dihydrate
Merck 98 - 100.5 %
Di-sodium hydrogen
phosphate dihydrate
Merck 99.5 %
A Mettler Toledo XP205 scale was used to weigh the chemical reagents and a Denver
Instrument APX-200 scale was employed to measure the net weights of round-bottomed flasks
and centrifuge tubes. A Hielscher UP50H ultrasonic processor was used to sonicate the mixtures
of GO flakes and a solvent to fine suspensions. A Thermo Fisher Scientific Heraeus Megafuge
16 centrifuge was utilized between functionalization and washing steps to separate the
synthesized GO materials from the reaction mixture.
8.2 Characterization of GO materials
FTIR: All IR spectra of the dried GO-flake samples were obtained with a Bruker Tensor 27
FTIR Spectrophotometer. The spectra were recorded on the spectral range 4000 - 400 cm-1 with
a 4 cm-1 resolution and 128 scans for both samples and background.

53
AFM: A Bruker AFM-icon dimension microscope with a SCANASYST-AIR probe was used
to assess the success of the immobilization on the chip. The AFM imaging was done with
PeakForce Tapping mode and the PeakForce Setpoint was 2 nN. The AFM images were
processed and analyzed with the NanoScope Analysis 1.9 software. The resolution of the AFM
images was 10 nm.
Raman: A Thermo Scientific DXR Raman microscope with Olympus TH4-200 light power
supply and DXR 532 nm filter was used to measure Raman spectra of the pure and
functionalized GO flakes. The Raman measurements were performed with laser power of 10
mW (GO, GO-APTES-GA-HRP) or 0.5 mW (GO-GA-HRP), exposure time of 3 s and 10
exposures, using fluorescence correction. For further analysis, single Raman spectra were
normalized to the G-band. Position and area values for specific bands were obtained by Lorentz
multi-peak fitting of single spectra using Origin 2017 software.
Raman measurements of the chip were done using a home-built Raman setup with a
backscattering geometry and a CW single-frequency laser (λ = 532 nm, Alphalas, Monolas-
532-100-SM). The beam was focused on a sample and subsequently collected with a 100x
microscope objective (Nikon L Plan SLWD 100x with 0.70 N.A.). The scattered light was
dispersed in a 0.5 m imaging spectrograph (Acton, SpectraPro 2500i) using 600 g ∙ mm−1
grating (resolution ~3 - 4 cm−1). The signal was detected with an EMCCD camera (Andor
Newton EM DU971N-BV) using 100 μm slit width. A beam splitter was placed between the
objective and the spectrometer to observe the exact measurement point visually. The Rayleigh
scattering was attenuated with an edge filter (Semrock). The approximate sample positioning
was done manually with XYZ-stage (Newport, ULTRAling 462-XYZ-M) and fine-tuned with
XYZ-piezo scanner (Attocube, ANPxyz101) with the smallest step of 50 nm in each direction.
A laser power of ~ 0.25 mW was utilized.21
The spectra were integrated from Raman shift 1323 cm−1 to 1371 cm−1, 1583 cm−1 to 1622 cm−1
and 2653 cm−1 to 2720 cm−1 in RamanMapViewer 2.0.0.1 to obtain Raman maps of D, G and
2D bands, respectively. For further analysis, single Raman spectra were normalized to the silica
signal. Position and area values for specific bands were obtained by Lorentz multi-peak fitting
of single spectra using Origin 2017 software. AD/AG ratios were calculated by dividing areas of
the respective D and G bands.

54
TGA: TG/DSC measurements were carried out by Dr Manu Lahtinen. Thermal properties of
the flake samples were examined with Perkin Elmer STA 6000 thermogravimetric TG/DSC
analyzer. The measurements were made in an open platinum pan, under air atmosphere (flow
rate of 40 mL/min), with a heating rate of 10 °C/min, in the temperature range of 22 ºC - 800
ºC. Temperature calibration of the analyzer was made using melting points of the indium
(156.6 °C) and aluminum (660.1 °C) standards. A weight balance was calibrated by measuring
the standard weight of 50.00 mg at room temperature. The sample weights used in the
measurements were about 1 - 4 mg.
8.3 Preparation of PBS
Stock solutions were prepared by dissolving 35.61 g (0.20 mol) of Na2HPO4·2 H2O in 1 000
mL of deionized water and 31.20 g (0.20 mol) of NaH2PO4·2 H2O in 1 000 mL of deionized
water. To achieve 500 mL of 0.2 M PBS solution (pH = 7.3), 385 mL of the Na2HPO4·2 H2O
and 115 mL of NaH2PO4·2 H2O solution were mixed. The pH was verified with a Mettler
Toledo InLab Micro pH electrode.
8.4 Preparation of HRP solution
1 mg/mL HRP solution (≥ 250 U/mL) was prepared by dissolving 0.99 mg of HRP in 1 mL of
PBS (0.2 M, pH = 7.3). The solution was stored at 4 ºC.
55
8.5. Immobilization on GO flakes
Each immobilization experiment on GO flakes was done twice. As a starting material, vacuum-
dried GO powder was used, prepared from 4 mg/mL GO water dispersion.
8.5.1 via glutaraldehyde
For the first experiment, 20 mL of 1 mg/mL GO solution in PBS (0.2 M, pH = 7.3) was prepared.
20 mL of PBS were added to 20.01 mg of vacuum-dried GO and the mixture was sonicated for
3 h in an ultrasonic bath (amplitude = 50 %, cycle 1).
On the next day, the GO suspension was sonicated again to achieve a fine suspension. Then,
0.38 mL of 50 % w/w GA water solution (~ 5.6 M, 2.139 mmol) was added to attain 1 % v/v
solution of GA in the GO suspension. The mixture was stirred for 4 h under N2 atmosphere at
RT. The suspension was centrifuged for 10 min (13 245 × g) to separate the flakes from the
supernatant. The flakes were washed by rinsing with 4 × 7 mL of PBS and resuspended to
10 mL of PBS in an ultrasonic bath. Approximately half of the intermediate product was lost
during the washing: the flakes were so mucous-like (slimy) that transfer from centrifuge tube
to a Büchner funnel was problematic. Some went through filter paper or stuck into it. Thereafter,
washings were performed via centrifugation.
40 µL of 1 mg/mL HRP (≥ 250 U/mL) solution in PBS was added to the suspension of the GO-
GA intermediate product. The mixture was stirred gently for 1 h at RT with a magnetic stirrer.
Afterwards, the suspension was centrifuged for 5 min (2 737 × g). The supernatant was removed,
and 7 mL of PBS were added on the top of the flakes which were subsequently let to set down.
Finally, the liquid phase was pipetted away, and the final product (GO-GA-HRP) was stored in
PBS.

56
For the characterization of the GO-GA-HRP product, PBS was removed from the product by
washing with 3 × 300 µL of water. Between each washing, the suspension was centrifuged for
5 min (2 737 × g). After the last centrifugation, the supernatant was removed, and the flakes
were resuspended to 1 mL of water.
The experiment was repeated once, using the double amount of each reagent. After GA
functionalization, the reaction mixture was centrifuged for 15 min (13 245 × g). The flakes were
washed with 3 × 14 mL of PBS and centrifuged between each washing for 15 min (13 245 × g).
After HRP immobilization, the reaction mixture was centrifuged for 15 min (18 500 × g) and
then washed with 2 × 14 mL of PBS and 1 × 14 mL of water, with centrifugation for 15 min
(18 500 × g) in between each washing. The yield of the GO-GA-HRP was 33.6 mg (starting
material: 40 mg of GO flakes). Additionally, longer centrifugation times and higher speeds
were used to separate the GO material derivatives from the supernatant during the second
experiment.
8.5.2 via APTES and glutaraldehyde
8 % (v/v) GA solution in water was required for the HRP immobilization, hence 5 mL of 8 %
(v/v) GA water solution was prepared from 5.6 M GA water solution:
V(GA) = 5 mL × 0.08 = 0.4 mL
m(GA) = δ (GA) × V(GA) = 1.06g
mL× 0.4 mL = 0.424 g
n (GA) = m (GA)
M(GA)=
0.424 g
100.129g
mol
= 4.2349 × 10⁻³mol
V(GA, 5.6 M) = n (GA)
C(GA)=
4.2349 × 10⁻³mol
5.6 M= 0.7562 mL ≈ 0.76 mL
0.76 mL of 5.6 M (50 % w/w) GA water solution was diluted with 4.24 mL of water.

57
20 mL of ethanol was added to 20.1 mg of vacuum-dried GO. The mixture was stirred and
suspended in an ultrasonic bath. 0.5 mL of APTES (2.137 mmol) was added while stirring with
a magnetic stirrer. The flask was equipped with a reflux condenser, and the reaction mixture
was heated in an oil bath for 2.5 h at 80 ºC. After heating, the mixture was let to cool down and
centrifuged for 10 min (13 245 × g). Since the separation was not completed, the centrifugation
was repeated. The flakes were washed 3 × 10 mL of ethanol and 2 × 10 mL of water and
centrifuged for 15 min (13 245 × g) between each washing. The GO-APTES product was let to
dry overnight under vacuum.
On the next day, the GO-APTES product was centrifuged twice for 15 min (13 245 × g,
18 500 × g) and resuspended to 2.5 mL of PBS (0.2 M, pH = 7.3). 0.5 mL of 8 % v/v GA
solution in water (4.235 mmol) was added to the suspension. The mixture was stirred for 6 h at
RT, covered with parafilm. After 6 h, the mixture was centrifuged for 15 min (18 500 × g). The
flakes were washed with 2 × 1 mL of PBS and 2 × 1 mL of water. The GO-APTES-GA product
was resuspended to 20 mL of PBS to achieve a 1 mg/mL solution.
100 µL of 1mg/mL HRP (≥ 250 U/mL) solution in PBS was added to the suspension of GO-
APTES-GA in PBS. The mixture was left to stir overnight for 18 h in an ice bath. After that,
the liquid phase was pipetted away and the GO-APTES-GA-HRP product was washed with 3 ×
1 mL of water, with centrifugation (15 min, 18 500 × g) between each washing. After the last
washing, the supernatant was removed, and the final product was left to dry at RT.
The experiment was repeated once, using the double amount of each reagent. To improve the
fineness of GO flakes in ethanol, a sonicator probe was used during the second experiment.
However, it was more problematic to separate the flakes from supernatant in the different
functionalization stages than in the first experiment with the same method. After centrifugation,
the supernatants still contained GO derivatives. Therefore, washing steps after GA and HRP
additions were adopted without centrifugation: after waiting for a couple of minutes, the color
of the supernatant changed from black to light gray, indicating that most of the GO flakes had
settled down. The supernatant was then pipetted away, and the flakes (resembling more
dispersion) were washed with PBS and water. The yield of the GO-APTES-GA-HRP product
was 15.65 mg (starting material: 40 mg of GO flakes).
58
8.6 Immobilization of HRP on the graphene-based microchip via
glutaraldehyde
For immobilization on the chip, 0.625 U/mL HRP solution in PBS was prepared. 5 µL of ≥ 250
U/mL HRP solution was diluted to 1995 µL of PBS (0.2 M, pH = 7.3).
The amount of 50 % (w/w) GA water solution was calculated so that the ratio of GA and HRP
was the same as in the experiments with GO flakes. HRP catalytic activity (µmol/min) in the
chip experiment:
2 mL × 0.625 U/mL = 1.25 U
and in the flake experiment:
0.080 mL × 250 U/mL = 20 U →
20 u
0.76 ml=
1.25 u
x → 47.5 ≈ 50 µl of 50 % (w/w) GA water solution.
1950 µL of PBS (0.2 M, pH 7.3) and 50 µL of 50 % w/w GA water solution (5.29 µmol) were
added to a 5 mL glass vial (d = 24 mm). The chip was immersed into the vial with tweezers,
the graphene layer pointing upwards. N2 gas was trapped inside the vial with a lid to obtain a
nitrogen atmosphere. The chip was incubated for 4 h at RT protected from light.
After 4 h of incubation in GA-PBS, the chip was washed with 3 × 1 mL of PBS and dried with
N2 flow. Afterwards, the chip was immersed in 2 mL of the prepared 0.625 U/mL HRP solution
and incubated for 1 h at RT. The chip was washed with 3 × 1 mL of PBS and 3 × 1 mL of water.
In the final step, the chip was rinsed with N2 flow and left to dry at RT overnight.

59
9. Results and discussion
9.1 Immobilization of HRP on GO flakes
Covalent protein immobilization via GA crosslinker on GO has been studied before with other
enzymes55,82,93 but not with HRP. GA is a commonly used crosslinker in protein immobilization
because of its diverse solubility and high reactivity, especially towards amines. However, GA
can have at least 13 different forms in an aqueous solution depending on physical and chemical
conditions, such as pH, temperature, and concentration, and a high tendency to polymerize.
This can lead to different lengths of GA chains between GO and a protein.50 Therefore, the
prediction of the immobilization outcome is not apparent.
The proposed reaction of GO, GA and a protein that would occur at neutral pH is shown in
Figure 39.55 A possible side reaction is the bridging of GO flakes via the two aldehyde groups
of GA that could cause agglomeration. Also, if there are OH groups close to each other on a
GO flake, acetals can form instead of hemiacetals.51 More information about GA crosslinking
is described in the literature part, Chapter 4.3.1 Glutaraldehyde.
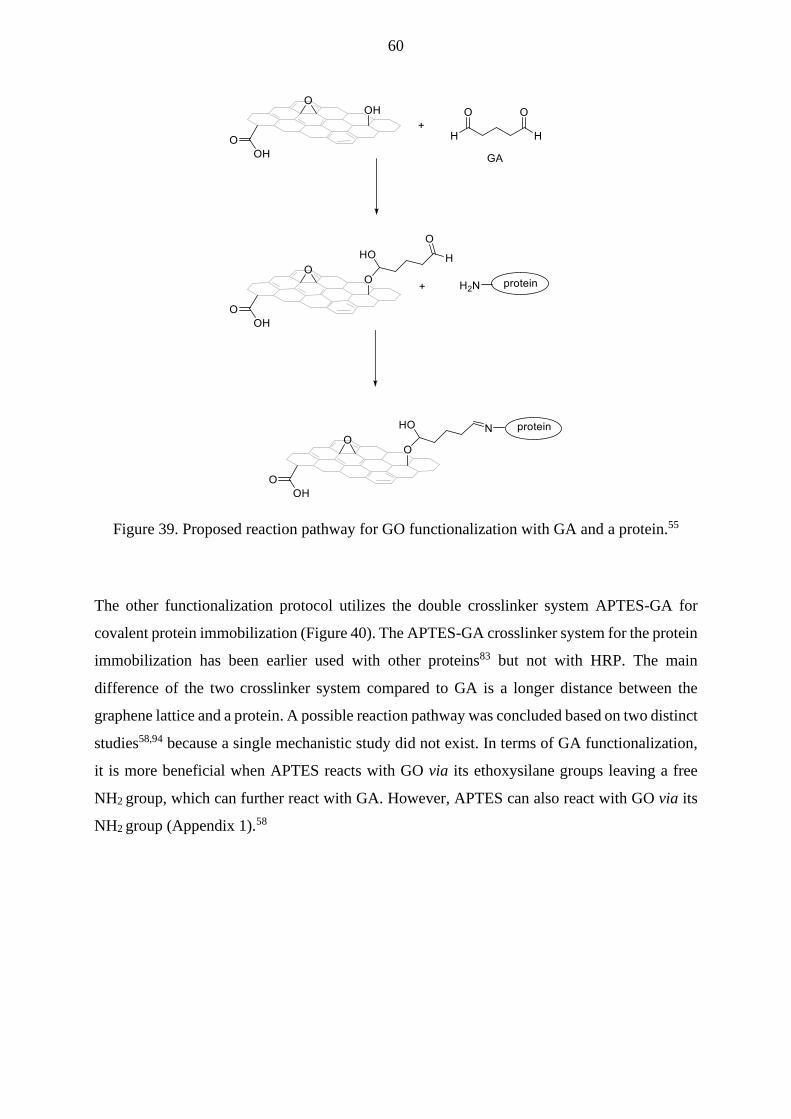
60
Figure 39. Proposed reaction pathway for GO functionalization with GA and a protein.55
The other functionalization protocol utilizes the double crosslinker system APTES-GA for
covalent protein immobilization (Figure 40). The APTES-GA crosslinker system for the protein
immobilization has been earlier used with other proteins83 but not with HRP. The main
difference of the two crosslinker system compared to GA is a longer distance between the
graphene lattice and a protein. A possible reaction pathway was concluded based on two distinct
studies58,94 because a single mechanistic study did not exist. In terms of GA functionalization,
it is more beneficial when APTES reacts with GO via its ethoxysilane groups leaving a free
NH2 group, which can further react with GA. However, APTES can also react with GO via its
NH2 group (Appendix 1).58

61
Figure 40. A proposed reaction pathway for GO functionalization with APTES, GA and
HRP.58,94
The GO-GA-HRP and the GO-APTES-GA-HRP flakes were prepared following the protocols
of the chosen articles.82,83 In the articles, different proteins were used; protease, transferase and
two types of peptides. In this project, an HRP enzyme was selected because of the previous
studies on non-covalent immobilization of HRP on laser-oxidized graphene.92 In the first
experiment of each protocol, some changes were made. In both methods, it was not explicitly
mentioned how the washing was done. Therefore, in the first experiment, the washing of the
GO-GA material was tried by rinsing it with PBS and filtrating it using a Büchner funnel. The
filtration was not successful because the GO material was trapped in the filter or went through
it. Hence, afterwards, the washing steps were performed using centrifugation.
In both methods, GO flakes were suspended to a solvent (PBS or ethanol) by sonication to
achieve fine black suspensions. Then, crosslinkers were added to GO suspensions. To avoid
damaging the protein conformation, sonication was not used afterwards. After the addition of
crosslinkers or HRP, some aggregates formed. Also, the GO-GA-HRP product tended to
precipitate quickly after mixing. The GO-APTES-GA-HRP end products behaved differently:
The product of the first batch precipitated, while the product of the second batch was suspended
evenly in the buffer. The dried end products from both methods appeared different; GO-GA-
HRP was a sticky black solid whereas GO-APTES-GA-HRP appeared as a fine black powder.
Figures from intermediate products are shown in Appendix 2.
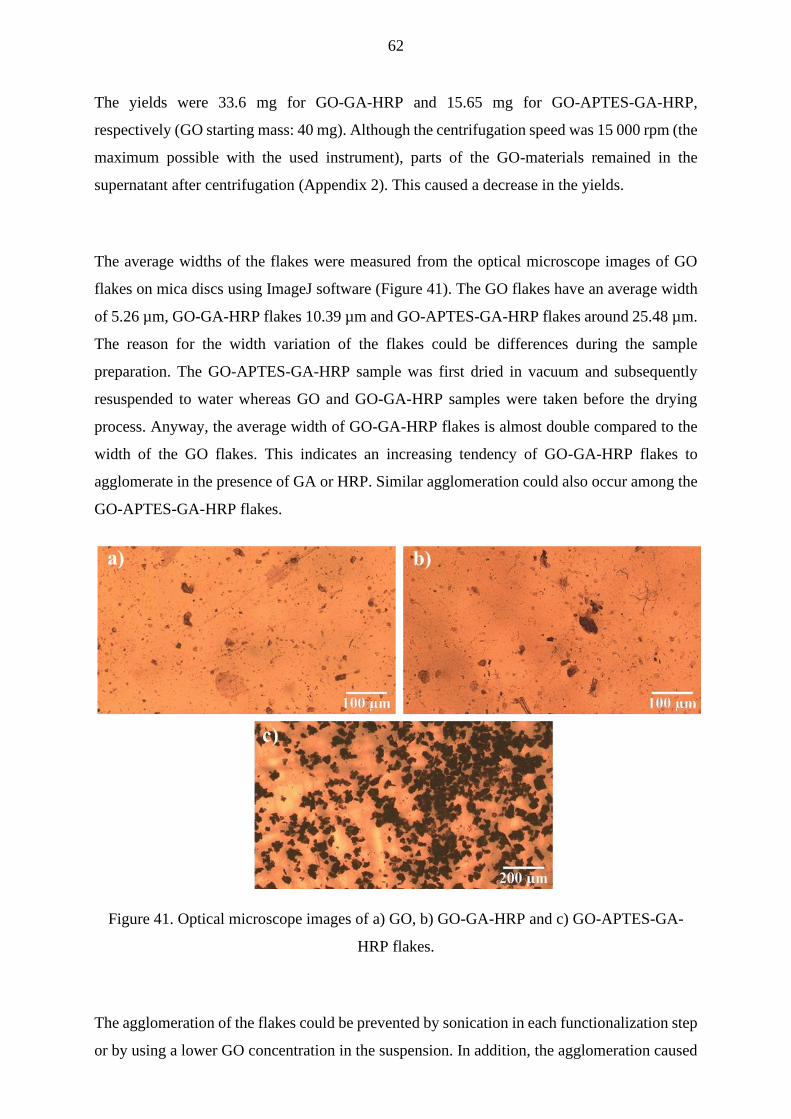
62
The yields were 33.6 mg for GO-GA-HRP and 15.65 mg for GO-APTES-GA-HRP,
respectively (GO starting mass: 40 mg). Although the centrifugation speed was 15 000 rpm (the
maximum possible with the used instrument), parts of the GO-materials remained in the
supernatant after centrifugation (Appendix 2). This caused a decrease in the yields.
The average widths of the flakes were measured from the optical microscope images of GO
flakes on mica discs using ImageJ software (Figure 41). The GO flakes have an average width
of 5.26 µm, GO-GA-HRP flakes 10.39 µm and GO-APTES-GA-HRP flakes around 25.48 µm.
The reason for the width variation of the flakes could be differences during the sample
preparation. The GO-APTES-GA-HRP sample was first dried in vacuum and subsequently
resuspended to water whereas GO and GO-GA-HRP samples were taken before the drying
process. Anyway, the average width of GO-GA-HRP flakes is almost double compared to the
width of the GO flakes. This indicates an increasing tendency of GO-GA-HRP flakes to
agglomerate in the presence of GA or HRP. Similar agglomeration could also occur among the
GO-APTES-GA-HRP flakes.
Figure 41. Optical microscope images of a) GO, b) GO-GA-HRP and c) GO-APTES-GA-
HRP flakes.
The agglomeration of the flakes could be prevented by sonication in each functionalization step
or by using a lower GO concentration in the suspension. In addition, the agglomeration caused

63
problems during AFM imaging of the dried GO flakes on a mica disc. The AFM images had a
bad quality, which could be due to the uneven topography of the GO flakes or their
agglomerates (Appendix 3). Also, liquid phase AFM was tried but the GO flakes moved
simultaneously with the tip. A lower concentration of GO and lesser agglomeration could
enhance the quality of AFM images of GO flakes.
9.1.1 FTIR
FTIR spectra were recorded at different stages of the functionalization. From the IR spectrum
of GO flakes, characteristic peaks for GO can be observed (Figure 42). Corresponding
vibrational modes and wavenumbers of the absorption bands are listed in Table 3. The hydroxyl
groups of GO induce three bands (3313 cm-1, 1375 cm-1 and 1040 cm-1) that correspond to O-
H stretching, O-H deformation and C-O stretching, respectively. The peak at 1720 cm-1 (C=O
stretching) and the broad absorption band between 3300-2600 cm-1 (O-H stretching) are from
the COOH groups. The aromatic π-system of GO causes the bands at 1610 cm-1 (C-C stretching)
and 871 cm-1 (C-H deformation). GO also contains some epoxy groups, whose C-O-C
stretching causes the band at 1168 cm-1.58,95,96
Figure 42. FTIR spectrum of the dried GO flakes.

64
Table 3. Absorption bands for vacuum-dried GO
The IR spectra of GO-GA differ significantly from the corresponding spectra in the
literature51,52 (Figure 43). There should be an absorption band at 2800-3000 cm-1 in the
spectrum of GO-GA caused by C-H stretching of the GA alkane chain.51 However, the
absorption band of OH group around 3200 cm-1 in the spectrum of GO-GA is so intense that it
could cover the peak of C-H stretching. In addition, C=O stretching band of the aldehydes
usually occur around 1700 cm-1, but in the spectrum of GO-GA the broad band at 1643 cm-1
could originate from it.
Figure 43. FTIR spectra of GO with crosslinkers.
Wavenumber (cm-1) Functional group Vibrational mode
3313 OH O-H stretching
3300-2600 COOH O-H stretching
3100-3000 aromatic system C-H stretching
1720 COOH C=O stretching
1610 aromatic system C=C stretching
1375 OH O-H deformation
1168 epoxy C-O stretching
1040 sec. alcohol C-OH stretching
871 aromatic system C-H deformation

65
APTES can react with the alcohol and carboxylic acid groups of GO, forming bonds between
silicon and oxygen atoms that can cause the absorption band at 1080 cm-1 (Si-O-C, Figure 41).97
The peak at 1002 cm-1 (Si-O-Si) indicates that APTES molecules have also reacted with each
other (Appendix 1). Hydrolysis of APTES can occur easily in the presence of ethanol and water
by cleavage of its ethoxy groups resulting in Si-OH stretching vibration at 920 cm-1.58,98 APTES
has one amino group at the end of its alkyl chain that could cause the absorption bands at
3348 cm-1 and 3276 cm-1 (asymmetric and symmetric N-H stretching, respectively) and at
1556 cm-1 and 1483 cm-1 (deformation of H-bonding). The peaks at 2925 cm-1 and 2862 cm-1
could be related to asymmetric and symmetric C-H stretching of the alkyl chain of APTES,
respectively.99 Based on the IR spectrum of GO-APTES, it could be concluded that APTES is
bound to GO covalently at least via its Si-atom. (Figure 43 and Table 4).
Table 4. Substantial absorption bands and related vibrations for vacuum-dried GO-APTES and
GO-APTES-GA
APTES could also react with the epoxy groups of GO via its amino group, which could be
unfavorable regarding GA functionalization. The weak absorption band at 1226 cm-1 indicates
C-N bonds between APTES and GO (Figure 43; Appendix 1).58,100 After GA functionalization
of GO-APTES, new peaks appear at 1699 cm-1 and 1633 cm-1, which could originate from
imine bonds100 between APTES and GA.94
For proteins, characteristic absorption bands originate from peptide bonds between amino acids.
Amide I absorption band in the range from 1600 cm-1 - 1700 cm-1 is the most intense peak for
Wavenumber
(cm-1)
Functional group Vibrational mode
GO-APTES
3348 NH2 N-H asymmetric stretching
3276 NH2 N-H symmetric stretching
2925 CH2 C-H asymmetric stretching
2862 CH2 C-H symmetric stretching
1556 and 1483 NH2 deformation (H-bonding)
1226 amine C-N stretching
1080 Si-containing groups of APTES Si-O-C
1002 Si-containing groups of APTES Si-O-Si
920 Si-containing groups of APTES Si-O stretching
GO-APTES-GA
1699 or 1633 imine C=N stretching

66
proteins, and it is induced by C=O and C-N stretching vibrations of amide groups. The amide
II absorption band appears in the region from 1510 cm-1 - 1580 cm-1, which derives mainly
from N-H bending in plane and C-N and C-C stretching vibrations.101 After HRP
immobilization on the GO-GA flakes, the IR spectrum changed significantly (Figure 44). A
new absorption band occurred at 1633 cm-1, which could be assigned to the amide I band of
HRP or originate from an imine bond between GA and HRP (C=N stretching). However, an
amide II band cannot be observed for the GO-GA-HRP product.
Figure 44. FTIR spectra from each step of HRP immobilization via GA.
Vibrations of the amide bonds of HRP are not as evident in the spectrum of GO-APTES-GA-
HRP (Figure 45) compared to GO-GA-HRP. In addition, the spectra of GO-APTES-GA and
GO-APTES-GA-HRP are almost identical. The peak at 1629 cm-1 of GO-APTES-GA-HRP
could be of the amide I band or originate from imine bonds between APTES and GA or GA
and HRP. Another peak at 1581 cm-1 indicating vibration of amide II could also originate from
the presence of HRP. Nonetheless, a similar band in the spectrum of GO-APTES-GA at 1575
cm-1 suggests that in the case of successful protein immobilization, a vibration in GO-APTES-
GA overlaps with the amide II vibration.

67
Figure 45. FTIR spectra from different stages of HRP immobilization via APTES and GA
crosslinkers.
The peaks at 1699 cm-1 and 1633 cm-1 of GO-APTES-GA were assigned to imine bonds earlier
in this thesis. Based on that, both bands at 1629 cm-1 (GO-APTES-GA-HRP) and 1633 cm-1
could result from imine bonds. This does not exclude amide I vibration of HRP at 1629 cm-1
because there was a similar peak (1633 cm-1) in the spectrum of GO-GA-HRP assigned to
originate probably from HRP (Table 5).
Table 5. Absorption bands of both HRP immobilized final products
Wavenumber (cm-1) Functional group Vibrational mode
GO-GA-HRP
3334 NH N-H stretching
1633 Amide I or imine C=O and C-N or C=N stretching
GO-APTES-GA-HRP
3342 NH of HRP (can also be
NH of unreacted APTES)
N-H stretching
1629 amide I of HRP or imine amide I: C=O and C-N stretching
or C=N
1581 amide II of HRP amide II: N-H bending (C-N, C-C
stretching)

68
In Figure 46, the spectra of both final products, GO-GA-HRP and GO-APTES-GA-HRP, are
presented for comparison. As can be seen, peaks originating from groups of HRP or imine
bonds between the crosslinkers and HRP correspond quite well to each other regardless of the
method. Differences in the spectra could be result from the use of different crosslinkers. The
bands at 1211 cm-1, 1195 cm-1, 752 cm-1 and 686 cm-1 occur only in the spectrum of GO-
APTES-GA-HRP indicating that the bands originate from APTES.
Figure 46. Comparison of the FTIR spectra of the final products.
In conclusion, both methods seem to work for covalent immobilization of HRP. The spectra of
the final products resemble each other in the imine and amide bond regions indicating
successful GA functionalization and/or covalent attachment of HRP to the GO-crosslinker
systems. However, in this region, the bands from HRP amide groups and imine linkages
between GA and HRP cannot be distinguished. The functional groups of APTES can be clearly
observed from the spectrum of GO-APTES but the presence of GA could not be fully proved.
At the end of the IR section, it is noteworthy that the intermediate and the final products were
centrifuged before each FTIR measurement. This further confirms the presence of covalent
interactions in the synthesized GO materials.

69
9.1.2 Raman
Three Raman spectra from each sample were recorded, and the spectra were normalized to the
G band. The spectra of GO and GO-APTES-GA-HRP were recorded at a laser power of 10 mW
and the spectra of GO-GA-HRP at a laser power of 0.5 mW. Average spectra of the samples
are presented in Figure 47. The GO-APTES-GA-HRP spectrum differs from the other samples
in the region of 2300 cm-1 - 3200 cm-1 and it cannot be evaluated reliably in that region. It could
be that GO-APTES-GA-HRP has only a 2D band or both 2D and D + G bands in that region.
Besides, there was a significant variation among three Raman spectra of GO-APTES-GA-HRP
than among the spectra of GO-GA-HRP (Appendix 4). Hence, the average spectrum of GO-
APTES-GA-HRP is not reliable. The variation could result from different flake sizes, stacking
of flakes together, as well as random distribution and number of functional groups, crosslinkers
and protein on the GO flake.102 Also, a higher laser power during the Raman measurements of
GO-APTES-GA-HRP can impact: The laser could induce additional damages in the graphene
lattice of the functionalized GO flakes.
Figure 47. Average Raman spectra of flake samples GO, GO-GA-HRP and GO-APTES-GA-
HRP.
The peak areas and shifts were defined by Origin peak fitting tool using the Lorentzian function.
AD/AG ratios of the flake samples are 2.2 (GO) and 1.8 (GO-GA-HRP and GO-APTES-GA-
HRP). Hence, there is a small difference between the functionalized samples and GO. Raman
shifts of D, G and 2D bands are quite similar for all samples (Table 6), except for the 2D and
D + G region of the GO-APTES-GA-HRP flakes, as described above. In conclusion, the lower
70
laser power for Raman measurements seemed to result in a better quality of the Raman spectra
from the functionalized GO flakes, and the spectra from the same sample differed less from
each other.
Table 6. Positions of D, G and 2D bands in the average Raman spectra of the flake samples
Sample D band (cm-1) G band (cm-1) 2D band (D + G) (cm-1)
GO 1351 1581 2722 (2924)
GO-GA-HRP 1351 1585 2720 (2926)
GO-APTES-GA-
HRP
1348 1583 2641
9.1.3 Thermogravimetric analysis
Thermogravimetric (TG) and differential scanning calorimetric (DSC) curves were measured
from the GO, GO-GA-HRP and GO-APTES-GA-HRP flake samples. By simultaneous
TG/DSC measurement, information about the amount of heat transferred in material (heat flow)
during each weight loss can be achieved. Earlier, TGA has been done from covalently
immobilized bovine serum albumin (BSA)29 and cytochrome-c (cyt-c)103 on the GO. The TG
curve of GO-BSA was a combination of the TG curves of pure GO, and BSA. Cyt-c was
covalently attached to GO via C6NH2 crosslinker. Thermal degradation of the crosslinked cyt-
c occurred at a higher temperature compared to the pure cyt-c. Previous studies motivated us to
carry out TGA from our samples. The measurements aimed find out if the functionalized GO
materials have different thermal behavior compared to pure GO. Besides, it was interesting to
observe possible differences in the thermal behavior between the final products of the two
immobilization methods.
TG (line) and DSC (dash line) curves of the samples are presented in Figure 48. In addition, the
temperatures of the DSC peak maxima are shown for the two main thermal degradations of
each sample. In the text, the temperature for thermal degradation is abbreviated as Td.

71
Below 100 ºC, all samples start to lose weight, which is defined as evaporation of absorbed
water from GO materials.104 GO loses 15 % of its weight in the temperature range of 22 - 151
ºC. GO-GA-HRP and GO-APTES-GA-HRP have similar weight losses in the temperature
ranges of 22 - 128 ºC (14 wt-%) and 22-137 ºC (9 wt-%).
Figure 48. TG/DSC curves (line and dash line, respectively) of GO (blue), GO-GA-HRP (red)
and GO-APTES-GA-HRP (green) with temperatures for the main thermal degradations.
GO has 24 % weight loss at 197 ºC (151 - 229 ºC ) that signifies the removal of oxygen-
containing functional groups and reduction of GO.104 The main weight loss, 43 wt-%, occurs at
537 ºC (466 ºC - 634 ºC) indicating the removal of more stable functional groups leading to
almost complete decomposition of GO. Oxygen-containing functional groups are evaporated
from GO in the form of H2O, CO2 and CO molecules under air atmosphere.103,104
The GO and GO-GA-HRP samples have quite similar shaped TG curves whereas GO-APTES-
GA-HRP has substantially deviating thermal behavior making it thermally the most stable. GO-
GA-HRP has a 20 % weight loss at 159 ºC (128 - 201 ºC), and GO-APTES-GA-HRP has a
12 % weight loss at 182 ºC (137 - 214 ºC). These thermal degradations could partly result from
the same reasons as in the case of GO. However, the lower Td of the HRP immobilized GO
samples indicate the presence of weaker bonds compared to pure GO.104 Besides, the lower

72
weight loss of GO-APTES-GA-HRP around 200 ºC compared with GO can result from a lower
amount of oxygen-containing functional groups in GO-APTES-GA-HRP which can decompose
at this temperature range.58 The epoxy groups of GO tend to decompose before hydroxyl
groups.105 Therefore, the thermal behavior of GO-APTES-GA-HRP indicates that the epoxy
groups of GO have reacted with APTES. Serodre et al.58 have observed a similar behavior
between GO and GO-APTES materials from TGA measurements under inert nitrogen
atmosphere (heating rate 5 ºC/min).
There is no uniformity in Td of the main weight losses of the samples. GO-GA-HRP has a lower
Td of 473 ºC for 42 % weight loss (380 - 552 ºC), and GO-APTES-GA-HRP has a higher Td of
608 ºC for 37 % weight loss (453 - 706 ºC) than GO (537 ºC). An explanation for the lower
value of GO-GA-HRP could be the same as in the weight loss at 159 ºC: more weak interactions
in the system. The higher Td of GO-APTES-GA-HRP indicates stronger interactions104 that
could result from the incorporation of APTES. Unlike other samples, GO-APTES-GA-HRP
has relatively high weight loss (22 %) in the range of 214 ºC - 453 ºC, possibly originating from
the decomposition of oxygen and nitrogen-containing groups of APTES.58 In addition, the main
thermal degradation of GO-APTES-GA-HRP contains more endothermic than exothermic
degradation (DSC curve, Figure 48).
It is also noteworthy that the functionalized GO materials have significantly greater residual
weights than GO which has 2.7 wt-% above 634 ºC. The residual weight of GO-GA-HRP is
15 wt-% above 552 ºC and for GO-APTES-GA-HRP 20 wt-% above 706 ºC. These additional
residues in the functionalized GO materials could be incombustible carbon material from the
crosslinkers and HRP.
Scientific literature about the thermal degradation of pure HRP does not exist. HRP has a
melting temperature of 76 ºC90 (denaturation), but it is not useful in this context because melting
does not cause weight loss to a TG curve. Although melting is always an endothermic process,
it is hard to observe from the DSC curves of GO-GA-HRP and GO-APTES-GA-HRP. Hence,
based on TGA, neither the degradation nor the presence of HRP can be concluded. Based on
TG/DSC results, however, it can be concluded that APTES has reacted with GO via its epoxy
groups. Also, the thermal behavior of both final products is different from pure GO and each
other.

73
9.2 Immobilization of HRP on the graphene-based microchip
HRP immobilization on the laser-oxidized chip was accomplished by using GA as a
crosslinker.82 The chip consisted of a graphene monolayer on top of a silicon/silicon dioxide
(300 nm) substrate. The graphene was oxidized via two-photon laser-oxidization22, the pattern
of which is shown in Figure 49. The chip was characterized by AFM imaging and Raman
spectroscopy of the oxidized chip before and after HRP immobilization via GA crosslinker.
Figure 49. Schematic presentation of the laser oxidized chip showing laser pulse energies and
irradiation times of two-photon laser-oxidation. Black squares illustrate oxidized areas.
The oxidized chip was incubated in PBS-GA solution for 4 h at RT (pH 7.3) protected from
light to prevent light-induced GA polymerization. A low concentration of GA solution (8 %
v/v) for the functionalization was used to minimize GA polymerization. The chip was washed
with PBS to remove an excess of GA. The GA functionalized chip was incubated in PBS
solution of HRP for 1h at the same conditions as in the first step. The concentration of HRP
solution (0.625 U/mL) was the same used earlier in the non-covalent HRP immobilization on
oxidized chip.106

74
It was hypothesized based on the preliminary studies with GO flakes that GA would react
covalently with GO and further with HRP. Therefore, it was assumed that GA and HRP would
prefer the oxidized areas of the chip compared to non-oxidized, pristine graphene.
9.2.1 AFM
The chip contained two oxidized areas, 1C and 8I. Based on AFM images of area 1C, the
graphene layer was partly exfoliated during GA functionalization or HRP immobilization steps
(Appendix 5). Raman measurements showed that the material below the peeled graphene was
the silica layer (Appendix 5). Hence, further analysis was focused on the area 8I. As can be
seen from the AFM images (Figure 50 a and b), dots and line-shaped structures occur after HRP
immobilization, which could derive from HRP and GA polymer chains, respectively.
Figure 50. AFM height sensor images of the oxidized chip (8I area) a) before and b) after
HRP immobilization. c) Height profiles of squares with different exposure times and laser
pulse energies. (*: The heights are 12 nm (0.2 s, 35 pJ), 8 nm (0.5 s, 35 pJ) and 9 nm (1.0 s,
25 pJ))
75
Height profiles of the oxidized chip before and after functionalization with different laser pulse
energies are presented in Figure 50 c. It is noteworthy that the following height measurements
show the relative heights of the oxidized squares and particles regarding the graphene
background. Hence, the measured heights are not absolute heights of the squares. The heights
of the oxidized squares vary between different graphene oxidation stages due to different laser-
oxidation conditions. After HRP immobilization, the heights of the oxidized areas are almost
double with irradiation times of 0.2 s - 0.8 s and laser pulse energies of 40 pJ -35 pJ. With
higher irradiation times (0.8 s -1.5 s), the heights of the oxidized areas are almost the same as
before immobilization or even slightly lower. Based on these observations, it seems that HRP
preferred oxidized graphene induced by 40 pJ and 35 pJ laser pulses with low irradiation times
(0.2 s and 0.5 s) compared to the other oxidized areas.
The number of dots for the most favorable oxidized regions were calculated from Figure 51a.
The amounts were 32 (40 pJ, 0.2 s), 31 (40 pJ, 0.5 s), 20 (35 pJ, 0.2 s) and 50 (35 pJ, 0.5 s),
respectively. Crosslinkers (line-shaped structures) located more on the oxidized squares than
on graphene (Figure 51b), and there were no significant differences between oxidized regions.
The average cross-sections of the dots and line-shaped structures were measured by Nanoscope
analysis software using section tool, and the whole chip was considered. The average cross-
sections were 15.19 nm and 2.92 nm for the dots and lines, respectively. The presence of HRP
and GA on the surface of the chip could be concluded based on the AFM results. HRP preferred
the graphene oxidized by 40 pJ and 35 pJ laser pulses and 0.2 s and 0.5 s irradiation times,
whereas GA crosslinkers preferred oxidized graphene over pristine graphene (Figure 51).

76
Figure 51. a) Distribution of the dots on the oxidized areas of 40 pJ and 35 pJ pulse energies
and 0.2 s and 0.5 s irradiation times. b) Distribution of the line structures on the oxidized
graphene induced by 30 pJ and 25 pJ laser pulse energies and 0.8 s and 1.0 s irradiation times.
9.2.2 Raman mapping
Raman mapping for the oxidized chip before and after GA and HRP treatments was done by a
home-built Raman setup. Raman spectra were achieved from Raman maps by averaging three
spectra from each oxidized square. As in the Raman spectra of the flake samples, D, G and 2D
bands can be observed (Figure 52). In addition, there are weak G + D bands in the spectra of
the squares, which were oxidized by laser pulse energy of 40 pJ (Figure 52 left). D, G and 2D
bands shift to lower values after immobilization regardless of different oxidation conditions of
the laser oxidation. The shift could be results from an increased electron density in the graphene
lattice, originated by electron-donating interactions after functionalization.107 Similar results
have been observed in earlier studies of HRP immobilization on oxidized graphene-based chips
via weak interactions.106 However, especially the G band shifts are larger for covalent than non-
covalent HRP immobilization.
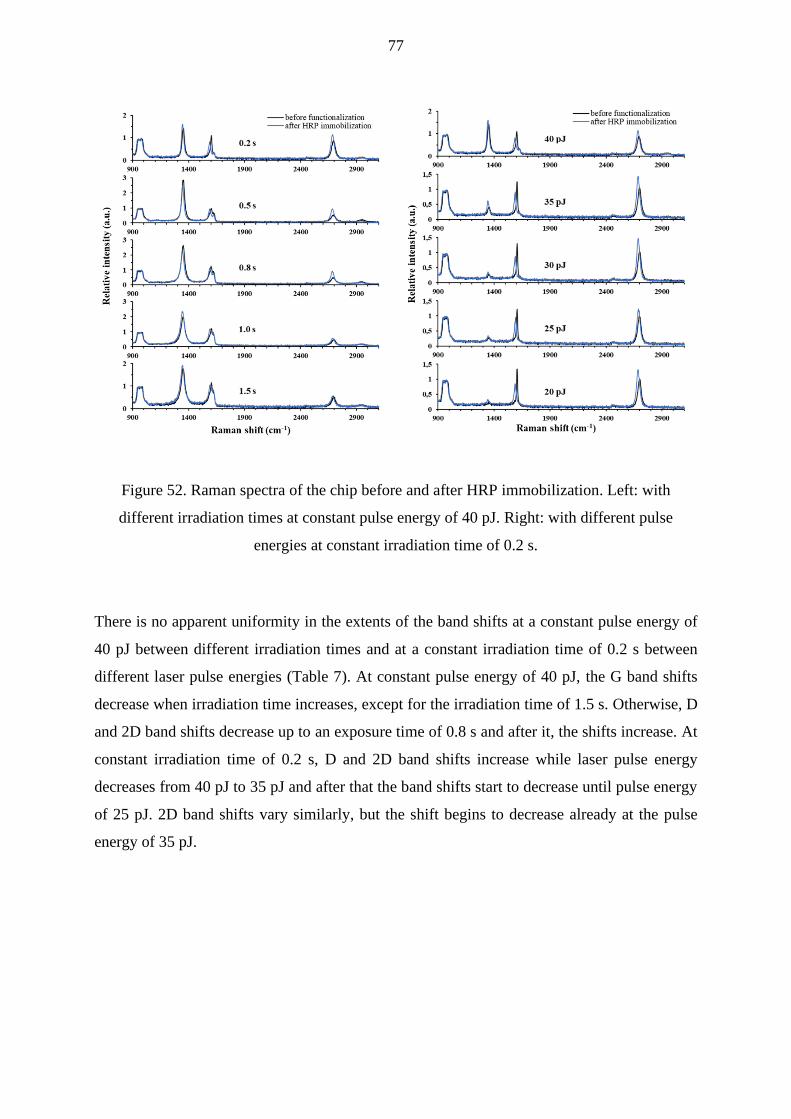
77
Figure 52. Raman spectra of the chip before and after HRP immobilization. Left: with
different irradiation times at constant pulse energy of 40 pJ. Right: with different pulse
energies at constant irradiation time of 0.2 s.
There is no apparent uniformity in the extents of the band shifts at a constant pulse energy of
40 pJ between different irradiation times and at a constant irradiation time of 0.2 s between
different laser pulse energies (Table 7). At constant pulse energy of 40 pJ, the G band shifts
decrease when irradiation time increases, except for the irradiation time of 1.5 s. Otherwise, D
and 2D band shifts decrease up to an exposure time of 0.8 s and after it, the shifts increase. At
constant irradiation time of 0.2 s, D and 2D band shifts increase while laser pulse energy
decreases from 40 pJ to 35 pJ and after that the band shifts start to decrease until pulse energy
of 25 pJ. 2D band shifts vary similarly, but the shift begins to decrease already at the pulse
energy of 35 pJ.

78
Table 7. D, G and 2D band shifts after functionalization with GA and HRP for different laser-
oxidation conditions
D band shift
(cm1)
G band shift
(cm1)
2D band shift
(cm1)
Constant pulse energy of 40 pJ
Irradiation time (s)
0.2 -6.2 -14.8 -10.1
0.5 -5.6 -13.2 -9.9
0.8 -4.9 -8.6 -8.5
1.0 -5.5 -6.0 -11.0
1.5 -6.4 -6.1 -11.6
Constant irradiation time of 0.2 s
Pulse energy (pJ)
40 -6.2 -14.8 -10.1
35 -8.6 -17.6 -14.2
30 -8.0 -18.1 -13.4
25 -6.6 -14.6 -9.8
20 -9.7 -17.4 -14.6
The differences in the G and 2D band shifts were observed both from the flake samples and the
chip. G band shifts of the GO flakes and the oxidized regions of the chip differed ~ 20 cm-1
from each other before HRP immobilization and ≤ 10 cm-1 after the immobilization (Appendix
6). In proportion, there was almost ~ 100 cm-1 difference between the GO flakes and the chip
before and after HRP immobilization. On the other hand, D bands of the flakes and the chip
before and after HRP immobilization had almost the same Raman shifts (difference ≤ 6 cm-1
between the flakes and the chip).
AD/AG ratios before and after HRP immobilization at a constant pulse energy of 40 pJ decrease
slightly as irradiation time decreases, except for irradiation times of 0.2 s and 0.5 s (Table 8).
Although AD/AG ratios after HRP immobilization are slightly lower than before, there are no
significant differences. Besides, at a constant irradiation time of 0.2 s, the AD/AG ratio decrease
as laser pulse energy decreases but the difference before and after HRP immobilization is small.

79
Table 8. AD/AG ratios before and after functionalization/HRP immobilization
AD/AG before AD/AG after
Constant pulse energy of 40 pJ
Irradiation time (s)
0.2 1.8 1.9
0.5 2.7 2.3
0.8 2.2 1.8
1.0 1.9 1.7
1.5 1.8 1.7
Constant irradiation time of 0.2 s
Pulse energy (pJ)
40 1.8 1.9
35 0.4 0.6
30 0.2 0.3
25 0.2 0.3
20 0.1 0.2
When AD/AG ratios of the chip experiments at a constant laser pulse energy of 40 pJ (Table 8)
are compared with the flake results, there seem to be small differences. AD/AG ratio of GO
flakes was 2.2 and for the GO-GA-HRP flakes was 1.8, which is exactly the same as in the chip
results at irradiation time of 0.8 s (Table 8). In addition, the AD/AG ratios at constant irradiation
time of 0.2 s are lower than AD/AG ratios of the flakes or oxidized areas of the chip at a constant
pulse energy of 40 pJ (except for the highest pulse energy).
The D band areas for the chip before and after HRP immobilization are shown in the Raman
maps below (Figures 53 a and b, respectively). The areas of the D bands increase after HRP
immobilization. This could indicate a larger number of defects in the graphene lattice, resulting
from the change in the hybridization of carbons (sp2 to sp3).30

80
Figure 53. Raman maps of D band areas of the oxidized chip a) before and b) after HRP
immobilization.
In conclusion, D, G, and 2D bands shifted to lower Raman shift values after HRP
immobilization. In addition, the oxidation degree of the graphene layer seems to have no impact
on the band shifts before and after HRP immobilization. The D band areas of the oxidized
regions increased after HRP immobilization via GA crosslinker, indicating an increase in
defects of the graphene lattice. Comparing the experiments with flakes and the chip shows a
similar trend in the band shifts. Also, AD/AG ratios can be compared between the experiments
at specific laser-oxidation conditions. Therefore, the flakes are a suitable model system for chip
experiments.
81
10. Conclusions
The experimental part aimed at the covalent attachment of the HRP enzyme on the oxidized
graphene surface using two crosslinker systems: GA and APTES-GA. Preliminary studies were
performed with GO flakes, and based on them, HRP immobilization via GA crosslinker on a
laser-oxidized graphene-based chip was performed.
The successful covalent immobilization of HRP on GO flakes with both crosslinker systems
was proved by FTIR spectroscopy. No significant differences in the HRP immobilization
outcome between the two crosslinker systems were observed. However, it could not be
concluded if the peaks 1629 cm-1 and 1633 cm-1 originated from the amide group of HRP or
imine bonds from the crosslinking reaction (samples GO-APTES-GA-HRP and GO-GA-HRP).
The TGA results supported the success of covalent functionalization. Each final product and
GO showed different thermal behavior. Especially notable is the thermal degradation of GO-
APTES-GA-HRP: It strongly differs from GO and GO-GA-HRP, indicating the presence of
more stable bonds due to the incorporation of APTES into the system.
In the AFM images of the graphene-based microchip, elevated dots and line-shaped structures
could be observed after GA and HRP treatment, assigned to be HRP enzymes and GA
crosslinkers, respectively. HRP seemed to have no preference towards the oxidized areas
compared to pristine graphene, whereas GA crosslinkers were located more on the oxidized
areas. The covalent HRP immobilization on the oxidized areas of the chip could not be proved
by AFM. The Raman spectra of the oxidized areas showed shifting of the D, G and 2D bands
towards lower Raman shifts after HRP immobilization. These results agree with the former
results, indicating a successful immobilization of HRP. Also, the D band areas of the oxidized
regions increased after HRP immobilization, which suggests an increased number of defects in
the graphene lattice.
Based on the results from the experiments with the GO flakes and the chip, it could not be fully
proved that HRP was covalently attached to GO via GA crosslinker. The IR results of the flakes
indicated that covalent bonds formed in the GO-GA-HRP system. However, AFM and Raman
data of the chip did not unambiguously support this. In the future, chip experiments with other
82
crosslinker systems, such as APTES-GA, should be done. AFM imaging should also be
performed after every step of the protein immobilization to facilitate interpretation of AFM
images. In the future experiments, the optimal oxidation conditions for the chip observed in the
experiments (laser pulse energies of 40 pJ and 35 pJ and irradiation times of 0.2 s and 0.5 s)
should be used.
The preparation process of the flakes must be developed further to achieve more reliable results
from Raman and AFM measurements of pure and functionalized GO flakes. A lower
concentration of GO in the suspension and sonication in every step could reduce the
agglomeration of GO flakes. Also, better methods to detect HRP from the samples should be
figured out. In biology, the detection of HRP has been done by the chemiluminescence detection
method. The detection is based on the oxidation reaction where HRP oxidizes its
chemiluminescent substrate, luminol, in the presence of peroxide. The oxidized form of luminol
can emit light at 425 nm, which can be detected by a CCD camera (commonly used in
biology).108 This could also be possible for HRP detection from the graphene-based chip, but
the method’s applicability should be explored more carefully.
It is still unknown if the protein type affects the success of the covalent protein immobilization
on GO. The type and number of amino acid side chains among different proteins vary, which
could impact the reactivity of proteins with GO materials. Hence, the variation of both protein
and crosslinker - or even the covalent immobilization without crosslinker - remains a topic of
interest with many open questions to study.

83
References
1. Singh, D. P.; Herrera, C. E.; Singh, B.; Singh, S.; Singh, R. K. and Kumar, R., Graphene
oxide: An efficient material and recent approach for biotechnological and biomedical
applications, Mater. Sci. Eng. C, 2018, 86, 173–197.
2. Nanda, S. S.; Papaefthymiou, G. C. and Yi, D. K., Functionalization of Graphene Oxide
and its Biomedical Applications, Crit. Rev. Solid State Mater. Sci., 2015, 40, 291–315.
3. Raslan, A.; Saenz del Burgo, L.; Ciriza, J. and Pedraz, J. L., Graphene oxide and reduced
graphene oxide-based scaffolds in regenerative medicine, Int. J. Pharm., 2020, 580,
119226.
4. Kostarelos, K.; Vincent, M.; Hebert, C. and Garrido, J. A., Graphene in the Design and
Engineering of Next-Generation Neural Interfaces, Adv. Mater., 2017, 29, 1700909.
5. Reddy, S.; Xu, X.; Guo, T.; Zhu, R.; He, L. and Ramakrishana, S., Allotropic carbon
(graphene oxide and reduced graphene oxide) based biomaterials for neural regeneration,
Curr. Opin. Biomed. Eng., 2018, 6, 120–129.
6. Dreyer, D. R.; Park, S.; Bielawski, C. W. and Ruoff, R. S., The chemistry of graphene
oxide, Chem. Soc. Rev., 2010, 39, 228–240.
7. Wang, Y.; Li, Z.; Wang, J.; Li, J. and Lin, Y., Graphene and graphene oxide:
biofunctionalization and applications in biotechnology, Trends Biotechnol., 2011, 29,
205–212.
8. Chen, Z.-L.; Kam, F.-Y.; Goh, R. G.-S.; Song, J.; Lim, G.-K. and Chua, L.-L., Influence
of Graphite Source on Chemical Oxidative Reactivity, Chem. Mater., 2013, 25, 2944–
2949.
9. Chua, C. K.; Sofer, Z. and Pumera, M., Graphite Oxides: Effects of Permanganate and
Chlorate Oxidants on the Oxygen Composition, Chem. - A Eur. J., 2012, 18, 13453–
13459.
10. He, H.; Klinowski, J.; Forster, M. and Lerf, A., A new structural model for graphite oxide,
Chem. Phys. Lett., 1998, 287, 53–56.
11. Lerf, A.; He, H.; Forster, M. and Klinowski, J., Structure of Graphite Oxide RevisitedII,
J. Phys. Chem. B, 1998, 102, 4477–4482.

84
12. Aliyev, E.; Filiz, V.; Khan, M. M.; Lee, Y. J.; Abetz, C. and Abetz, V., Structural
Characterization of Graphene Oxide: Surface Functional Groups and Fractionated
Oxidative Debris, Nanomaterials, 2019, 9, 1180.
13. Hofmann, U. and Holst, R., Über die Säurenatur und die Methylierung von Graphitoxyd,
Berichte der Dtsch. Chem. Gesellschaft (A and B Series), 1939, 72, 754–771.
14. Ruess, G., Über das Graphitoxyhydroxyd (Graphitoxyd), Monatshefte für Chemie, 1947,
76, 381–417.
15. Scholz, W. and Boehm, H. P., Untersuchungen am Graphitoxid. VI. Betrachtungen zur
Struktur des Graphitoxids, Zeitschrift für Anorg. und Allg. Chemie, 1969, 369, 327–340.
16. Szabó, T.; Berkesi, O.; Forgó, P.; Josepovits, K.; Sanakis, Y.; Petridis, D. and Dékány,
I., Evolution of surface functional groups in a series of progressively oxidized graphite
oxides, Chem. Mater., 2006, 18, 2740–2749.
17. Erickson, K.; Erni, R.; Lee, Z.; Alem, N.; Gannett, W. and Zettl, A., Determination of
the Local Chemical Structure of Graphene Oxide and Reduced Graphene Oxide, Adv.
Mater., 2010, 22, 4467–4472.
18. Hummers, W. S. and Offeman, R. E., Preparation of Graphitic Oxide, J. Am. Chem. Soc.,
1958, 80, 1339–1339.
19. Marcano, D. C.; Kosynkin, D. V.; Berlin, J. M.; Sinitskii, A.; Sun, Z.; Slesarev, A.;
Alemany, L. B.; Lu, W. and Tour, J. M., Improved Synthesis of Graphene Oxide, ACS
Nano, 2010, 4, 4806–4814.
20. Yu, H.; Zhang, B.; Bulin, C.; Li, R. and Xing, R., High-efficient Synthesis of Graphene
Oxide Based on Improved Hummers Method, Sci. Rep., 2016, 6, 36143.
21. Aumanen, J.; Johansson, A.; Koivistoinen, J.; Myllyperkiö, P. and Pettersson, M.,
Patterning and tuning of electrical and optical properties of graphene by laser induced
two-photon oxidation, Nanoscale, 2015, 7, 2851–2855.
22. Koivistoinen, J.; Sladkova, L.; Aumanen, J.; Koskinen, P.; Roberts, K.; Johansson, A.;
Myllyperkiö, P. and Pettersson, M., From Seeds to Islands: Growth of Oxidized
Graphene by Two-Photon Oxidation, J. Phys. Chem. C, 2016, 22330–22341.
23. Johansson, A.; Tsai, H.-C.; Aumanen, J.; Koivistoinen, J.; Myllyperkiö, P.; Hung, Y.-Z.;
85
Chuang, M.-C.; Chen, C.-H.; Woon, W. Y. and Pettersson, M., Chemical composition
of two-photon oxidized graphene, Carbon N. Y., 2017, 115, 77–82.
24. Dreyer, D. R.; Todd, A. D. and Bielawski, C. W., Harnessing the chemistry of graphene
oxide, Chem. Soc. Rev., 2014, 43, 5288–5301.
25. Zhang, Y.; Wu, C.; Guo, S. and Zhang, J., Interactions of graphene and graphene oxide
with proteins and peptides, Nanotechnol. Rev., 2013, 2, 27–45.
26. Konkena, B. and Vasudevan, S., Understanding Aqueous Dispersibility of Graphene
Oxide and Reduced Graphene Oxide through pKa Measurements, J. Phys. Chem. Lett.,
2012, 3, 867–872.
27. Tiwari, A.; Syväjärvi, M. and Rvi, M., Graphene Materials : Fundamentals and
Emerging Applications, 1st ed., John Wiley & Sons, Incorporated, 2015, pp. 108-109.
28. Liu, L.; Zhang, R.; Liu, Y.; Tan, W. and Zhu, G., Insight into hydrogen bonds and
characterization of interlayer spacing of hydrated graphene oxide, J. Mol. Model., 2018,
24, 137.
29. Shen, J.; Shi, M.; Yan, B.; Ma, H.; Li, N.; Hu, Y. and Ye, M., Covalent attaching protein
to graphene oxide via diimide-activated amidation, Colloids Surfaces B Biointerfaces,
2010, 81, 434–438.
30. Childres, I.; Jaureguib, L. A.; Park, W.; Cao, H.; Chen, Y. P. Jang, J. I., New
Developments in Photon and Materials Research, Chapter 19: Raman spectroscopy of
graphene and related materials, Nova Science Publishers, USA, 2013.
31. Georgakilas, V.; Otyepka, M.; Bourlinos, A. B.; Chandra, V.; Kim, N.; Kemp, K. C.;
Hobza, P.; Zboril, R. and Kim, K. S., Functionalization of Graphene: Covalent and Non-
Covalent Approaches, Derivatives and Applications, Chem. Rev., 2012, 112, 6156–6214.
32. Hernández-Cancel, G.; Suazo-Dávila, D.; Ojeda-Cruzado, A. J.; García-Torres, D.;
Cabrera, C. R. and Griebenow, K., Graphene oxide as a protein matrix: influence on
protein biophysical properties, J. Nanobiotechnology, 2015, 13, 70.
33. Nelson, D. L. and Cox, M. M., Lehninger Principles of Biochemistry, 6th ed., W. H.
Freeman and Company, New York, 2013, a) pp. 76-89, b) pp. 115-142.
34. Rabe, M.; Verdes, D. and Seeger, S., Understanding protein adsorption phenomena at

86
solid surfaces, Adv. Colloid Interface Sci., 2011, 162, 87–106.
35. Georgakilas, V.; Tiwari, J. N.; Kemp, K. C.; Perman, J. A.; Bourlinos, A. B.; Kim, K. S.
and Zboril, R., Noncovalent Functionalization of Graphene and Graphene Oxide for
Energy Materials, Biosensing, Catalytic, and Biomedical Applications, Chem. Rev.,
2016, 116, 5464–5519.
36. Zhang, M.; Yin, B.-C.; Wang, X.-F. and Ye, B.-C., Interaction of peptides with graphene
oxide and its application for real-time monitoring of protease activity, Chem. Commun.,
2011, 47, 2399–2401.
37. Zhang, J.; Zhang, F.; Yang, H.; Huang, X.; Liu, H.; Zhang, J. and Guo, S., Graphene
Oxide as a Matrix for Enzyme Immobilization, Langmuir, 2010, 26, 6083–6085.
38. Kuchlyan, J.; Kundu, N.; Banik, D.; Roy, A. and Sarkar, N., Spectroscopy and
Fluorescence Lifetime Imaging Microscopy To Probe the Interaction of Bovine Serum
Albumin with Graphene Oxide, Langmuir, 2015, 31, 13793–13801.
39. Zhang, Y.; Zhang, J.; Huang, X.; Zhou, X.; Wu, H. and Guo, S., Assembly of Graphene
Oxide-Enzyme Conjugates through Hydrophobic Interaction, Small, 2012, 8, 154–159.
40. Sun, C.; Walker, K. L.; Wakefield, D. L. and Dichtel, W. R., Retaining the Activity of
Enzymes and Fluorophores Attached to Graphene Oxide, Chem. Mater., 2015, 27, 4499–
4504.
41. Rosen, C. B. and Francis, M. B., Targeting the N terminus for site-selective protein
modification, Nat. Chem. Biol., 2017, 13, 697–705.
42. Hoyt, E. A.; Cal, P. M. S. D.; Oliveira, B. L. and Bernardes, G. J. L., Contemporary
approaches to site-selective protein modification, Nat. Rev. Chem., 2019, 3, 147–171.
43. Li, D.; Zhang, W.; Yu, X.; Wang, Z.; Su, Z. and Wei, G., When biomolecules meet
graphene: from molecular level interactions to material design and applications,
Nanoscale, 2016, 8, 19491–19509.
44. Camarero, J. A., Recent developments in the site-specific immobilization of proteins
onto solid supports, Biopolymers, 2008, 90, 450–458.
45. Jiang, K.; Schadler, L. S.; Siegel, R. W.; Zhang, X.; Zhang, H. and Terrones, M., Protein
immobilization on carbon nanotubes via a two-step process of diimide-activated

87
amidation, J. Mater. Chem., 2004, 14, 37.
46. Vacchi, I. A.; Spinato, C.; Raya, J.; Bianco, A. and Ménard-Moyon, C., Chemical
reactivity of graphene oxide towards amines elucidated by solid-state NMR, Nanoscale,
2016, 8, 13714–13721.
47. Imani, R.; Emami, S. H. and Faghihi, S., Nano-graphene oxide carboxylation for
efficient bioconjugation applications: a quantitative optimization approach, J.
Nanoparticle Res., 2015, 17, 88.
48. Guo, S.; Raya, J.; Ji, D.; Nishina, Y.; Ménard-Moyon, C. and Bianco, A., Is
carboxylation an efficient method for graphene oxide functionalization?, Nanoscale Adv.,
2020, 2, 4085–4092.
49. Salvio, R.; Krabbenborg, S.; Naber, W. J. M.; Velders, A. H.; Reinhoudt, D. N. and van
der Wiel, W. G., The Formation of Large-Area Conducting Graphene-Like Platelets,
Chem. - A Eur. J., 2009, 15, 8235–8240.
50. Migneault, I.; Dartiguenave, C.; Bertrand, M. J. and Waldron, K. C., Glutaraldehyde:
behavior in aqueous solution, reaction with proteins, and application to enzyme
crosslinking, Biotechniques, 2018, 37, 790–802.
51. Tan, Y.; Song, Y. and Zheng, Q., Facile regulation of glutaraldehyde-modified graphene
oxide for preparing free-standing papers and nanocomposite films, Chinese J. Polym.
Sci., 2013, 31, 399–406.
52. Hu, N.; Meng, L.; Gao, R.; Wang, Y.; Chai, J.; Yang, Z.; Kong, E. S.-W. and Zhang, Y.,
A Facile Route for the Large Scale Fabrication of Graphene Oxide Papers and Their
Mechanical Enhancement by Cross-linking with Glutaraldehyde, Nano-Micro Lett.,
2011, 3, 215–222.
53. Clayden, Jonathan; Greeves, Nick; Warren, S., Organic chemistry, 2nd ed., Oxford
University press, New York, 2012, pp. 136-137 and 302-327.
54. Hua, D.; Rai, R. K.; Zhang, Y. and Chung, T.-S., Aldehyde functionalized graphene
oxide frameworks as robust membrane materials for pervaporative alcohol dehydration,
Chem. Eng. Sci., 2017, 161, 341–349.
55. Shariat, S. Z. A. S.; Borzouee, F.; Mofid, M. R. and Varshosaz, J., Immobilization of

88
lactoperoxidase on graphene oxide nanosheets with improved activity and stability,
Biotechnol. Lett., 2018, 40, 1343–1353.
56. Habeeb, A. F. S. A. and Hiramoto, R., Reaction of proteins with glutaraldehyde, Arch.
Biochem. Biophys., 1968, 126, 16–26.
57. Hermanson, G. T., Bioconjugate techniques, 3rd ed., Academic Press, London, 2013, a)
pp. 292-294, b) pp. 535-537, c) pp. 769-774, d) pp. 6-15.
58. Serodre, T.; Oliveira, N.; Miquita, D.; Ferreira, M.; Santos, A.; Resende, V. and Furtado,
C., Surface Silanization of Graphene Oxide Under Mild Reaction Conditions, J. Braz.
Chem. Soc., 2019.
59. Kashefi, S.; Borghei, S. M. and Mahmoodi, N. M., Covalently immobilized laccase onto
graphene oxide nanosheets: Preparation, characterization, and biodegradation of azo
dyes in colored wastewater, J. Mol. Liq., 2019, 276, 153–162.
60. Kolb, H. C.; Finn, M. G. and Sharpless, K. B., Click Chemistry: Diverse Chemical
Function from a Few Good Reactions, Angew. Chemie Int. Ed., 2001, 40, 2004–2021.
61. Chen, Y.; Xianyu, Y.; Wu, J.; Yin, B. and Jiang, X., Click Chemistry-Mediated
Nanosensors for Biochemical Assays, Theranostics, 2016, 6, 969–985.
62. Kou, L.; He, H. and Gao, C., Click chemistry approach to functionalize two-dimensional
macromolecules of graphene oxide nanosheets, Nano-Micro Lett., 2010, 2, 177–183.
63. Shi, L.; Wang, L.; Chen, J.; Chen, J.; Ren, L.; Shi, X. and Wang, Y., Modifying graphene
oxide with short peptide via click chemistry for biomedical applications, Appl. Mater.
Today, 2016, 5, 111–117.
64. Hersel, U.; Dahmen, C. and Kessler, H., RGD modified polymers: biomaterials for
stimulated cell adhesion and beyond, Biomaterials, 2003, 24, 4385–4415.
65. Mei, K.-C.; Rubio, N.; Costa, P. M.; Kafa, H.; Abbate, V.; Festy, F.; Bansal, S. S.; Hider,
R. C. and Al-Jamal, K. T., Synthesis of double-clickable functionalised graphene oxide
for biological applications, Chem. Commun., 2015, 51, 14981–14984.
66. Stankovich, S.; Piner, R. D.; Nguyen, S. T. and Ruoff, R. S., Synthesis and exfoliation
of isocyanate-treated graphene oxide nanoplatelets, Carbon N. Y., 2006, 44, 3342–3347.

89
67. Wang, Z.; Ge, Z.; Zheng, X.; Chen, N.; Peng, C.; Fan, C. and Huang, Q., Polyvalent
DNA–graphenenanosheets “click” conjugates, Nanoscale, 2012, 4, 394–399.
68. Vacchi, I. A.; Guo, S.; Raya, J.; Bianco, A. and Ménard‐Moyon, C., Strategies for the
Controlled Covalent Double Functionalization of Graphene Oxide, Chem. – A Eur. J.,
2020, 26, 6591–6598.
69. Guo, S.; Nishina, Y.; Bianco, A. and Ménard‐Moyon, C., A Flexible Method for
Covalent Double Functionalization of Graphene Oxide, Angew. Chem. Int. Ed., 2020, 59,
1542–1547.
70. Bednarek, C.; Wehl, I.; Jung, N.; Schepers, U. and Bräse, S., The Staudinger Ligation,
Chem. Rev., 2020, 120, 4301–4354.
71. Soellner, M. B.; Dickson, K. A.; Nilsson, B. L. and Raines, R. T., Site-Specific Protein
Immobilization by Staudinger Ligation, J. Am. Chem. Soc., 2003, 125, 11790–11791.
72. van Dongen, S. F. M.; Teeuwen, R. L. M.; Nallani, M.; van Berkel, S. S.; Cornelissen, J.
J. L. M.; Nolte, R. J. M. and van Hest, J. C. M., Single-Step Azide Introduction in
Proteins via an Aqueous Diazo Transfer, Bioconjug. Chem., 2009, 20, 20–23.
73. Inoue, N.; Onoda, A. and Hayashi, T., Site-Specific Modification of Proteins through N-
Terminal Azide Labeling and a Chelation-Assisted CuAAC Reaction, Bioconjug. Chem.,
2019, 30, 2427–2434.
74. Muralidharan, V. and Muir, T. W., Protein ligation: an enabling technology for the
biophysical analysis of proteins, Nat. Methods, 2006, 3, 429–438.
75. Luong, N. D.; Sinh, L. H.; Johansson, L.; Campell, J. and Seppälä, J., Functional
Graphene by Thiol‐ene Click Chemistry, Chem. – A Eur. J., 2015, 21, 3183–3186.
76. Singh, K.; Srivastava, G.; Talat, M.; Srivastava, O. N. and Kayastha, A. M., α-Amylase
immobilization onto functionalized graphene nanosheets as scaffolds: Its
characterization, kinetics and potential applications in starch based industries, Biochem.
Biophys. Reports, 2015, 3, 18–25.
77. Adamiak, K. and Sionkowska, A., Current methods of collagen cross-linking: Review,
Int. J. Biol. Macromol., 2020, 161, 550–560.
78. Liu, S.; Zhou, C.; Mou, S.; Li, J.; Zhou, M.; Zeng, Y.; Luo, C.; Sun, J.; Wang, Z. and

90
Xu, W., Biocompatible graphene oxide–collagen composite aerogel for enhanced
stiffness and in situ bone regeneration, Mater. Sci. Eng. C, 2019, 105, 110137.
79. Kang, S.; Park, J. B.; Lee, T.-J.; Ryu, S.; Bhang, S. H.; La, W.-G.; Noh, M.-K.; Hong,
B. H. and Kim, B.-S., Covalent conjugation of mechanically stiff graphene oxide flakes
to three-dimensional collagen scaffolds for osteogenic differentiation of human
mesenchymal stem cells, Carbon, 2015, 83, 162–172.
80. Luo, X.; Weaver, C. L.; Tan, S. and Cui, X. T., Pure graphene oxide doped conducting
polymer nanocomposite for bio-interfacing, J. Mater. Chem. B, 2013, 1, 1340.
81. Stauffer, W. R. and Cui, X. T., Polypyrrole doped with 2 peptide sequences from laminin,
Biomaterials, 2006, 27, 2405–2413.
82. Su, R.; Shi, P.; Zhu, M.; Hong, F. and Li, D., Studies on the properties of graphene oxide
– alkaline protease bio-composites, Bioresour. Technol., 2012, 115, 136–140.
83. Yu, Q.; Zhang, B.; Li, J. and Li, M., The design of peptide-grafted graphene oxide
targeting the actin cytoskeleton for efficient cancer therapy, Chem. Commun., 2017, 53,
11433–11436.
84. Xu, G.; Chen, X.; Hu, J.; Yang, P.; Yang, D. and Wei, L., Immobilization of trypsin on
graphene oxide for microwave-assisted on-plate proteolysis combined with MALDI-MS
analysis, Analyst, 2012, 137, 2757.
85. Veitch, N. C., Horseradish peroxidase: a modern view of a classic enzyme,
Phytochemistry, 2004, 65, 249–259.
86. Hamid, M. and Khalil-ur-Rehman, Potential applications of peroxidases, Food Chem.,
2009, 115, 1177–1186.
87. Krainer, F. W. and Glieder, A., An updated view on horseradish peroxidases:
recombinant production and biotechnological applications, Appl. Microbiol. Biotechnol.,
2015, 99, 1611–1625.
88. Li, Y.; Feng, L.; Shi, X.; Wang, X.; Yang, Y.; Yang, K.; Liu, T.; Yang, G. and Liu, Z.,
Surface Coating-Dependent Cytotoxicity and Degradation of Graphene Derivatives:
Towards the Design of Non-Toxic, Degradable Nano-Graphene, Small, 2014, 10, 1544–
1554.
91
89. Kotchey, G. P.; Allen, B. L.; Vedala, H.; Yanamala, N.; Kapralov, A. A.; Tyurina, Y.
Y.; Klein-Seetharaman, J.; Kagan, V. E. and Star, A., The Enzymatic Oxidation of
Graphene Oxide, ACS Nano, 2011, 5, 2098–2108.
90. Hassani, L.; Ranjbar, B.; Khajeh, K.; Naderi-Manesh, H.; Naderi-Manesh, M. and
Sadeghi, M., Horseradish peroxidase thermostabilization: The combinatorial effects of
the surface modification and the polyols, Enzyme Microb. Technol., 2006, 38, 118–125.
91. Welinder, K. G.; Smillie, L. B. and Schonbaum, G. R., Amino acid sequence studies of
horseradish peroxidase. I. Tryptic peptides., Can. J. Biochem., 1972, 50, 44–62.
92. Sitsanidis, E. D.; Schirmer, J.; Lampinen, A.; Mentel, K. K.; Hiltunen, V.-M.;
Ruokolainen, V.; Johansson, A.; Myllyperkiö, P.; Nissinen, M. and Pettersson, M.,
Tuning protein adsorption on graphene surfaces via laser-induced oxidation, Nanoscale
Adv., 2021, 3, 2065–2074.
93. Ranjbari, N.; Razzaghi, M.; Fernandez-Lafuente, R.; Shojaei, F.; Satari, M. and Homaei,
A., Improved features of a highly stable protease from Penaeus vannamei by
immobilization on glutaraldehyde activated graphene oxide nanosheets, Int. J. Biol.
Macromol., 2019, 130, 564–572.
94. Besharati Vineh, M.; Saboury, A. A.; Poostchi, A. A.; Rashidi, A. M. and Parivar, K.,
Stability and activity improvement of horseradish peroxidase by covalent immobilization
on functionalized reduced graphene oxide and biodegradation of high phenol
concentration, Int. J. Biol. Macromol., 2018, 106, 1314–1322.
95. Özçakır, E. and Eskizeybek, V., A Facile and Effective Method for Size Sorting of Large
Flake Graphene Oxide, Conf. Proc. RAN'16, Proceedings of the World Congress on
Recent Advances in Nanotechnology, 2016.
96. Konios, D.; Stylianakis, M. M.; Stratakis, E. and Kymakis, E., Dispersion behaviour of
graphene oxide and reduced graphene oxide, J. Colloid Interface Sci., 2014, 430, 108–
112.
97. Haeri, S. Z.; Ramezanzadeh, B. and Asghari, M., A novel fabrication of a high
performance SiO2-graphene oxide (GO) nanohybrids: Characterization of thermal
properties of epoxy nanocomposites filled with SiO2-GO nanohybrids, J. Colloid
Interface Sci., 2017, 493, 111–122.

92
98. Villa, S.; Riani, P.; Locardi, F. and Canepa, F., Functionalization of Fe3O4 NPs by
Silanization: Use of Amine (APTES) and Thiol (MPTMS) Silanes and Their Physical
Characterization, Materials (Basel)., 2016, 9, 826.
99. Majoul, N.; Aouida, S. and Bessaïs, B., Progress of porous silicon APTES-
functionalization by FTIR investigations, Appl. Surf. Sci., 2015, 331, 388–391.
100. IR spectrum table & chart: https://www.sigmaaldrich.com/technical-
documents/articles/biology/ir-spectrum-table.html, Sigma Aldrich (10.11.2020).
101. Jabs, A., Jena library of biological macromolecules: Determination of Secondary
Structure in Proteins by Fourier Transform Infrared Spectroscopy (FTIR):
http://jenalib.leibniz-fli.de/ImgLibDoc/ftir/IMAGE_FTIR.html (15.11.2020).
102. Feicht, P. and Eigler, S., Defects in Graphene Oxide as Structural Motifs, ChemNanoMat,
2018, 4, 244–252.
103. Patila, M.; Pavlidis, I. V.; Kouloumpis, A.; Dimos, K.; Spyrou, K.; Katapodis, P.;
Gournis, D. and Stamatis, H., Graphene oxide derivatives with variable alkyl chain
length and terminal functional groups as supports for stabilization of cytochrome c, Int.
J. Biol. Macromol., 2016, 84, 227–235.
104. Sengupta, I.; Chakraborty, S.; Talukdar, M.; Pal, S. K. and Chakraborty, S., Thermal
reduction of graphene oxide: How temperature influences purity, J. Mater. Res., 2018,
33, 4113–4122.
105. Ganguly, A.; Sharma, S.; Papakonstantinou, P. and Hamilton, J., Probing the thermal
deoxygenation of graphene oxide using high-resolution in situ X-ray-based
spectroscopies, J. Phys. Chem. C, 2011, 115, 17009–17019.
106. Schirmer, J., Functionalization of Graphene-Based Microchips for Neuroprosthetic
Applications, University of Jyväskylä and Universität Kassel, Department of Chemistry,
2019.
107. Das, A.; Pisana, S.; Chakraborty, B.; Piscanec, S.; Saha, S. K.; Waghmare, U. V.;
Novoselov, K. S.; Krishnamurthy, H. R.; Geim, A. K.; Ferrari, A. C. and Sood, A. K.,
Monitoring dopants by Raman scattering in an electrochemically top-gated graphene
transistor, Nat. Nanotechnol., 2008, 3, 210–215.

93
108. Introduction to the Methods Used to Detect Proteins and Nucleic Acids Bound to
Membranes: https://www.sigmaaldrich.com/technical-
documents/articles/biology/detection-methods.html, Sigma Aldrich (2.12.2020).

Appendices
APPENDIX 1 Other possible reaction between APTES and GO
APPENDIX 2 Images from experiments with GO flakes
APPENDIX 3 AFM height sensor image of the dried GO flake on a mica disc
APPENDIX 4 Raman spectra of GO-GA-HRP and GO-APTES-GA-HRP
APPENDIX 5 AFM and Raman results of the chip area 1C
APPENDIX 6 Raman band positions of the chip (area 8I) before and after HRP
immobilization

APPENDIX 1
Figure A1. Other possible reaction between a GO flake and APTES.

APPENDIX 2
Figure A2. a) GO suspension in a solvent (PBS, ethanol). b) GO-APTES-GA-HRP product
after mixing at 4ºC for 20 h (1st experiment). c) GO-APTES-GA-HRP product after mixing at
4ºC for 20 h (2nd experiment). d) Vacuum dried intermediate product. e) Supernatant
containing flakes of GO material after centrifugation.
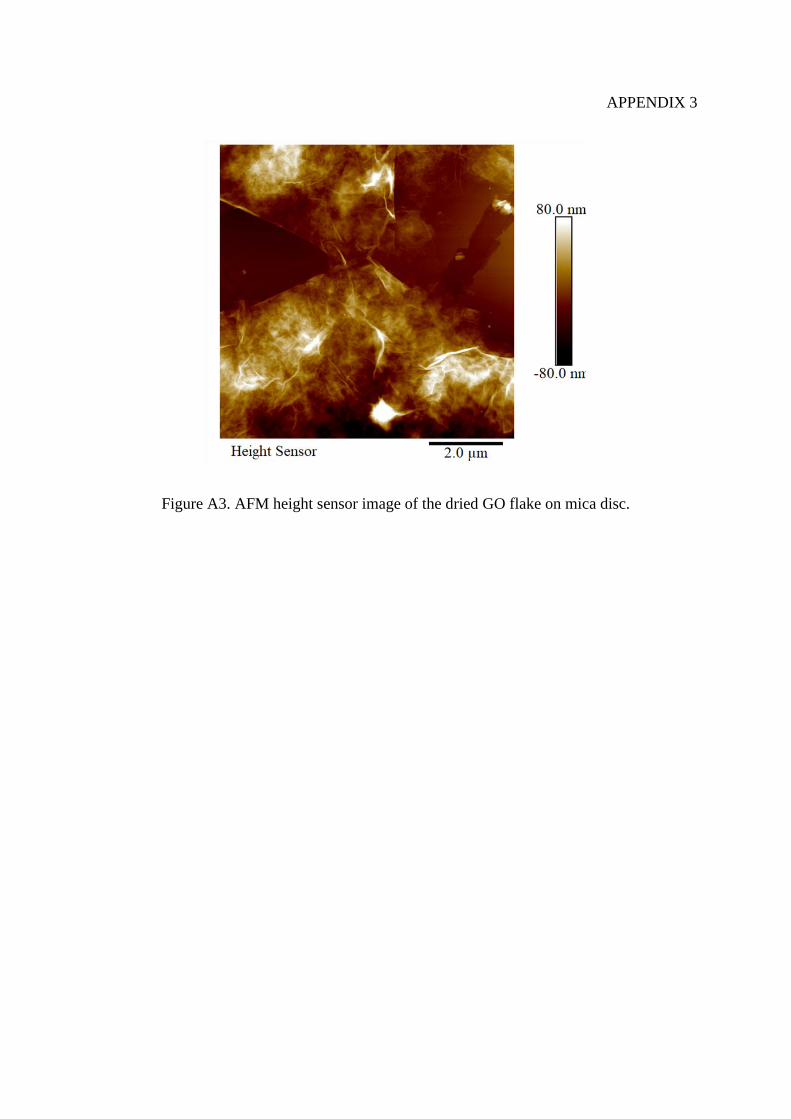
APPENDIX 3
Figure A3. AFM height sensor image of the dried GO flake on mica disc.

APPENDIX 4
Figure A4a. Raman spectra of GO-GA-HRP from three trials.
Figure A4b. Raman spectra of GO-APTES-GA-HRP from three trials.

APPENDIX 5
Figure A5a. AFM images and Raman maps of the area 1C before GA functionalization (upper
row) and after HRP immobilization (lower row).
Figure A5b. Raman spectrum of the peeled off area of the chip after HRP immobilization.
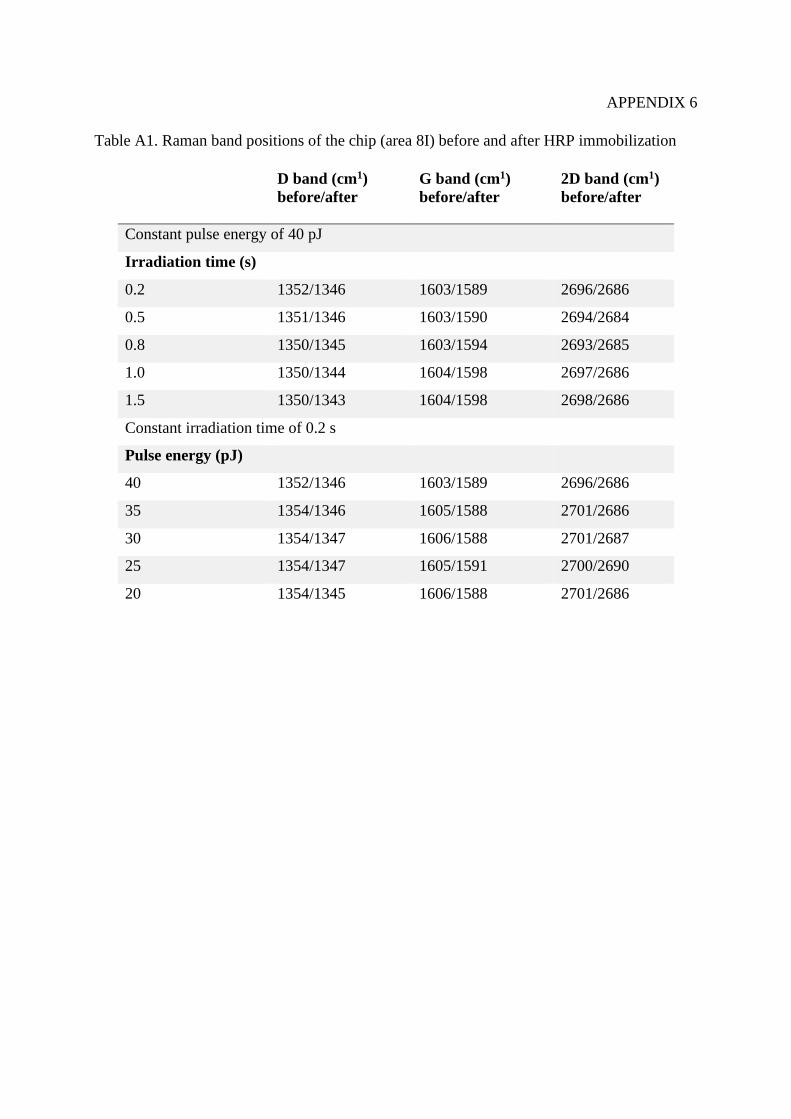
APPENDIX 6
Table A1. Raman band positions of the chip (area 8I) before and after HRP immobilization
D band (cm1)
before/after
G band (cm1)
before/after
2D band (cm1)
before/after
Constant pulse energy of 40 pJ
Irradiation time (s)
0.2 1352/1346 1603/1589 2696/2686
0.5 1351/1346 1603/1590 2694/2684
0.8 1350/1345 1603/1594 2693/2685
1.0 1350/1344 1604/1598 2697/2686
1.5 1350/1343 1604/1598 2698/2686
Constant irradiation time of 0.2 s
Pulse energy (pJ)
40 1352/1346 1603/1589 2696/2686
35 1354/1346 1605/1588 2701/2686
30 1354/1347 1606/1588 2701/2687
25 1354/1347 1605/1591 2700/2690
20 1354/1345 1606/1588 2701/2686