country report on the use of bio-slurry in nepalcountry report on the use of bio-slurry in nepal...
TRANSCRIPT
Country Report on the Use of Bio-slurry in Nepal
Final Report
September 15, 2006
Submitted by:
Dr. Amrit B. Karki Consultant
Organic Recycling and Biogas Expert Dhobighat, Chakrapath, Painyapani Tole
GPO Box 1309, Kathmandu, Nepal
Submitted to: Netherlands Development Organisation (SNV)
2594 AG The Hague Bezuldenhoutsewag 161 The Netherlands
Country Report on the Use of Bio-slurry in Nepal FINAL REPORT
A
TABLE OF CONTENTS
Acknowledgements ............................................................................................................................. I Abbreviations ....................................................................................................................................... II Summary............................................................................................................................................... VIII
Chapter 1 Introduction and Background. ........................................................................................ 1
1.1 Biogas Programme in Nepal............................................................................................... 1 1.2 Rationale of the Bio-slurry Programme............................................................................... 2 1.3 Resume’ of Past Work Done on Slurry Extension Programme........................................... 3 1.4 Use of Different Fertilizers in the Country........................................................................... 3
Chapter 2 Objective, Methodlogy and Limitation............................................................................ 6
2.1 General Objective............................................................................................................... 6 2.2 Methodology and Approach................................................................................................ 6 2.3 Limitations of the Study ...................................................................................................... 6
Chapter 3 Characterisation of Bio-slurry in Comparison to other Organic Manure..................... 7
3.1 Bio-slurry in Relation to Traditional and Improved Organic Manure ................................... 7 3.1.1 Farm Yard Manure .................................................................................................. 7 3.1.2 Bio-slurry ............................................................................................................... 8 3.1.3 Compost................................................................................................................ 8 3.1.4 Slurry Compost...................................................................................................... 8 3.1.5 Night Soil or Human Excreta ................................................................................. 9
3.2 Utilization of Slurry in Different Forms ................................................................................ 10 3.2.1 Liquid Form ........................................................................................................... 10 3.2.2 Dried Form ............................................................................................................ 10 3.2.3 Composted Form................................................................................................... 10
3.3 Farmers’ Perception on Changes in Crop Productivity due to Bio-slurry Application.......... 11 3.4 Physico-chemical Characteristics of Organic Manure in Nepal .......................................... 11
3.4.1 Introduction and Background................................................................................. 11 3.4.2 Sampling ............................................................................................................... 12 3.4.3 Analytical Procedure ............................................................................................. 13 3.4.4 Results of Analytical Data...................................................................................... 14
Chapter 4 Overview of Handling and Application of Bio-slurry..................................................... 19
4.1 Processing of Bio-slurry...................................................................................................... 19 4.1.1 Size of the Slurry Compost Pits............................................................................. 20 4.1.2 Composting Method .............................................................................................. 21 4.1.3 Turning over of Slurry-compost ............................................................................. 21 4.1.4 Composting Period................................................................................................ 21
4.2 Bio-Slurry Storage and Application Mode........................................................................... 22 4.3 Presence of Pathogens in Bio-slurry .................................................................................. 23 4.4 Farmers’ Perception on Mosquito Breeding due to Bio-slurry............................................. 24
Country Report on the Use of Bio-slurry in Nepal FINAL REPORT
B
Chapter 5 Results of Research and Experimentation on the Use of Bio-slurry ........................... 24
5.1 Impact of Bio-slurry on Crops and Vegetables ................................................................... 26 5.1.1 Response to Bio-slurry Application on Maize and Cabbage in Lalitpur District ..... 26 5.1.2 Soil Fertility Trials on Wheat Using Bio-slurry with or without Chemical Fertilizer . 30 5.1.3 Effects of Bio-slurry on other Crops and Vegetables............................................. 31
5.2 Impact of Bio-slurry on Fish Growth ................................................................................... 32 5.2.1 Slurry as a Fertilizer for Fishpond.......................................................................... 32 5.2.2 Slurry as a Feed to Fish ........................................................................................ 32
5.3 Utilization of Bio-slurry in Vermi-composting ...................................................................... 34 5.4 Impact of Bio-slurry on the Incidences of Diseases and Pests ........................................... 34
Chapter 6 Physico-chemical Charecteristics of Bio-slurry in Neplese Context ........................... 36
6.1 Slurry Extension Programs................................................................................................. 36 6.2 Main Findings of Slurry Extension Programs...................................................................... 38
6.2.1 Impacts of SEP I.................................................................................................... 38 6.2.2 Impacts of SEP II................................................................................................... 38 6.2.3 Problems and Constraints Faced by RSEOs......................................................... 39 6.2.4 Proposed Institutional Structure of SEP with Improvement ................................... 39 6.2.5 Major Recommendations....................................................................................... 39
6.3 Trainings Conducted on Proper Utilization of Bio-Slurry under Biogas Support Programme......................................................................................................................... 40 6.3.1 Training period, Number of Trainees and Venues................................................. 40 6.3.2 Course Content of the Training Program............................................................... 40 6.3.3 General Reaction of the Training Programme ....................................................... 41
6.4 Training Programme for Slurry Extension Officers (SEOs)................................................. 41 6.4.1 Major Objectives.................................................................................................... 41 6.4.2 Reaction Evaluation .............................................................................................. 41 6.4.3 Training Facilities Provided by the Programme ..................................................... 41 6.4.4 Training Methods Used ......................................................................................... 41
6.5 Training on Proper Use of Slurry for Technical Staff of SNV/BSP...................................... 41 6.6 Development of Appropriate Slurry Extension Model ......................................................... 42
Chapter 7 Effects of Extension and Training Programme on the Practice of Biogas Farmers... 44
7.1 Strengths............................................................................................................................ 45 7.2 Weaknesses....................................................................................................................... 45 7.3 Opportunities ...................................................................................................................... 46 7.4 Threats ............................................................................................................................... 46
Chapter 8 Conclusions and Recommendations.............................................................................. 47
8.1 Conclusions........................................................................................................................ 47 8.2 Recommendations ............................................................................................................. 47 References ........................................................................................................................ 49
Country Report on the Use of Bio-slurry in Nepal FINAL REPORT
C
LIST OF TABLES, FIGURES, PHOTOS AND ANNEXES List of Tables Table 1 Annual Rate of Fertilizer Consumption in Nepal from 1999/00 to 2003/04 ......................... 4 Table 2 Fertilizer Utilization by Ecological Belts in 2003/04 (Sales by AIC only) ............................. 5 Table 3 `Plant Nutrients in FYM ...................................................................................................... 7 Table 4 Plant Nutrients in Slurry Compost....................................................................................... 8 Table 5 Nutrients Available in Composted Manure, FYM, and Digested Slurry............................... 9 Table 6 Perception of Biogas Farmers about the Changes in Crop Productivity due to Bio-slurry
Utilization............................................................................................................................ 11 Table 7 Sampled District for Collecting Slurry Samples and FYM................................................... 13 Table 8 Analytical Results of Liquid Slurry from Non-Latrine attached Biogas Plant....................... 14 Table 9 Analytical Results of Liquid Slurry from Latrine attached Biogas Plant............................... 14 Table 10 Analytical Results of Slurry Compost Prepared by using Bio-slurry (Non latrine attached) 14 Table 11 Slurry Compost Prepared by using Bio-slurry (Latrine attached)........................................ 15 Table 12 Analytical Results of Farm Yard Manure ............................................................................ 15 Table 13 Comparison of Nutrients in Different Categories of Organic Manures ................................ 15 Table 14 Urine Collection, Utilization and Conditions of Cattle Shed ................................................ 17 Table 15 Comparison of nutrient in Fresh Dung and Urine of a cow with FYM and Slurry Compost. 18 Table 16 Number of Slurry Pits ......................................................................................................... 20 Table 17 Size of Pits in Relation to Categories of Respondents ....................................................... 20 Table 18 Frequency of Turning over of Slurry-compost .................................................................... 21 Table 19 Composting Period............................................................................................................. 21 Table 20 Bio-Slurry Storage and Application Mode........................................................................... 22 Table 21 Commonly Found Excreta-borne Pathogenic Organism .................................................... 23 Table 22 Distribution of Pathogens in Bio-slurry in Accordance with Pathogenic Types ................... 24 Table 23 Grain Yield of Maize due to Application of Slurry, Compost and Chemical Fertilizer.......... 27 Table 24 Yield of Soybean as Inter-cropping with Maize................................................................... 28 Table 25 Residual effect of Manure and Fertilizer after Maize Harvest ............................................. 28 Table 26 Yield of Cabbage due to Application of Slurry, Compost and Cabbage Fertilizer ............... 29 Table 27 Residual Effect of Manure and Fertilizer after the Harvest of Cabbage.............................. 29 Table 28 Effect of Dry and Wet Bio-slurry in Combination with or without Chemical Fertilizer .......... 30 Table 29 Comparison of Bio-slurry with Poultry Manure and Chemical Fertilizer in the Yield of
Wheat................................................................................................................................. 30 Table 30 Effect of Wet and Dry Bio-slurry with or without Chemical Fertilizer under Irrigated and
Rain-fed Conditions............................................................................................................ 31 Table 31 Effect of Inoculation of Azotobactor in Different Sources of Organic Matter including Bio-
slurry on the Yield of Wheat ............................................................................................... 31 Table 32 Effect of Bio-slurry on the Yield of Crops and Vegetables .................................................. 32 Table 33 Composition of Feed during Various Stages of Experimental Trial..................................... 33 Table 34A Growth and Number of Fish Stocking (Pond -1)................................................................. 33 Table 34B Growth and Number of Fish Stocking (Pond-2).................................................................. 33 Table 34C Growth and Number of Fish Stocking (Pond-3).................................................................. 34 Table 35 Impact of Bio-slurry on the Incidence of Diseases and Pests............................................. 35 Table 36 Number of SEOs, their Affiliation with Companies and their Duty Stations ........................ 36 Table 37 Package Programmme for Development of Appropriate Slurry Model ............................... 43 Table 38 Number of Livestock Population in Nepal........................................................................... 45
Country Report on the Use of Bio-slurry in Nepal FINAL REPORT
D
List of Figures Figure 1 Recovery of Valuable Resources from Waste .................................................................... 1 Figure 2 Major Plant Nutrients in Different Sources of Organic Fertilizers........................................ 9 Figure 3 NPK Content Present in Different Types of Organic Manures............................................ 16 Figure 4 Distribution of Pathogens in Bio-slurry................................................................................ 24 Figure 5 Organizational Structure of Slurry Extension Programme – II ............................................ 39
List of Photos Photo 1 Protecting the Slurry Compost from sun by putting Creeping Vegetables over the
Compost Pit........................................................................................................................ 11 Photo 2 Collection of Urine in an Improved Cattle Shed.................................................................. 17 Photo 3 An Inlet Close to the Stable Leads to Convenient Feeding and therefore encourage more
regular Feeding. However, the urine is still lost. ................................................................ 18 Photo 4 For Slurry Utilization a plot of Elephant Grass was Established; Look how Green is the
Area! due to Bio-slurry Use ................................................................................................ 18 Photo 5 Fish Pond near Biogas Plant .............................................................................................. 33 Photo 6 Feeding the Fish in a Pan Kept Floating over the Pond ..................................................... 33
List of Annex Annex I Terms of Reference............................................................................................................ I
Country Report on the Use of Bio-slurry in Nepal FINAL REPORT
I
ACKNOWLEDGEMENTS
I would like to extend my sincere thanks to the Netherlands Development Organization (SNV) especially to Mr. Wim J. van Nes, Biogas Practice Leader for appointing me as Consultant to prepare “Country Report on the Use of Bio-slurry in Nepal”. I am grateful to him as well as to Mr. Rob Ukkerman for their invaluable comments and suggestions that permitted the Consultant to prepare the final report in present shape. I am thankful to Mr. Shanker B. Pradhan, Former Senior Soil Scientist of the Division of Soil Science and Agricultural Chemistry, Department of Agriculture for assisting me to accomplish this assignment. Similarly, I acknowledge with great appreciation the contribution of Mr. Subhash Vaidya, Senior Scientist of Nepal Agricultural Research Council (NARC) and Miss Isha Sharma, Environmentalist/Natural Resource Management Expert of the Consolidated Management Services Nepal (P) Ltd to accomplish this job. Last but not the least, I would also like to express my sincere thanks to Mr. Saroj Rai, Executive Director of BSP-N; Mr. Christopher Kellner, Senior SNV/Advisor; Mr. Ram Prasad Dhital, RESS Co-ordinator; Ms. Bindu Manandhar; Mr. Prakash Lamichhane, and Mr. Ramesh Regmi from BSP-N for providing me valuable inputs. Dr. Amrit B. Karki Consultant Organic Recycling and Biogas Expert Dhobighat, Chakrapath, Painyapani Tole GPO Box 1309, Kathmandu, Nepal Tel: 5-535537; E-mail: [email protected]
Country Report on the Use of Bio-slurry in Nepal FINAL REPORT
II
ABBREVIATIONS ADOs - Agricultural Development Officers AEDPF - Alternate Energy Development and Promotion Foundation Nepal AEPC - Alternative Energy Promotion Centre AIC - Agricultural Inputs Corporation APP - Agriculture Perspective Plan BSP - Biogas Support Programmer BSP-N - Biogas Sector Partnership-Nepal CBD - Complete Block Design CBOs - Community Based Organizations CDR - Central Development Region CEE - Centre for Energy and Environment CMS - Consolidated Management Services Nepal (P) Ltd DAP - Di-ammonium Phosphate DGIS - Directorate General for International Cooperation of the Netherlands DOA - Department of Agriculture EDR - Eastern Development Region FAO - Food and Agriculture Organization of the United Nations FYM - Farm yard Manure GDP - Gross Domestic Product GGC - Gobar Gas and Agricultural Equipment Development Company GO - Government Organization HH - Households HMG/N - His Majesty’s Government of Nepal IEIA - Integrated Environmental Impact Assessment INM - Integrated Nutrient Management IWM - Improved water Mills JT - Junior Technician JTAs - Junior Technical Assistants KfW - Kreditanstalt fuer Wiederaufbau LA - Latrine Attached M&E - Monitoring and Evaluation MFIs - Micro-Finance Institutions MOEST - Ministry of Environment, Science and Technology MTR - Mid-Term Review MWDR - Mid-Western Development Region NARC - Nepal Agricultural Research Council NBG - Nepal Biogas Company (P) Ltd NBGP - Nepal Biogas Promotion Group NCBAE - NGO Coalition for Biogas and Alternative Energy NGOs - Non-Government Organizations NH4+ - Ammonium NLA - Non-Latrine Attached NPK - Nitrogen, Phosphorous, Potassium
Country Report on the Use of Bio-slurry in Nepal FINAL REPORT
III
PEMON - Pesticide Monitor Nepal R & D - Research and Development RET - Renewable Energy Technology RGG - Rastriya Gobar Gas Nirman Tatha Sewa (P) Ltd RSCC - Regional Slurry Co-ordination Committee RSEOs - Regional Slurry Extension Officers SC - Slurry Compost SEOs - Slurry Extension Officers SEM - Slurry Extension Model SEP - Slurry Extension Programme SEPP - Slurry Extension Pilot Programme SNV - The Netherlands Development Organization SWOT - Strength, Weaknesses, Opportunities and Threats UN - United Nations VDC - Village Development Committee WDR - Western Development Region YSD - Yashoda Sustainable Development (P) Ltd
Country Report on the Use of Bio-slurry in Nepal FINAL REPORT
IV
SUMMARY 1.0 INTRODUCTION Initially known as SNV/BSP and now transformed into a Non-Governmental Organization (NGO), the Biogas Sector Partnership - Nepal (BSP-N), has been implementing biogas programme in Nepal under the umbrella of Alternative Energy Promotion Center (AEPC) of Ministry of Environment, Science and Technology (MOEST). With the rigorous efforts of various governmental and non-governmental organizations notably HMG/N, KfW and the Netherlands Development Organization (SNV), BSP-Nepal, Biogas Company etc., more than 150,000 household-size biogas plants have been installed in Nepal by 28 June 2006 covering 67 of its 75 districts. Realizing the importance of bio-slurry to the farming community, BSP-N started the phase-wise Slurry Extension Programme with the main objectives of creating awareness amongst the farmers on the use of bio-slurry, to teach them about proper composting and use of slurry, and to demonstrate to them that bio-slurry is even better than Farm Yard Manure (FYM), and that though a by-product it is a invaluable resource. It seems high time to make a full inventory of experiences with the use of bio-slurry in the practice of the average biogas farmer so far. In this respect, SNV has taken the initiative to organize an International Workshop on the use of bio-slurry on 27 – 28 September 2006 in Bangkok. In the framework of this Workshop, it is important to learn as much as possible from the experiences with the use of bio-slurry in countries with large-scale programmes for domestic biogas like China, India and Nepal (see Annex I: Terms of Reference). 2.0 OBJECTIVE The general objective of this report on the Use of Bio-slurry in Nepal is to make a comprehensive assessment on bio-slurry use and its impacts on various aspects, specifically on the followings: Characterization of the bio-slurry; Overview of bio-slurry handling (storage, process and transport) and its application; Effects of extension and training programmes on the practice of biogas farmers in Nepal regarding bio-slurry use; Strengths, weaknesses, opportunities and threats of bio-slurry; Use of bio-slurry at present and recommendations for its use in future. The specific objective is to prepare a report on bio-slurry presenting all scattered information in a consolidated form with the motive of information sharing at international level through the conference, which is going to be held in Thailand, Bangkok on 27 and 28 September 2006. 3.0 METHODOLOGY AND APPROACH The methodology followed for the report preparation includes review of various documents/literature related to concerned study in the past; consultation with concerned personnel for necessary information; and collection of secondary data on various aspects of slurry use, including data on physico-chemical analysis of the slurry performed recently in 2006. 4.0 LIMITATIONS OF THE STUDY The limitations of the study are unavailability of properly documented information on the slurry use; lack of adequate consolidated information on slurry application study; and no research continuity on slurry application.
Country Report on the Use of Bio-slurry in Nepal FINAL REPORT
V
5.0 CHARACTERIZATION OF BIO-SLURRY IN COMPARISON TO OTHER ORGANIC MANURE Studies reported that FYM contains 0.8% of Nitrogen (N), 0.7% of Phosphorous (P), and 0.7% of Potassium (K), while NPK content of compost manure is 1%, 0.6%, and 1.2% respectively. Similarly, digested slurry contains 1.60% N, 1.55% P and 1.00% K (see data in Table 5), and slurry compost comprises of 0.75% N, 0.65% P and 1.05% K (see data in Table 4). Recently in 2006, the physico-chemical analysis of bio-slurry and other organic manure (FYM, slurry compost) was done systematically following Random Sampling method. A total of 100 samples comprising of bio-slurry and slurry compost both from latrine attached and non-attached plants as well as FYM samples were analyzed for total solids, volatile solids, pH, organic matter, ammonium nitrogen, total nitrogen, total phosphorus and total potassium. The findings of the analysis are discussed and interpreted in depth in Section 3.4 of the Report. 6.0 BIO-SLURRY HANDLING (STORAGE, PROCESS AND TRANSPORT) AND ITS APPLICATION: 6.1 Number of Slurry Pits More than 75% of the respondents of Biogas Users’ Survey 2006 have two slurry pits for composting purpose with very negligible number of households having no pits. In Terai more than 90% have 2 pits and only about 6% have single pit whereas these figures in the hills are 69% and 29 % respectively. 6.2 Composting Method Heap and Pit are the two popular methods of composting among the Nepalese farmers. The pit method is considered technically superior and efforts are being put both from GO as well as NGOs in popularizing the pit method of composting. Biogas Users’ Survey 2006 reveals that among the biogas users more than 95% of the respondents follow pit method of composting. 6.3 Turning over of Slurry-compost Past studies have reported up to three times turning of the compost by the farmers. However, recent Biogas Users’ Survey showed more than 40% of the respondents among the biogas users do not turn the compost pits. Among those who turn the compost, practice of single turning seems popular both in Terai and hills. 6.4 Composting Period More than 50% of the respondents keep compost in the pit for four months. 6.5. Storage and Application Mode Biogas Users’ Survey 2006 reported that in Terai, most popular practice is Spreading in field uncovered in small heaps (57.5%) which is the second most popular practice (22.2%) of the hill respondents whose first preference is Transporting to the field and spreading during slack season and incorporate into soil only at the time of land preparation.(44.3%) The second popular practice (29.9%) in the Terai is Transporting to the field, spreading and incorporating immediately which again is the third most popular practice (21.7) of the hill respondents. The mid-term evaluation of Slurry Extension Program reported that 50% of the farmers incorporated the compost in the field immediately after transporting it to the field, while about 22% farmers incorporated the compost just before ploughing.
Country Report on the Use of Bio-slurry in Nepal FINAL REPORT
VI
7.0 RESULTS OF RESEARCH AND EXPERIMENTATION ON BIO-SLURRY USE 7.1 Impact of Bio-slurry on Crops and Vegetables Recommended dose of chemical fertilizer in conjunction with 20 ton/ha slurry compost resulted in highest incremental yield (36.2%) over control followed by 28.4 % yield increment by sole application of slurry compost (20 ton /ha). Application of both liquid and composted form of bio-slurry resulted in higher incremental yield (18.4% and 28.4% respectively) of cabbage as compared to that of the application of FYM and also full recommended dose of chemical fertilizer which resulted in 14% and 19.6% incremental yield respectively. As with the maize experiment, composted form of bio-slurry has shown superiority over others. Comparatively biogas slurry in liquid form yielded 6.6% higher yields than the FYM treatment; slurry compost produced 11.06% higher yields than the liquid slurry, whereas mineral fertiliser produced 6.0% lower yields than the slurry compost. 7.2 Impact of Bio-slurry on Fish Growth The experimentation carried out on fish showed that the growth rate of Grass carp and Common carp have been significant (4.35 gm and 3.7 gm per day respectively) with bioslurry application. The production rate per hectare of the water surface area was found to be more than six metric tones in 6-9 months period due to slurry application which is believed to be more than the national record of only 2 metric tones of fish production per hectare. 7.3 Impact of Bio-slurry on the Incidences of Diseases and Pests Biogas Users’ Survey 2006 reported that in both the ecological belts, 37% farmers have not noticed any change in pests/diseases control after bio-slurry application, and about equal number were found to be unaware in this regard. However the number of households observing increase and decrease in pest incidence with bio-slurry use is almost equal (around 13% each). Since these are the mere perceptions of user farmers, no definite conclusion can be drawn without a focused R&D in this regard. 7.4 Farmers’ Perception on Mosquito Breeding due to Bio-slurry About 48% of biogas users in the hill region perceive that there is increase in mosquitoes after biogas use. While equal number of respondents considers that there has been no change in mosquito occurrence before and after biogas use. On an average, 42% households reported of increase in mosquito after biogas use. Markedly, 56% of the respondents in both the ecological regions reported that there has been no difference in this matter after biogas use. People reporting decrease in mosquito after biogas use is comparatively less (4%). Moreover, 51% of the non-users as compared to 43% of users reported that mosquito appear mostly in rooms of the house which indicates that mosquito is more common in non-user HHs as compared to the user HHs (Biogas Users’ Survey, 2006). On the other hand, some of the biogas farmers perceive that bio-slurry especially from latrine attached plant attracts mosquito, while others think that the proliferation of mosquito is related to the neatness of surrounding as ditches, bushes, stagnant water favor mosquito breeding. These mixed responses of farmers regarding mosquito proliferation due to bio-slurry, necessitates further separate study on mosquito occurrence. 7.5 Presence of Pathogens in Bio-slurry Ascaris is predominant in latrine attached samples followed by Taenia (23%) and Trichuris (14%). Distribution of each of the parasites- Giardia and Hookworm was found up to the extent of 7%, while small number of samples contained Trichomonas (2%) and Diphyllobothrium (1%). On the other hand, Shigella was found fairly distributed in the sample (14%).

Country Report on the Use of Bio-slurry in Nepal FINAL REPORT
VII
8.0 SLURRY EXTENSION PROGRAMS Different phases of Slurry Extension Programmes were implemented at different periods by Biogas Support Programme (BSP) under the framework of SNV/N and AEPC. They are as follows: � Slurry Extension Pilot Program (SEPP): Implemented by SNV/BSP from November 1995 to July
1996. � Slurry Extension Program-I (SEP or SEP-I): Implemented by SNV/BSP from February 1, 1997 to
July 1999. � Slurry Extension Program-II (SEP-II): Implemented by AEPC from September 11, 1998 to
September 2000. Slurry Extension Pilot Program (SEPP) was implemented by SNV/BSP with the main objective of enhancing the use of slurry among biogas farmers. The training aimed to cover the aspects like introduction to biogas slurry; manorial value of digested slurry and factors affecting quality and quantity of slurry; improved slurry utilisation technologies-method of application, composting storage of manure, transportation and application of manure; effect of slurry manure on crop production; socio-economic consideration on proper use of bio-slurry; improved shed management; and fodder/forage crop production at household level. The impact of slurry extension and promotion programme has been very conducive to make the farmers conscious about the utilization of bio-slurry as fertilizer to enhance crop production and productivity of soils. SEP has helped in reduction of grazing month and increment in the stall-feeding, with the increase in the fodder grass/trees plantation among the farmers participating in SEP. 84% of participating farmers have constructed the compost pit. The percentage of the farmers adopting protection measure for the compost pit against water logging has been found to be 12% more in case of the SEP participating farmers as compared to non-participants. Similarly, 90% SEP participants have adopted protection of compost pit against exposure to sun. The percentage of the respondents collecting urine has increased substantially as a result of participation in SEP. About 75% of the sampled Biogas Companies expressed their satisfaction on the performance of RSEOs. 77% of the trainees perceived that the training had increased their knowledge and skill and almost half of the trainees revealed that this knowledge and skill would be applicable to a great extent. 9. SWOT ANALYSIS As outlined in detail in Chapter Seven, the Strengths of the slurry program are that Nepal has agrarian economy with large number of livestock in the country and organic manure based farming. No additional cost and no literacy requirement are other strengths of slurry use. Weaknesses of slurry utilization development are observed to be lack of interest and awareness towards this programme by the farmers; liquid nature of bio-slurry which poses difficulty in transportation to the field from the pit; loss of nutrient during storage; necessity of longer storage period in non-arid climate, etc. And Opportunities with slurry ahead is the growing realization of organic farming and extended use of slurry as fish feed, pesticides, fertilizer, and material for vermi-composting. Existing Threats are adoption of high input modern farming technology; farmers’ reluctance to use slurry from latrine attached biogas plants due to social constraint; and moving away of new generation from farming, etc.
1 Though visualized to start this programme from 1st September 1998, but actually, the project activities were delayed till 1st February 1998.

Country Report on the Use of Bio-slurry in Nepal FINAL REPORT
VIII
10.0 DEVELOPMENT OF APPROPRIATE SLURRY EXTENSION MODEL Multi Annual Plan for remaining period (Jan 2006 – June 09) has focused to develop appropriate slurry extension model that is helpful to promote biogas plants. The activities envisioned in this model, but not limited to the followings, are (BSP-N, 2006): � Coordination of slurry extension and promotion; � Physico-chemical analyses of bio-slurry, FYM and compost; � Study on promotion and trading of bio-compost and organic products; � Bonus to biogas companies for construction of slurry compost pit; � Printing slurry extension and promotion leaflets; and � Orientation on slurry extension and promotion to NGOs/MFIs and teachers; and training to biogas
companies on slurry extension and promotion. An outline of the three years’ programme (2007 -2009) regarding the proposed Slurry Extension Model (SEM) has been recommended in Section 6.6. 11.0 CONCLUSION Potential of slurry is being realized by the farmers and its utilization is getting popular along with the increasing awareness created due to various extension programs. However, to overcome the social and technical constraints in slurry use and optimize its utilization, conduction of more extensive training programs is necessary to transfer the knowledge on slurry use to farmers. Various studies and researches conducted in the past helped to derive a conclusion that bio-slurry is immensely beneficial in farming system due to its multi-dimensional potentiality. However, more researches are necessary to come to a concrete conclusion with sufficient evidence that bio-slurry is highly beneficial in the agriculture system. Bio-slurry is obtained to farmers almost free of cost, and hence provides economic sustainability to the farmers, as it can be used as soil conditioner; as fertilizer for crops; as rich nutrition for fish cattle and poultry birds; as pesticide against pests/diseases to control insects and pathogens. However, overcoming the underlying challenges and constraints is primarily required for effective utilization of slurry, which is both economically and environmentally friendly to the society and the nation. 12.0 RECOMMENDATIONS � Slurry analysis for physico-chemical and biological content which is being carried out should be
continued so as to confirm the research result with adequate time series database; � As a continuation to the past studies, assessment of slurry, both at field level (practical
demonstration) and laboratory level (physico-chemical analyses and pathological examination), should be carried out to confirm the previous findings.
� Training should be imparted to the biogas farmers in view of adopting and extending vermi-composting technique for income generation;
� Long term time series data base on slurry use as fish feed is necessary to confirm the findings till now. Such study should be conducted to derive a concrete conclusion in this concern;
� Sound techniques of storage, processing, transportation and application should be adopted such that the handling of slurry is done in a healthy manner;
� To minimize the risk of diseases contamination training should be imparted to biogas users on proper handling of bio-slurry by means of the instruction book prepared by BSP-N on health and sanitation aspects;
Country Report on the Use of Bio-slurry in Nepal FINAL REPORT
IX
� Massive training materials like audio-visual elements; pictorial pamphlets etc, demonstrating multiple utilities of slurry, should be used extensively for effective knowledge dissemination to the targeted beneficiary group;
� Orientation on slurry extension and promotion to NGOs/MFIs and teachers; and training to biogas companies on slurry extension and promotion should be carried out (refer to Appropriate Slurry Extension Method, Section 6.6);
� Study on promotion and trading of bio-compost and organic products should be undertaken for income generation;
� Separate R&D should be conducted for this with the involvement of experts and concerned stakeholders who can come out with innovative ideas to solve the existing problems in slurry utilization to its full potential; and
� Las but not the least, the Consultant has developed a Slurry Extension Model for three years (2007 to 2009) envisaging above mentioned activities. The tentative programs including the estimated cost (NRs. 16,307,280 equivalent to US$ 220,369) for implementation of this model has been presented in Chapter Six of this report
Country Report on the Use of Bio-slurry in Nepal FINAL REPORT
1
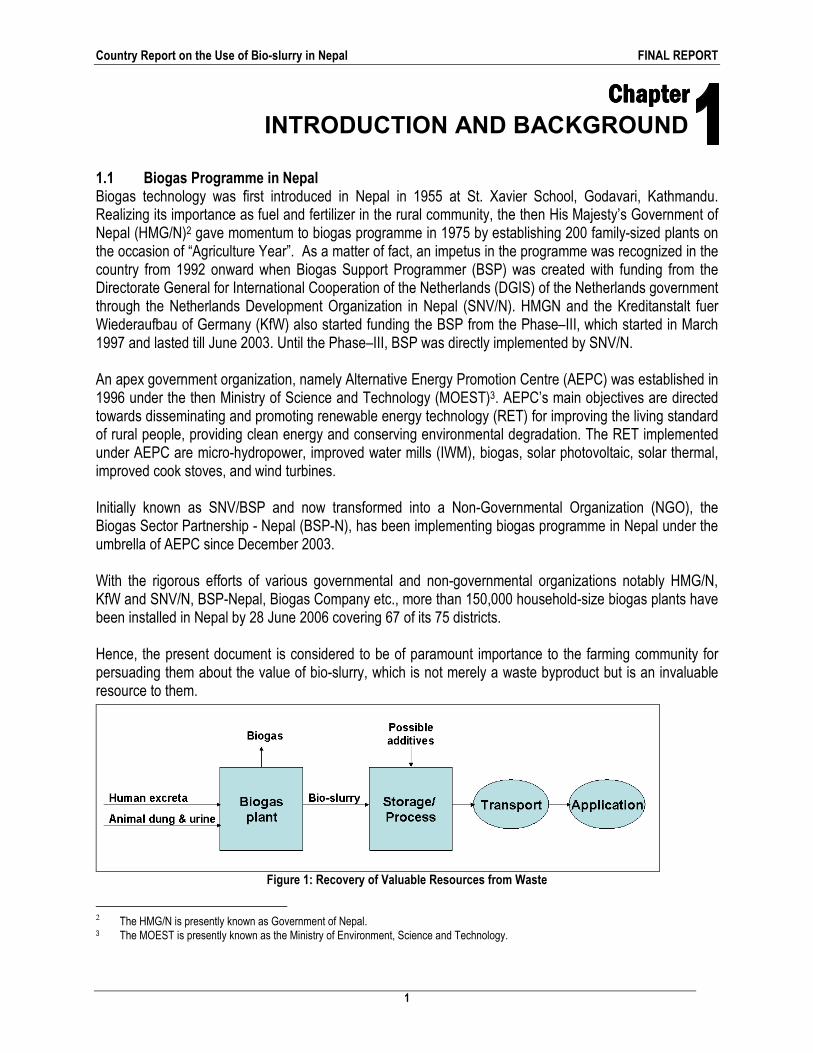
1.1 Biogas Programme in Nepal Biogas technology was first introduced in Nepal in 1955 at St. Xavier School, Godavari, Kathmandu. Realizing its importance as fuel and fertilizer in the rural community, the then His Majesty’s Government of Nepal (HMG/N)2 gave momentum to biogas programme in 1975 by establishing 200 family-sized plants on the occasion of “Agriculture Year”. As a matter of fact, an impetus in the programme was recognized in the country from 1992 onward when Biogas Support Programmer (BSP) was created with funding from the Directorate General for International Cooperation of the Netherlands (DGIS) of the Netherlands government through the Netherlands Development Organization in Nepal (SNV/N). HMGN and the Kreditanstalt fuer Wiederaufbau of Germany (KfW) also started funding the BSP from the Phase–III, which started in March 1997 and lasted till June 2003. Until the Phase–III, BSP was directly implemented by SNV/N. An apex government organization, namely Alternative Energy Promotion Centre (AEPC) was established in 1996 under the then Ministry of Science and Technology (MOEST)3. AEPC’s main objectives are directed towards disseminating and promoting renewable energy technology (RET) for improving the living standard of rural people, providing clean energy and conserving environmental degradation. The RET implemented under AEPC are micro-hydropower, improved water mills (IWM), biogas, solar photovoltaic, solar thermal, improved cook stoves, and wind turbines. Initially known as SNV/BSP and now transformed into a Non-Governmental Organization (NGO), the Biogas Sector Partnership - Nepal (BSP-N), has been implementing biogas programme in Nepal under the umbrella of AEPC since December 2003. With the rigorous efforts of various governmental and non-governmental organizations notably HMG/N, KfW and SNV/N, BSP-Nepal, Biogas Company etc., more than 150,000 household-size biogas plants have been installed in Nepal by 28 June 2006 covering 67 of its 75 districts. Hence, the present document is considered to be of paramount importance to the farming community for persuading them about the value of bio-slurry, which is not merely a waste byproduct but is an invaluable resource to them.
Figure 1: Recovery of Valuable Resources from Waste
2 The HMG/N is presently known as Government of Nepal. 3 The MOEST is presently known as the Ministry of Environment, Science and Technology.
Chapter Chapter Chapter Chapter
INTRODUCTION AND BACKGROUND
Country Report on the Use of Bio-slurry in Nepal FINAL REPORT
2
In fact, bio-slurry4 is that resource which the biogas user farmers virtually obtain free of cost (as a by- product of biogas production from the cow dung in a biogas plant). The high manorial value of bio-slurry which the crops can readily obtain has surmounted the importance of bio-slurry application to the crops. Studies have shown that its use has positive impact on production of various crops. Despite chemical fertilizers, bio-slurry doesn’t have any harmful effect to the environment either. Bio-slurry, as one of the outputs of anaerobic digestion system, can profitably be returned to the agricultural system. Besides using bio-slurry as rich plant nutrient, Shen (1985) reported that spraying effluent only or in combination with little pesticide could effectively control red spider and aphids attaching in vegetables, wheat and cotton. The effect of slurry with 15 to 20 percent pesticide on controlling the pest produced the same result as that of the pesticides alone. The close relation between biogas and agriculture can be taken as an indicator of environmental friendly nature of the technology. Biogas technology, a sustainable rural energy, has not only positive impacts on traditional fuel saving but it also curtails the demand of chemical fertilizer to some extent thus reducing financial transaction on such imported materials. 1.2 Rationale of the Bio-slurry Programme It is recognized that to derive maximum benefit from biogas technology, biogas programme needs to be implemented in an integrated way. It means that not only the “gas” as output of biogas plant but also importantly the byproduct, that is, “bio-slurry” should be promoted hand-in-hand. Despite the realization that bio-slurry is equally important to the farmers, it is generally observed that biogas farmers neglect the use of bio-slurry as they think it has no nutrients and was just wastage. The consequence of such a tendency has a negative impact on biogas promotion. Taking this fact into consideration, BSP-N started the phase-wise Slurry Extension Programme. The main objectives of the slurry programme were to create awareness amongst the farmers on the use of bio-slurry, to teach them about proper composting and use of slurry, and to demonstrate to them that bio-slurry is even better than farm yard manure. During the promotional activity carried out by the companies, it is observed in most of the cases that the farmers complain about decrease in manorial value of cow dung after passing through the bio-digester as compared to the FYM (Farm Yard Manure). Previous studies including annual Biogas Users’ Survey, Study on Slurry Utilization and other relevant literatures have shown that before biogas use, cow dung was used primarily as FYM and to some extent as fuel source for cooking. However, cow dung is the chief raw material used for biogas production from household biogas plants in Nepal, and this raw material used for gas production comes out as spent slurry after passing through anaerobic digestion in biogas plants. Some studies were carried out in the past to find out bio-slurry’s effect on crop production during which the slurry nutrient contents were also studied. Various studies/researches had reported wide variation in the nutrient content in biogas slurry. Theoretically, in anaerobic condition most of the compounds will be in reduced form. Therefore, most of the nitrogen will be in the ammonium form (NH4+), which is readily available to the plant. Similarly, phosphorus and potassium will also be in readily available form to plant as they are released from organic complex. Furthermore, in biogas digester there should be no loss of nutrients except nitrogen in NH4+ form. Loss of nitrogen in NH4+ form should not be major problem unless the quantity lost is in high concentration. Therefore, it has been very important to find out if the farmer’s statement has any valid reasoning.
4 The term bio-slurry is used here for the residue that comes out of the biogas plant. Other terms sometimes used are just ‘slurry’, ‘effluent’,
‘bio-manure’, ‘sludge’, ‘bio-fertiliser’, ‘organic fertiliser’ and ‘organic manure’
Country Report on the Use of Bio-slurry in Nepal FINAL REPORT
3
Furthermore, it seems quite pertinent to review the past work regarding the nutrient value of the liquid slurry, both slurry compost and FYM in context of Nepal. To validate the analytical data, it also seems necessary to compare the results of analysis with those obtained elsewhere. Furthermore, the study intends to focus on providing the farmers sound and concrete recommendation about the utilization of bio-slurry to increase soil productivity and hence the crop yield. However according to SNV/N Senior Renewable Energy Advisor, Christopher Kellner, out of total cattle excreta, 66% of the Nitrogen is present in the urine and only 34% in the dung. Since the urine is not channelized directly to the bio-digester in most of the cases, most of the urine gets lost before entering the bio-digester. Moreover, the practice of collecting only clean manure for the digester, leaving out the bedding material, causes loss of about 50% of the dung itself. This means Nitrogen content of the dung entering the bio-digester is only 17%. Again, it is assumed that almost 50% of the remaining Nitrogen gets lost in the process of composting, transportation, and incorporation into the field through leaching and volatilization. This heavy Nitrogen loss from the slurry till the time crops utilize it should be the main reason behind farmers giving little importance to slurry use. Hence, connecting cattle shed floor directly to the bio-digester will come out with tremendous beneficial effects of high nutrient content in the slurry. 1.3 Resume’ of Past Work Done on Slurry Extension Programme Realizing the necessity for extending the utilization of slurry as fertilizer amidst the rural community, the Slurry Extension Pilot Programme (SEPP) was launched from November 1995 to July 1996 under the framework of SNV/BSP. Thereafter, based upon the feedbacks received from Biogas Companies and SEPP, this programme was enlarged to Slurry Extension Programme-I (SEP-I) and was introduced with effect from February 1, 1997 to 1999 with general objectives of maximizing the benefits of biogas plants by making the best use of slurry for crop production. Again, SEP-I was extended to SEP-II and was executed from September 1, 1998 to September 1, 2001 with overall objective of increasing the effective market for biogas plants by maximizing the benefit of the operated biogas plants through improvement of the use of slurry in crop production. Since 2001 to date slurry promotion programme is being implemented by BSP-N with the help of Biogas Companies. The routine activity of bio-slurry promotion are directed towards: a. creating awareness among biogas users about slurry utilization; b. preparing quality compost; c. conducting farmers field trial with bio-slurry; d. training the different target groups; d. analyzing nutrient contents and pathogens in bio-slurry; e. conducting research on utilization of bio-slurry as food to fish, etc. Thus, impact of slurry extension and promotion programme has been very conducive to make the farmers conscious about the utilization of bio-slurry as fertilizer to enhance crop production and productivity of soils. After 2006 BSP-N visualizes developing strategy for effective implementation of an appropriate Slurry Extension Model (SEM) as proposed in Section 6.6 of the Report. 1.4 Use of Different Fertilizers in the Country With more than eighty percent of the people earning livelihood from agriculture and the sector contributing about 38 percent to the country’s Gross Domestic Product (GDP), Nepalese economy is basically agrarian. Nepalese agriculture is still basically traditional and the crop, livestock and forest are the integral and interlinked components of Nepalese farming systems. Livestock based FYM and compost constitute major portion of the nutrient needs of crops. The use of mineral fertilizer in Nepal started in early 50s with the introduction of Ammonium Sulphate (21% N). Super phosphates (22% P2O5 in ordinary grade and 48% P2O5 in concentrated superphosphate or triple superphosphate) and Muriate of Potash (60% K2O) were
Country Report on the Use of Bio-slurry in Nepal FINAL REPORT
4
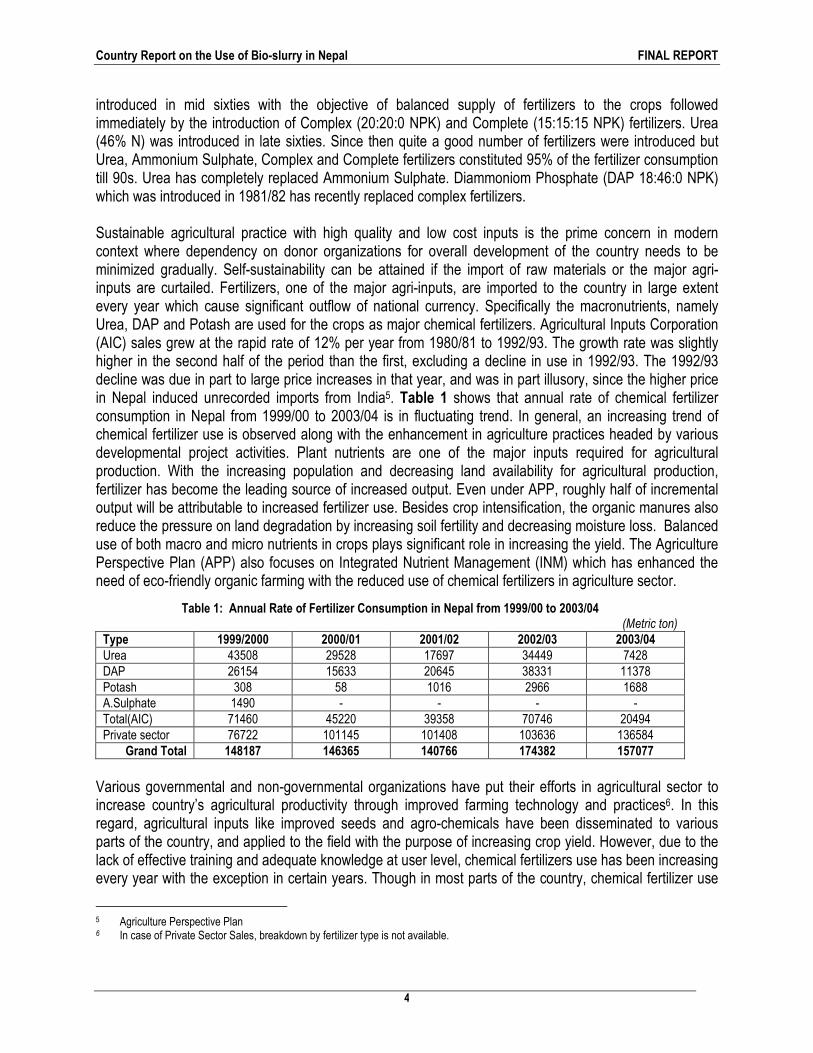
introduced in mid sixties with the objective of balanced supply of fertilizers to the crops followed immediately by the introduction of Complex (20:20:0 NPK) and Complete (15:15:15 NPK) fertilizers. Urea (46% N) was introduced in late sixties. Since then quite a good number of fertilizers were introduced but Urea, Ammonium Sulphate, Complex and Complete fertilizers constituted 95% of the fertilizer consumption till 90s. Urea has completely replaced Ammonium Sulphate. Diammoniom Phosphate (DAP 18:46:0 NPK) which was introduced in 1981/82 has recently replaced complex fertilizers. Sustainable agricultural practice with high quality and low cost inputs is the prime concern in modern context where dependency on donor organizations for overall development of the country needs to be minimized gradually. Self-sustainability can be attained if the import of raw materials or the major agri-inputs are curtailed. Fertilizers, one of the major agri-inputs, are imported to the country in large extent every year which cause significant outflow of national currency. Specifically the macronutrients, namely Urea, DAP and Potash are used for the crops as major chemical fertilizers. Agricultural Inputs Corporation (AIC) sales grew at the rapid rate of 12% per year from 1980/81 to 1992/93. The growth rate was slightly higher in the second half of the period than the first, excluding a decline in use in 1992/93. The 1992/93 decline was due in part to large price increases in that year, and was in part illusory, since the higher price in Nepal induced unrecorded imports from India5. Table 1 shows that annual rate of chemical fertilizer consumption in Nepal from 1999/00 to 2003/04 is in fluctuating trend. In general, an increasing trend of chemical fertilizer use is observed along with the enhancement in agriculture practices headed by various developmental project activities. Plant nutrients are one of the major inputs required for agricultural production. With the increasing population and decreasing land availability for agricultural production, fertilizer has become the leading source of increased output. Even under APP, roughly half of incremental output will be attributable to increased fertilizer use. Besides crop intensification, the organic manures also reduce the pressure on land degradation by increasing soil fertility and decreasing moisture loss. Balanced use of both macro and micro nutrients in crops plays significant role in increasing the yield. The Agriculture Perspective Plan (APP) also focuses on Integrated Nutrient Management (INM) which has enhanced the need of eco-friendly organic farming with the reduced use of chemical fertilizers in agriculture sector.
Table 1: Annual Rate of Fertilizer Consumption in Nepal from 1999/00 to 2003/04 (Metric ton)
Type 1999/2000 2000/01 2001/02 2002/03 2003/04 Urea 43508 29528 17697 34449 7428 DAP 26154 15633 20645 38331 11378 Potash 308 58 1016 2966 1688 A.Sulphate 1490 - - - - Total(AIC) 71460 45220 39358 70746 20494 Private sector 76722 101145 101408 103636 136584
Grand Total 148187 146365 140766 174382 157077
Various governmental and non-governmental organizations have put their efforts in agricultural sector to increase country’s agricultural productivity through improved farming technology and practices6. In this regard, agricultural inputs like improved seeds and agro-chemicals have been disseminated to various parts of the country, and applied to the field with the purpose of increasing crop yield. However, due to the lack of effective training and adequate knowledge at user level, chemical fertilizers use has been increasing every year with the exception in certain years. Though in most parts of the country, chemical fertilizer use
5 Agriculture Perspective Plan 6 In case of Private Sector Sales, breakdown by fertilizer type is not available.
Country Report on the Use of Bio-slurry in Nepal FINAL REPORT
5
has been within the limit of recommended dose, the unbalanced use of organic and inorganic fertilizers has degraded soil fertility in certain parts. Farmers are facing the problems of soil hardening, decreased soil moisture retaining capacity and reduced fertility. Hence it is extremely necessary that farmers be encouraged and trained to adopt sustainable practices to maintain the soil fertility by using eco-friendly and low-cost local measures. Mostly used organic manure which is available locally is FYM.
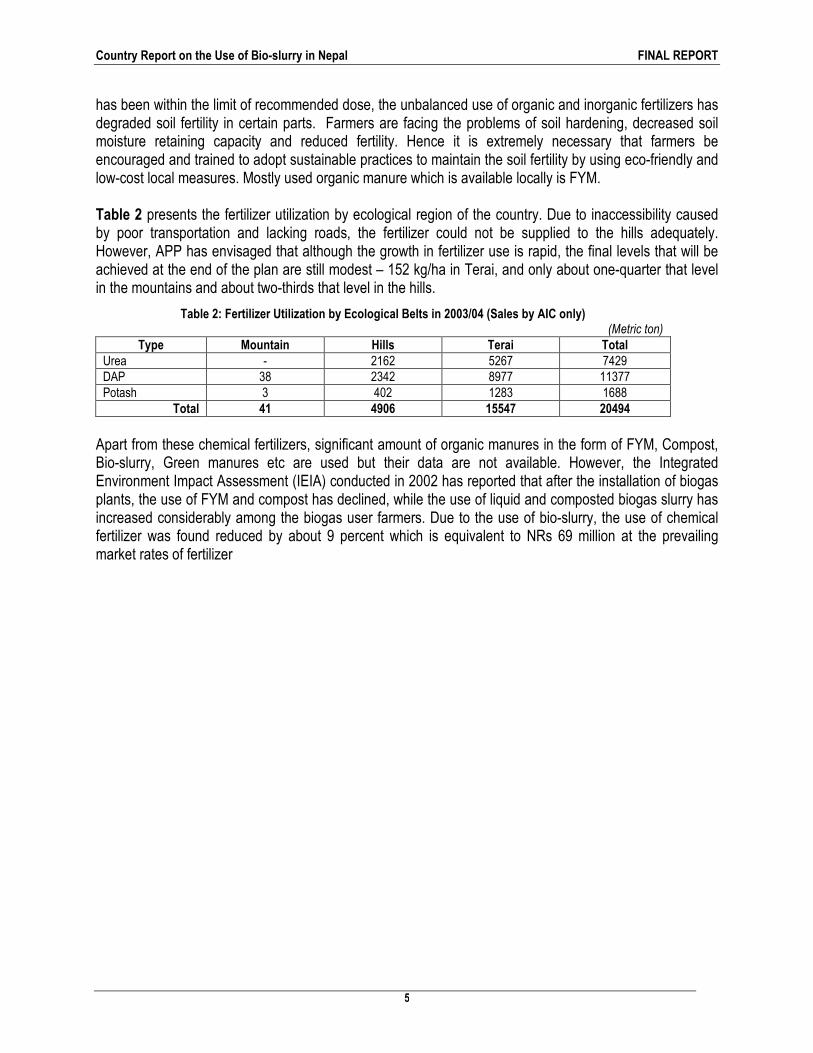
Table 2 presents the fertilizer utilization by ecological region of the country. Due to inaccessibility caused by poor transportation and lacking roads, the fertilizer could not be supplied to the hills adequately. However, APP has envisaged that although the growth in fertilizer use is rapid, the final levels that will be achieved at the end of the plan are still modest – 152 kg/ha in Terai, and only about one-quarter that level in the mountains and about two-thirds that level in the hills.
Table 2: Fertilizer Utilization by Ecological Belts in 2003/04 (Sales by AIC only) (Metric ton)
Type Mountain Hills Terai Total Urea - 2162 5267 7429 DAP 38 2342 8977 11377 Potash 3 402 1283 1688
Total 41 4906 15547 20494
Apart from these chemical fertilizers, significant amount of organic manures in the form of FYM, Compost, Bio-slurry, Green manures etc are used but their data are not available. However, the Integrated Environment Impact Assessment (IEIA) conducted in 2002 has reported that after the installation of biogas plants, the use of FYM and compost has declined, while the use of liquid and composted biogas slurry has increased considerably among the biogas user farmers. Due to the use of bio-slurry, the use of chemical fertilizer was found reduced by about 9 percent which is equivalent to NRs 69 million at the prevailing market rates of fertilizer
Country Report on the Use of Bio-slurry in Nepal FINAL REPORT
6
2.1 General Objective The general objective of this report on the Use of Bio-slurry in Nepal is to make a comprehensive assessment on bio-slurry use and its impacts on various aspects, specifically on the following: � Characterization of the bio-slurry; � Overview of bio-slurry handling (storage, process and transport) and its application; � Effects of extension and training programmes on the practice of biogas farmers in Nepal regarding
bio-slurry use; � Strengths, weaknesses, opportunities and threats of bio-slurry; and � Use of bio-slurry at present and recommendations for its use in future. The specific objective is to prepare a report on bio-slurry presenting all scattered information in a consolidated form with the motive of information sharing at international level through the conference which is going to be held in Thailand, Bangkok on 27 and 28 September 2006. 2.2 Methodology and Approach The methodology followed for the report preparation includes: � Review of various documents/literature related to concerned study in the past; � Consultation with concerned personnel for necessary information; and � Collection of secondary data on various aspects of slurry use, including data on recently
accomplished physico-chemical analysis of different organic manures.
2.3 Limitations of the Study The limitations of the study are: � Unavailability of properly documented information on the slurry use; � Lack of adequate consolidated information on slurry application study; and � No research continuity on slurry application.
Chapter Chapter Chapter Chapter OBJECTIVE, METHODLOGY AND LIMITATION
Country Report on the Use of Bio-slurry in Nepal FINAL REPORT
7
3.1 Bio-slurry in Relation to Traditional and Improved Organic Manure Average farms in Nepal are characterized by their small land holding of about 0.2 ha and integration of agriculture with a few heads of animal and birds. Three-quarters of all households in Nepal raise cattle, and one-half raise buffalo, goats and poultry. About two-thirds of livestock owners cultivate less than 1.0 ha of land (National Sample Census of Agriculture for Nepal, 1991/92). This situation favors the production of organic manure at the household level for augmenting agricultural production through increased use of organic manure. Biogas supports such a strategy by preventing the burning of agricultural and animal waste for meeting household energy needs and providing nutrient rich slurry for crops and livestock. In above backdrop, the characterization of bio-slurry in comparison to other organic manure such as traditionally prepared farmyard manure (FYM), improved compost and slurry compost (in case of biogas farmers) has been discussed in following sections (Section 3.1.1 to 3.1.4). 3.1.1 Farm Yard Manure The farming community of Nepal has been preparing and utilizing the Farm Yard Manure since times immemorial. Lot of refuge is generated from the feed given to the animals in the shed. Sometimes they also spread bedding materials of organic nature in the cattle shed. Mostly they dump these materials to rot in the open space near cattle shed. Usually, the materials are left rotten in nature for couple of months and is emptied or transported to the field depending upon time of cultivation of the crop. As a result, the FYM doesn’t prove to be nutrient rich scientifically. � Most of the time manure is not well decomposed; � There is lot of nutrient loss, due to exposure to sun and leaching by rain; � The decomposition process becomes very slow as there is no turning of materials; � Virtually little urine is collected, if cattle shed is not improved; and � All aforesaid facts reveal that FYM so produced is a manure of little value to agriculture.
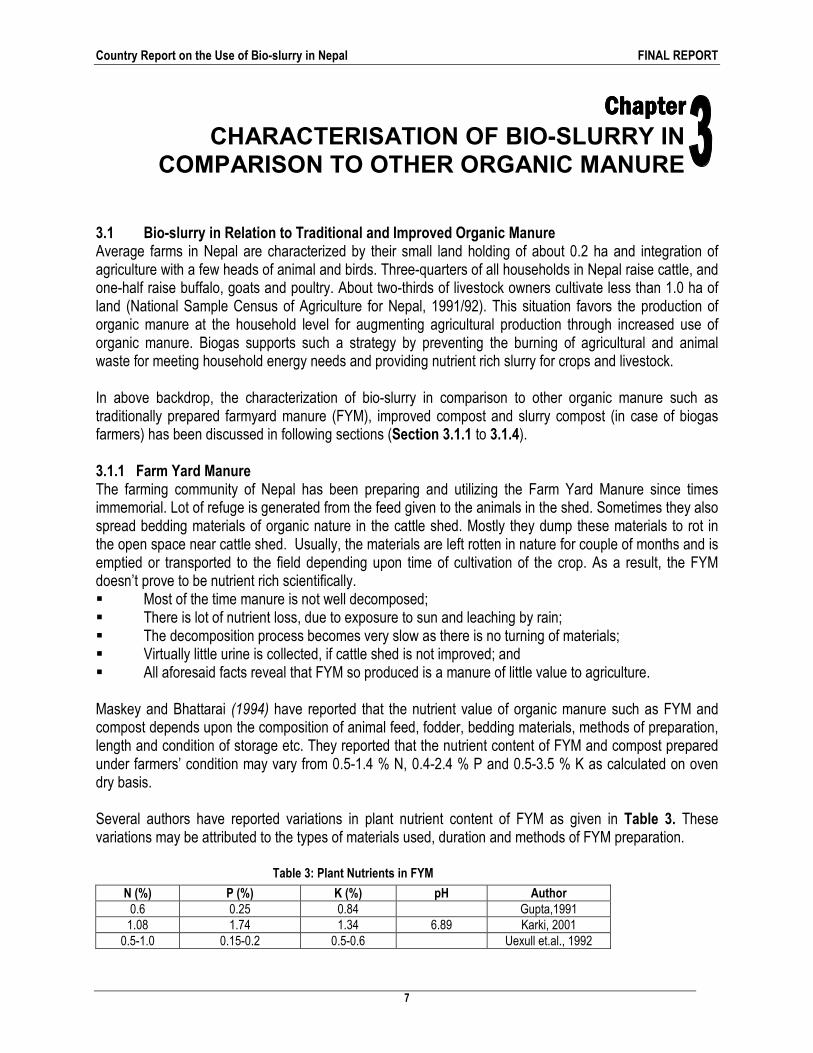
Maskey and Bhattarai (1994) have reported that the nutrient value of organic manure such as FYM and compost depends upon the composition of animal feed, fodder, bedding materials, methods of preparation, length and condition of storage etc. They reported that the nutrient content of FYM and compost prepared under farmers’ condition may vary from 0.5-1.4 % N, 0.4-2.4 % P and 0.5-3.5 % K as calculated on oven dry basis. Several authors have reported variations in plant nutrient content of FYM as given in Table 3. These variations may be attributed to the types of materials used, duration and methods of FYM preparation.
Table 3: Plant Nutrients in FYM
N (%) P (%) K (%) pH Author 0.6 0.25 0.84 Gupta,1991 1.08 1.74 1.34 6.89 Karki, 2001 0.5-1.0 0.15-0.2 0.5-0.6 Uexull et.al., 1992
Chapter Chapter Chapter Chapter CHARACTERISATION OF BIO-SLURRY IN
COMPARISON TO OTHER ORGANIC MANURE
Country Report on the Use of Bio-slurry in Nepal FINAL REPORT
8
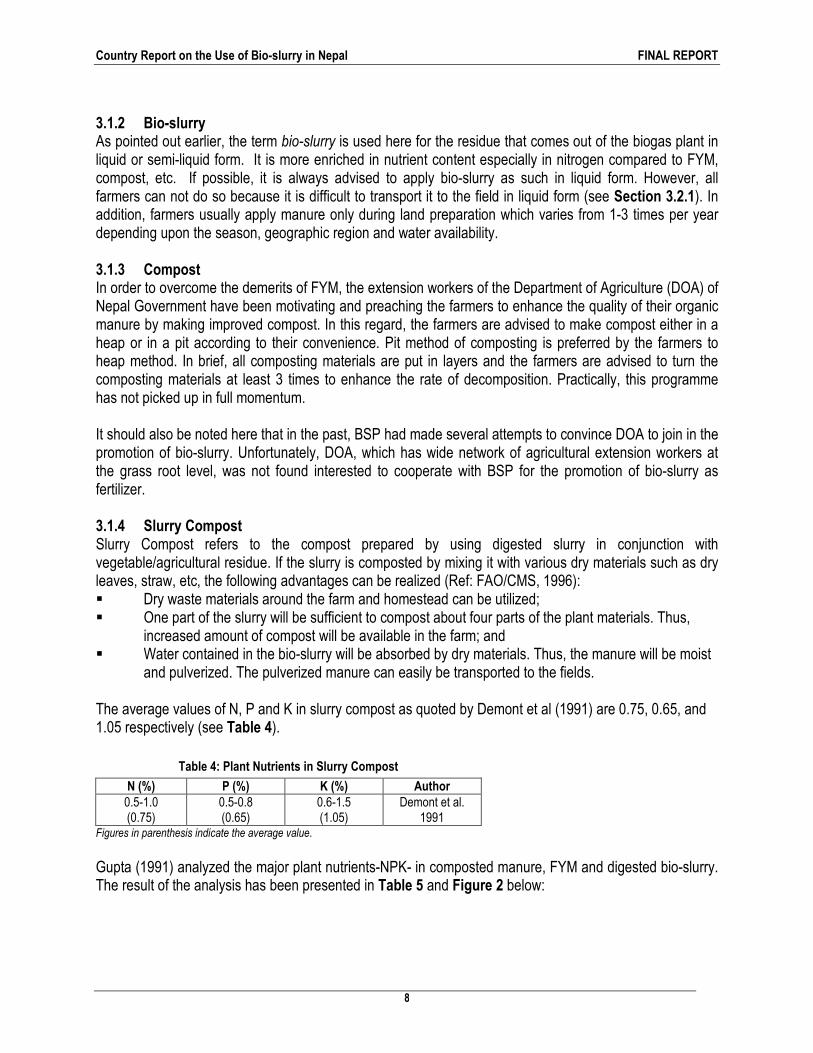
3.1.2 Bio-slurry As pointed out earlier, the term bio-slurry is used here for the residue that comes out of the biogas plant in liquid or semi-liquid form. It is more enriched in nutrient content especially in nitrogen compared to FYM, compost, etc. If possible, it is always advised to apply bio-slurry as such in liquid form. However, all farmers can not do so because it is difficult to transport it to the field in liquid form (see Section 3.2.1). In addition, farmers usually apply manure only during land preparation which varies from 1-3 times per year depending upon the season, geographic region and water availability. 3.1.3 Compost In order to overcome the demerits of FYM, the extension workers of the Department of Agriculture (DOA) of Nepal Government have been motivating and preaching the farmers to enhance the quality of their organic manure by making improved compost. In this regard, the farmers are advised to make compost either in a heap or in a pit according to their convenience. Pit method of composting is preferred by the farmers to heap method. In brief, all composting materials are put in layers and the farmers are advised to turn the composting materials at least 3 times to enhance the rate of decomposition. Practically, this programme has not picked up in full momentum. It should also be noted here that in the past, BSP had made several attempts to convince DOA to join in the promotion of bio-slurry. Unfortunately, DOA, which has wide network of agricultural extension workers at the grass root level, was not found interested to cooperate with BSP for the promotion of bio-slurry as fertilizer. 3.1.4 Slurry Compost Slurry Compost refers to the compost prepared by using digested slurry in conjunction with vegetable/agricultural residue. If the slurry is composted by mixing it with various dry materials such as dry leaves, straw, etc, the following advantages can be realized (Ref: FAO/CMS, 1996): � Dry waste materials around the farm and homestead can be utilized; � One part of the slurry will be sufficient to compost about four parts of the plant materials. Thus,
increased amount of compost will be available in the farm; and � Water contained in the bio-slurry will be absorbed by dry materials. Thus, the manure will be moist
and pulverized. The pulverized manure can easily be transported to the fields. The average values of N, P and K in slurry compost as quoted by Demont et al (1991) are 0.75, 0.65, and 1.05 respectively (see Table 4).
Table 4: Plant Nutrients in Slurry Compost
N (%) P (%) K (%) Author 0.5-1.0 (0.75)
0.5-0.8 (0.65)
0.6-1.5 (1.05)
Demont et al. 1991
Figures in parenthesis indicate the average value.
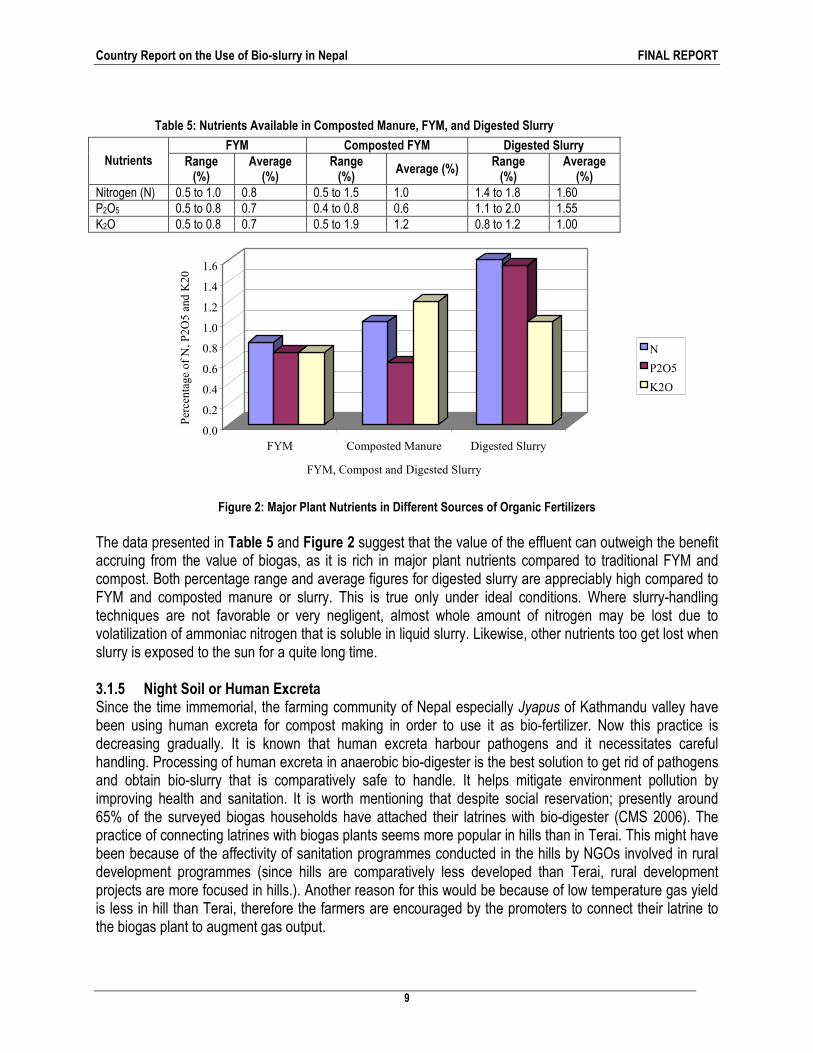
Gupta (1991) analyzed the major plant nutrients-NPK- in composted manure, FYM and digested bio-slurry. The result of the analysis has been presented in Table 5 and Figure 2 below:
Country Report on the Use of Bio-slurry in Nepal FINAL REPORT
9
Table 5: Nutrients Available in Composted Manure, FYM, and Digested Slurry
FYM Composted FYM Digested Slurry Nutrients Range
(%) Average
(%) Range (%)
Average (%) Range (%)
Average (%)
Nitrogen (N) 0.5 to 1.0 0.8 0.5 to 1.5 1.0 1.4 to 1.8 1.60 P2O5 0.5 to 0.8 0.7 0.4 to 0.8 0.6 1.1 to 2.0 1.55 K2O 0.5 to 0.8 0.7 0.5 to 1.9 1.2 0.8 to 1.2 1.00
0.0
0.2
0.4
0.6
0.8
1.0
1.2
1.4
1.6
Percentage of N, P2O5 and K20
FYM Composted Manure Digested Slurry
FYM, Compost and Digested Slurry
N
P2O5
K2O
Figure 2: Major Plant Nutrients in Different Sources of Organic Fertilizers
The data presented in Table 5 and Figure 2 suggest that the value of the effluent can outweigh the benefit accruing from the value of biogas, as it is rich in major plant nutrients compared to traditional FYM and compost. Both percentage range and average figures for digested slurry are appreciably high compared to FYM and composted manure or slurry. This is true only under ideal conditions. Where slurry-handling techniques are not favorable or very negligent, almost whole amount of nitrogen may be lost due to volatilization of ammoniac nitrogen that is soluble in liquid slurry. Likewise, other nutrients too get lost when slurry is exposed to the sun for a quite long time. 3.1.5 Night Soil or Human Excreta Since the time immemorial, the farming community of Nepal especially Jyapus of Kathmandu valley have been using human excreta for compost making in order to use it as bio-fertilizer. Now this practice is decreasing gradually. It is known that human excreta harbour pathogens and it necessitates careful handling. Processing of human excreta in anaerobic bio-digester is the best solution to get rid of pathogens and obtain bio-slurry that is comparatively safe to handle. It helps mitigate environment pollution by improving health and sanitation. It is worth mentioning that despite social reservation; presently around 65% of the surveyed biogas households have attached their latrines with bio-digester (CMS 2006). The practice of connecting latrines with biogas plants seems more popular in hills than in Terai. This might have been because of the affectivity of sanitation programmes conducted in the hills by NGOs involved in rural development programmes (since hills are comparatively less developed than Terai, rural development projects are more focused in hills.). Another reason for this would be because of low temperature gas yield is less in hill than Terai, therefore the farmers are encouraged by the promoters to connect their latrine to the biogas plant to augment gas output.

Country Report on the Use of Bio-slurry in Nepal FINAL REPORT
10
3.2 Utilization of Slurry in Different Forms The bio-slurry can be applied in the field in different forms as described below. Biogas Users’ Survey 2006 has reported that around 60% of the sample households utilize it in compost form, 11% in dried form, only 3% in liquid form and the rest 26% do not use the slurry at all. One of the main reasons attributed for not using the slurry is - latrine connection to the plants, bad odour and refusal by labour to handle the slurry produced from latrine attached plants. 3.2.1 Liquid Form The digested slurry can be applied directly in the field using a bucket or it can directly be discharged through an irrigation canal. However, these methods of applying slurry directly in field have some limitations. Firstly, year round irrigation facility is not available to all farmers. Secondly, when irrigation water is supplied from one field to another, it has tendency to settle in the first plot due to slowing down of velocity and does not get uniformly distributed. Finally, when the farms are located far from the biogas plant, it is difficult to transport in liquid form. Hence, this method is more suited to the farmers growing vegetables in the kitchen garden or raising fish in the pond. As the slurry contains readily available form of plant nutrients, it can be applied both as basal and topdressings. If it is applied to standing crop, it should be diluted with water at the ratio of 1:1.5 -2.0. Otherwise, it will have burning effect on the lower leaves of plants due to high concentration of ammonia and phosphorus in it. To avoid the loss of ammonia (NH4+), wet slurry should be utilized immediately after it is transported to the field (Kijne, 1984; Demont et al., 1990). Usually, the application of slurry should be tied up with the intercultural operations of the crop on which the slurry is to be applied. Therefore, storage of wet slurry is an important issue and needs to be covered separately. 3.2.2 Dried Form As the transportation of the liquid slurry is difficult, most of the farmers prefer to dry the slurry before transporting it to the field. When the slurry is dried, the nitrogen, particularly in the form of ammonium is lost by volatilization and nutritive value of the slurry is diminished. Hence this is least efficient method of slurry utilization. In larger community plants, some practical methods of dehydration of slurry may be desirable but not much research has been done in this regard. 3.2.3 Composted Form The best way to overcome the above mentioned drawbacks are to utilize the slurry by making compost. To minimize the loss of nutrient contents in the compost, it should be taken to the field only when required and should be mixed with soil as soon as possible. Following advantages can be accrued due to its utilization for making compost by mixing it with various dry organic materials and kitchen waste. � One part of the slurry will be sufficient to compost about three to four parts of dry plant materials.
This will result into the increased volume of compost in the farm; � Water contained in the slurry will be absorbed by dry materials and therefore, the manure will
become moist and pulverized. The pulverized manure can be easily transported to the fields; � The dry materials around the farm and homestead such as litter and kitchen waste can be properly
utilized; � To protect the loss of nutrient from direct sun light, the farmers are advised to grow creeping plants
such as bitter guard (karela), bottle guard (lauka) over pit (see Photo 1); and
Country Report on the Use of Bio-slurry in Nepal FINAL REPORT
11
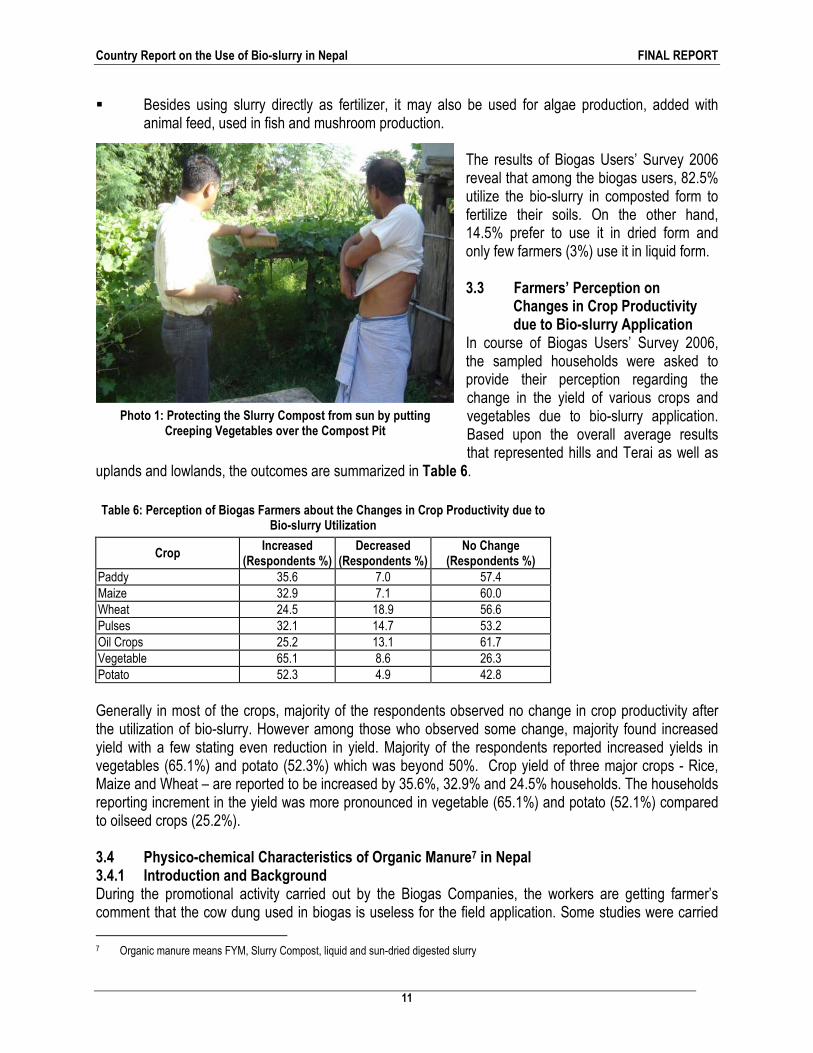
� Besides using slurry directly as fertilizer, it may also be used for algae production, added with animal feed, used in fish and mushroom production.
The results of Biogas Users’ Survey 2006 reveal that among the biogas users, 82.5% utilize the bio-slurry in composted form to fertilize their soils. On the other hand, 14.5% prefer to use it in dried form and only few farmers (3%) use it in liquid form. 3.3 Farmers’ Perception on Changes in Crop Productivity due to Bio-slurry Application In course of Biogas Users’ Survey 2006, the sampled households were asked to provide their perception regarding the change in the yield of various crops and vegetables due to bio-slurry application. Based upon the overall average results that represented hills and Terai as well as
uplands and lowlands, the outcomes are summarized in Table 6.
Table 6: Perception of Biogas Farmers about the Changes in Crop Productivity due to Bio-slurry Utilization
Crop Increased
(Respondents %) Decreased
(Respondents %) No Change
(Respondents %) Paddy 35.6 7.0 57.4 Maize 32.9 7.1 60.0 Wheat 24.5 18.9 56.6 Pulses 32.1 14.7 53.2 Oil Crops 25.2 13.1 61.7 Vegetable 65.1 8.6 26.3 Potato 52.3 4.9 42.8
Generally in most of the crops, majority of the respondents observed no change in crop productivity after the utilization of bio-slurry. However among those who observed some change, majority found increased yield with a few stating even reduction in yield. Majority of the respondents reported increased yields in vegetables (65.1%) and potato (52.3%) which was beyond 50%. Crop yield of three major crops - Rice, Maize and Wheat – are reported to be increased by 35.6%, 32.9% and 24.5% households. The households reporting increment in the yield was more pronounced in vegetable (65.1%) and potato (52.1%) compared to oilseed crops (25.2%). 3.4 Physico-chemical Characteristics of Organic Manure7 in Nepal 3.4.1 Introduction and Background During the promotional activity carried out by the Biogas Companies, the workers are getting farmer’s comment that the cow dung used in biogas is useless for the field application. Some studies were carried
7 Organic manure means FYM, Slurry Compost, liquid and sun-dried digested slurry
Photo 1: Protecting the Slurry Compost from sun by putting Creeping Vegetables over the Compost Pit

Country Report on the Use of Bio-slurry in Nepal FINAL REPORT
12
out in the past to find out its effect in the crop production during which the nutrient contents in the slurry were also studied. Different workers had reported wide variation in the nutrient content in biogas slurry. Theoretically, in the anaerobic condition most of the compounds will be in reduced form. Therefore, most of the nitrogen will be in the ammonium form (NH4+), which is readily available to the plant. Similarly, phosphorus and potassium will also be in readily available form to plant as they are released from organic complex. Furthermore, in biogas digester there should be no loss of nutrients except nitrogen in NH4+ form. Loss of nitrogen from NH4+ form should not be major problem unless the quantity is in high concentration. Therefore, it has been very important to find out if the farmer’s statement has any valid reasoning. The study reported herein is considered to be of paramount importance to the farming community for persuading them about the value of bio-slurry, which is not merely a waste byproduct but it is an invaluable resource or asset to them. In above backdrop, BSP-Nepal has initiated a programme in April 2006 to carry out physico-chemical analysis of bio-slurry and farmyard manure for comparison of nutrient contents and other benefits so as to better promote bio-slurry. Primary objective of this study was to assess the nutrient contents and other physical attributes of farmyard manure, bio-compost and biogas slurry for a comparative study. The study focused specifically on the determination of the nutrient contents and physical attributes of: � Slurry from latrine attached biogas plants; � Slurry from non-latrine attached biogas plants; � Slurry Compost8 (compost prepared by using bio-slurry) from both types of plants; and � Farm Yard manure. Secondary objective of the study was to further provide specific and workable recommendations for better promotion of bio-slurry. 3.4.2 Sampling A total of eight districts representing different ecological belts of the country (Hills and Terai) were chosen for collecting the slurry sampled for physico-chemical analyses. The districts selected were: Dhankuta, and Sunsari districts in Eastern Development Region (EDR); Sarlahi and Dhading in Central Development Region (CDR); Rupandehi and Lamjung in Western Developmnet Region (WDR) and Surkhet and Banke in Mid-Western Development Region (MWDR). Out of the selected plants, altogether 100 samples were randomly collected for physico-chemical analyses as follows: � 25 samples from latrine-attached plant; � 25 samples from non-latrine attached plants; � 25 samples from Slurry Compost; and � 25 samples from Farm Yard Manure (FYM). The overall distribution of the samples has been depicted in Table 7.
8 “Slurry Compost” means the compost or organic fertilizer prepared by utilizing anaerobically digested slurry with other biodegradable
wastes.
Country Report on the Use of Bio-slurry in Nepal FINAL REPORT
13
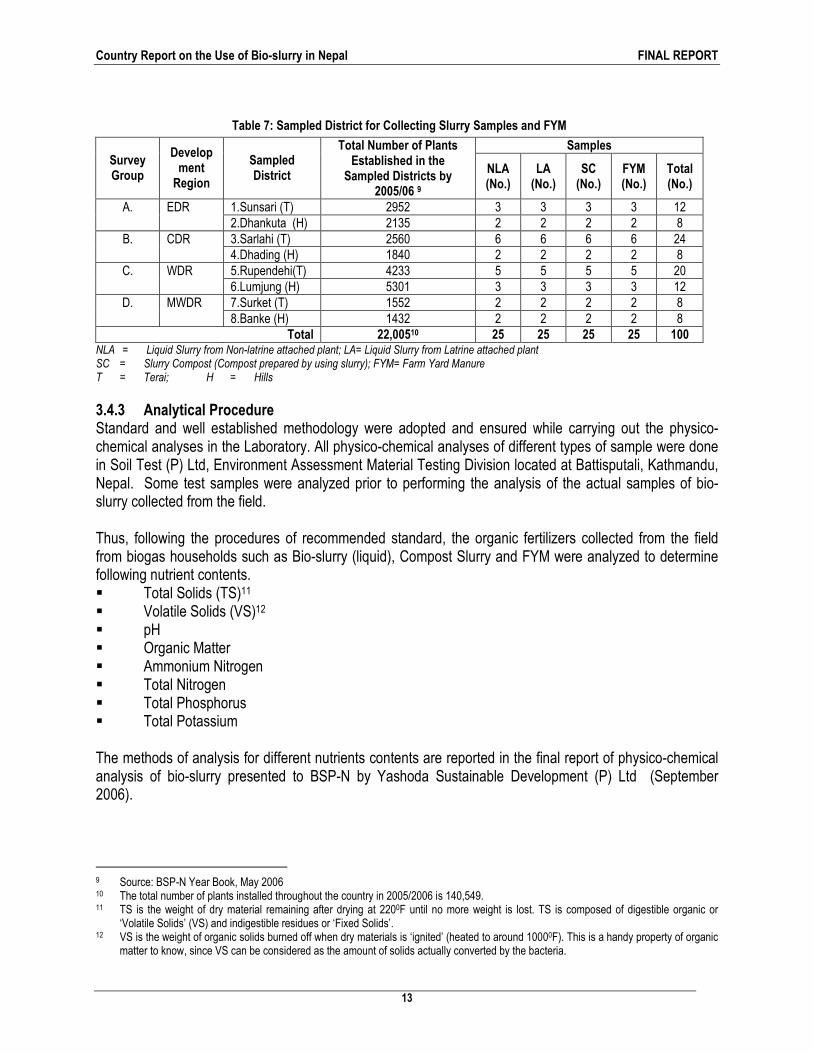
Table 7: Sampled District for Collecting Slurry Samples and FYM
Samples Survey Group
Development Region
Sampled District
Total Number of Plants Established in the
Sampled Districts by 2005/06 9
NLA (No.)
LA (No.)
SC (No.)
FYM (No.)
Total (No.)
1.Sunsari (T) 2952 3 3 3 3 12 A. EDR 2.Dhankuta (H) 2135 2 2 2 2 8 3.Sarlahi (T) 2560 6 6 6 6 24 B. CDR 4.Dhading (H) 1840 2 2 2 2 8 5.Rupendehi(T) 4233 5 5 5 5 20 C. WDR 6.Lumjung (H) 5301 3 3 3 3 12 7.Surket (T) 1552 2 2 2 2 8 D. MWDR 8.Banke (H) 1432 2 2 2 2 8
Total 22,00510 25 25 25 25 100 NLA = Liquid Slurry from Non-latrine attached plant; LA= Liquid Slurry from Latrine attached plant SC = Slurry Compost (Compost prepared by using slurry); FYM= Farm Yard Manure T = Terai; H = Hills
3.4.3 Analytical Procedure Standard and well established methodology were adopted and ensured while carrying out the physico-chemical analyses in the Laboratory. All physico-chemical analyses of different types of sample were done in Soil Test (P) Ltd, Environment Assessment Material Testing Division located at Battisputali, Kathmandu, Nepal. Some test samples were analyzed prior to performing the analysis of the actual samples of bio-slurry collected from the field. Thus, following the procedures of recommended standard, the organic fertilizers collected from the field from biogas households such as Bio-slurry (liquid), Compost Slurry and FYM were analyzed to determine following nutrient contents. � Total Solids (TS)11 � Volatile Solids (VS)12 � pH � Organic Matter � Ammonium Nitrogen � Total Nitrogen � Total Phosphorus � Total Potassium The methods of analysis for different nutrients contents are reported in the final report of physico-chemical analysis of bio-slurry presented to BSP-N by Yashoda Sustainable Development (P) Ltd (September 2006).
9 Source: BSP-N Year Book, May 2006 10 The total number of plants installed throughout the country in 2005/2006 is 140,549. 11 TS is the weight of dry material remaining after drying at 2200F until no more weight is lost. TS is composed of digestible organic or
‘Volatile Solids’ (VS) and indigestible residues or ‘Fixed Solids’. 12 VS is the weight of organic solids burned off when dry materials is ‘ignited’ (heated to around 10000F). This is a handy property of organic
matter to know, since VS can be considered as the amount of solids actually converted by the bacteria.
Country Report on the Use of Bio-slurry in Nepal FINAL REPORT
14
3.4.4 Results of Analytical Data A. Comparison of Analytical Value of the Different Categories of Organic Manures Based upon the analyses in Soil Testing Laboratory, the results of different groups of organic manures are presented and discussed in the following sub-heading in the context of ecological belts (i.e. Terai and Hills): (a) Liquid Slurry from Non-Latrine attached Biogas Plant (NLA); (b) Liquid Slurry from Latrine attached Biogas Plant (LA); (c) Slurry Compost Prepared by using Bio-slurry (Non-latrine attached) (SCNLA); (d) Slurry Compost Prepared by using Bio-slurry (Latrine attached) (SCLA); and (e) Farm Yard Manure (FYM).
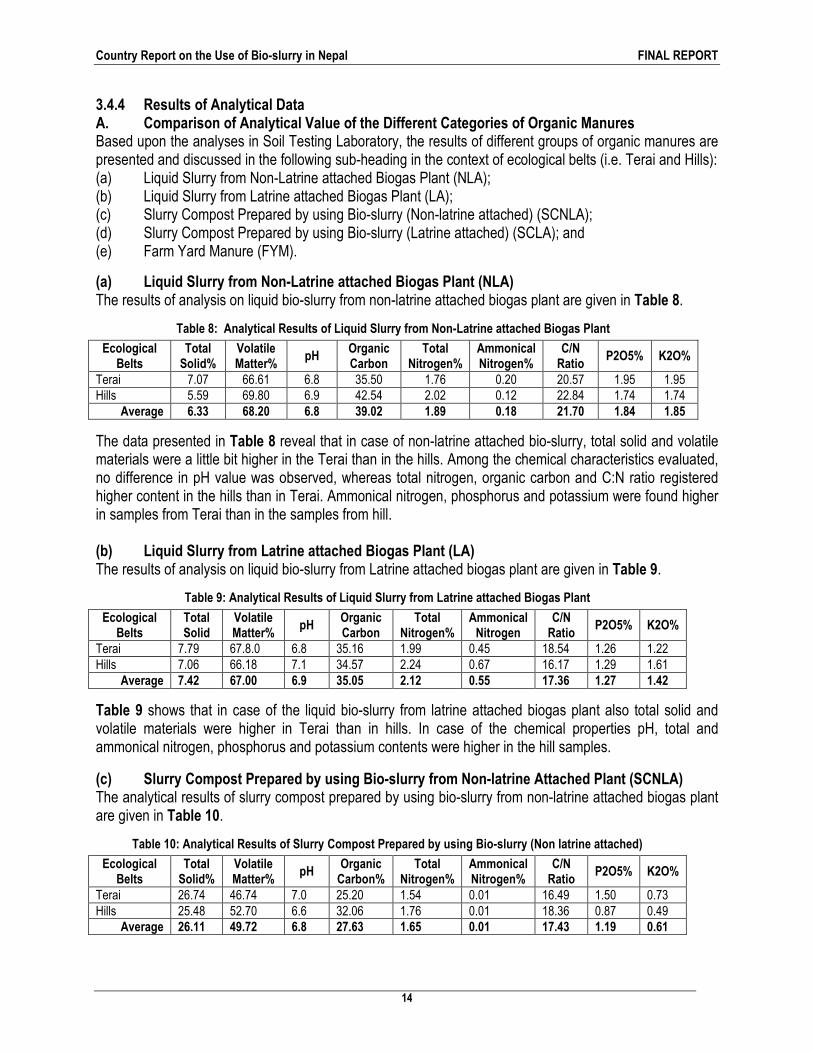
(a) Liquid Slurry from Non-Latrine attached Biogas Plant (NLA) The results of analysis on liquid bio-slurry from non-latrine attached biogas plant are given in Table 8.
Table 8: Analytical Results of Liquid Slurry from Non-Latrine attached Biogas Plant
Ecological Belts
Total Solid%
Volatile Matter%
pH Organic Carbon
Total Nitrogen%
Ammonical Nitrogen%
C/N Ratio
P2O5% K2O%
Terai 7.07 66.61 6.8 35.50 1.76 0.20 20.57 1.95 1.95 Hills 5.59 69.80 6.9 42.54 2.02 0.12 22.84 1.74 1.74
Average 6.33 68.20 6.8 39.02 1.89 0.18 21.70 1.84 1.85
The data presented in Table 8 reveal that in case of non-latrine attached bio-slurry, total solid and volatile materials were a little bit higher in the Terai than in the hills. Among the chemical characteristics evaluated, no difference in pH value was observed, whereas total nitrogen, organic carbon and C:N ratio registered higher content in the hills than in Terai. Ammonical nitrogen, phosphorus and potassium were found higher in samples from Terai than in the samples from hill. (b) Liquid Slurry from Latrine attached Biogas Plant (LA) The results of analysis on liquid bio-slurry from Latrine attached biogas plant are given in Table 9.
Table 9: Analytical Results of Liquid Slurry from Latrine attached Biogas Plant
Ecological Belts
Total Solid
Volatile Matter%
pH Organic Carbon
Total Nitrogen%
Ammonical Nitrogen
C/N Ratio
P2O5% K2O%
Terai 7.79 67.8.0 6.8 35.16 1.99 0.45 18.54 1.26 1.22 Hills 7.06 66.18 7.1 34.57 2.24 0.67 16.17 1.29 1.61
Average 7.42 67.00 6.9 35.05 2.12 0.55 17.36 1.27 1.42
Table 9 shows that in case of the liquid bio-slurry from latrine attached biogas plant also total solid and volatile materials were higher in Terai than in hills. In case of the chemical properties pH, total and ammonical nitrogen, phosphorus and potassium contents were higher in the hill samples.
(c) Slurry Compost Prepared by using Bio-slurry from Non-latrine Attached Plant (SCNLA) The analytical results of slurry compost prepared by using bio-slurry from non-latrine attached biogas plant are given in Table 10.
Table 10: Analytical Results of Slurry Compost Prepared by using Bio-slurry (Non latrine attached)
Ecological Belts
Total Solid%
Volatile Matter%
pH Organic Carbon%
Total Nitrogen%
Ammonical Nitrogen%
C/N Ratio
P2O5% K2O%
Terai 26.74 46.74 7.0 25.20 1.54 0.01 16.49 1.50 0.73 Hills 25.48 52.70 6.6 32.06 1.76 0.01 18.36 0.87 0.49
Average 26.11 49.72 6.8 27.63 1.65 0.01 17.43 1.19 0.61
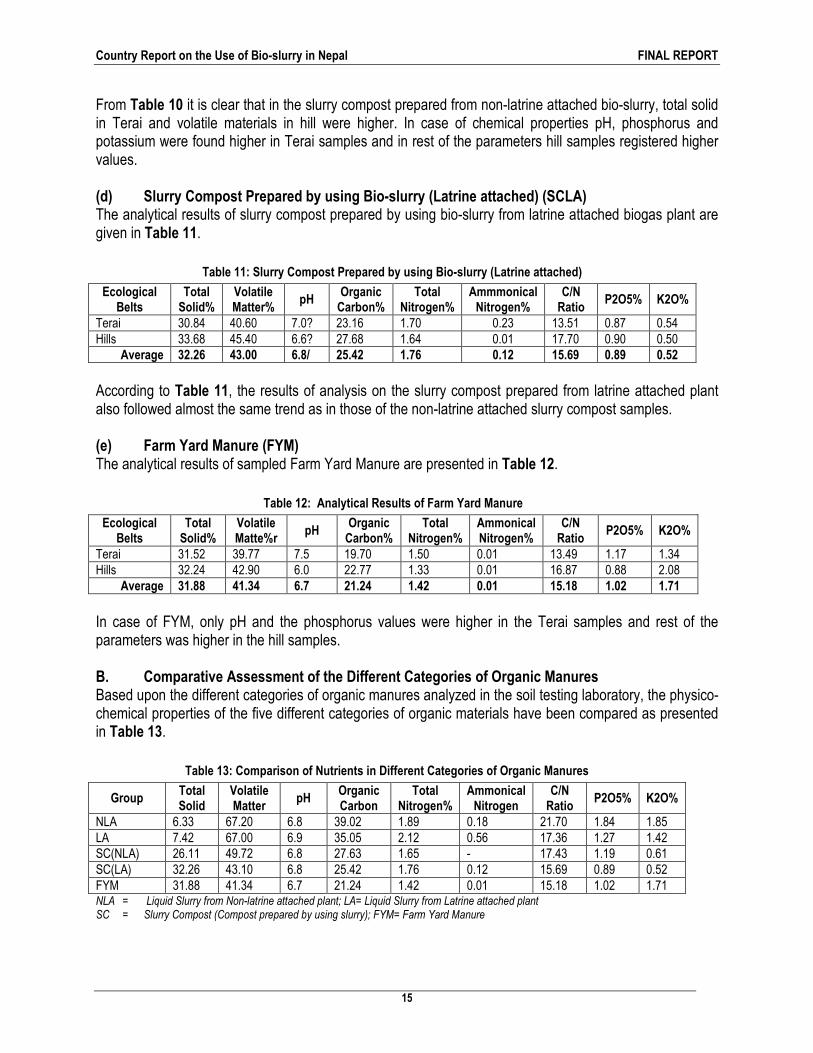
Country Report on the Use of Bio-slurry in Nepal FINAL REPORT
15
From Table 10 it is clear that in the slurry compost prepared from non-latrine attached bio-slurry, total solid in Terai and volatile materials in hill were higher. In case of chemical properties pH, phosphorus and potassium were found higher in Terai samples and in rest of the parameters hill samples registered higher values. (d) Slurry Compost Prepared by using Bio-slurry (Latrine attached) (SCLA) The analytical results of slurry compost prepared by using bio-slurry from latrine attached biogas plant are given in Table 11.
Table 11: Slurry Compost Prepared by using Bio-slurry (Latrine attached)
Ecological Belts
Total Solid%
Volatile Matter%
pH Organic Carbon%
Total Nitrogen%
Ammmonical Nitrogen%
C/N Ratio
P2O5% K2O%
Terai 30.84 40.60 7.0? 23.16 1.70 0.23 13.51 0.87 0.54 Hills 33.68 45.40 6.6? 27.68 1.64 0.01 17.70 0.90 0.50
Average 32.26 43.00 6.8/ 25.42 1.76 0.12 15.69 0.89 0.52
According to Table 11, the results of analysis on the slurry compost prepared from latrine attached plant also followed almost the same trend as in those of the non-latrine attached slurry compost samples. (e) Farm Yard Manure (FYM) The analytical results of sampled Farm Yard Manure are presented in Table 12.
Table 12: Analytical Results of Farm Yard Manure
Ecological Belts
Total Solid%
Volatile Matte%r
pH Organic Carbon%
Total Nitrogen%
Ammonical Nitrogen%
C/N Ratio
P2O5% K2O%
Terai 31.52 39.77 7.5 19.70 1.50 0.01 13.49 1.17 1.34 Hills 32.24 42.90 6.0 22.77 1.33 0.01 16.87 0.88 2.08
Average 31.88 41.34 6.7 21.24 1.42 0.01 15.18 1.02 1.71
In case of FYM, only pH and the phosphorus values were higher in the Terai samples and rest of the parameters was higher in the hill samples. B. Comparative Assessment of the Different Categories of Organic Manures Based upon the different categories of organic manures analyzed in the soil testing laboratory, the physico-chemical properties of the five different categories of organic materials have been compared as presented in Table 13.
Table 13: Comparison of Nutrients in Different Categories of Organic Manures
Group Total Solid
Volatile Matter
pH Organic Carbon
Total Nitrogen%
Ammonical Nitrogen
C/N Ratio
P2O5% K2O%
NLA 6.33 67.20 6.8 39.02 1.89 0.18 21.70 1.84 1.85 LA 7.42 67.00 6.9 35.05 2.12 0.56 17.36 1.27 1.42 SC(NLA) 26.11 49.72 6.8 27.63 1.65 - 17.43 1.19 0.61 SC(LA) 32.26 43.10 6.8 25.42 1.76 0.12 15.69 0.89 0.52 FYM 31.88 41.34 6.7 21.24 1.42 0.01 15.18 1.02 1.71 NLA = Liquid Slurry from Non-latrine attached plant; LA= Liquid Slurry from Latrine attached plant SC = Slurry Compost (Compost prepared by using slurry); FYM= Farm Yard Manure
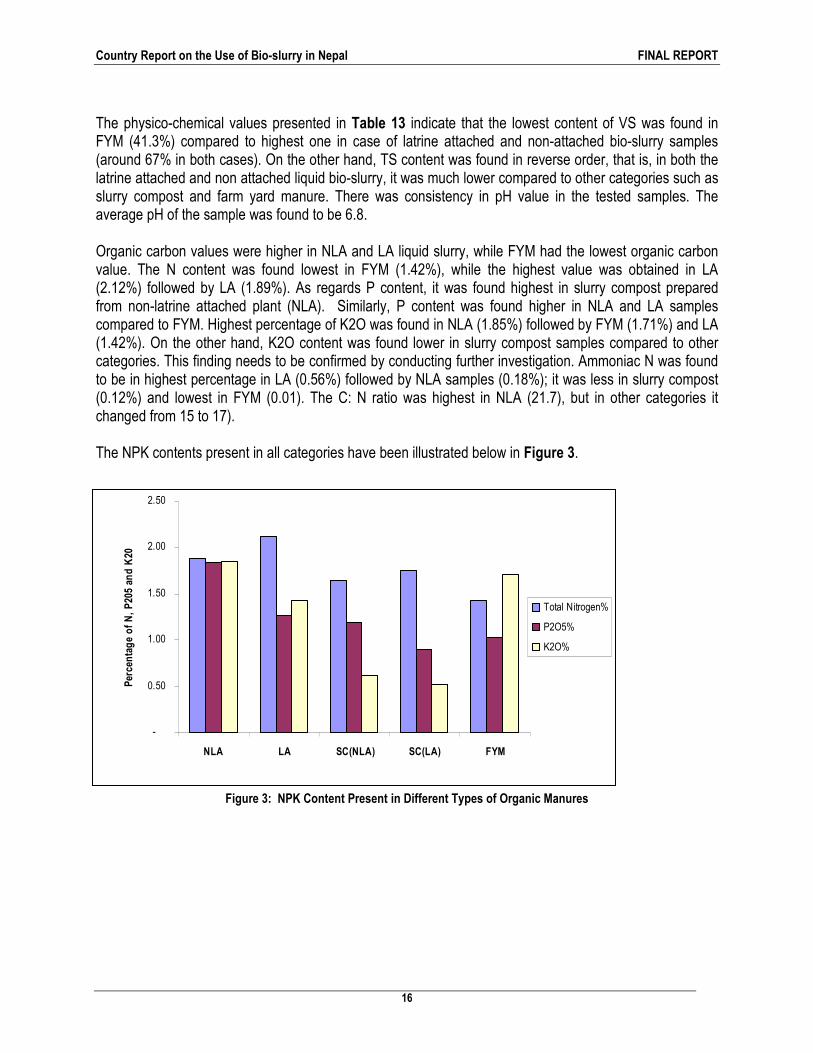
Country Report on the Use of Bio-slurry in Nepal FINAL REPORT
16
The physico-chemical values presented in Table 13 indicate that the lowest content of VS was found in FYM (41.3%) compared to highest one in case of latrine attached and non-attached bio-slurry samples (around 67% in both cases). On the other hand, TS content was found in reverse order, that is, in both the latrine attached and non attached liquid bio-slurry, it was much lower compared to other categories such as slurry compost and farm yard manure. There was consistency in pH value in the tested samples. The average pH of the sample was found to be 6.8. Organic carbon values were higher in NLA and LA liquid slurry, while FYM had the lowest organic carbon value. The N content was found lowest in FYM (1.42%), while the highest value was obtained in LA (2.12%) followed by LA (1.89%). As regards P content, it was found highest in slurry compost prepared from non-latrine attached plant (NLA). Similarly, P content was found higher in NLA and LA samples compared to FYM. Highest percentage of K2O was found in NLA (1.85%) followed by FYM (1.71%) and LA (1.42%). On the other hand, K2O content was found lower in slurry compost samples compared to other categories. This finding needs to be confirmed by conducting further investigation. Ammoniac N was found to be in highest percentage in LA (0.56%) followed by NLA samples (0.18%); it was less in slurry compost (0.12%) and lowest in FYM (0.01). The C: N ratio was highest in NLA (21.7), but in other categories it changed from 15 to 17). The NPK contents present in all categories have been illustrated below in Figure 3.
-
0.50
1.00
1.50
2.00
2.50
NLA LA SC(NLA) SC(LA) FYM
Perce
ntage of N, P205 an
d K
20
Total Nitrogen%
P2O5%
K2O%
Figure 3: NPK Content Present in Different Types of Organic Manures
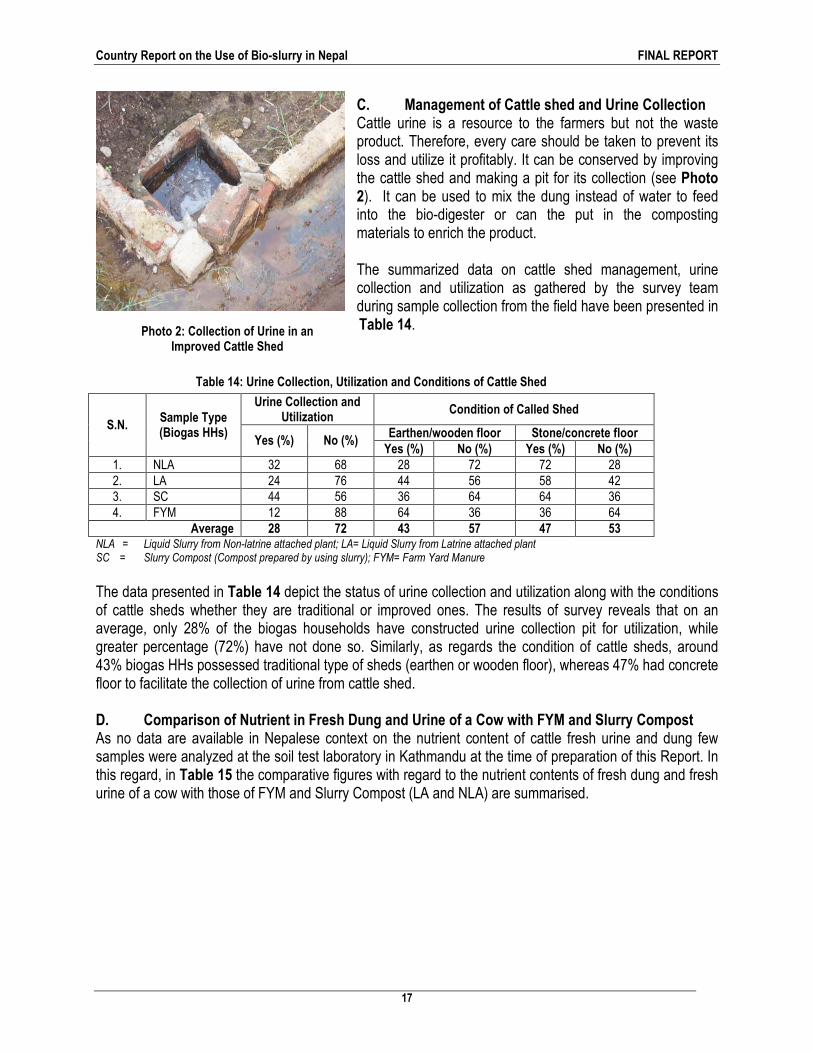
Country Report on the Use of Bio-slurry in Nepal FINAL REPORT
17
C. Management of Cattle shed and Urine Collection Cattle urine is a resource to the farmers but not the waste product. Therefore, every care should be taken to prevent its loss and utilize it profitably. It can be conserved by improving the cattle shed and making a pit for its collection (see Photo 2). It can be used to mix the dung instead of water to feed into the bio-digester or can the put in the composting materials to enrich the product. The summarized data on cattle shed management, urine collection and utilization as gathered by the survey team during sample collection from the field have been presented in Table 14.
Table 14: Urine Collection, Utilization and Conditions of Cattle Shed
Urine Collection and Utilization
Condition of Called Shed
Earthen/wooden floor Stone/concrete floor S.N.
Sample Type (Biogas HHs)
Yes (%) No (%) Yes (%) No (%) Yes (%) No (%)
1. NLA 32 68 28 72 72 28 2. LA 24 76 44 56 58 42 3. SC 44 56 36 64 64 36 4. FYM 12 88 64 36 36 64
Average 28 72 43 57 47 53 NLA = Liquid Slurry from Non-latrine attached plant; LA= Liquid Slurry from Latrine attached plant SC = Slurry Compost (Compost prepared by using slurry); FYM= Farm Yard Manure
The data presented in Table 14 depict the status of urine collection and utilization along with the conditions of cattle sheds whether they are traditional or improved ones. The results of survey reveals that on an average, only 28% of the biogas households have constructed urine collection pit for utilization, while greater percentage (72%) have not done so. Similarly, as regards the condition of cattle sheds, around 43% biogas HHs possessed traditional type of sheds (earthen or wooden floor), whereas 47% had concrete floor to facilitate the collection of urine from cattle shed. D. Comparison of Nutrient in Fresh Dung and Urine of a Cow with FYM and Slurry Compost As no data are available in Nepalese context on the nutrient content of cattle fresh urine and dung few samples were analyzed at the soil test laboratory in Kathmandu at the time of preparation of this Report. In this regard, in Table 15 the comparative figures with regard to the nutrient contents of fresh dung and fresh urine of a cow with those of FYM and Slurry Compost (LA and NLA) are summarised.
Photo 2: Collection of Urine in an Improved Cattle Shed
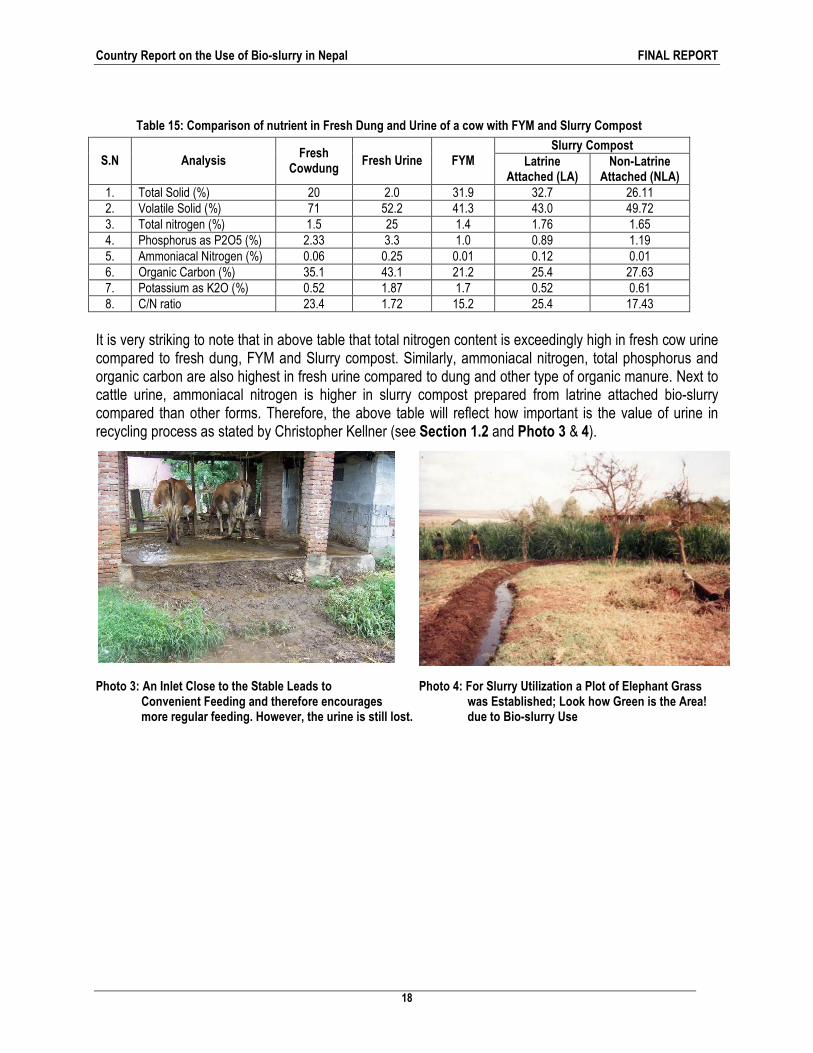
Country Report on the Use of Bio-slurry in Nepal FINAL REPORT
18
Table 15: Comparison of nutrient in Fresh Dung and Urine of a cow with FYM and Slurry Compost
Slurry Compost S.N Analysis
Fresh Cowdung
Fresh Urine FYM Latrine Attached (LA)
Non-Latrine Attached (NLA)
1. Total Solid (%) 20 2.0 31.9 32.7 26.11 2. Volatile Solid (%) 71 52.2 41.3 43.0 49.72 3. Total nitrogen (%) 1.5 25 1.4 1.76 1.65 4. Phosphorus as P2O5 (%) 2.33 3.3 1.0 0.89 1.19 5. Ammoniacal Nitrogen (%) 0.06 0.25 0.01 0.12 0.01 6. Organic Carbon (%) 35.1 43.1 21.2 25.4 27.63 7. Potassium as K2O (%) 0.52 1.87 1.7 0.52 0.61 8. C/N ratio 23.4 1.72 15.2 25.4 17.43
It is very striking to note that in above table that total nitrogen content is exceedingly high in fresh cow urine compared to fresh dung, FYM and Slurry compost. Similarly, ammoniacal nitrogen, total phosphorus and organic carbon are also highest in fresh urine compared to dung and other type of organic manure. Next to cattle urine, ammoniacal nitrogen is higher in slurry compost prepared from latrine attached bio-slurry compared than other forms. Therefore, the above table will reflect how important is the value of urine in recycling process as stated by Christopher Kellner (see Section 1.2 and Photo 3 & 4).
Photo 3: An Inlet Close to the Stable Leads to Photo 4: For Slurry Utilization a Plot of Elephant Grass Convenient Feeding and therefore encourages was Established; Look how Green is the Area! more regular feeding. However, the urine is still lost. due to Bio-slurry Use
Country Report on the Use of Bio-slurry in Nepal FINAL REPORT
19
The digested by-product of biogas plant, generally called Slurry or Bio-slurry is also an equally important output like gas that has high nutrient content essential to agriculture production systems. It has been recognized that the application of slurry in soils besides providing much needed nutrients, growth hormones and enzymes, also improves physico-chemical and biological properties of soils. Realizing the high manorial importance of bio-slurry, Biogas Support Program (BSP) assessing integrated environmental impact has calculated fertilizing values of the bio-slurry during which the nutrient contents of different types of fertilizing materials, and the availability of liquid and composted slurry on per household basis were examined. While calculating the fertilizing value of the composted slurry it was assumed that the equivalent quantity of FYM would have been used had the bio-slurry been not available. Thus the difference in the nutrient contents between the composted slurry and FYM was taken as a factor to calculate its additional fertilizing value. The survey finding of 700 kg increase in the use of digested bio-slurry and 3745 kg composted slurry after the installation of biogas plant per household was used to calculate the additional availability of Nitrogen, Phosphorus and Potash. As per the BSP-N document13, on an average, 1.75 tons of bio-slurry or bio-compost will be available per year from a biogas plant. Based upon the average NPK values in bio-slurry, the theoretical calculation shows that NPK produced per biogas plant will be equivalent to 29, 28 and 13 kg respectively. The Biogas Users’ Survey 2004/5 has reported 136,895 biogas plants in operation. On this basis, the additional values of these nutrients come out to be 3969, 3833 and 1779 tons Nitrogen, Phosphorus and Potash respectively. This large magnitude of availability of these essential nutrients shows the importance of biogas plant installation in terms of manorial value as well. Though Nepalese farmers are used to the practice of applying organic manures like FYM, Compost etc, most biogas users seem to give prime importance to gas without giving much attention to the slurry that comes out from the biogas plant. However with efforts being put at both government as well as non government level, slurry use as manures is slowly getting momentum as has been evidenced by various Biogas Users’ Surveys conducted since last few years. According to Biogas Users' Survey 2004/05, 97% of the respondents used FYM and very few used composted FYM. However after biogas use, it was found that only 41% respondents used FYM and 71% used slurry compost. 4.1 Processing of Bio-slurry As has been stated earlier, slurry that comes out from the outlet is considered very good organic manure. Crop production is seasonal while the bio-slurry production is a continuous process, hence all of them are not immediately used, and Nepalese biogas users invariably follow the practice of composting slurry in pits. In fact compost pits have become essential requirement of biogas plants to collect the biogas slurry. The availability of compost pits not only facilitates the protection of slurry from surface flow but also enhances the decomposition process. The number and size of the pit is generally determined by the size of the biogas plant and the availability of the space. The biogas users’ survey, regularly being conducted by AEPC since last few years, has also shown that majority of the biogas users having compost pits. However
13 BSP 2006, May 2006
Chapter Chapter Chapter Chapter OVERVIEW OF HANDLING AND APPLICATION OF
BIO-SLURRY
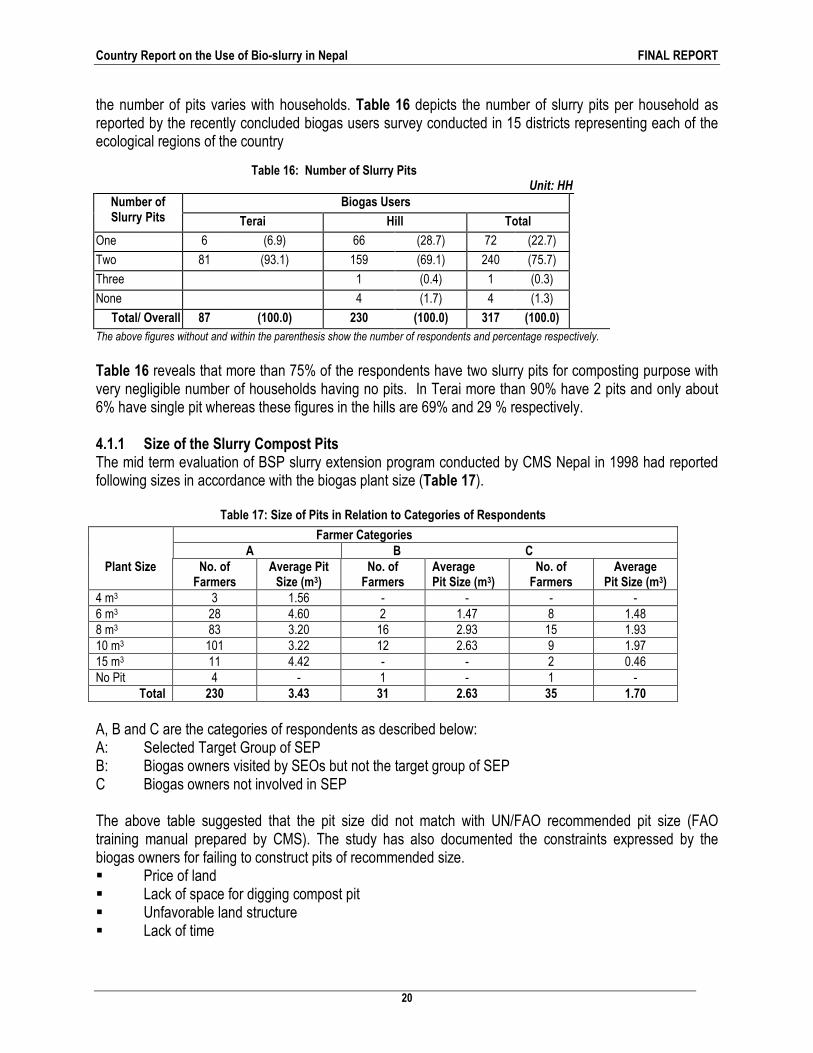
Country Report on the Use of Bio-slurry in Nepal FINAL REPORT
20
the number of pits varies with households. Table 16 depicts the number of slurry pits per household as reported by the recently concluded biogas users survey conducted in 15 districts representing each of the ecological regions of the country
Table 16: Number of Slurry Pits Unit: HH
Biogas Users Number of Slurry Pits Terai Hill Total
One 6 (6.9) 66 (28.7) 72 (22.7) Two 81 (93.1) 159 (69.1) 240 (75.7) Three 1 (0.4) 1 (0.3) None 4 (1.7) 4 (1.3)
Total/ Overall 87 (100.0) 230 (100.0) 317 (100.0) The above figures without and within the parenthesis show the number of respondents and percentage respectively.
Table 16 reveals that more than 75% of the respondents have two slurry pits for composting purpose with very negligible number of households having no pits. In Terai more than 90% have 2 pits and only about 6% have single pit whereas these figures in the hills are 69% and 29 % respectively. 4.1.1 Size of the Slurry Compost Pits The mid term evaluation of BSP slurry extension program conducted by CMS Nepal in 1998 had reported following sizes in accordance with the biogas plant size (Table 17).
Table 17: Size of Pits in Relation to Categories of Respondents
Farmer Categories A B C
Plant Size No. of Farmers
Average Pit Size (m3)
No. of Farmers
Average Pit Size (m3)
No. of Farmers
Average Pit Size (m3)
4 m3 3 1.56 - - - - 6 m3 28 4.60 2 1.47 8 1.48 8 m3 83 3.20 16 2.93 15 1.93 10 m3 101 3.22 12 2.63 9 1.97 15 m3 11 4.42 - - 2 0.46 No Pit 4 - 1 - 1 -
Total 230 3.43 31 2.63 35 1.70
A, B and C are the categories of respondents as described below: A: Selected Target Group of SEP B: Biogas owners visited by SEOs but not the target group of SEP C Biogas owners not involved in SEP The above table suggested that the pit size did not match with UN/FAO recommended pit size (FAO training manual prepared by CMS). The study has also documented the constraints expressed by the biogas owners for failing to construct pits of recommended size. � Price of land � Lack of space for digging compost pit � Unfavorable land structure � Lack of time
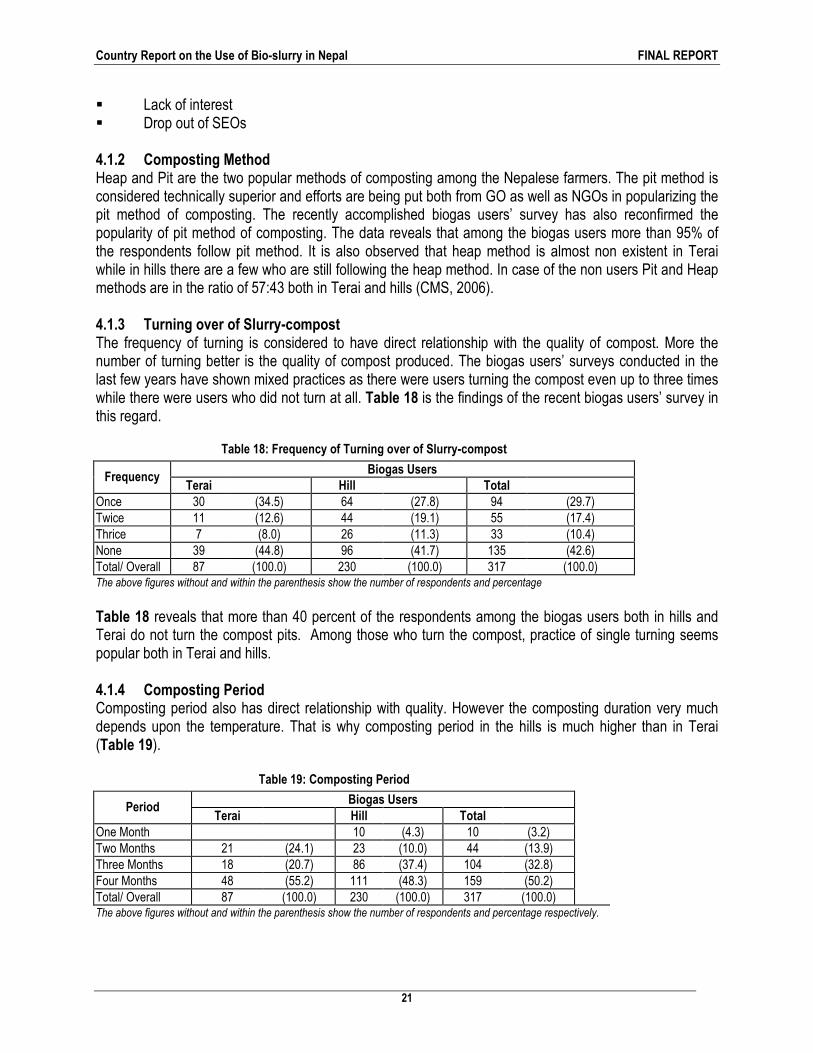
Country Report on the Use of Bio-slurry in Nepal FINAL REPORT
21
� Lack of interest � Drop out of SEOs
4.1.2 Composting Method Heap and Pit are the two popular methods of composting among the Nepalese farmers. The pit method is considered technically superior and efforts are being put both from GO as well as NGOs in popularizing the pit method of composting. The recently accomplished biogas users’ survey has also reconfirmed the popularity of pit method of composting. The data reveals that among the biogas users more than 95% of the respondents follow pit method. It is also observed that heap method is almost non existent in Terai while in hills there are a few who are still following the heap method. In case of the non users Pit and Heap methods are in the ratio of 57:43 both in Terai and hills (CMS, 2006). 4.1.3 Turning over of Slurry-compost The frequency of turning is considered to have direct relationship with the quality of compost. More the number of turning better is the quality of compost produced. The biogas users’ surveys conducted in the last few years have shown mixed practices as there were users turning the compost even up to three times while there were users who did not turn at all. Table 18 is the findings of the recent biogas users’ survey in this regard.
Table 18: Frequency of Turning over of Slurry-compost
Biogas Users Frequency
Terai Hill Total
Once 30 (34.5) 64 (27.8) 94 (29.7) Twice 11 (12.6) 44 (19.1) 55 (17.4) Thrice 7 (8.0) 26 (11.3) 33 (10.4) None 39 (44.8) 96 (41.7) 135 (42.6) Total/ Overall 87 (100.0) 230 (100.0) 317 (100.0) The above figures without and within the parenthesis show the number of respondents and percentage
Table 18 reveals that more than 40 percent of the respondents among the biogas users both in hills and Terai do not turn the compost pits. Among those who turn the compost, practice of single turning seems popular both in Terai and hills. 4.1.4 Composting Period Composting period also has direct relationship with quality. However the composting duration very much depends upon the temperature. That is why composting period in the hills is much higher than in Terai (Table 19).
Table 19: Composting Period
Biogas Users Period
Terai Hill Total
One Month 10 (4.3) 10 (3.2) Two Months 21 (24.1) 23 (10.0) 44 (13.9) Three Months 18 (20.7) 86 (37.4) 104 (32.8) Four Months 48 (55.2) 111 (48.3) 159 (50.2) Total/ Overall 87 (100.0) 230 (100.0) 317 (100.0) The above figures without and within the parenthesis show the number of respondents and percentage respectively.
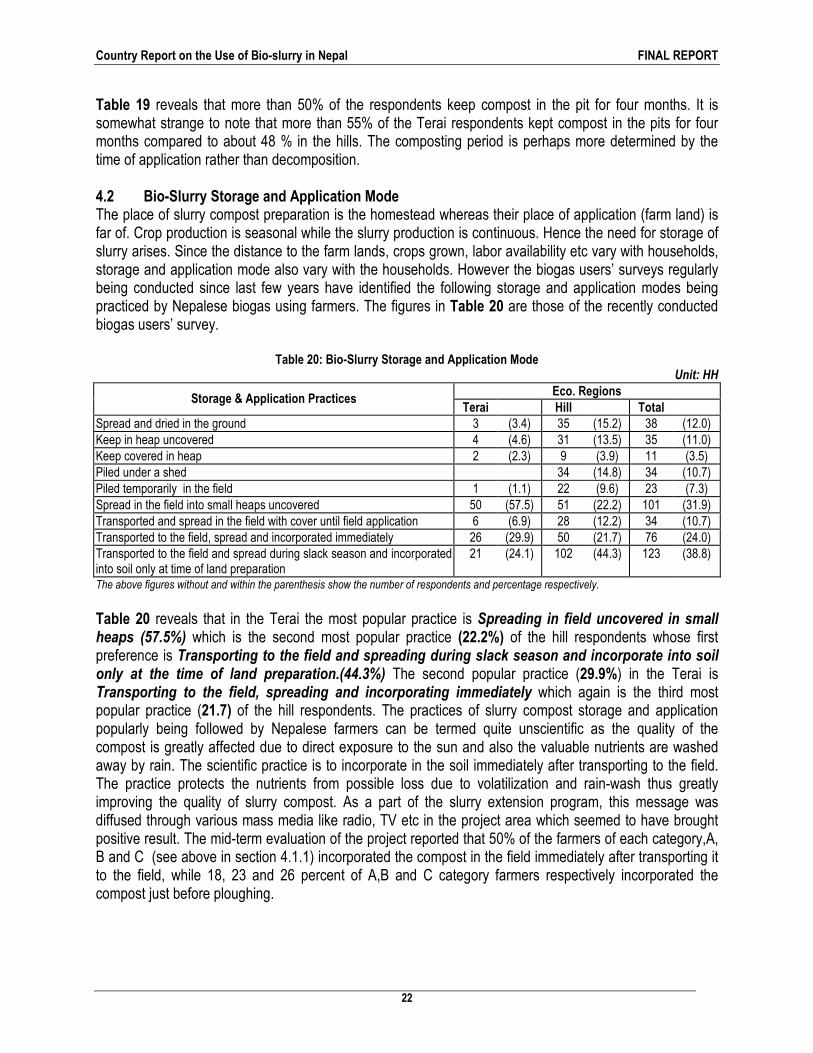
Country Report on the Use of Bio-slurry in Nepal FINAL REPORT
22
Table 19 reveals that more than 50% of the respondents keep compost in the pit for four months. It is somewhat strange to note that more than 55% of the Terai respondents kept compost in the pits for four months compared to about 48 % in the hills. The composting period is perhaps more determined by the time of application rather than decomposition. 4.2 Bio-Slurry Storage and Application Mode The place of slurry compost preparation is the homestead whereas their place of application (farm land) is far of. Crop production is seasonal while the slurry production is continuous. Hence the need for storage of slurry arises. Since the distance to the farm lands, crops grown, labor availability etc vary with households, storage and application mode also vary with the households. However the biogas users’ surveys regularly being conducted since last few years have identified the following storage and application modes being practiced by Nepalese biogas using farmers. The figures in Table 20 are those of the recently conducted biogas users’ survey.
Table 20: Bio-Slurry Storage and Application Mode Unit: HH
Eco. Regions Storage & Application Practices
Terai Hill Total Spread and dried in the ground 3 (3.4) 35 (15.2) 38 (12.0) Keep in heap uncovered 4 (4.6) 31 (13.5) 35 (11.0) Keep covered in heap 2 (2.3) 9 (3.9) 11 (3.5) Piled under a shed 34 (14.8) 34 (10.7) Piled temporarily in the field 1 (1.1) 22 (9.6) 23 (7.3) Spread in the field into small heaps uncovered 50 (57.5) 51 (22.2) 101 (31.9) Transported and spread in the field with cover until field application 6 (6.9) 28 (12.2) 34 (10.7) Transported to the field, spread and incorporated immediately 26 (29.9) 50 (21.7) 76 (24.0) Transported to the field and spread during slack season and incorporated into soil only at time of land preparation
21 (24.1) 102 (44.3) 123 (38.8)
The above figures without and within the parenthesis show the number of respondents and percentage respectively.
Table 20 reveals that in the Terai the most popular practice is Spreading in field uncovered in small heaps (57.5%) which is the second most popular practice (22.2%) of the hill respondents whose first preference is Transporting to the field and spreading during slack season and incorporate into soil only at the time of land preparation.(44.3%) The second popular practice (29.9%) in the Terai is Transporting to the field, spreading and incorporating immediately which again is the third most popular practice (21.7) of the hill respondents. The practices of slurry compost storage and application popularly being followed by Nepalese farmers can be termed quite unscientific as the quality of the compost is greatly affected due to direct exposure to the sun and also the valuable nutrients are washed away by rain. The scientific practice is to incorporate in the soil immediately after transporting to the field. The practice protects the nutrients from possible loss due to volatilization and rain-wash thus greatly improving the quality of slurry compost. As a part of the slurry extension program, this message was diffused through various mass media like radio, TV etc in the project area which seemed to have brought positive result. The mid-term evaluation of the project reported that 50% of the farmers of each category,A, B and C (see above in section 4.1.1) incorporated the compost in the field immediately after transporting it to the field, while 18, 23 and 26 percent of A,B and C category farmers respectively incorporated the compost just before ploughing.
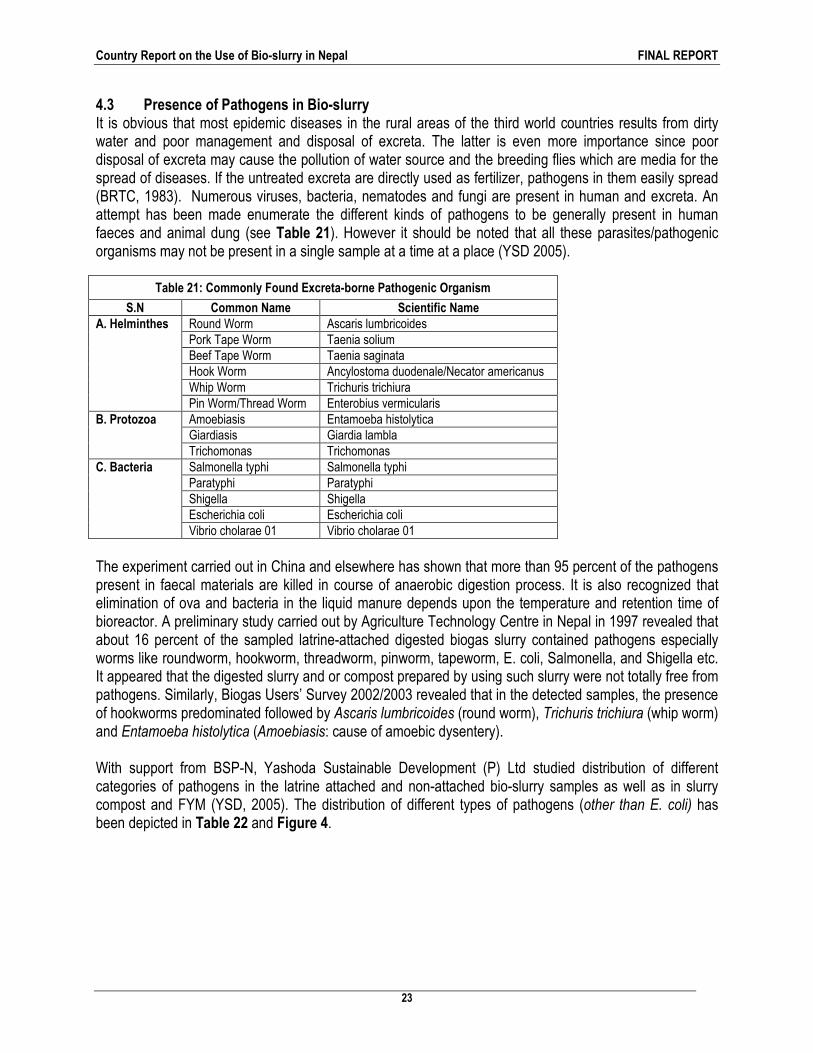
Country Report on the Use of Bio-slurry in Nepal FINAL REPORT
23
4.3 Presence of Pathogens in Bio-slurry It is obvious that most epidemic diseases in the rural areas of the third world countries results from dirty water and poor management and disposal of excreta. The latter is even more importance since poor disposal of excreta may cause the pollution of water source and the breeding flies which are media for the spread of diseases. If the untreated excreta are directly used as fertilizer, pathogens in them easily spread (BRTC, 1983). Numerous viruses, bacteria, nematodes and fungi are present in human and excreta. An attempt has been made enumerate the different kinds of pathogens to be generally present in human faeces and animal dung (see Table 21). However it should be noted that all these parasites/pathogenic organisms may not be present in a single sample at a time at a place (YSD 2005).
Table 21: Commonly Found Excreta-borne Pathogenic Organism
S.N Common Name Scientific Name A. Helminthes Round Worm Ascaris lumbricoides Pork Tape Worm Taenia solium Beef Tape Worm Taenia saginata Hook Worm Ancylostoma duodenale/Necator americanus Whip Worm Trichuris trichiura Pin Worm/Thread Worm Enterobius vermicularis B. Protozoa Amoebiasis Entamoeba histolytica Giardiasis Giardia lambla Trichomonas Trichomonas C. Bacteria Salmonella typhi Salmonella typhi Paratyphi Paratyphi Shigella Shigella Escherichia coli Escherichia coli Vibrio cholarae 01 Vibrio cholarae 01
The experiment carried out in China and elsewhere has shown that more than 95 percent of the pathogens present in faecal materials are killed in course of anaerobic digestion process. It is also recognized that elimination of ova and bacteria in the liquid manure depends upon the temperature and retention time of bioreactor. A preliminary study carried out by Agriculture Technology Centre in Nepal in 1997 revealed that about 16 percent of the sampled latrine-attached digested biogas slurry contained pathogens especially worms like roundworm, hookworm, threadworm, pinworm, tapeworm, E. coli, Salmonella, and Shigella etc. It appeared that the digested slurry and or compost prepared by using such slurry were not totally free from pathogens. Similarly, Biogas Users’ Survey 2002/2003 revealed that in the detected samples, the presence of hookworms predominated followed by Ascaris lumbricoides (round worm), Trichuris trichiura (whip worm) and Entamoeba histolytica (Amoebiasis: cause of amoebic dysentery). With support from BSP-N, Yashoda Sustainable Development (P) Ltd studied distribution of different categories of pathogens in the latrine attached and non-attached bio-slurry samples as well as in slurry compost and FYM (YSD, 2005). The distribution of different types of pathogens (other than E. coli) has been depicted in Table 22 and Figure 4.

Country Report on the Use of Bio-slurry in Nepal FINAL REPORT
24
Table 22: Distribution of Pathogens in Bio-slurry in Accordance with Pathogenic Types
S.N. Kinds of Pathogens Distribution Percentage 1. Ascaris lumbricoides (Helminth) 31 2. Taenia saginata/solium. (Helminth) 23 3. Trichuris trichuria (Helminth) 14 4. Shigella (Bacteria) 14 5. Giardia lamblia(Protozoa) 7 6. Ankylostoma(Hookworm) 7 7. Trichomonas (Protozoa) 2 8. Diphyllobothrium (Cestode) 1 Total 100
Figure 4: Distribution of Pathogens in Bio-slurry
Table 22 and Figure 4 show that amongst the detected pathogens, Ascaris is predominant followed by Taenia (23%) and Trichuris (14%). Distribution of each of the parasites- Giardia and Hookworm was found up to the extent of 7 percent, while small number of samples contained Trichomonas (2%) and Diphyllobothrium (1%). On the other hand, Shigella was found fairly distributed in the sample (14%). The effects of the excreta-borne pathogens usually occurring in slurry samples are discussed in the context of human physiology and human health (YSD, 2005). To mitigate possible problems, a simple and illustrative book (in Nepali) on health and sanitation of bio-slurry has been prepared by the Consultant (YSD) with support from BSP- N. It is planned that this book will be used to educate the biogas using farmers regarding proper handling of bio-slurry to avoid possible risk from pathogens. 4.4 Farmers’ Perception on Mosquito Breeding due to Bio-slurry In terms of breeding habit, mosquitoes are the indicators of polluted surrounding, as mosquito breeding needs water, often ditches and puddles. About 48% of biogas users in the hill region perceive that there is increase in mosquitoes after biogas use. On the other hand, equal number of respondents considers that
0
5
10
15
20
25
30
35
Ascaris
Taenia
Trichuris
Shigella
Giardia
Hookworm
Trichomonas
Diphyllobothrium
Pathogen Types
Perce
ntage
Country Report on the Use of Bio-slurry in Nepal FINAL REPORT
25
there has been no change in mosquito occurrence before and after biogas use. On an average, 42% households reported of increase in mosquito after biogas use which is less than that given in IEIA BSP-N, 2002 Report (70%). Markedly, 56% of the respondents in both the ecological regions reported that there has been no difference in this matter after biogas use. People reporting decrease in mosquito after biogas use is comparatively less (4%). Moreover, 51% of the non-users as compared to 43% of users reported that mosquito appear mostly in rooms of the house which indicates that mosquito is more common in non-user HHs as compared to the user HHs (Biogas Users’ Survey, 2006). These mixed responses of farmers regarding mosquito proliferation due to bio-slurry, necessitates the need for further separate study on mosquito occurrence.
Country Report on the Use of Bio-slurry in Nepal FINAL REPORT
26
5.1 Impact of Bio-slurry on Crops and Vegetables It has been proved through laboratory tests and practical implication that organic digested material acts as better soil conditioner than the undigested one. The evidence beside this fact is that the biochemical processes in anaerobic condition inside biogas plant makes the nitrogen more readily accessible to the plants. Besides, no loss of nitrogen takes place in the digester which would otherwise take place during composting or simple storage. Field trials performed in Nepal by Soil Science and Agricultural Chemistry Division, NARC, DOA, reported that bio-slurry use increased the yield of various crops by big difference, viz; French bean production was increased by 70%. According to the data given in Biogas in Nepal, 2005, the Nitrogen content in digested slurry is 1.6% as compared to 0.8% and 1% in FYM and composted manure respectively. Similarly, the phosphorous content is more than double of that in FYM and compost and the potassium content is 1% as compared to 0.7% in FYM. Biogas Users’ Survey 2003/2004 has also reported an increase in paddy, maize and potato production by 58%, 70% and 44% respectively due to bio-slurry application. Similarly, Mid-term evaluation of BSP Slurry Extension Program-II, 2000 has reported that 78% of the participating farmers have perceived an increased yield of crops due to application of slurry compost compared to 65% respondents belonging to non-participating group. Hence it helps farm production as usual but brings extra benefits to the farmers by serving dual purpose of energy source and fertilizer. Spent slurry coming out of biogas plant also enriches nutrient condition in fishponds contributing to better production. 5.1.1 Response to Bio-slurry Application on Maize and Cabbage in Lalitpur District Alternative Energy Promotion Centre (AEPC) of the Ministry of Science and Technology (MOST) had initiated a research programme in 2001 to examine the effect of bio-slurry (effluent produced from biogas plant) on cereal and vegetable crops namely maize and cabbage. With the help of the researchers of Outreach Division of Nepal Agricultural Research Council (NARC), the Consultant's Team identified appropriate location at Ward no. 8, Chapagaon VDC of Lalitpur District. Two innovative farmers, who have been participating since long time in the Outreach Programme covered by NARC, were selected to participate in the bio-slurry experiment on maize and cabbage (Karki, 2001). The specific objectives of carrying out these experimentations were as follows: � To generate reliable data /information on the effect of biogas slurry on crops and soils; � To compare the effect of different forms of the biogas slurry singly or in conjunction with the
chemical fertilizer on maize and cabbage; and � To asses the quality (chemical and biological) of organic fertilizer produced by biogas users. Both the bio-slurry experiment on maize and cabbage consisted of Randomized Complete Block Design (CBD). The plot size for maize trial was 5 m x 4 m and that of cabbage was 4 m x 3 m. Soybean was grown as a catch crop with the row to row and plant to plant distances same as that of the maize crop. Row to row and plant to plant distance of maize were 60 cm and 20 cm respectively for maize, while the row to row and plant to plant distance was 35 cm each for cabbage.
Chapter Chapter Chapter Chapter RESULTS OF RESEARCH AND EXPERIMENTATION
ON THE USE OF BIO-SLURRY
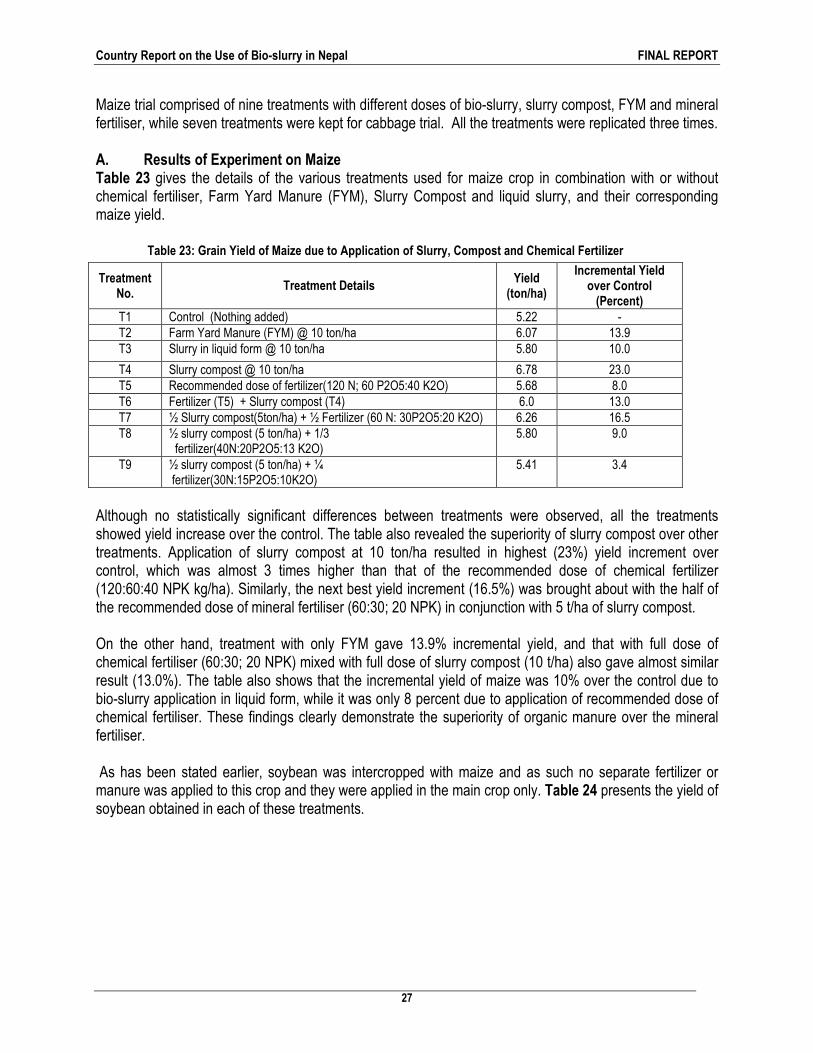
Country Report on the Use of Bio-slurry in Nepal FINAL REPORT
27
Maize trial comprised of nine treatments with different doses of bio-slurry, slurry compost, FYM and mineral fertiliser, while seven treatments were kept for cabbage trial. All the treatments were replicated three times. A. Results of Experiment on Maize Table 23 gives the details of the various treatments used for maize crop in combination with or without chemical fertiliser, Farm Yard Manure (FYM), Slurry Compost and liquid slurry, and their corresponding maize yield.
Table 23: Grain Yield of Maize due to Application of Slurry, Compost and Chemical Fertilizer
Treatment No.
Treatment Details Yield
(ton/ha)
Incremental Yield over Control (Percent)
T1 Control (Nothing added) 5.22 - T2 Farm Yard Manure (FYM) @ 10 ton/ha 6.07 13.9 T3 Slurry in liquid form @ 10 ton/ha 5.80 10.0
T4 Slurry compost @ 10 ton/ha 6.78 23.0 T5 Recommended dose of fertilizer(120 N; 60 P2O5:40 K2O) 5.68 8.0 T6 Fertilizer (T5) + Slurry compost (T4) 6.0 13.0 T7 ½ Slurry compost(5ton/ha) + ½ Fertilizer (60 N: 30P2O5:20 K2O) 6.26 16.5 T8 ½ slurry compost (5 ton/ha) + 1/3
fertilizer(40N:20P2O5:13 K2O) 5.80 9.0
T9 ½ slurry compost (5 ton/ha) + ¼ fertilizer(30N:15P2O5:10K2O)
5.41 3.4
Although no statistically significant differences between treatments were observed, all the treatments showed yield increase over the control. The table also revealed the superiority of slurry compost over other treatments. Application of slurry compost at 10 ton/ha resulted in highest (23%) yield increment over control, which was almost 3 times higher than that of the recommended dose of chemical fertilizer (120:60:40 NPK kg/ha). Similarly, the next best yield increment (16.5%) was brought about with the half of the recommended dose of mineral fertiliser (60:30; 20 NPK) in conjunction with 5 t/ha of slurry compost. On the other hand, treatment with only FYM gave 13.9% incremental yield, and that with full dose of chemical fertiliser (60:30; 20 NPK) mixed with full dose of slurry compost (10 t/ha) also gave almost similar result (13.0%). The table also shows that the incremental yield of maize was 10% over the control due to bio-slurry application in liquid form, while it was only 8 percent due to application of recommended dose of chemical fertiliser. These findings clearly demonstrate the superiority of organic manure over the mineral fertiliser. As has been stated earlier, soybean was intercropped with maize and as such no separate fertilizer or manure was applied to this crop and they were applied in the main crop only. Table 24 presents the yield of soybean obtained in each of these treatments.
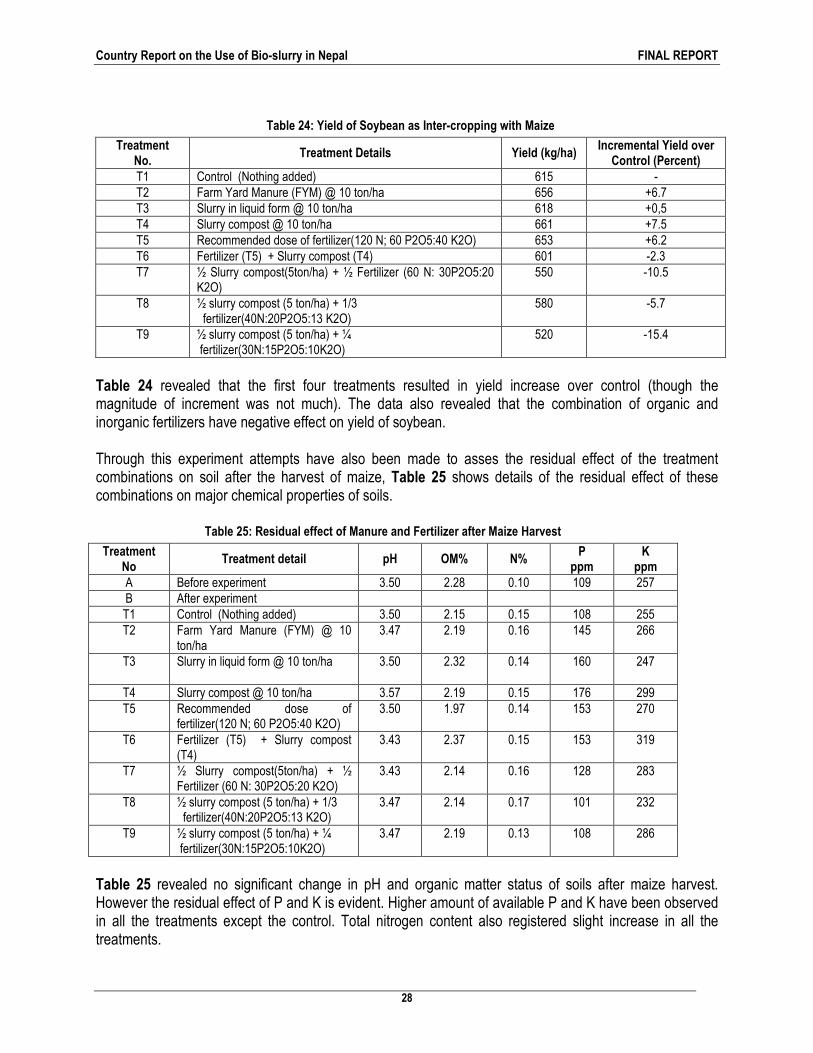
Country Report on the Use of Bio-slurry in Nepal FINAL REPORT
28
Table 24: Yield of Soybean as Inter-cropping with Maize
Treatment No.
Treatment Details Yield (kg/ha) Incremental Yield over
Control (Percent) T1 Control (Nothing added) 615 - T2 Farm Yard Manure (FYM) @ 10 ton/ha 656 +6.7 T3 Slurry in liquid form @ 10 ton/ha 618 +0,5 T4 Slurry compost @ 10 ton/ha 661 +7.5 T5 Recommended dose of fertilizer(120 N; 60 P2O5:40 K2O) 653 +6.2 T6 Fertilizer (T5) + Slurry compost (T4) 601 -2.3 T7 ½ Slurry compost(5ton/ha) + ½ Fertilizer (60 N: 30P2O5:20
K2O) 550 -10.5
T8 ½ slurry compost (5 ton/ha) + 1/3 fertilizer(40N:20P2O5:13 K2O)
580 -5.7
T9 ½ slurry compost (5 ton/ha) + ¼ fertilizer(30N:15P2O5:10K2O)
520 -15.4
Table 24 revealed that the first four treatments resulted in yield increase over control (though the magnitude of increment was not much). The data also revealed that the combination of organic and inorganic fertilizers have negative effect on yield of soybean. Through this experiment attempts have also been made to asses the residual effect of the treatment combinations on soil after the harvest of maize, Table 25 shows details of the residual effect of these combinations on major chemical properties of soils.
Table 25: Residual effect of Manure and Fertilizer after Maize Harvest
Treatment No
Treatment detail pH OM% N% P
ppm K
ppm A Before experiment 3.50 2.28 0.10 109 257 B After experiment T1 Control (Nothing added) 3.50 2.15 0.15 108 255 T2 Farm Yard Manure (FYM) @ 10
ton/ha 3.47 2.19 0.16 145 266
T3
Slurry in liquid form @ 10 ton/ha 3.50 2.32 0.14 160 247
T4 Slurry compost @ 10 ton/ha 3.57 2.19 0.15 176 299 T5 Recommended dose of
fertilizer(120 N; 60 P2O5:40 K2O) 3.50 1.97 0.14 153 270
T6 Fertilizer (T5) + Slurry compost (T4)
3.43 2.37 0.15 153 319
T7 ½ Slurry compost(5ton/ha) + ½ Fertilizer (60 N: 30P2O5:20 K2O)
3.43 2.14 0.16 128 283
T8 ½ slurry compost (5 ton/ha) + 1/3 fertilizer(40N:20P2O5:13 K2O)
3.47 2.14 0.17 101 232
T9 ½ slurry compost (5 ton/ha) + ¼ fertilizer(30N:15P2O5:10K2O)
3.47 2.19 0.13 108 286
Table 25 revealed no significant change in pH and organic matter status of soils after maize harvest. However the residual effect of P and K is evident. Higher amount of available P and K have been observed in all the treatments except the control. Total nitrogen content also registered slight increase in all the treatments.
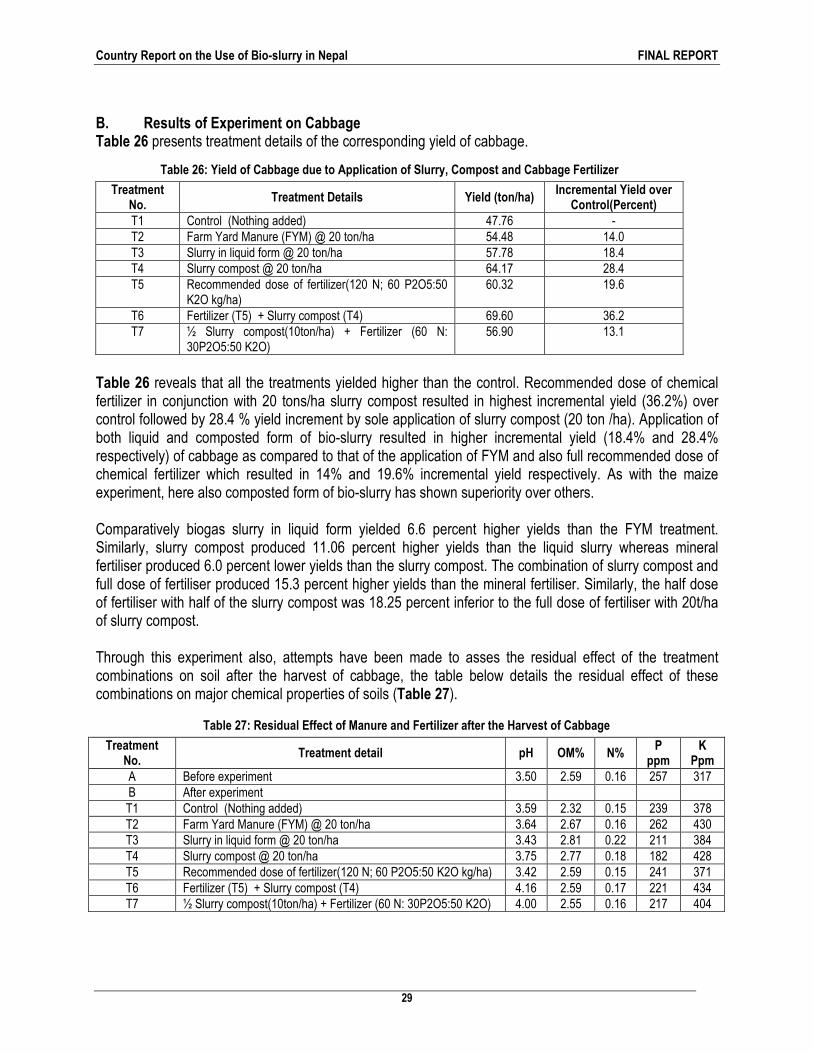
Country Report on the Use of Bio-slurry in Nepal FINAL REPORT
29
B. Results of Experiment on Cabbage Table 26 presents treatment details of the corresponding yield of cabbage.
Table 26: Yield of Cabbage due to Application of Slurry, Compost and Cabbage Fertilizer
Treatment No.
Treatment Details Yield (ton/ha) Incremental Yield over
Control(Percent) T1 Control (Nothing added) 47.76 - T2 Farm Yard Manure (FYM) @ 20 ton/ha 54.48 14.0 T3 Slurry in liquid form @ 20 ton/ha 57.78 18.4 T4 Slurry compost @ 20 ton/ha 64.17 28.4 T5 Recommended dose of fertilizer(120 N; 60 P2O5:50
K2O kg/ha) 60.32 19.6
T6 Fertilizer (T5) + Slurry compost (T4) 69.60 36.2 T7 ½ Slurry compost(10ton/ha) + Fertilizer (60 N:
30P2O5:50 K2O) 56.90 13.1
Table 26 reveals that all the treatments yielded higher than the control. Recommended dose of chemical fertilizer in conjunction with 20 tons/ha slurry compost resulted in highest incremental yield (36.2%) over control followed by 28.4 % yield increment by sole application of slurry compost (20 ton /ha). Application of both liquid and composted form of bio-slurry resulted in higher incremental yield (18.4% and 28.4% respectively) of cabbage as compared to that of the application of FYM and also full recommended dose of chemical fertilizer which resulted in 14% and 19.6% incremental yield respectively. As with the maize experiment, here also composted form of bio-slurry has shown superiority over others. Comparatively biogas slurry in liquid form yielded 6.6 percent higher yields than the FYM treatment. Similarly, slurry compost produced 11.06 percent higher yields than the liquid slurry whereas mineral fertiliser produced 6.0 percent lower yields than the slurry compost. The combination of slurry compost and full dose of fertiliser produced 15.3 percent higher yields than the mineral fertiliser. Similarly, the half dose of fertiliser with half of the slurry compost was 18.25 percent inferior to the full dose of fertiliser with 20t/ha of slurry compost. Through this experiment also, attempts have been made to asses the residual effect of the treatment combinations on soil after the harvest of cabbage, the table below details the residual effect of these combinations on major chemical properties of soils (Table 27).
Table 27: Residual Effect of Manure and Fertilizer after the Harvest of Cabbage
Treatment No.
Treatment detail pH OM% N% P
ppm K
Ppm A Before experiment 3.50 2.59 0.16 257 317 B After experiment T1 Control (Nothing added) 3.59 2.32 0.15 239 378 T2 Farm Yard Manure (FYM) @ 20 ton/ha 3.64 2.67 0.16 262 430 T3 Slurry in liquid form @ 20 ton/ha 3.43 2.81 0.22 211 384 T4 Slurry compost @ 20 ton/ha 3.75 2.77 0.18 182 428 T5 Recommended dose of fertilizer(120 N; 60 P2O5:50 K2O kg/ha) 3.42 2.59 0.15 241 371 T6 Fertilizer (T5) + Slurry compost (T4) 4.16 2.59 0.17 221 434 T7 ½ Slurry compost(10ton/ha) + Fertilizer (60 N: 30P2O5:50 K2O) 4.00 2.55 0.16 217 404
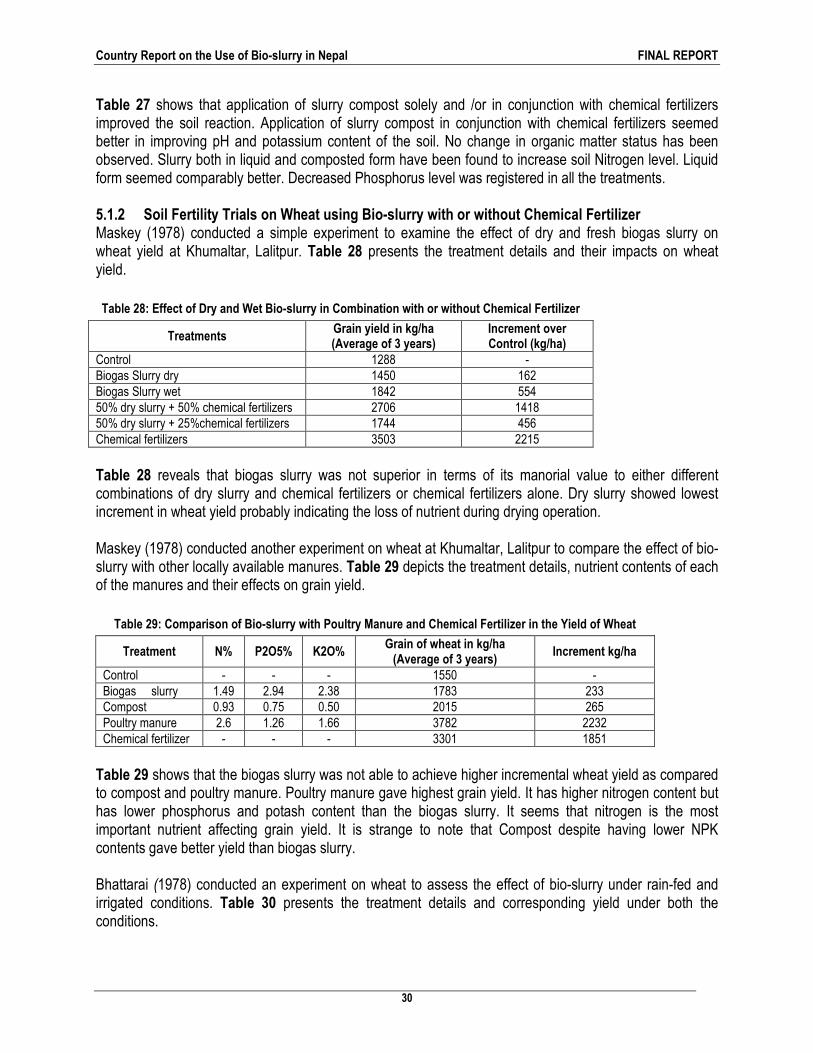
Country Report on the Use of Bio-slurry in Nepal FINAL REPORT
30
Table 27 shows that application of slurry compost solely and /or in conjunction with chemical fertilizers improved the soil reaction. Application of slurry compost in conjunction with chemical fertilizers seemed better in improving pH and potassium content of the soil. No change in organic matter status has been observed. Slurry both in liquid and composted form have been found to increase soil Nitrogen level. Liquid form seemed comparably better. Decreased Phosphorus level was registered in all the treatments. 5.1.2 Soil Fertility Trials on Wheat using Bio-slurry with or without Chemical Fertilizer Maskey (1978) conducted a simple experiment to examine the effect of dry and fresh biogas slurry on wheat yield at Khumaltar, Lalitpur. Table 28 presents the treatment details and their impacts on wheat yield.
Table 28: Effect of Dry and Wet Bio-slurry in Combination with or without Chemical Fertilizer
Treatments Grain yield in kg/ha (Average of 3 years)
Increment over Control (kg/ha)
Control 1288 - Biogas Slurry dry 1450 162 Biogas Slurry wet 1842 554 50% dry slurry + 50% chemical fertilizers 2706 1418 50% dry slurry + 25%chemical fertilizers 1744 456 Chemical fertilizers 3503 2215
Table 28 reveals that biogas slurry was not superior in terms of its manorial value to either different combinations of dry slurry and chemical fertilizers or chemical fertilizers alone. Dry slurry showed lowest increment in wheat yield probably indicating the loss of nutrient during drying operation. Maskey (1978) conducted another experiment on wheat at Khumaltar, Lalitpur to compare the effect of bio-slurry with other locally available manures. Table 29 depicts the treatment details, nutrient contents of each of the manures and their effects on grain yield.
Table 29: Comparison of Bio-slurry with Poultry Manure and Chemical Fertilizer in the Yield of Wheat
Treatment N% P2O5% K2O% Grain of wheat in kg/ha (Average of 3 years)
Increment kg/ha
Control - - - 1550 - Biogas slurry 1.49 2.94 2.38 1783 233 Compost 0.93 0.75 0.50 2015 265 Poultry manure 2.6 1.26 1.66 3782 2232 Chemical fertilizer - - - 3301 1851
Table 29 shows that the biogas slurry was not able to achieve higher incremental wheat yield as compared to compost and poultry manure. Poultry manure gave highest grain yield. It has higher nitrogen content but has lower phosphorus and potash content than the biogas slurry. It seems that nitrogen is the most important nutrient affecting grain yield. It is strange to note that Compost despite having lower NPK contents gave better yield than biogas slurry. Bhattarai (1978) conducted an experiment on wheat to assess the effect of bio-slurry under rain-fed and irrigated conditions. Table 30 presents the treatment details and corresponding yield under both the conditions.

Country Report on the Use of Bio-slurry in Nepal FINAL REPORT
31
Table 30: Effect of Wet and Dry Bio-slurry with or without Chemical Fertilizer under Irrigated and Rain-fed Conditions
Treatment Irrigated Yield kg/ha Rain-fed Yield kg/ha Control 1450 1450 Dry Slurry 1750 1600 Wet Slurry 1560 1750 50% chem.fertilizer+ 50% dry slurry 3800 2750 Chemical fertilizer (Usual dose) 5700 4200
Table 30 reveals that application of dry slurry gave better wheat yield than wet slurry under irrigated condition, while under rain fed condition wet slurry gave better wheat yield than dry slurry. Since under rain-fed condition moisture is generally the limiting factor and application of wet slurry probably provided much needed moisture as well resulting in better grain yield. The table also reveals that the combination of dry slurry and chemical fertilizer gave better yield than the application of dry and wet slurry, while the usual dose of chemical fertilizer gave the highest yield in both the conditions. The experiment could have been more meaningful had the effect of biogas slurry was compared with other forms of organic manures like FYM, Compost etc. It is almost certain that chemical fertilizer will give higher yields than biogas slurry, whether wet or dry. Bhattarai and Maskey (1988) conducted an experiment at Khumaltar Lalitpur on wheat to assess the effect of the inoculation of azotobactor in different sources organic matter including biogas slurry. Table 31 below presents the treatment details and corresponding wheat yield.
Table 31: Effect of Inoculation of Azotobactor in Different Sources of Organic Matter including Bio- slurry on the Yield of Wheat
Treatment NPK kg/ha
Grain yield with Azotobactor Kg/ha (Average of 3 years)
Grain yield without Azotobactor Kg/ha (Average of 3 years)
Increment Kg/ha
% Increment
Control 0-40-39 1603 1553 54.0 3.77 Biogas slurry 100-40-30 2116 1876 240 12.8 Poultry manure 100-40-30 2295 1779 516 29.0 Compost 100-40-30 4098 3957 141 3.6 Chemical fertilizer 100-40-30 - 3280 - -
Table 31 reveals that application of biogas slurry inoculated with azotobactor and 100-40-30 NPK kg/ha gave wheat yield lower than that by poultry manure and far lower than by compost both with and without azotobactor inoculation. It is strange to note that all the treatments except the control contained chemical fertilizers at the rate of 100-40-30 NPK kg/ha, but except with the compost treatment, the wheat yield were much lower in all the cases as compared to the treatment with sole chemical fertilizer. 5.1.3 Effects of Bio-slurry on other Crops and Vegetables Maskey (1978) conducted simple experiment (with and without biogas slurry) to assess the impact of biogas slurry on some crops and vegetables. Table 32 presents the yields of these crops and also the incremental yield.
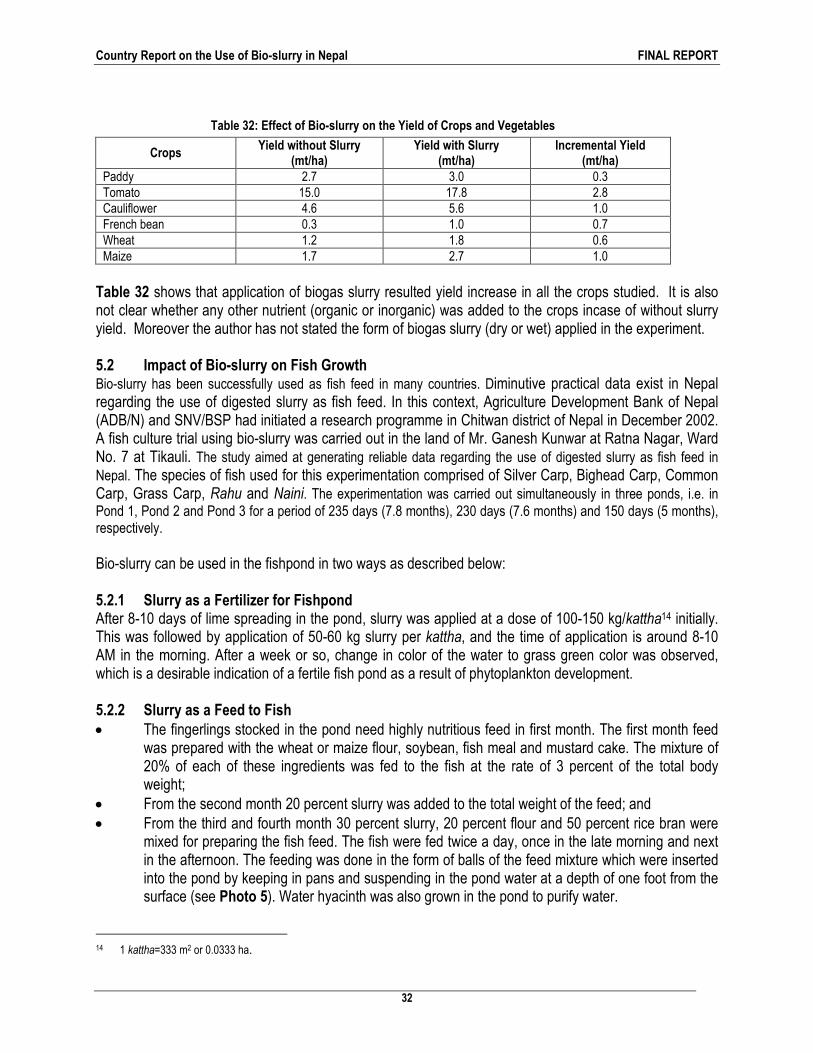
Country Report on the Use of Bio-slurry in Nepal FINAL REPORT
32
Table 32: Effect of Bio-slurry on the Yield of Crops and Vegetables
Crops Yield without Slurry
(mt/ha) Yield with Slurry
(mt/ha) Incremental Yield
(mt/ha) Paddy 2.7 3.0 0.3 Tomato 15.0 17.8 2.8 Cauliflower 4.6 5.6 1.0 French bean 0.3 1.0 0.7 Wheat 1.2 1.8 0.6 Maize 1.7 2.7 1.0
Table 32 shows that application of biogas slurry resulted yield increase in all the crops studied. It is also not clear whether any other nutrient (organic or inorganic) was added to the crops incase of without slurry yield. Moreover the author has not stated the form of biogas slurry (dry or wet) applied in the experiment. 5.2 Impact of Bio-slurry on Fish Growth Bio-slurry has been successfully used as fish feed in many countries. Diminutive practical data exist in Nepal regarding the use of digested slurry as fish feed. In this context, Agriculture Development Bank of Nepal (ADB/N) and SNV/BSP had initiated a research programme in Chitwan district of Nepal in December 2002. A fish culture trial using bio-slurry was carried out in the land of Mr. Ganesh Kunwar at Ratna Nagar, Ward No. 7 at Tikauli. The study aimed at generating reliable data regarding the use of digested slurry as fish feed in Nepal. The species of fish used for this experimentation comprised of Silver Carp, Bighead Carp, Common Carp, Grass Carp, Rahu and Naini. The experimentation was carried out simultaneously in three ponds, i.e. in Pond 1, Pond 2 and Pond 3 for a period of 235 days (7.8 months), 230 days (7.6 months) and 150 days (5 months), respectively. Bio-slurry can be used in the fishpond in two ways as described below: 5.2.1 Slurry as a Fertilizer for Fishpond After 8-10 days of lime spreading in the pond, slurry was applied at a dose of 100-150 kg/kattha14 initially. This was followed by application of 50-60 kg slurry per kattha, and the time of application is around 8-10 AM in the morning. After a week or so, change in color of the water to grass green color was observed, which is a desirable indication of a fertile fish pond as a result of phytoplankton development. 5.2.2 Slurry as a Feed to Fish • The fingerlings stocked in the pond need highly nutritious feed in first month. The first month feed
was prepared with the wheat or maize flour, soybean, fish meal and mustard cake. The mixture of 20% of each of these ingredients was fed to the fish at the rate of 3 percent of the total body weight;
• From the second month 20 percent slurry was added to the total weight of the feed; and • From the third and fourth month 30 percent slurry, 20 percent flour and 50 percent rice bran were
mixed for preparing the fish feed. The fish were fed twice a day, once in the late morning and next in the afternoon. The feeding was done in the form of balls of the feed mixture which were inserted into the pond by keeping in pans and suspending in the pond water at a depth of one foot from the surface (see Photo 5). Water hyacinth was also grown in the pond to purify water.
14 1 kattha=333 m2 or 0.0333 ha.
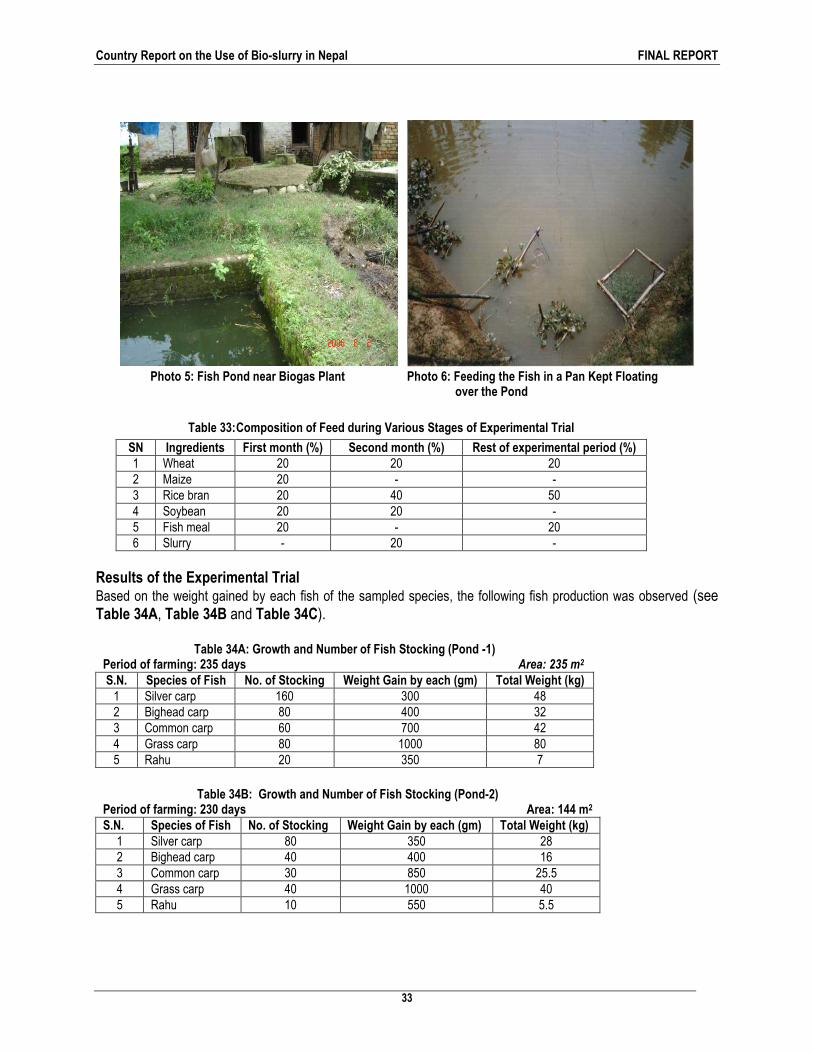
Country Report on the Use of Bio-slurry in Nepal FINAL REPORT
33
Photo 5: Fish Pond near Biogas Plant Photo 6: Feeding the Fish in a Pan Kept Floating over the Pond
Table 33: Composition of Feed during Various Stages of Experimental Trial
SN Ingredients First month (%) Second month (%) Rest of experimental period (%) 1 Wheat 20 20 20 2 Maize 20 - - 3 Rice bran 20 40 50 4 Soybean 20 20 - 5 Fish meal 20 - 20 6 Slurry - 20 -
Results of the Experimental Trial Based on the weight gained by each fish of the sampled species, the following fish production was observed (see Table 34A, Table 34B and Table 34C).
Table 34A: Growth and Number of Fish Stocking (Pond -1) Period of farming: 235 days Area: 235 m2 S.N. Species of Fish No. of Stocking Weight Gain by each (gm) Total Weight (kg) 1 Silver carp 160 300 48 2 Bighead carp 80 400 32 3 Common carp 60 700 42 4 Grass carp 80 1000 80 5 Rahu 20 350 7
Table 34B: Growth and Number of Fish Stocking (Pond-2)
Period of farming: 230 days Area: 144 m2 S.N. Species of Fish No. of Stocking Weight Gain by each (gm) Total Weight (kg) 1 Silver carp 80 350 28 2 Bighead carp 40 400 16 3 Common carp 30 850 25.5 4 Grass carp 40 1000 40 5 Rahu 10 550 5.5
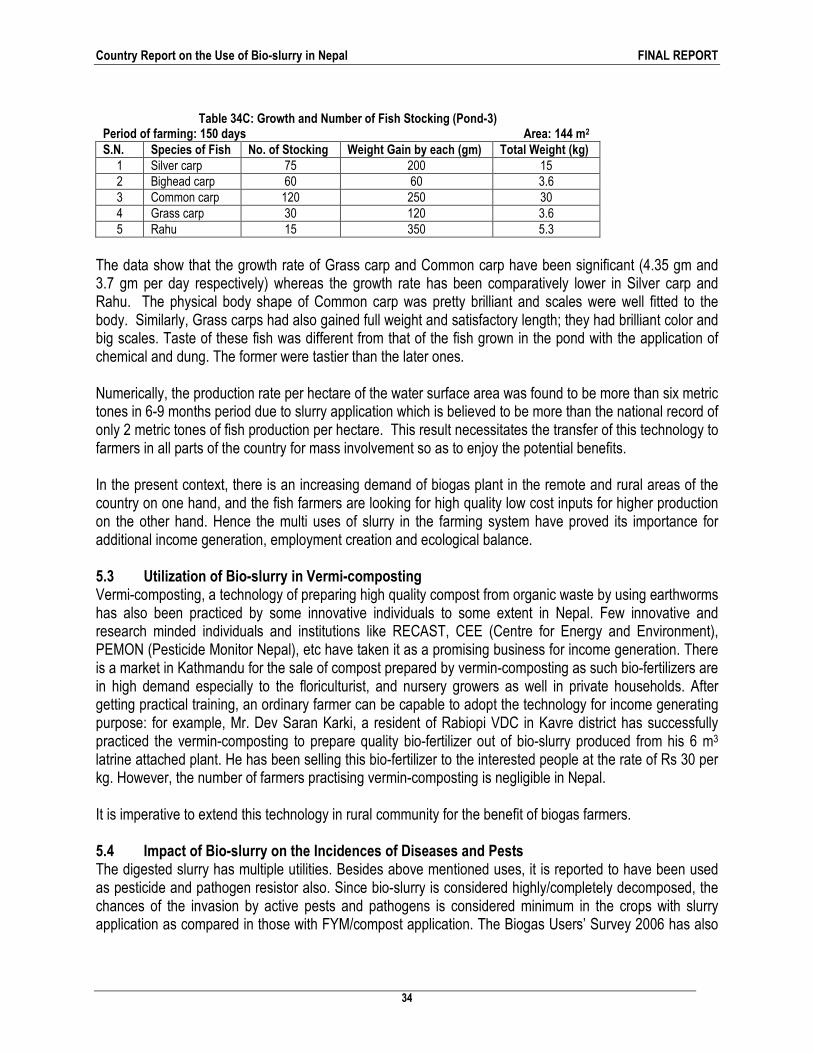
Country Report on the Use of Bio-slurry in Nepal FINAL REPORT
34
Table 34C: Growth and Number of Fish Stocking (Pond-3)
Period of farming: 150 days Area: 144 m2 S.N. Species of Fish No. of Stocking Weight Gain by each (gm) Total Weight (kg) 1 Silver carp 75 200 15 2 Bighead carp 60 60 3.6 3 Common carp 120 250 30 4 Grass carp 30 120 3.6 5 Rahu 15 350 5.3
The data show that the growth rate of Grass carp and Common carp have been significant (4.35 gm and 3.7 gm per day respectively) whereas the growth rate has been comparatively lower in Silver carp and Rahu. The physical body shape of Common carp was pretty brilliant and scales were well fitted to the body. Similarly, Grass carps had also gained full weight and satisfactory length; they had brilliant color and big scales. Taste of these fish was different from that of the fish grown in the pond with the application of chemical and dung. The former were tastier than the later ones. Numerically, the production rate per hectare of the water surface area was found to be more than six metric tones in 6-9 months period due to slurry application which is believed to be more than the national record of only 2 metric tones of fish production per hectare. This result necessitates the transfer of this technology to farmers in all parts of the country for mass involvement so as to enjoy the potential benefits. In the present context, there is an increasing demand of biogas plant in the remote and rural areas of the country on one hand, and the fish farmers are looking for high quality low cost inputs for higher production on the other hand. Hence the multi uses of slurry in the farming system have proved its importance for additional income generation, employment creation and ecological balance. 5.3 Utilization of Bio-slurry in Vermi-composting Vermi-composting, a technology of preparing high quality compost from organic waste by using earthworms has also been practiced by some innovative individuals to some extent in Nepal. Few innovative and research minded individuals and institutions like RECAST, CEE (Centre for Energy and Environment), PEMON (Pesticide Monitor Nepal), etc have taken it as a promising business for income generation. There is a market in Kathmandu for the sale of compost prepared by vermin-composting as such bio-fertilizers are in high demand especially to the floriculturist, and nursery growers as well in private households. After getting practical training, an ordinary farmer can be capable to adopt the technology for income generating purpose: for example, Mr. Dev Saran Karki, a resident of Rabiopi VDC in Kavre district has successfully practiced the vermin-composting to prepare quality bio-fertilizer out of bio-slurry produced from his 6 m3 latrine attached plant. He has been selling this bio-fertilizer to the interested people at the rate of Rs 30 per kg. However, the number of farmers practising vermin-composting is negligible in Nepal. It is imperative to extend this technology in rural community for the benefit of biogas farmers. 5.4 Impact of Bio-slurry on the Incidences of Diseases and Pests The digested slurry has multiple utilities. Besides above mentioned uses, it is reported to have been used as pesticide and pathogen resistor also. Since bio-slurry is considered highly/completely decomposed, the chances of the invasion by active pests and pathogens is considered minimum in the crops with slurry application as compared in those with FYM/compost application. The Biogas Users’ Survey 2006 has also
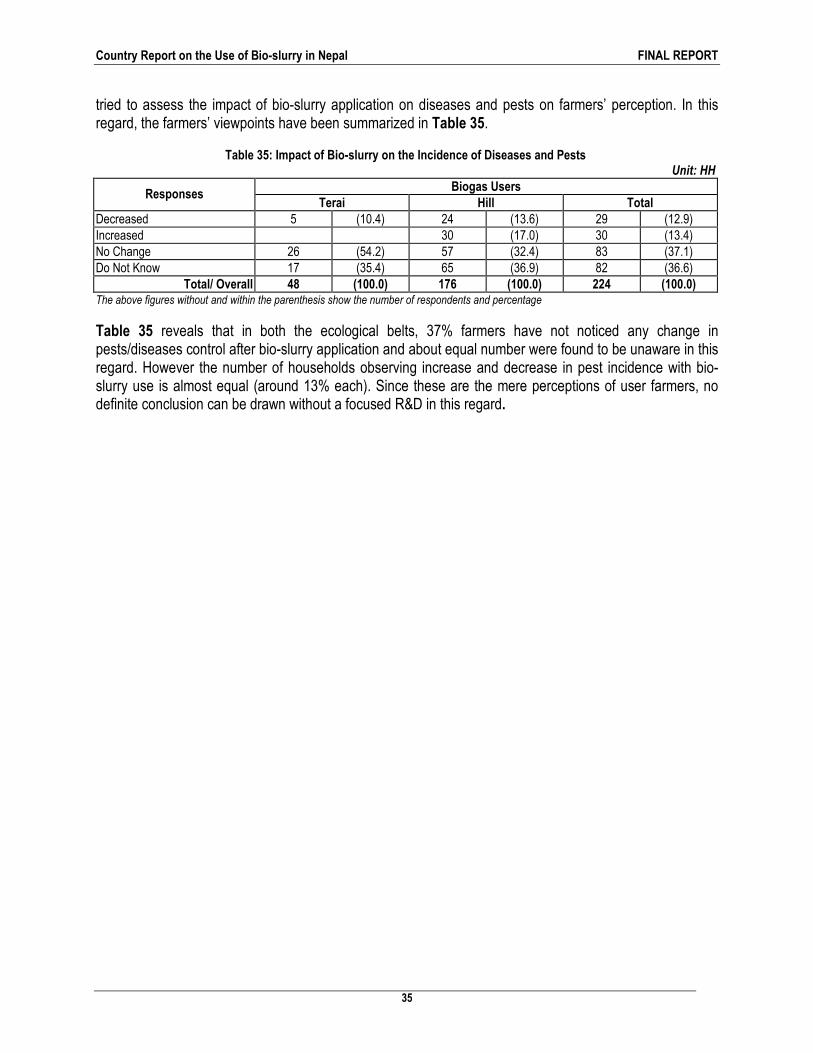
Country Report on the Use of Bio-slurry in Nepal FINAL REPORT
35
tried to assess the impact of bio-slurry application on diseases and pests on farmers’ perception. In this regard, the farmers’ viewpoints have been summarized in Table 35.
Table 35: Impact of Bio-slurry on the Incidence of Diseases and Pests Unit: HH
Biogas Users Responses
Terai Hill Total
Decreased 5 (10.4) 24 (13.6) 29 (12.9) Increased 30 (17.0) 30 (13.4) No Change 26 (54.2) 57 (32.4) 83 (37.1) Do Not Know 17 (35.4) 65 (36.9) 82 (36.6)
Total/ Overall 48 (100.0) 176 (100.0) 224 (100.0) The above figures without and within the parenthesis show the number of respondents and percentage
Table 35 reveals that in both the ecological belts, 37% farmers have not noticed any change in pests/diseases control after bio-slurry application and about equal number were found to be unaware in this regard. However the number of households observing increase and decrease in pest incidence with bio-slurry use is almost equal (around 13% each). Since these are the mere perceptions of user farmers, no definite conclusion can be drawn without a focused R&D in this regard.
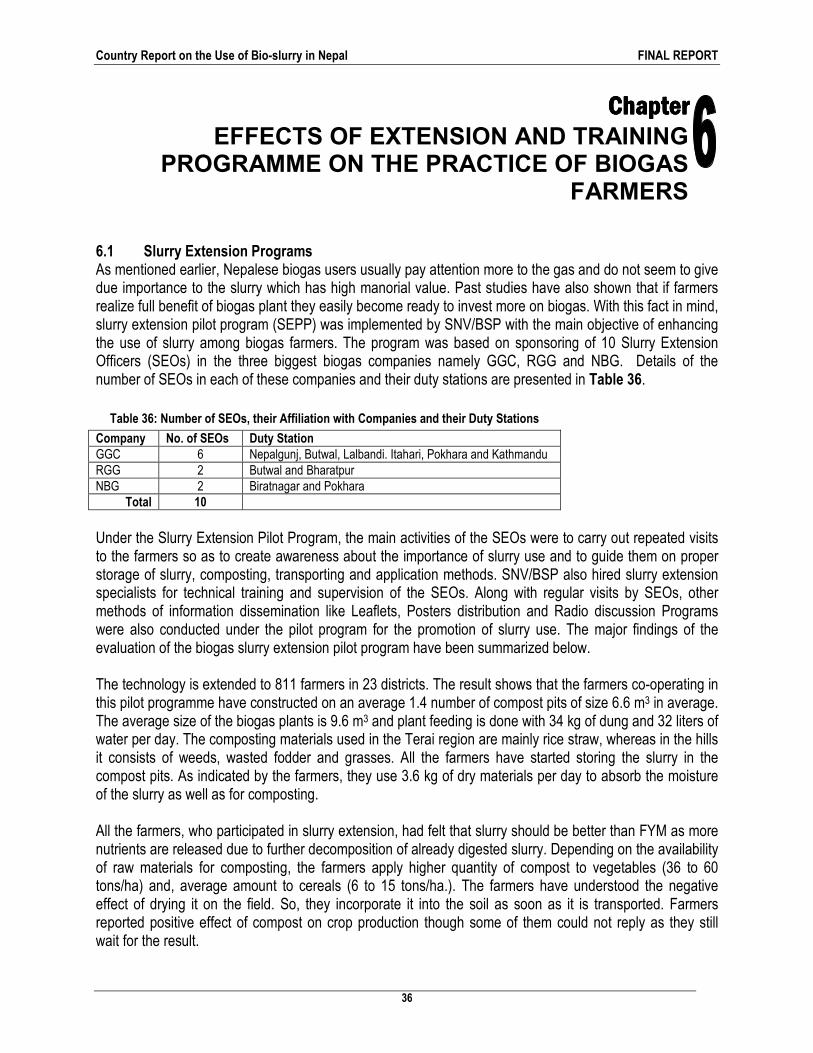
Country Report on the Use of Bio-slurry in Nepal FINAL REPORT
36
6.1 Slurry Extension Programs As mentioned earlier, Nepalese biogas users usually pay attention more to the gas and do not seem to give due importance to the slurry which has high manorial value. Past studies have also shown that if farmers realize full benefit of biogas plant they easily become ready to invest more on biogas. With this fact in mind, slurry extension pilot program (SEPP) was implemented by SNV/BSP with the main objective of enhancing the use of slurry among biogas farmers. The program was based on sponsoring of 10 Slurry Extension Officers (SEOs) in the three biggest biogas companies namely GGC, RGG and NBG. Details of the number of SEOs in each of these companies and their duty stations are presented in Table 36.
Table 36: Number of SEOs, their Affiliation with Companies and their Duty Stations
Company No. of SEOs Duty Station GGC 6 Nepalgunj, Butwal, Lalbandi. Itahari, Pokhara and Kathmandu RGG 2 Butwal and Bharatpur NBG 2 Biratnagar and Pokhara
Total 10
Under the Slurry Extension Pilot Program, the main activities of the SEOs were to carry out repeated visits to the farmers so as to create awareness about the importance of slurry use and to guide them on proper storage of slurry, composting, transporting and application methods. SNV/BSP also hired slurry extension specialists for technical training and supervision of the SEOs. Along with regular visits by SEOs, other methods of information dissemination like Leaflets, Posters distribution and Radio discussion Programs were also conducted under the pilot program for the promotion of slurry use. The major findings of the evaluation of the biogas slurry extension pilot program have been summarized below. The technology is extended to 811 farmers in 23 districts. The result shows that the farmers co-operating in this pilot programme have constructed on an average 1.4 number of compost pits of size 6.6 m3 in average. The average size of the biogas plants is 9.6 m3 and plant feeding is done with 34 kg of dung and 32 liters of water per day. The composting materials used in the Terai region are mainly rice straw, whereas in the hills it consists of weeds, wasted fodder and grasses. All the farmers have started storing the slurry in the compost pits. As indicated by the farmers, they use 3.6 kg of dry materials per day to absorb the moisture of the slurry as well as for composting. All the farmers, who participated in slurry extension, had felt that slurry should be better than FYM as more nutrients are released due to further decomposition of already digested slurry. Depending on the availability of raw materials for composting, the farmers apply higher quantity of compost to vegetables (36 to 60 tons/ha) and, average amount to cereals (6 to 15 tons/ha.). The farmers have understood the negative effect of drying it on the field. So, they incorporate it into the soil as soon as it is transported. Farmers reported positive effect of compost on crop production though some of them could not reply as they still wait for the result.
Chapter Chapter Chapter Chapter EFFECTS OF EXTENSION AND TRAINING
PROGRAMME ON THE PRACTICE OF BIOGAS FARMERS

Country Report on the Use of Bio-slurry in Nepal FINAL REPORT
37
The farmers and the managers of concerned offices also evaluated the job performance of the SEOs. All of them have rated SEOs’ performance satisfactory. They have been helpful in creating awareness, teaching and advising not only on composting but also on other aspects of farming practices. The managers were happy because the SEOs helped them in promotional activities as well. There has been some limitation on the logistic and administrative support to the SEOs. They were deprived of the minimum office facilities and also had administrative difficulties in their movement. The managers did not understand the importance of the programme and did not accept the accountability towards the programme, which developed some slackness in its smooth functioning. Still all of the managers and the farmers emphasised on the continuity of this programme with some modification. They recommended that this programme would be effective if the whole sole responsibility is given to the implementing agencies and the SEOs are as permanent staffs of the companies. Based on the suggestion made by the managers and the SEOs, it is recommended that this programme should be of permanent nature and should be continued with the biogas construction companies as hosts to implement the programme. The SEOs should be the permanent staffs of the companies or they should be recruited for longer duration. As the SEOs are moving all the time in the field, it was suggested that they should be provided with adequate means for motility, which would help in providing services to maximum number of farmers. Considering the achievement of the pilot program, its extension in an enlarged form was recommended and consequently Slurry Extension Program (SEP) was implemented from February 1, 1997 to July 1999 with the objective of maximizing the benefits of biogas plants by making best use of slurry for crop production. The specific objectives of the SEP are: � To create awareness among the biogas farmers about the importance of slurry in crop production. � To collect baseline information from farmers interested to improve the slurry use. � To guide interested farmers in adapting possible steps to increase quantity and quality of slurry
compost, some of which are as follows: a. Improvement of cattle shed. b. Stall feeding of cattle in relation to on-farm fodder production. c. Maximum dung feeding to biogas plant and using cattle urine for mixing. d. Digging appropriate size of compost pits and protecting them against direct sun heat and surface
water logging during rainy season. e. Regular addition of organic materials to the compost pits. f. Immediate incorporation of slurry compost into the soil after transportation to the field. � To evaluate the results of improved use of slurry by comparison to the previous practice of slurry
use or Farm Yard Manure (FYM) use before the installation of the biogas plant. � To update existing and develop new extension materials on proper use of slurry. � To train other manpower likely to be useful on the proper use of slurry by conducting special
training or integration in already existing trainings. � To conduct applied research supportive to extension on proper use of slurry.
Country Report on the Use of Bio-slurry in Nepal FINAL REPORT
38
� To evaluate the set up of the extension program, especially with regards to the performance of SEOs in different kinds of host organizations and to the effectiveness of various extension methods and materials.
Under the Program SNV/BSP appointed 15 SEOs and they were affiliated with five biogas companies (GGC, RGG, NBG, NGG & NRG) and three NGOs (FODECO, SERSOC & PATRON).
Major findings of the mid term impact assessment of SEP-II implemented by Alternative Energy Promotion Center (AEPC) of the Ministry of Environment, Science and Technology (MOEST) in cooperation with Nepal Biogas Promotion Group (NBPG) and other stakeholders namely SNV Nepal’s Biogas Support Programme (SNV/BSP); HMG’s Department of Agriculture (DOA); NGO Coalition for Biogas and Alternative Energy (NCBAE) and Alternate Energy Development and Promotion Foundation Nepal (AEDPF) has been summarized below. 6.2 Main Findings of Slurry Extension Programs 6.2.1 Impacts of SEP I Consolidated Management Services Nepal (P) Ltd (CMS), was assigned with the responsibility of carrying out the Mid-Term Evaluation of the SEP-I. The results of the evaluation showed that the SEO-wise achievements were not fully met except for maximum dung feeding and adding of dry materials to the compost pit. The main drawbacks were: (a) drop out of 10 SEOs out of 15 from programme; (b) relatively low coverage of the programme; and (c) insufficient ownership of the companies about programme. The above weaknesses lead to redesigning the programme as Slurry Extension Programme-II (SEP-II). 6.2.2 Impacts of SEP II � As a result of the participation in slurry extension programme, there has been an improvement in
the reduction of grazing month and increment in the stall-feeding. Similarly, there is an increase in the fodder grass and fodder tree plantation among the farmers participating in SEP-II as compared to the non-participating ones.
� In case of the respondents participating in SEP-II, every sampled biogas household has constructed the compost pit, while in case of non-participating ones, nearly 16 percent do not possess the compost pit.
� The percentage of the farmers adopting protection measure for the compost pit against water logging has been found to be 12 percent more in case of the SEP-II participating farmers as compared to non-participants. Similarly, remarkable improvement has been noticed in the protection of compost pit against exposure to sun as nearly 90 percent farmers are found to adopt this measure. On the contrary, only 54 percent farmers have been practicing such measure among non-participants.
� In case of non-participating farmers, around 30 percent have been practicing the urine collection from the cattle to mix it with the slurry. The percentage of the respondents collecting urine has increased substantially as a result of participation in SEP-II. It is also observed that the frequency of visit by the Companies is more in case of participants’ households as compared to those of non-participants. About 75 percent of the sampled Companies expressed their satisfaction on the performance of RSEOs.
� 78 percent of the participating farmers have perceived an increased yield of crops due to application of slurry compost compared to 65 percent respondents belonging to non-participating group, showing a difference of 13 percent between these two groups of respondents.
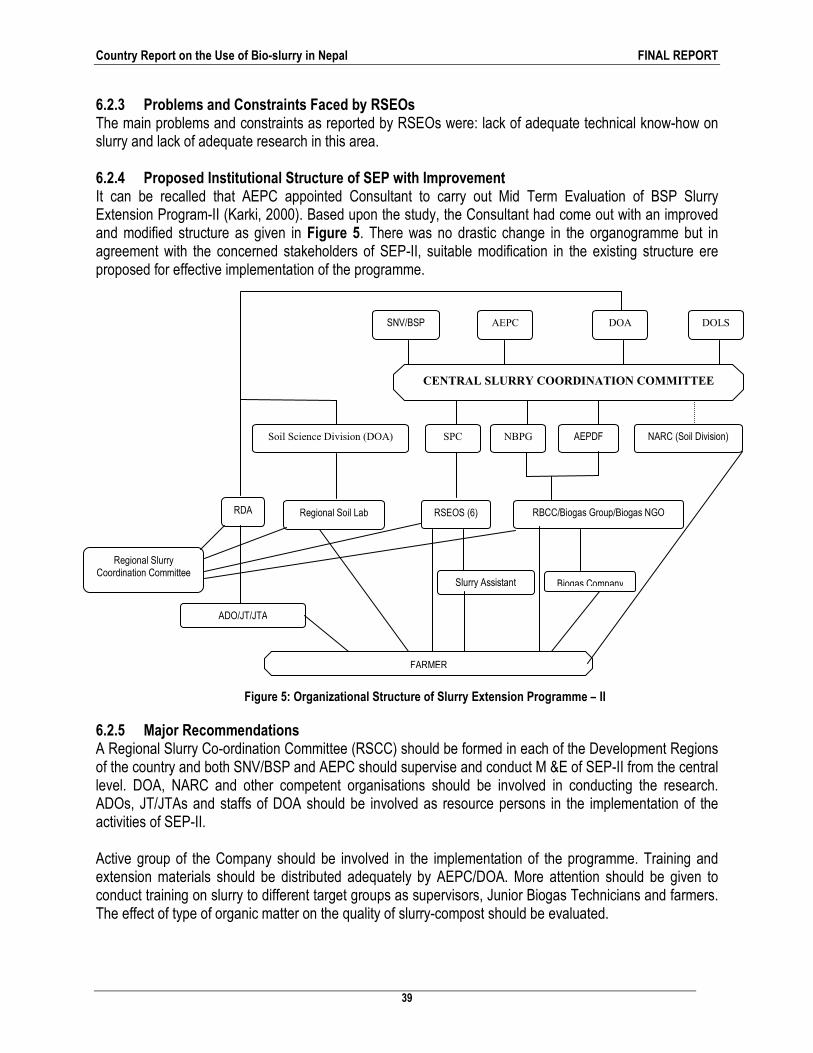
Country Report on the Use of Bio-slurry in Nepal FINAL REPORT
39
6.2.3 Problems and Constraints Faced by RSEOs The main problems and constraints as reported by RSEOs were: lack of adequate technical know-how on slurry and lack of adequate research in this area. 6.2.4 Proposed Institutional Structure of SEP with Improvement It can be recalled that AEPC appointed Consultant to carry out Mid Term Evaluation of BSP Slurry Extension Program-II (Karki, 2000). Based upon the study, the Consultant had come out with an improved and modified structure as given in Figure 5. There was no drastic change in the organogramme but in agreement with the concerned stakeholders of SEP-II, suitable modification in the existing structure ere proposed for effective implementation of the programme.
6.2.5 Major Recommendations A Regional Slurry Co-ordination Committee (RSCC) should be formed in each of the Development Regions of the country and both SNV/BSP and AEPC should supervise and conduct M &E of SEP-II from the central level. DOA, NARC and other competent organisations should be involved in conducting the research. ADOs, JT/JTAs and staffs of DOA should be involved as resource persons in the implementation of the activities of SEP-II. Active group of the Company should be involved in the implementation of the programme. Training and extension materials should be distributed adequately by AEPC/DOA. More attention should be given to conduct training on slurry to different target groups as supervisors, Junior Biogas Technicians and farmers. The effect of type of organic matter on the quality of slurry-compost should be evaluated.
SNV/BSP AEPC DOA DOLS
Soil Science Division (DOA) SPC
CENTRAL SLURRY COORDINATION COMMITTEE
NBPG AEPDF NARC (Soil Division)
Regional Soil Lab RSEOS (6) RBCC/Biogas Group/Biogas NGO RDA
ADO/JT/JTA
Figure 5: Organizational Structure of Slurry Extension Programme – II
Biogas Company
Regional Slurry Coordination Committee
Slurry Assistant
FARMER

Country Report on the Use of Bio-slurry in Nepal FINAL REPORT
40
6.3 Trainings Conducted on Proper Utilization of Bio-Slurry under Biogas Support Programme The overall objective of the training programme was to develop the company/NGO staff as a resource person in the field of proper handling and managing the digested bio-slurry. It is expected that the trained manpower would assist their clientele in managing and handling the bio-slurry most efficiently and effectively so that the quality and quantity of bio-slurry can be retained or improved or increased.
6.3.1 Training period, Number of Trainees and Venues 60 trainees selected from biogas companies (excluding SEOs) and 30 from NGOs (excluding SEOs) were selected to undergo the training course. The trainings were conducted in five batches as follows: � Regional Agriculture Training Centre, Khairenirar (Feb. 17 to 19, 1997); � Company staff – 22 participants; � Chamber of Commerce, Narayanghat, Chitwan (Feb. 23 to 25, 1997); � Company staff- 23 participants; � Regional Agriculture Training Centre, Jhumka, Sunsari (March 25 to 27, 1997); � 16 participants; � Staff College Lalitpur (March 17 to 19, 1997); and � Staff of NGO- 30 participants.
6.3.2 Course Content of the Training Program The training aimed to cover the following major aspects: � Introduction to biogas slurry; � Manorial value of digested slurry and factors affecting quality and quantity of slurry; � Improved slurry utilisation technologies-method of application, composting storage of manure,
transportation and application of manure, effect of slurry manure on crop production � Socio-economic consideration on proper use of bio-slurry; � Improved shed management; and � Fodder/forage crop production at household level.
The detailed course content in various training conducted during various time periods are given below:
� Course Content of the Training conducted from December 23rd to December 26th 1997
PART – I BIOGAS TECHNOLOGY � Biogas plant and its advantages and disadvantages; � Factors affecting gas production; and � Basic repair and maintenance of biogas plant.
PART – II PROPER UTILIZATION OF BIOGAS SLURRY � Review of proper utilization of slurry related programme implemented by NGOs; and � Proper use of biogas slurry, quality aspect of biogas slurry and its effect on crop production.
PART – III EXTENSION MANAGEMENT TECHNIQUES � What is biogas extension? Why is it necessary? How can it be done through NGO? � Rapid appraisal of agricultural knowledge system (RAAKS) � Objective oriented project planning � Management information system.
PART – IV GENDER ISSUE � Gender's role and women's participation in biogas
Country Report on the Use of Bio-slurry in Nepal FINAL REPORT
41
6.3.3 General Reaction of the Training Programme The results about the opinion on general reaction of the training showed that 88 percent of the trainees expressed that their expectations from the training were fulfilled to a great extent. Similarly, more than 80 percent of the trainees expressed that the training programme was able to generate their interest during the training and the training programme contributed a lot in increasing their knowledge and skill. Majority of the trainees (96%) felt that the knowledge and skill learned during the training could be applied in their working situations.
6.4 Training Programme for Slurry Extension Officers (SEOs) This training programme dealt with Extension Methods, Training Management and Fodder Production and Cattle shed improvement. It was conducted from September 29 to October 5, 1996.
6.4.1 Major Objectives � To enable SEOs to select and use three appropriate extension methods for slurry management
technology; � To make SEOs capable of planning and implementing short duration training programme (1 to 3
days) for various target groups such as company's staff, masons, supervisors and biogas farmers on slurry management technology; and
� To enable SEOs to explain important aspects of cattle shed improvement and green fodder production all the year round.
6.4.2 Reaction Evaluation Reactions of the trainees were observed in order to assess the effectiveness of the training programme as a whole. The evaluation result showed that the majority of the trainees (67%) were satisfied with the training which fulfilled their expectations. Similarly, 77% of the trainees perceived that the training had increased their knowledge and skill and almost half of the trainees revealed that this knowledge and skill would be applicable to a great extent, while rest of them reacted that this would be applicable to the field to some extent.
6.4.3 Training Facilities Provided by the Programme More than 66 percent of the trainees were very much impressed with the training facilities provided, while 22 percent were less impressed and 11 percent were not at all impressed by the training facilities provided by the programme. The one reason could be that the programme did not provide lodging transportation facilities.
6.4.4 Training Methods Used Training methods employed by the resource persons consisted of lecture, group discussion, brainstorming exercises, and buzz-group techniques. Out of the training techniques used, exercises, group discussions were found as very good teaching methods followed by brainstorming and lecture. It was observed that the combination of all these teaching methods was the most effective way of disseminating the knowledge and techniques to the target groups.
6.5 Training on Proper Use of Slurry for Technical Staff of SNV/BSP This training was conducted from July 19 and 21, 1998. � The detailed course content of the training program was as given below: � Introduction to biogas slurry; � Manorial value of digested slurry; � Factors affecting quality and quantity of slurry manure; � Proper utilisation of slurry; and
Country Report on the Use of Bio-slurry in Nepal FINAL REPORT
42
- Application method of digested slurry; - Multi uses of digested slurry; and - Proper handling, storage, transportation and application of slurry. � Effect of slurry manure on crop production.
� For better utilisation of slurry and slurry extension programmes, some of the important suggestions derived in course of the training are as follows:
� Utilisation of slurry should be an integral component of biogas technology; � There is an immediate need to create general awareness of the use of slurry; � More research/studies are required for application of slurry in different forms (liquid slurry, dried
slurry, slurry mixed with composting materials); � In order to properly conserve the manorial value of slurry, pit design is an integrated part of the
slurry utilisation programme; and � Even subsidy release could be linked with completion of standardised pit digging.
6.6 Development of Appropriate Slurry Extension Model It was pointed out earlier that based upon the experience gained with Pilot and Sep-I and the recommendations of Mid-Term Review (MTR) from 1999, BSP III had launched SEP-II in which the leading principle was that slurry extension should reach the farmers through established channels such as the biogas construction companies and countrywide network of the Ministry of Agriculture (Castro et al, 2005). The BSP had trained 2,225 biogas users on the proper management and utilization of the slurry. Unfortunately, the involvement of the MOA in the slurry extension programmes has been a notorious failure by the lack of interest of the ministry. Hence the MRT Team had recommended the more involvement of locals, NGOs, MFIs, CBOs agriculture and dairy co-operatives, etc in this extension programme (Castro et al, 2005). The biogas construction companies are stimulated to provide slurry extension because they benefit from the positive publicity of a satisfied customer. In addition, slurry pits are the part of quality requirements of the biogas plant, and the biogas company gets a bonus of NRs 140 per plant if the composting methods are properly followed (Castro et al, 2005). Multi Annual Plan for remaining period (Jan 2006 – June 09) has focused to develop appropriate slurry extension model that is helpful to promote biogas plants. The activities envisioned in this model, but not limited to the followings, are (BSP-N, 2006): � Coordination of slurry extension and promotion; � Physico-chemical analyses of bio-slurry, FYM and compost; � Study on promotion and trading of bio-compost and organic products; � Bonus to biogas companies for construction of slurry compost pit; � Printing slurry extension and promotion leaflets; and � Orientation on slurry extension and promotion to NGOs/MFIs and teachers; and training to biogas
companies on slurry extension and promotion.
In above backdrop, an outline of a package of three years’ programme (2007-2009) regarding Development of Appropriate Slurry Extension Model (SEM) has been elaborated by the Consultant in close cooperation with BSP-Nepal. Tentative programme including short methodology and cost estimate
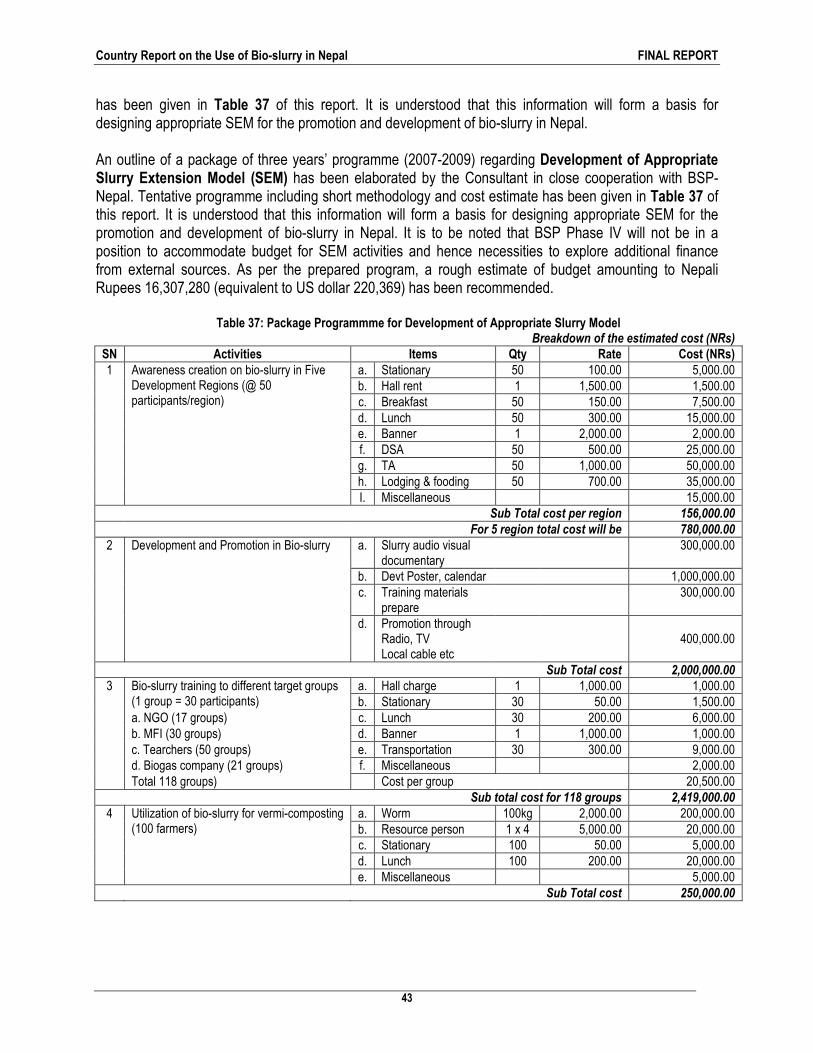
Country Report on the Use of Bio-slurry in Nepal FINAL REPORT
43
has been given in Table 37 of this report. It is understood that this information will form a basis for designing appropriate SEM for the promotion and development of bio-slurry in Nepal. An outline of a package of three years’ programme (2007-2009) regarding Development of Appropriate Slurry Extension Model (SEM) has been elaborated by the Consultant in close cooperation with BSP-Nepal. Tentative programme including short methodology and cost estimate has been given in Table 37 of this report. It is understood that this information will form a basis for designing appropriate SEM for the promotion and development of bio-slurry in Nepal. It is to be noted that BSP Phase IV will not be in a position to accommodate budget for SEM activities and hence necessities to explore additional finance from external sources. As per the prepared program, a rough estimate of budget amounting to Nepali Rupees 16,307,280 (equivalent to US dollar 220,369) has been recommended.
Table 37: Package Programmme for Development of Appropriate Slurry Model Breakdown of the estimated cost (NRs)
SN Activities Items Qty Rate Cost (NRs) 1 a. Stationary 50 100.00 5,000.00 b. Hall rent 1 1,500.00 1,500.00 c. Breakfast 50 150.00 7,500.00 d. Lunch 50 300.00 15,000.00 e. Banner 1 2,000.00 2,000.00 f. DSA 50 500.00 25,000.00 g. TA 50 1,000.00 50,000.00 h. Lodging & fooding 50 700.00 35,000.00
Awareness creation on bio-slurry in Five Development Regions (@ 50 participants/region)
I. Miscellaneous 15,000.00 Sub Total cost per region 156,000.00
For 5 region total cost will be 780,000.00
2 Development and Promotion in Bio-slurry a. Slurry audio visual documentary
300,000.00
b. Devt Poster, calendar 1,000,000.00 c. Training materials
prepare 300,000.00
d.
Promotion through Radio, TV Local cable etc
400,000.00
Sub Total cost 2,000,000.00
3 a. Hall charge 1 1,000.00 1,000.00
Bio-slurry training to different target groups (1 group = 30 participants) b. Stationary 30 50.00 1,500.00
a. NGO (17 groups) c. Lunch 30 200.00 6,000.00 b. MFI (30 groups) d. Banner 1 1,000.00 1,000.00 c. Tearchers (50 groups) e. Transportation 30 300.00 9,000.00 d. Biogas company (21 groups) f. Miscellaneous 2,000.00 Total 118 groups) Cost per group 20,500.00 Sub total cost for 118 groups 2,419,000.00
4 a. Worm 100kg 2,000.00 200,000.00
Utilization of bio-slurry for vermi-composting (100 farmers) b. Resource person 1 x 4 5,000.00 20,000.00
c. Stationary 100 50.00 5,000.00 d. Lunch 100 200.00 20,000.00 e. Miscellaneous 5,000.00 Sub Total cost 250,000.00
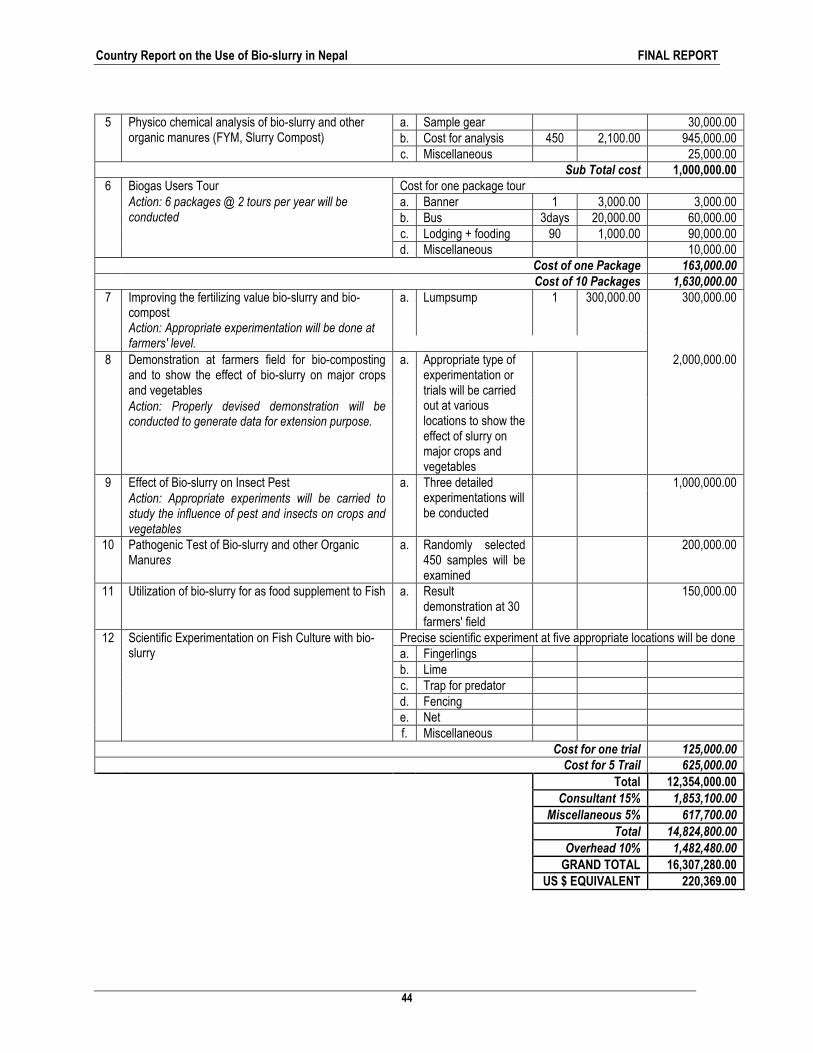
Country Report on the Use of Bio-slurry in Nepal FINAL REPORT
44
5 a. Sample gear 30,000.00 b. Cost for analysis 450 2,100.00 945,000.00
Physico chemical analysis of bio-slurry and other organic manures (FYM, Slurry Compost)
c. Miscellaneous 25,000.00 Sub Total cost 1,000,000.00 6 Biogas Users Tour Cost for one package tour a. Banner 1 3,000.00 3,000.00 b. Bus 3days 20,000.00 60,000.00
Action: 6 packages @ 2 tours per year will be conducted
c. Lodging + fooding 90 1,000.00 90,000.00 d. Miscellaneous 10,000.00 Cost of one Package 163,000.00
Cost of 10 Packages 1,630,000.00
7 Improving the fertilizing value bio-slurry and bio-compost
a. Lumpsump 1 300,000.00 300,000.00
Action: Appropriate experimentation will be done at farmers' level.
8 Demonstration at farmers field for bio-composting and to show the effect of bio-slurry on major crops and vegetables
a. 2,000,000.00
Action: Properly devised demonstration will be conducted to generate data for extension purpose.
Appropriate type of experimentation or trials will be carried out at various locations to show the effect of slurry on major crops and vegetables
9 Effect of Bio-slurry on Insect Pest a. 1,000,000.00 Action: Appropriate experiments will be carried to
study the influence of pest and insects on crops and vegetables
Three detailed experimentations will be conducted
10 Pathogenic Test of Bio-slurry and other Organic Manures
a. Randomly selected 450 samples will be examined
200,000.00
11 Utilization of bio-slurry for as food supplement to Fish a. Result demonstration at 30 farmers' field
150,000.00
12 Precise scientific experiment at five appropriate locations will be done
Scientific Experimentation on Fish Culture with bio-slurry a. Fingerlings
b. Lime c. Trap for predator d. Fencing e. Net f. Miscellaneous Cost for one trial 125,000.00
Cost for 5 Trail 625,000.00
Total 12,354,000.00
Consultant 15% 1,853,100.00
Miscellaneous 5% 617,700.00
Total 14,824,800.00
Overhead 10% 1,482,480.00
GRAND TOTAL 16,307,280.00
US $ EQUIVALENT 220,369.00
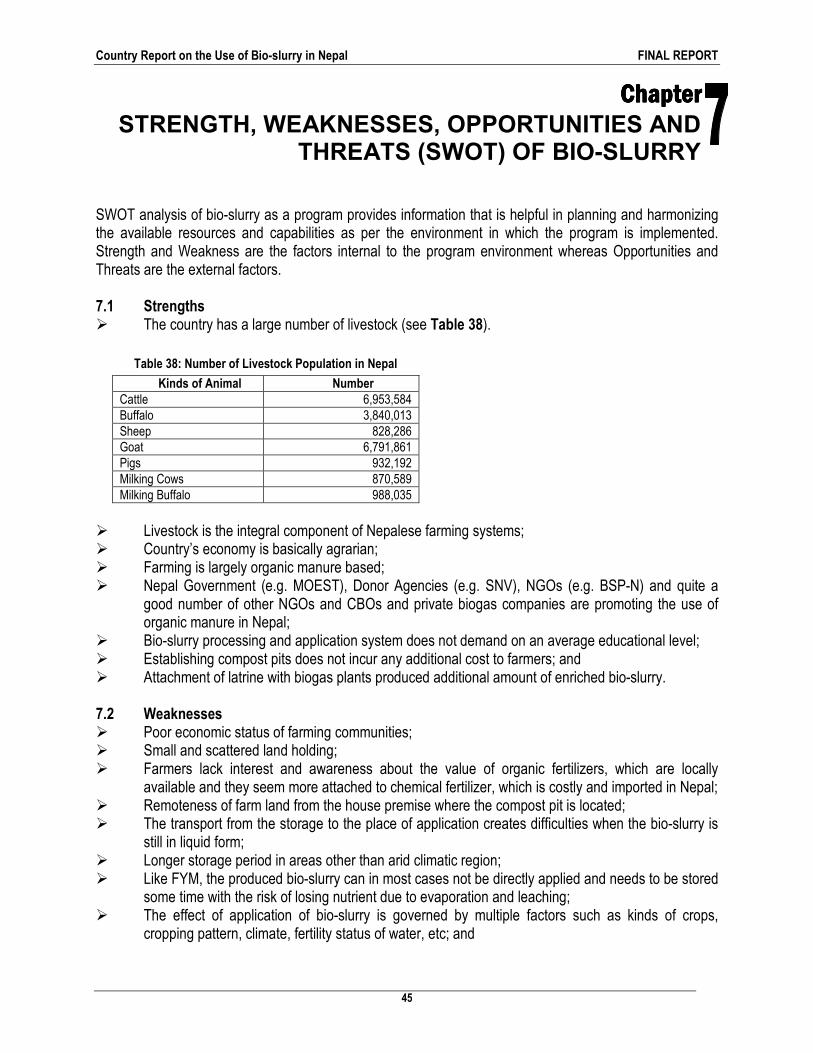
Country Report on the Use of Bio-slurry in Nepal FINAL REPORT
45
SWOT analysis of bio-slurry as a program provides information that is helpful in planning and harmonizing the available resources and capabilities as per the environment in which the program is implemented. Strength and Weakness are the factors internal to the program environment whereas Opportunities and Threats are the external factors.
7.1 Strengths � The country has a large number of livestock (see Table 38).
Table 38: Number of Livestock Population in Nepal
Kinds of Animal Number Cattle 6,953,584 Buffalo 3,840,013 Sheep 828,286 Goat 6,791,861 Pigs 932,192 Milking Cows 870,589 Milking Buffalo 988,035
� Livestock is the integral component of Nepalese farming systems; � Country’s economy is basically agrarian; � Farming is largely organic manure based; � Nepal Government (e.g. MOEST), Donor Agencies (e.g. SNV), NGOs (e.g. BSP-N) and quite a
good number of other NGOs and CBOs and private biogas companies are promoting the use of organic manure in Nepal;
� Bio-slurry processing and application system does not demand on an average educational level; � Establishing compost pits does not incur any additional cost to farmers; and � Attachment of latrine with biogas plants produced additional amount of enriched bio-slurry. 7.2 Weaknesses � Poor economic status of farming communities; � Small and scattered land holding; � Farmers lack interest and awareness about the value of organic fertilizers, which are locally
available and they seem more attached to chemical fertilizer, which is costly and imported in Nepal; � Remoteness of farm land from the house premise where the compost pit is located; � The transport from the storage to the place of application creates difficulties when the bio-slurry is
still in liquid form; � Longer storage period in areas other than arid climatic region; � Like FYM, the produced bio-slurry can in most cases not be directly applied and needs to be stored
some time with the risk of losing nutrient due to evaporation and leaching; � The effect of application of bio-slurry is governed by multiple factors such as kinds of crops,
cropping pattern, climate, fertility status of water, etc; and
Chapter Chapter Chapter Chapter STRENGTH, WEAKNESSES, OPPORTUNITIES AND
THREATS (SWOT) OF BIO-SLURRY
Country Report on the Use of Bio-slurry in Nepal FINAL REPORT
46
� Due to latrine connection, the farmers are reluctant to use bio-slurry. 7.3 Opportunities � Strongly growing realization of the importance of organic manure based agricultural products; � Extension of its use in high value and export oriented agriculture commodities; � Saving of money in the purchase of chemical fertilizer; � Extension of its use as supplement feed for fish, cattle, pigs, poultry birds, etc.; and � Extension of slurry use as pesticide/insecticide. � Income generation by selling bio-compost (e.g. through vermi-composting) 7.4 Threats � Introduction and adoption of high input responsive modern technologies; � Handling modes tedious and difficult; � Farmers’ reluctance to use slurry from latrine attached biogas plants due to social constraint; and � The new generation moving away from farming.
Country Report on the Use of Bio-slurry in Nepal FINAL REPORT
47
8.1 Conclusions Studies conducted till date in Nepal on slurry use shows that its potential is being realized by the farmers, the target beneficiaries, along with the increasing awareness created due to various extension programs and its utilization is getting popular day by day. However, there is still a long way to go to overcome the constraints in slurry use and optimize its utilization. Conducting more extensive training programs so as to transfer the knowledge on slurry use to farmers in every corner of the country is a foremost task ahead. Convincing farmers that slurry from latrine attached plants is also highly good for crops, and that it can be used safely with proper handling methods is a major challenge in rural context where people are reluctant to use latrine attached slurry due to social reservations. Similarly, storage and application of slurry to the field has been another constraint for effective use of slurry due to the transportation problem created by heavy weight/liquid nature of slurry, and also due to the distance between slurry pit (household premise) and field where crops are produced. Extension training programs on slurry use, supported by analysis of bio-slurry characterization/physico-chemical analysis have been playing prime role in promoting slurry utilization. Improper method of storage, composting and application may cause reduction in nutrient value which will affect farmers’ perception on slurry adversely. Slurry extension programs and trainings have been highly functional in knowledge propagation. Various studies and researches conducted in the past helped to derive a conclusion that bio-slurry is immensely beneficial in farming system due to its multi-dimensional potentiality. However, further researches are necessary to confirm this finding with sufficient evidence. Bio-slurry is obtained to farmers almost free of cost, and hence provides economic sustainability to the farmers, as it can be used as soil conditioner; as fertilizer for crops; as rich nutrition for fish cattle and poultry birds; as pesticide against pests/diseases to control insects and pathogens. However, overcoming the underlying challenges and constraints is primarily required for effective utilization of slurry, which is both economically and environmentally friendly to the society and the nation. 8.2 Recommendations � Slurry analysis for physico-chemical and biological content which is being carried out should be
continued so as to confirm the research result with adequate time series database; � As a continuation to the past studies, assessment of slurry, both at field level (practical
demonstration) and laboratory level (physico-chemical analyses and pathological examination), should be carried out to confirm the previous findings.
� Training should be imparted to the biogas farmers in view of adopting and extending vermi-composting technique for income generation;
� Long term time series data base on slurry use as fish feed is necessary to confirm the findings till now. Such study should be conducted to derive a concrete conclusion in this concern;
� Sound techniques of storage, processing, transportation and application should be adopted such that the handling of slurry is done in a healthy manner;
� To minimize the risk of diseases contamination training should be imparted to biogas users regarding proper handling of bio-slurry by means of the instruction book prepared by BSP-N on health and sanitation aspects;
Chapter Chapter Chapter Chapter CONCLUSIONS AND RECOMMENDATIONS
Country Report on the Use of Bio-slurry in Nepal FINAL REPORT
48
� Separate R&D should be conducted for this with the involvement of experts and concerned stakeholders who can come out with innovative ideas to solve the existing problems in slurry utilization to its full potential;
� Massive training materials like audio-visual elements; pictorial pamphlets etc, demonstrating multiple utilities of slurry, should be used extensively for effective knowledge dissemination to the targeted beneficiary group;
� Orientation on slurry extension and promotion to NGOs/MFIs and teachers; and training to biogas companies on slurry extension and promotion should be carried out (refer to Appropriate Slurry Extension Method, Section 6.6);
� Study on promotion and trading of bio-compost and organic products should be undertaken for income generation; and
� Las but not the least, the Consultant has developed a Slurry Extension Model for three years (2007 to 2009) envisaging above mentioned activities. The tentative programs including the estimated cost (NRs. 16,307,280 equivalent to US$ 220,369) for implementation of this model has been presented in Chapter Six of this report
Country Report on the Use of Bio-slurry in Nepal FINAL REPORT
49
REFERENCES
1. Agricultural Technology Centre (1998) A Final Report of Analysis of Toilet Attached Biogas Slurry-Compost. Biogas Support Programme.
2. BRTC (1983) Biogas Technology: UNDD-ESCAP-FAO-China Biogas Training Course, Chengu, China.
3. BSP-N (2006) Multi Annual Plan for Remaining Period (Jan. 2006 – Jun ’09). February 2006. 4. Castro et al (2005) Mid-Term Review of the Renewable Energy Sector Support Programme.
The Netherlands Development Organization of Nepal (SNV/N) 5. CMS (2006) Biogas Users Survey 2006. Alternative Energy Promotion Centre. 6. FAO/CMS. Biogas Technology: A Training Manual for Extension. CMS, September 1996. 7. Gupta (1991) Bio-fertilizer from Biogas Plants. Changing Villages, Vol 10, No.1, Jan-Mar, 1991. 8. Gurung, B. (1998) Final Training Report of Slurry Extension in Officers Organized by Biogas
Support Programme/ SNV/N. Biogas Support Programme. 9. Gurung, B. (1997) Support Slurry Extension Programme . Biogas Support Programme. 10. Gurung, B. (1997) Workshop on Progress and Problem Review of Slurry Extension
Programme and Slurry Extension Activities for the Coming Days. September 5 & 7, 1997. 11. Gurung, B.; Sherpa, R. and Shrestha. L. (1998) Training Programme on Follow up Slurry
Extension and Rural Management Technique. Biogas Support Programme. 12. Gurung, J. B. (1997) Review of Literature on Effect of Slurry Use on Crop Production. Biogas
Support Programme. 13. Gurung. B. (1997) Training Manual: Proper Utilization of Bio-Slurry. Biogas Support
Programme. 14. Gurung. B. (1998) Training Programme on Proper Use of Slurry for Technical Staff of
SNV/BSP. Biogas Support Programme. July 19 and 21, 1998. 15. Karki, A. B. (2000) Mid-term Evaluation of BSP Slurry Extension Program-II. Alternative Energy
Promotion Centre. 16. Karki, K. B. and Gurung, B. (1996) Evaluation of Biogas Slurry Extension Pilot Programme.
Biogas Support Programme. 17. Karki, K.B. and Karki, A.B. (2001) Response to Bio-slurry Application on Maize and Cabbage in
Lalitpur District. Final Report. Alternative Energy Promotion Centre 18. Karki, K.B.; Shrestha, J. N. and Biogas, S (2005) Biogas as Renewable Source of Energy in
Nepal: Theory and Development. BSP-Nepal. December 2002. 19. Sathianathan, M.A. (1975) Bio-gas: Achievement and Challenges. AVARD A/1, Kailash Colony,
New Delhi-110048. 20. SNV/SNV (1998) Proposal on the BSP Slurry Extension Programme-II 1998-2001.SNV/Biogas
Support Programme. 21. SNV/BSP (2002) Abstracts of Biogas Related Publications (1991 – 2002). December 2002. 22. SNV/BSP (2002) An Integrated Environment Impact Assessment. Final Report. SNV/Biogas
Support Programme.

Country Report on the Use of Bio-slurry in Nepal FINAL REPORT
I
Annex I
TERMS OF REFERENCE (DRAFT) FOR PREPARATION AND PRESENTATION OF A COUNTRY PAPER ON THE USE OF BIO-
SLURRY IN NEPAL 1.0 INTRODUCTION AND BACKGROUND Domestic biogas plants convert animal dung and human excreta at household level into precious amounts of combustible gas, known as ‘biogas’. This gas can be effectively used in simple gas stoves for cooking and in lamps for lighting. The residue of the process, known as ‘bio-slurry’15, can be easily collected and used as a potent organic fertiliser to enhance agricultural productivity or as food for fish in ponds.
Several countries in Asia have embarked on large-scale programmes on domestic biogas like China (15 million household digesters by the end of 2004), India (more than 3.5 million plants by 2004) and Nepal (more than 150,000 plants by the end of 2005). Other countries like Vietnam, Bangladesh and Cambodia are in the process to up-scale the deployment of biogas plants. In case biogas is replacing dried animal dung for the purpose of cooking, the bio-slurry has a very clear added value as it can be used as fertiliser or feed. In other cases, it has so far been rather difficult to clearly prove better results with bio-slurry compared to Farm Yard Manure (FYM)16. A survey among 600 biogas – and 600 non-biogas households in Nepal17 showed an inconclusive correlation between the installation of the biogas plant and crop production. It appeared that the biogas farmers – the ultimate customers – were not quite sure about the effects. Also farmers were not sure about the effect of bio-slurry on crop pests, diseases and weeds. On the positive side, a decrease of 9% on the use of chemical fertiliser was reported. There are various weaknesses and threats when it comes to the utilisation of bio-slurry: � In general, farmers lack interest in and awareness about the value of organic fertilisers, whether it
is bio-slurry or FYM. They seem much more eager to apply chemical fertiliser. Information, education and extension services often reach a limited part of the farmers.
� Connection of latrines makes farmers reluctant to use the bio-slurry.
15 The term bio-slurry is used here for the residue that comes out of the biogas plant. Other terms sometimes used are just ‘slurry’, ‘effluent’,
‘bio-manure’, ‘sludge’, ‘bio-fertiliser’, ‘organic fertiliser’ and ‘organic manure’. 16 The term Farm Yard Manure (FYM) is used here to refer to the dung available at the farm before the biogas plant was installed or to
farms without a biogas plant installed. 17 An Integrated Environment Impact Assessment. Final Report. SNV/Biogas Support Programme, Kathmandu, June 2002.
Country Report on the Use of Bio-slurry in Nepal FINAL REPORT
II
� Like FYM, the produced bio-slurry can in most cases not be directly applied and needs to be stored for some time. At one side, this may be advantageous as it provides an opportunity to decrease the water content and to further process the slurry, for example through composting. At the other side, however, the nutrient content is at risk through evaporation and leaching.
� The transport from the storage to the place of application creates difficulties when the bio-slurry is still in liquid form (water content higher than 80%).
� The effect of the application of bio-slurry as well as FYM on agricultural production depends on multiple factors, for example the kind of crops, cropping patterns, climatic and soil conditions, and can not easily be compared to one another.
It seems high time to make a full inventory of the experiences with the use of bio-slurry in the practice of the average biogas farmer so far. In this respect, the Netherlands Development Organisation (SNV) has taken the initiative to organise an International Workshop on the use of bio-slurry on 27-28 September 2006 in Bangkok. In the framework of this Workshop, it is important to learn as much as possible from the experiences with the use of bio-slurry in countries with large-scale programmes for domestic biogas like China, India and Nepal. This paper provides the Terms of Reference (ToR) for the preparation and presentation of a country paper on the use of bio-slurry in Nepal. 2.0 OBJECTIVE OF THE ASSIGNMENT The objective of this assignment is to prepare a quality report on the use of bio-slurry in Nepal and to present this report during the International Workshop on 27 and 28 September 2006 in Bangkok, Thailand. More specifically, the report will address the following areas: � Country background including brief description of the domestic biogas programme and the use of
different fertilisers; � Characterisation of bio-slurry; � Overview of handling (storage, process and transport) and application of bio-slurry; � Results of research and experiments on the use of bio-slurry; � Effects of extension and training programmes on the practice of biogas farmers in Nepal; � Strengths, weaknesses, opportunities and threats of bio-slurry; and � Conclusions on the use of bio-slurry so far and recommendations on its improved use in future. See Annex 1 for a tentative table of contents of the country report. 3.0 ACTIVITIES AND METHODOLOGIES The following activities and methodologies are proposed: � Preparation of a country report on the use of bio-slurry in Nepal by collecting secondary information
and contacting key informants in Nepal; � Presentation of the country report on the use of bio-slurry during the International Workshop on 27
and 28 September 2006 in Bangkok, Thailand, by using MS PowerPoint. 4.0 TIME SCHEDULE The preparation of the draft country report shall be completed and submitted to SNV before 31st of August, 2006. SNV will provide within 5 working days comment on the draft report. After that, the final country report will be submitted to SNV within five working days. Based on the final report, a PowerPoint presentation will be prepared and delivered during the International Workshop on the use of bio-slurry in Bangkok.
Country Report on the Use of Bio-slurry in Nepal FINAL REPORT
III
5.0 EXPECTED OUTPUT The report shall be well-structured and clearly written in English not exceeding 50 pages excluding annexes and provide informed conclusions and recommendations on the (improved) use of bio-slurry in Nepal. Annex I provides a tentative table of contents for the report. In addition, SNV shall receive one soft or hard copy of all relevant documents issued on the use of bio-slurry in Nepal so far. Wim J. van Nes The Netherlands, 11 July 2006
Country Report on the Use of Bio-slurry in Nepal FINAL REPORT
IV
Annex I
TENTATIVE TABLE OF CONTENTS FOR THE COUNTRY REPORT ON THE USE OF
BIO-SLURRY IN NEPAL18 Title page Acknowledgement Summary Table of Contents Abbreviations 1. Introduction and background
� Biogas programme � Use of different fertilisers in the country
2. Objective, methodology and limitations of the assignment 3. Characterisation of bio-slurry
� Physic-chemical composition � Comparison of bio-slurry with other fertilisers
4. Overview of handling and application of bio-slurry
� Methods (technique, cost) to store bio-slurry � Methods (technique, cost, effect) to process bio-slurry � Methods (technique, cost, effect) to apply bio-slurry
5. Results of research and experiments on the use of bio-slurry
� Type of crop, dosage, reference plot, duration of experiment, etc. 6. Effects of extension and training programmes on the practice of biogas farmers
� Brief description of programmes including costs � Organisations involved � Promotional materials � Effects on the practice of farmers
7. Strengths, weaknesses, opportunities and threats of bio-slurry 8. Conclusions and recommendations 9. References Annexes: ToR
18 Serious efforts will be made to cover all aspects, but it is acknowledged that some aspects may receive less attention due to lack of
(reliable) secondary data.