counting what counts: time -driven activity-based …
TRANSCRIPT

MEDICAL MANAGEMENT CENTER Department of LEARNING, INFORMATICS, MANAGEMENT &
ETHICS Karolinska Institutet, Stockholm, Sweden
COUNTING WHAT COUNTS: TIME-DRIVEN ACTIVITY-BASED COSTING IN HEALTH CARE
George Keel
Stockholm 2020

All previously published papers were reproduced with permission from the publisher. Published by Karolinska Institutet. Printed by E-Print © George Keel, 2020 ISBN 978-91-7831-817-9

Counting what counts: Time-Driven Activity-Based Costing in Health Care THESIS FOR DOCTORAL DEGREE (Ph.D.) Dissertation defense held on Friday, May 8th, 2020
By
George Keel
Principal Supervisor: Associate Professor Pamela Mazzocato Medical Management Center Department of Learning, Informatics, Management and Ethics Karolinska Institutet Co-supervisor(s): PhD Carl Savage Medical Management Center Department of Learning, Informatics, Management and Ethics Karolinska Institutet Associate Professor Jonas Spaak Karolinska Institutet Department of Clinical Sciences, Danderyd Hospital Clinical Science Cardiology Professor Peter Lindgren Medical Management Center Department of Learning, Informatics, Management and Ethics Karolinska Institutet
Opponent: MD PhD Markus Lingman University of Gothenburg and Halland Hospital, Region Halland Sahlgrenska Academy Examination Board: Professor Eva Wittbom Stockholm University Stockholm Business School The Academy of Management Accounting and Control Associate Professor Birger Forsberg Health Systems and Policy Department of Global Public Health Karolinska Institutet Associate Professor Carola Lemne Karolinska Institutet Department of Clinical Sciences, Danderyd Hospital
Professor Emeritus Mats Brommels Medical Management Center Department of Learning, Informatics, Management and Ethics Karolinska Institutet


To my Mom and my Dad.


ABSTRACT Introduction: Patients with multiple chronic conditions consume over 40% of health care resources. The si-loed nature of the health care system exacerbates these costs, and integrated care solutions are required to adequately meet their needs. However, such integrated multidisciplinary ap-proaches are seen as costly. Therefore, costing care for patients with multiple chronic condi-tions becomes important to support health care professionals, management, and policy makers understand the true financial impact of integrated multidisciplinary care. Aim: The aim of this thesis is to explore how Time-Driven Activity-Based Costing (TDABC) can be applied to capture and compare the cost of integrated multidisciplinary versus traditional siloed care processes for patients with multiple chronic conditions. Method: This thesis is comprised of four studies. Study I was a systematic review performed according to the PRISMA statement and used qualitative methods to analyze data through content analy-sis. Studies II to IV were based on a randomized controlled trial CareHND (NCT03362983). Study II used descriptive statistics to describe patient diagnostic data, Charlson Comorbidity Index scores, and performed a comparison of care utilization patterns between integrated mul-tidisciplinary care and traditional care. Study III adopted a mixed-methods approach to perform a TDABC analysis of integrated multidisciplinary care. Study IV expanded on Study III to compare the costs of integrated multidisciplinary care to that of traditional siloed care. Findings: Study I found that TDABC is an efficient and accurate tool for costing processes in health care, but has not been demonstrated to effectively cost care across the care continuum. Study II found that patients with multiple chronic conditions experience care that is characterized by high vol-ume and high variation, and no difference in care utilization was detected when comparing integrated multidisciplinary care to traditional siloed care. The TDABC cost analysis in Study III successfully estimated the outpatient care costs for patients with multiple chronic condi-tions. Study IV found that the integrated multidisciplinary care center saved a hospital an av-erage of 5,098.00 € per patient per year. Discussion: This thesis demonstrates how TDABC can be applied to capture and compare costs of pro-cesses for patients with multiple chronic conditions. More broadly, this thesis demonstrates how to conceptualize and evaluate real-world care pathways for patients with multiple chronic conditions in order inform actionable changes to clinical management within hospitals. This thesis lays the groundwork for empowering hospitals and other providers to incorporate finan-cial analyses into their evidence development, quality improvement, and decision making, and to contribute to the wider financial and economic systems in health care. Conclusion: This thesis demonstrates that a hospital-based integrated multidisciplinary care approach to a complex medical condition makes economic sense for the hospital and the system. The TDABC approach developed in this thesis project brought to light a set of core capacities which can be prioritized in future quality improvement efforts. Through these core capacities, clinical organizations will hopefully become empowered to make wise, value-driven decisions that will serve as the new incentive for organizational improvement. Information that demonstrates value delivery will make financial needs clear to managers and policy makers, who in turn should understand that evidence-based investment in care facilities and services will ultimately demonstrate a return, benefiting not only IMD-Care patients, but also the larger populations they serve.


LIST OF SCIENTIFIC PAPERS I. Keel, G., Savage, C., Rafiq, M., Mazzocato, P. (2017). "Time-driven activity-
based costing in health care: a systematic review of the literature." Health Pol-icy 121(7): 755-763.
II. Rafiq, M., Keel, G., Mazzocato, P., Spaak, J., Guttman, C., Lindgren, P., Sav-age, C. (2019). "Extreme consumers of health care: patterns of care utilization in patients with multiple chronic conditions admitted to a novel integrated clinic." Journal of Multidisciplinary Healthcare 12: 1075-1083.
III. Keel, G., Rafiq, M., Savage, C., Spaak, J., Gonzalez, I., Lindgren, P., Guttman, C., Mazzocato, P. (2020). Time-driven activity-based costing for patients with multiple chronic conditions: a mixed methods study to cost care in a multidis-ciplinary and integrated care delivery center at a university affiliated tertiary teaching hospital in Stockholm, Sweden. Submitted.
IV. Keel, G., Even, G., Mazzocato, P., Spaak, J., Lindgren, P., Savage, C. (2020). A cost comparison of an integrated care model for patients with multiple chronic conditions as compared to traditional care, using time‐driven activity‐based costing. Manuscript.

CONTENTS 1 Preface ............................................................................................................................. 3 2 Introduction ..................................................................................................................... 5
2.1 Rationale for the thesis: the cost crisis in health care involves patients with multiple chronic conditions ................................................................................... 5
2.2 Positioning of the thesis ........................................................................................ 5 3 Background...................................................................................................................... 7
3.1 A stuck health care system .................................................................................... 7 3.2 Time-driven activity-based costing....................................................................... 8 3.3 The challenge of costing care for patients with multiple chronic conditions
in a reductionist health care system .................................................................... 10 3.4 Integrated care ..................................................................................................... 10
4 Aim ................................................................................................................................ 13 5 Methods ......................................................................................................................... 15
5.1 Philosophic research foundations ....................................................................... 15 5.2 Setting .................................................................................................................. 16 5.3 The HND randomized controlled trial: CareHND ............................................. 18 5.4 Overview of the studies ....................................................................................... 18 5.5 Study I .................................................................................................................. 19
5.5.1 Study design ............................................................................................ 19 5.5.2 Data collection......................................................................................... 19 5.5.3 Data analysis ........................................................................................... 20
5.6 Study II ................................................................................................................ 20 5.6.1 Study design ............................................................................................ 20 5.6.2 Data collection......................................................................................... 20 5.6.3 Data analysis ........................................................................................... 20
5.7 Study III ............................................................................................................... 21 5.7.1 Study design ............................................................................................ 21 5.7.2 Data collection and analysis ................................................................... 21
5.8 Study IV ............................................................................................................... 24 5.8.1 Study design ............................................................................................ 24 5.8.2 Data collection and analysis ................................................................... 24
5.9 Ethical considerations ......................................................................................... 26 6 Findings ......................................................................................................................... 29
6.1 Study I .................................................................................................................. 29 6.1.1 Study selection ........................................................................................ 29 6.1.2 Why TDABC was applied in health care ............................................... 30 6.1.3 Reported strengths and limitations of TDABC ...................................... 30 6.1.4 Observing the applications of TDABC through the lens of the
seven-step framework ............................................................................. 30 6.2 Study II ................................................................................................................ 32
6.2.1 Characterization of HND patients and their care ................................... 32
6.3 Study III ............................................................................................................... 33 6.3.1 Results of the TDABC application ......................................................... 33
6.4 Study IV ............................................................................................................... 36 6.4.1 Results of the cost analysis ..................................................................... 36
7 Discussion ...................................................................................................................... 41 7.1 Counting what doesn’t count .............................................................................. 41 7.2 Medical conditions with high variation and high-volume: patients with
multiple chronic conditions ................................................................................. 42 7.3 TDABC applied: costing care with high variation ............................................. 43
7.3.1 Step 1) Define the medical condition ..................................................... 43 7.3.2 Step 2) Define the CDVC ....................................................................... 44 7.3.3 Steps 3) and 4) Develop process maps and estimate the time of
activities ................................................................................................... 44 7.3.4 Step 5) Estimate the cost of supplying patient care resources ............... 45 7.3.5 Step 6) Estimate the capacity of each resource, and calculate the
capacity cost rate ..................................................................................... 46 7.3.6 Step 7) Calculate the total cost of patient care ....................................... 46
7.4 Why knowing how to count is not enough ......................................................... 46 7.5 The impact of counting what counts ................................................................... 48 7.6 The case for integrated multidisciplinary care models ....................................... 49 7.7 A need for collaboration between economy and health care professionals ....... 50
8 Methodological considerations ..................................................................................... 51 8.1 The challenge of obtaining reliable data ............................................................. 51 8.2 Interpretation of the general linear models ......................................................... 51 8.3 Personal reflections on an action learning journey ............................................. 52
9 Conclusion ..................................................................................................................... 55 10 Acknowledgements ....................................................................................................... 57 11 References ..................................................................................................................... 61 12 Appendix 1: Systematic review search strategies ........................................................ 65 13 Appendix 2: CDVCs with visit frequencies ................................................................. 67 15 Appendix 3: Process maps in tabular form ................................................................... 68 16 Popular science summary: counting what counts in health care .................................. 71

TABLES Table 1: Overview of the studies............................................................................................... 19
Table 2: Baseline demographics and multimorbidity of study groups (intervention compared to control) ....................................................................................................................................... 32
Table 3: Comparison of care utilization variables for 24 months pre- and 6 months post randomization ............................................................................................................................ 33
Table 4: Human resource capacity estimates and CCRs .......................................................... 35
Table 5: Non-human resource costs and corresponding drivers .............................................. 35
Table 6: Annual activity frequency, marginal cost, and total annual cost ............................... 35
Table 7: HCP costs and CCRs .................................................................................................. 36
Table 8: Non-HCP costs ............................................................................................................ 37
Table 9: Non-HCP cost adjustments ......................................................................................... 37
Table 10: CDVC costs, patient exposure, and care utilization ................................................. 38
Table 11: General linear model results ..................................................................................... 39
Table 12: Cost comparison of HND and traditional care ......................................................... 40
Table 13: Search strategies for each journal ............................................................................. 65

FIGURES Figure 1: Workflow summary of the HND Center ................................................................... 17
Figure 2: PRISMA flow diagram of the systematic literature review ..................................... 29
Figure 3: An HCP-validated process map for a new visit at the HND Center. ....................... 34
Figure 4: Characterization of the HND clinical experience ..................................................... 43


LIST OF ABBREVIATIONS ABC Activity-Based Costing
AI Artificial Intelligence
BI Business Intelligence
CCI Charlson Comorbidity Index
CCR Capacity Cost Rate
CDVC Care Delivery Value Chain
CEO Chief Executive Officer
CRF Conditional Random Fields
DRG Diagnostic Related Grouping
ED Emergency Department
EHR Electronic Health Record
FTE Full Time Equivalent
GLM General Linear Model
HBR Harvard Business Review
HCP Health Care Professional
HND Heart, Nephrology, Diabetes
IPU Integrated Practice Unit
IMD-Care Integrated Multidisciplinary Care
MCC Multiple Chronic Conditions
OECD Organization for Economic Cooperation and Development
PRISMA Preferred Reporting Items for Systematic Reviews and Meta-Analyses
R&D Research and Development
RCT Randomized Controlled Trial
RWE Real World Evidence
TDABC Time-Driven Activity-Based Costing
USK Undersköterska
VBHC Value Based Health Care

2

3
1 PREFACE As a health economist, I came to realize that cost figures used to inform health care systems are often generated on the aggregate level and designed to inform policy decisions with respect to remuneration and health economic evaluations of treatments, technologies and programs. However, the validity of these cost estimates was often the big pink elephant in the room that those in the health economic profession tend to ignore. How relevant are these cost estimates in the context of care delivery? Is this not the most important question with respect to cost, if we are to begin to get a handle on the consistent and unmanageable rise of health care costs that has become so inherent to health care systems in general?
This question became even more apparent when I began my doctoral thesis. We originally set out to perform a health-economic evaluation for a multi-disciplinary care center. The purpose of this evaluation was unique in that it was intended as much to inform the organizational con-text in which it was performed, as it was intended to inform the broader health care system regarding multi-disciplinary care. However, we quickly learned that the state of the art of cost-ing care delivery within hospitals was poorly equipped to inform evaluations intended to inform care delivery itself, aside from wider policy initiatives. Further, policy initiatives that were in-tended to incentivize providers to control costs led to unexpected and often counterproductive provider behaviors.
The thesis stands upon the belief that providers want to work with other professionals within the health care system in order to control the costs of care. This work is intended to empower care providers with the tools and theoretical understanding required to begin collaborating with the wider health care system to understand and control the cost of patient care.
George Keel Stockholm, April 2020


5
2 INTRODUCTION
2.1 RATIONALE FOR THE THESIS: THE COST CRISIS IN HEALTH CARE INVOLVES PATIENTS WITH MULTIPLE CHRONIC CONDITIONS
As health care technologies and treatments improve, people live longer. Patients are now sur-viving chronic conditions long enough to develop several of these over their lifetime. As result, most people over 65 years old deal with multiple chronic conditions (MCC). In the United States, patients with at least five MCCs account for 12% of the population (Buttorff et al., 2017), but they consume 41% percent of all health care resources (Buttorff et al., 2017). In Sweden, this group is responsible for 50% of all hospital inpatient days (Welfare, 2007). MCC patients consume the majority of hospital resources (Clarke et al., 2017, Lehnert et al., 2011, OECD, 2011), and hospitals account for between 30% and 50% of national health care ex-penditure in countries that form the Organization for Economic Cooperation and Development (OECD/European Union, 2018).
In response, health care policies have been implemented to mitigate the situation. These pri-marily involve third-party payers incentivizing care providers to minimize waste and control costs, using tools that include gatekeeping, global budget negotiation, priority setting, pay-for-performance, and bench marking (OECD, 2010). Providers work to meet these expectations, but they may react to incentives unpredictably and occasionally with behaviors that are coun-terproductive from a systems perspective (Sturmberg et al., 2012). Meanwhile, aging popula-tions, long-term care, technological innovations, and increasing prevalence of MCCs continue to drive up costs (OECD, 2011, OECD, 2017, Norbeck, 2013).
This thesis builds on innovative clinical management and cost-accounting theory in health care management to empower health care providers and organizations to cost care for MCC patients, taking a vital step forward in gaining control of the economic impact of their clinical decision making.
2.2 POSITIONING OF THE THESIS
The project described in this thesis was highly empirical in nature; based on real world appli-cations of theories and frameworks. The doctoral thesis is positioned within the fields of ac-counting and health care management, but pulls some from the fields of health economics and health policy. While these fields are broad, this thesis focuses on the sub-fields of clinical man-agement, clinical quality improvement, and cost-accounting in health care. The thesis became seated in these fields through the need to evaluate costs within an integrated care clinic for MCC patients. The nature of this topic demanded the inclusion of these academic disciplines and the literature from each field necessary to explain and contextualize the findings of this research.

6

7
3 BACKGROUND 3.1 A STUCK HEALTH CARE SYSTEM
Controlling health care spending has become a central aim for policy makers (Berwick et al., 2008), but care providers struggle to meet policy expectations. Several systematic reviews of the literature exploring the impact of financial incentives on quality and cost have found no measurable effect, and sometimes negative effects (Heider and Mang, 2020, Mandavia et al., 2017). These included salary adjustments, fee for service incentives, bonus payments, bundled payments, pay for performance, revenue sharing through participation in capitated plans, and accountable care organizations. The diverse range of incentives combined with the need to solve the cost challenge only exacerbated the problem because changing financial incentives within health care systems are expensive and the consequences are often impossible to estimate or asses (Heider and Mang, 2020).
The providers do not deal with the uncontrollable rise in system costs every day, but instead are focused on the managerial and clinical day-to-day challenges and issues; including devel-oping strategies to align the incentives of policy makers with staff motivations (Korlén et al., 2017). They receive their budgets and finances according to the policies set by decision makers, and work to report appropriately to minimize costs. Hospital management controls provider costs through annual budget setting for clinics and departments, so that providers will adjust existing care delivery practices to accommodate the new financial conditions (Korlén et al., 2017).
A large proportion of the literature regarding the challenges of cost accounting in health care focuses on properly reporting costs in order to inform tariff setting, bench-marking, budgeting, and performance management (Chapman et al., 2016). All of these are methods for reporting purposes that are useful to decision makers, but are not relevant on an operational level. Granted cost information is discussed within the context of targeted cost improvement plans and service redesign (Chapman et al., 2016). However, target cost improvement plans are designed to meet targets formulated at political levels (Storkholm et al., 2017), and service redesign is often lim-ited to service line selections (Chapman et al., 2016). More sophisticated service redesign ap-proaches require micro-costing of clinical condition-specific processes, a requirement often regarded as heavily resource intensive, making it impractical for costing all resources in care delivery (Drummond, 2005, Barnett, 2009).
This prioritization on reporting manifests itself in practice. Controllers in hospitals focus a large proportion of their work time on reporting, and cost-accounting infrastructures are largely de-signed for reporting purposes. For internal financial decision making, hospitals commonly use volume-based cost-accounting systems, where resources are allocated to care delivery based on volumes of services delivered (Heider and Mang, 2020). Volume-based cost estimates are practical for budgetary purposes, but these estimates are not relevant to providers for clinical decision making, as they lack the information needed to understand the economic conse-quences of the decisions they make. Instead, the only response providers can make to optimize

8
their performance is to adjust their existing approach to care to accommodate changes in budget. While it may seem that policy makers are to blame for putting undue pressure on pro-viders, they are nevertheless compelled to incentivize providers because they are responsible for taking whatever action necessary to understand and control the cost of care.
A core principle in management is that you cannot improve what you haven not measured. Traditional volume-based cost accounting infrastructures do not measure where costs are in-curred in the treatment of patient clinical conditions, but instead distribute costs equally among volumes of cost-relevant services delivered. Condition-specific micro-costing approaches have been demonstrated to be well-suited for the complexity of health care (Kaplan and Porter, 2011, Hennrikus et al., 2012), and are the best costing approaches for informing service redesign and process improvement (Heider and Mang, 2020). Some national health care systems have some-times implemented standardized cost-accounting principles to guide providers in costing care processes associated with clinical conditions (Busse et al., 2013). Since diagnostic related grouping (DRG) reimbursement systems were established in the 1980s, these principles were often designed to cost condition-specific care processes in hospitals (Busse et al., 2013). DRG-based reimbursement was designed to cover a set cost per DRG. Cost estimates were developed from aggregating the results of DRG-specific micro-costing studies within hospitals (Busse et al., 2013). Activity-Based Costing (ABC) has become the most common approach (Busse et al., 2013). ABC adopts a micro-costing approach to cost-accounting that uses carefully selected cost drivers to drive resources or resource pools to activities involved in care delivery. How-ever, as a micro-costing approach, providers found ABC to be resource intensive and difficult to update, resulting in inconsistent application of this method (Kaplan and Anderson, 2004, Kaplan and Anderson, 2007, Udpa, 1996).
A landmark publication has claimed that a better solution lies in putting providers at the fore-front by having them execute a simple-to-apply micro-costing approach that crosses organiza-tional boundaries, allowing them to cost the entire care pathway of specific chronic conditions (Kaplan and Porter, 2011). The approach, called Time-Driven Activity-Based Costing (TDABC), brings together micro-costing and integrated care in order to facilitate a solution to the cost crisis.
3.2 TIME-DRIVEN ACTIVITY-BASED COSTING
TDABC, developed from outside the health care industry, was designed to overcome the limi-tations of ABC. TDABC is supposed to be less resource intensive and easier to apply because it only requires two parameters: 1) The annual cost of resources involved in care delivery, and 2) The amount of time those resources are available for use each year (Kaplan and Anderson, 2004, Kaplan and Anderson, 2007). The method was introduced to health care systems as the cost component of value within the Value Based Health Care (VBHC) framework, where value is defined as health outcomes achieved per unit cost (Kaplan and Porter, 2011, Porter and Teisberg, 2006). In order to appropriately capture health care costs, a health care-specific seven-step approach to TDABC was developed (Kaplan and Porter, 2011).

9
Step 1: Select the medical condition.
Step 2: Define the care delivery value chain. Step 3: Develop process maps of each activity in patient care delivery. Step 4: Obtain time estimates for each process. Step 5: Estimate the cost of supplying patient care resources. Step 6: Estimate the capacity of each resource, and calculate the capacity cost rate. Step 7. Calculate the total cost of patient care.
Selecting the medical condition is not as simple as identifying a condition by name, but calls for a broad and integrated definition:
An interrelated set of patient circumstances that are best addressed in a coordinated way and should be broadly defined to include common complications and comorbidities. [… ] For each condition, we define the beginning and end of the patient care cycle. For chronic conditions, we choose a care cycle for a period of time, such as a year. (Kaplan and Porter, 2011)
In the second step, the Care Delivery Value Chain (CDVC) is the condition-specific care path-way, charting all activities involved in the treatment of the selected condition. The capacity of a resource is the amount of time the resource is available for care delivery during a year. De-termining the capacity involves three steps:
1. Obtain the number of days available for care in a year. 2. Estimate how many hours the resource is available for care each day. 3. Estimate how many hours the resource is occupied for non-care related activities each
day.
From these estimates the practical capacity is calculated, which is the number of hours the resource is available for care each year. With human resources, for example, non-care related activities include education, breaks, training, and administrative meetings. The Capacity Cost Rate (CCR) is the cost of a resource per unit time, or cost per minute, and is calculated by dividing a resource’s annual capacity by its annual cost. In the final step to calculate the total cost of care, the CCR for each resource is multiplied by the total amount of time it is used in each condition-specific process. The originators of VBHC explicitly emphasized that providers should not be held accountable for adherence to CDVC processes, because both provider or-ganizations and patients are far too unique and care too complex to micromanage (Porter and Teisberg, 2006). This is based on strong evidence that under DRG-based reimbursement, pro-viders reacted with unanticipated behavior changes, resulting in early hospital discharges and a lack of accountability for complications and readmissions (Mihailovic et al., 2016). The VBHC framework adopts a bundled payment-based reimbursement system, but where provid-ers are reimbursed for bundled costs across the care cycle from first contact up until follow-up for a given medical condition, including co-morbidities and complications (Kaplan and Porter, 2011, Porter and Teisberg, 2006). These fixed bundled payments are reimbursed for specific conditions and facilitate competition among providers to deliver the specified outcomes at the lowest cost (Porter and Teisberg, 2006). The siloed nature of the health care system together

10
with a high prevalence of MCC patients presents a challenge to VBHC and the bundled pay-ment reimbursement system.
3.3 THE CHALLENGE OF COSTING CARE FOR PATIENTS WITH MULTIPLE CHRONIC CONDITIONS IN A REDUCTIONIST HEALTH CARE SYSTEM
The health care system of the 20th century firmly adopts a reductionist-based care delivery approach, providing single treatments for single conditions with a single cause (OECD, 2011). Health care systems have a moral responsibility to adapt their approach to match the needs of 21st century patients, and 50% of the disease burden is caused by MCC patients. Within these current reductionist systems, patients experience uncoordinated, redundant, fragmented and impromptu care (OECD, 2011, Fortin et al., 2007) that compromises quality and outcomes (Wolff et al., 2002). It is widely accepted that a more integrated approach to care delivery is required to meet the needs of today’s patients, and the OECD suggested the first step is to break with traditional approaches and instead organize care around categories of MCC patients (OECD, 2011).
While VBHC calls for an integrated cross-boundary approach to care delivery, it has struggled to overcome these challenges. The fragmented nature of care has obstructed providers from adopting costing infrastructures, such as TDABC, that span the entire CDVC in order to inform bundled payment systems (Maddox and Epstein, 2018). The VBHC literature does not explain how to practically generate CDVCs for MCC patients in order to cost processes. This is because the care pathways for MCC patients are incoherent with no discernibly interrelated health care patterns or activities (Haggerty, 2012), rendering the pathways impossible to standardize. Inte-grated care models offer insights into how to conceptualize these pathways.
3.4 INTEGRATED CARE
Integrated care serves as the shift from reductionist care to health care delivery with a systems approach, and is designed to develop efficiency and coordination throughout the care pathway (OECD, 2011, WHO., 2016). Seated as the gate-keepers at the point of contact, general prac-titioners are strong candidates for managing integrated care models (OECD, 2011, de Bruin et al., 2012). The chronic care model originally designed by Edward Wagner (Boehmer et al., 2018, Coleman et al., 2009) and the medical home model (de Bruin et al., 2012) are the two core integrated care models that allow general practitioners to coordinate care delivery for chronically ill patients. These integrated care models are generally designed to treat patients with a specific chronic condition, but have been used more and more treat MCC patients (Boult et al., 2009, Boyd and Fortin, 2010, Versnel et al., 2011). These integrated care models however have not been demonstrated to lead to the desired health care improvements, given the limited and contradictory evidence regarding MCC patients (de Bruin et al., 2012, Boehmer et al., 2018).

11
A third health care model, the Integrated Practice Unit (IPU), is introduced within the VBHC framework and is defined in the context of secondary and tertiary care centers as:
organized around the patient and providing the full cycle of care for a medical condi-tion, including patient education, engagement and follow up and encompass inpatient, outpatient and rehabilitative care as well as supporting services. (Porter and Teisberg, 2006)
IPUs are not always developed around patients with multiple chronic conditions (van Harten, 2018). To reinforce the multidisciplinary focus of this thesis, IPUs designed to treat MCC pa-tients will be referred to as Integrated Multidisciplinary Care (IMD-Care) centers. While evi-dence is beginning to emerge that IMD-Care centers lead to improved patient experience, quality of care, and outcomes (Epstein, 2014, Even et al., 2019, Vare et al., 2016, Weber et al., 2012), the best method to cost care pathways for these patients remains to be demonstrated.

12

13
4 AIM The aim of this thesis is to explore how time-driven activity-based costing can be applied to capture and compare the cost of care processes for patients with multiple chronic conditions, with specific emphasis on medical specialty-focused versus integrated care models.
This wider aim is achieved through four individual studies with specific objectives to:
1) Study I: explore the existing literature base to unpack and learn from previous applications of time-driven activity-based costing in health care.
2) Study II: explore the initial effects of integrated multidisciplinary care on total care utilization patterns of patients with multiple chronic conditions.
3) Study III: explore how TDABC can be applied to cost care in an integrated multidisciplinary care center customized to cost care for patients with multiple chronic conditions.
4) Study IV: apply the new customized time-driven activity-based costing approach to evaluate an integrated multidisciplinary care center in comparison to traditional care models.

14

15
5 METHODS 5.1 PHILOSOPHIC RESEARCH FOUNDATIONS
Before detailing the methods of the research design and methodology of the thesis, it is im-portant that the philosophical foundations of this research be explained. As objective and fac-tual as our culture may perceive scientific research to be, science is a social construction and therefore bound by the instability inherent to all social constructions. Several paradigms have emerged that characterize the philosophical underpinning of how we understand and approach scientific research; a researcher will unavoidably adopt one of these paradigms. Preferred prac-tice is for researchers to take a position and explain the philosophical foundations of their praxis, because this will influence the interpretation and use of the knowledge generated.
The relevant branches of philosophy through which researchers discuss the philosophy of sci-entific research are epistemology and a subbranch of metaphysics called ontology. Ontology is the study of what exists, and how entities within reality are related and categorized. Epistemol-ogy is the study of knowledge, i.e. the depiction of what is known, and the processes of justifi-cation through which knowledge is established (Healy and Perry, 2000). The ways in which we look at the world and understand and perceive reality as individuals, or our ontological beliefs, has an impact on how we approach scientific inquiry and research – our epistemological approach. Most discussions of philosophy of science in research center around two metaphys-ical ways of understanding reality. The classical view holds that the world exists independently of those who observe it, and the objects within the world take the center stage of scientific inquiry. The modern view holds that the world and its contents exist inside the consciousness of the observer, which becomes the subject of investigation in scientific inquiry (Guba and Lincoln, 1994). These two views create a spectrum on which a dizzying set of defined terms fall, and it can be difficult to pull the relevant pieces out of the rabbit hole without falling in.
Researchers often associate positivism, realism, objectivism, and quantitative methodology with a classical metaphysical view of reality. Realism is an ontological belief holding that re-ality exists independent of conscious individuals perceiving that reality, that reality is governed by set of fixed rules and laws, and that reality can be studied without interference from the mind (Healy and Perry, 2000). Objectivism is an epistemological approach that prioritizes min-imal interaction with the reality under study, so that subjects under study react to interventions as they would if the researchers were not present (Healy and Perry, 2000). Positivism is a phil-osophical paradigm that adopts a realist and objectivist approach to scientific inquiry, and often uses a quantitative methodology. Positivism is historically the dominant paradigm in modern scientific philosophy and is often associated with tightly controlled and replicable quantitative methods, which allow for reproducible results. The Randomized Controlled Trial (RCT) serves as the strongest source of evidence in positivism. Positivism has been criticized for developing scientific findings that are not relevant for reality, because the research is performed under such sterile conditions that the findings cannot be reproduced in practice.

16
On the modern metaphysical spectrum of how reality is understood, lies interpretivism, social constructivism, idealism, relativism, subjectivism, and qualitative methods. Idealism is an on-tological world view, holding that reality exists within the mind of the observer and is therefore unstable and takes multiple forms (Healy and Perry, 2000). Subjectivism is an epistemological approach that acknowledges that the subjects of research are influenced by researchers and vice versa, and that researchers and subjects affect reality together through the research process. Relativism, interpretivism, and constructivism are all philosophical paradigms that adopt an idealist and subjectivist approach to scientific inquiry. These paradigms have their differences, but they are often associated with explorative qualitative methods, sociological research, and anthropology. Interestingly, Auguste Comte, who created the positivist ideology, was also the founder of the field of sociology. Interpretivist research is often criticized because the findings are either too theoretical to be practically applied, or because they are too context-specific to be generalized to other contexts.
Post-positivism, perhaps the most prevalent currently, is a positivist paradigm that adopts a realist ontology but acknowledges the interference of human nature and consciousness in the objectivity of the scientific process. Critical realism is a form of post-positivism, and is the paradigm adopted for this thesis. From the ontological point of view of a critical realist, there may be a single independent reality, but perception of any component of that reality will never be complete, because perception and reality are fundamentally separate (Bhaskar, 2013). Fur-ther, the critical realist separates the study of conscious individuals from that of the physical world they experience. This worldview allows for objectivism and subjectivism to be integrated in the practice of research. Critical realism thus gives us a philosophy to be applied in real-world practice within human institutions (Bhaskar, 2013), and thus a philosophy upon which we can act, making it ideal for this PhD thesis.
5.2 SETTING
This research was performed in real-world practice within a human institution. Studies II to IV were conducted within the context of an IMD-Care center for patients who concomitantly ex-perience heart disease, kidney disease, and diabetes (Spaak, 2015, Porter and Lee, 2013). The clinic is often referred to as the HND Center, where “HND” stands for Heart, Nephrology, and Diabetes. The HND Center was established in November of 2013 at a university affiliated ter-tiary teaching hospital in Stockholm, Sweden. The hospital, one of the largest emergency hos-pitals in Sweden, offers education and conducts research activities in many clinical specialty areas, and is one of the three teaching hospitals associated with Karolinska Institutet. The hos-pital has around 4,000 employees and treated 90,000 emergency patients in 2018.
The goal of the HND Center was to provide integrated multidisciplinary patient-centered care in a way designed to reduce the number of referrals, primary care visits, planned hospital

17
Figure 1: Workflow summary of the HND Center
visits, and acute unplanned hospital visits. The approach to achieve these reductions was to optimize care for HND patients by eliminating unnecessary care, improving the quality of care, and lowering the cost of treatment.
The HND Center is the showcase interdisciplinary care center at a Swedish hospital and is run by a consultant cardiologist. The Center is an outpatient clinic and operates during normal working hours. The care team includes doctors from the involved specialties, nurses, and un-dersköterska (USKs). USKs are similar to the positions of licensed practical nurses in the United States, or Health Care Assistants in the United Kingdom. The team is supported by physiotherapists, dietitians, part-time nurses who specialize in relevant care, and six physicians on a rotating schedule. The physicians include two specialists from each of the three disciplines.
The HND care team adopts a person-centered care approach, delivers outpatient care at the HND Center, and coordinates the remainder of care delivered to HND patients outside the center. As opposed to traditional care delivered in three separate locations, the HND Center

18
follows a patient-centered care design and coordinates all care delivery from a single location. The care process, shown in Figure 1, begins with a new visit to get acquainted with the patient and their circumstances. This is followed by a team conference with the clinical team – includ-ing specialists in cardiology, nephrology, and endocrinology – to discuss the patient’s circum-stances and draft a health plan. This health plan is discussed and formulated together with the patient during the following team visit. The plan is executed utilizing an iterative and adaptable series of follow-ups and evaluations, both in person and over the phone. The nurses have the necessary knowledge to allow delegation for them to adjust medications, titrate heart failure medications, and follow up life-style interventions to a large extent over the phone.
5.3 THE HND RANDOMIZED CONTROLLED TRIAL: CAREHND
This thesis draws from an ongoing RCT (RCT; CareHND). The RCT was designed to investi-gate the impact of the HND Center on costs and outcomes. Patients were recruited to the RCT and randomized to receive either traditional or HND Center care if they met the following clinical criteria specified by a multidisciplinary team of clinical consultants (Spaak, 2015):
1. Established cardiovascular disease, indicated by a history of hospitalization following angina, acute coronary syndrome, or heart failure.
2. Diagnosis of diabetes mellitus type 1 or 2. 3. Established kidney disease, defined as an estimated glomerular filtration
rate level less than 60 mL/min/m2, or borderline glomerular filtration rate levels and macroalbuminuria.
5.4 OVERVIEW OF THE STUDIES
This thesis is comprised of the four studies outlined in Table 1. Study I was a systematic liter-ature review used to establish a firm understanding of the TDABC costing methodology and how it has been applied in the health care context. Using the randomization of the RCT, Study II characterized the care experience of HND patients and provided an initial care utilization comparison of HND and traditional care processes. Study III drew from the findings of Studies I and II to explore how to apply TDABC to cost care for HND patients, and Study IV used the methodology established in Study III to compare the costs of the HND Center to that of tradi-tional care.

19
Table 1: Overview of the studies
I II* III* IV*
Aim To explore why TDABC has been
applied in health care, how its application
reflects a seven-step method developed
specifically for VBHC, and implications for
the future use of TDABC
To explore the initial effects of integrated multidisciplinary care
on total care utilization patterns of patients with multiple chronic
conditions
To explore how TDABC can be
applied to cost care in an integrated multidisciplinary
care center customized to cost care for patients
with multiple chronic conditions
To apply the new customized time-driven activity-based costing approach to evaluate
an integrated multidisciplinary care
center in comparison to traditional care models
Research de-sign
A systematic review following the PRISMA
statement
Statistical comparison of care utilization vari-
ables
TDABC costing analysis
TDBAC cost compari-son
Data-collec-tion
Systematic search of eight databases,
exclusion of articles according to
pre-defined criteria
Data were collected from Stockholm Re-gion’s administrative health care database,
called the VAL database
Triangulation of multiple data
sources: contextual observations, + hos-pital admin. data + electronic health
records
Triangulation of multiple data sources:
contextual observations, + hospital
admin. data + electronic health
records
Data-analysis Qualitative content analysis to compare
applications and describe the
adherence to a theoretical model
(TDABC seven steps)
Wilcox Ranked Sum tests for comparison
of care utilization variables
Guided by the seven-step
approach to TDABC applications in
health care
According to the modi-fied seven-step ap-proach to TDABC
applications developed in study III
*Based on the ongoing CareHND RCT
5.5 STUDY I
5.5.1 Study design
The first study was a systematic review of the literature designed to assess why TDABC has been applied in health care organizations, the degree to which these applications reflect the seven-step approach developed specifically for VBHC, and what lessons can be taken for future applications of TDABC in health care. Literature search and selection was guided by the Pre-ferred Reporting Items for Systematic reviews and Meta-Analyses (PRISMA) statement (Moher et al., 2009), and selected articles were analyzed using qualitative content analysis (Graneheim and Lundman, 2004, Hsieh and Shannon, 2005).
5.5.2 Data collection
The data collected for analysis in this study was the content of the articles identified within the review. A search strategy was developed for each of seven major databases, where all word formulations of the phrase “Time-Driven Activity-Based Costing” were included. The seven databases, and the corresponding search strategies used are presented in Appendix 1. Articles were reviewed that met a set of inclusion criteria. First, articles were identified that included some formulation of the phrase “TDABC” in the title or abstract. Second, abstracts were

20
screened, and papers were only included if the topic was specific to the health care field. Fi-nally, following full text reads of the remaining articles, articles were selected for analysis if they discussed or described an empirical application of TDABC in practice. A PRISMA flow diagram is provided in Figure 2.
5.5.3 Data analysis
The general study characteristics of selected articles were extracted, including publication year, the country in which the study was performed, the medical specialty involved in the cost anal-ysis, and the type of health care organization in which the study was performed.
Each article was then analyzed through two phases of content analysis (Graneheim and Lundman, 2004, Hsieh and Shannon, 2005), both performed using NVivo qualitative data anal-ysis software; QSR International Pty Ltd. Version 10, 2012. First, an inductive analysis was performed on data identified and extracted from the articles that described strengths, weak-nesses, and the rationales for choosing to use TDABC for their analysis. The content was grouped to identify common specific themes and insights about how TDABC should or should not be applied. The second phase of the content analysis was deductive and aimed to describe how well each application adhered to the seven-step health-care-specific approach to TDABC. An analysis template was constructed in NVivo where article content relating to each step could be identified and linked to each of the seven steps.
5.6 STUDY II
5.6.1 Study design
This was a quantitative study of an ongoing RCT that compared the initial effects of an IMD-Care center on care-utilization patterns of MCC patients, specifically HND patients.
5.6.2 Data collection
Data were obtained from the VAL database, a Stockholm Regional database that collects elec-tronic health records (EHR) and other administrative data from provider organizations through-out the region. At the time of this study, 110 patients had been recruited to the RCT. Data were collected for these 110 HND patients from January 2008 to April 2018, including demographic, diagnostic, and care-utilization data. Care-utilization data included the occurrence of inpatient, outpatient, primary care, planned, and unplanned visits, as well as the length of stay for each inpatient visit.
5.6.3 Data analysis
Wilcoxon Ranked Sum Tests were used to compare a set of care-utilization frequency-of-event variables, including inpatient visits, Emergency Department (ED) visits, and primary care visits among others. A non-parametric test was required because frequency data often take on a Pois-son distribution shape, which is heavily skewed right, violating the assumption of normality.

21
Given that patients were recruited slowly over time, their care utilization patterns needed to be normalized around time zero of the intervention. Therefore, all event time parameters were adjusted to represent the time elapsed between exposure to the treatment arm, and the occur-rence of the event. Further, many of these patients were recently recruited up to a few months before the time of this analysis. Therefore, there was a limited availability of prospective data from some patients, and a 6-month cut-off time period was used. All patients providing less than six months of data were excluded from the analysis. This cut-off included a mortality adjustment, where patients who died before providing six months of data were also excluded. After these adjustments, 77 of the 110 patients remained for analysis: 35 in the control arm and 42 in the intervention arm.
Charlson Comorbidity Index (CCI) (Charlson et al., 2008, Charlson et al., 1987) scores were calculated using International Classification of Diseases codes from the diagnostic data. These scores were used to acknowledge the level of morbidity within each RCT arm when performing the statistical comparisons.
5.7 STUDY III
5.7.1 Study design
This study was a cost analysis that explored how TDABC can be applied to cost care for MCC patients, specifically HND patients. Multiple methods were used for both data collection and analysis, which were guided by a version of the health care-specific seven-step approach to TDABC modified specifically for MCC patients.
5.7.2 Data collection and analysis
5.7.2.1 Select the medical condition (Step 1)
HND patients were defined according to the inclusion criteria for the RCT previously described in section 5.3. Patient recruitment to the HND Center is ongoing and began in early 2014. In order to allow the processes at the HND Center to stabilize, the first few hundred patients who received HND care were not included in the RCT. Recruitment to the RCT began after Health Care Professionals (HCP) became comfortable with routines and felt that HND Center pro-cesses were stable. For this study, data was collected for the 314 HND patients that had been receiving HND care by the end of the 2017 year. Most of these patients were not recruited to the RCT, but HND processes had long since stabilized and those patients not recruited to the RCT had been using HND services for a few years.
5.7.2.2 Define the CDVC (modified step 2)
This is where the major modification of the seven-step approach needed to be made to fit the specifics of the HND context. According to the seven-step approach, CDVCs are to be estab-lished for the entire cycle of care (Kaplan and Porter, 2011). For patients with chronic condi-tions, where the condition is continuous, a time-period of one year should be set (Kaplan and Porter, 2011). MCC patients, however, experience highly variable care processes. For HND

22
patients, no standardized care processes have been defined. In fact, there is such a degree of variation that it becomes extremely difficult to identify or visualize patterns. Therefore, it is currently not possible to define a year-long CDVC to treat these patients. Instead, we identified those activities that were performed over one year and averaged their frequencies, disregarding their sequence.
The CDVC was defined as all activities performed over a single year of care but was limited to those activities performed at the HND Center. The CDVC was depicted using the annual average frequencies of HND care delivery activities. Activity frequencies were obtained from two separate systems for comparison and validation purposes, from the medical records and from the scheduling system. Both data sets were cleaned in R Statistical software (R Core Team, 2019) and analyzed to produce annual frequencies of all activities performed at the HND Center.
5.7.2.3 Develop process maps and estimate the time of activities (steps 3 and 4)
Process maps were generated over a series of development and validation steps together with researchers and staff. First, staff presented HND process maps as they existed within hospital systems. Based on the findings from the literature review, these maps were deemed unusable for TDABC purposes, and new maps were to be developed from scratch. Observational data were collected over a series of 10 days by three researchers using hand-held electronic data collection programs on smartphones. Each observed event was populated with a list of param-eters including the activity type, location, and the duration of HCP’s involvement in each ac-tivity. Data were uploaded to a cloud database and analyzed in R Statistical Software (R Core Team, 2019) to generate process maps in tabular form. These tabular maps were transferred onto flip chart paper and Post-it® notes and presented to HND HCPs in stages. HCPs were first shown the activities involved in a process map and were asked to add or remove activities so that the maps would more accurately reflect their care delivery routines. They were then asked to estimate the duration of the time they spent on each step in the process. Afterwards, time estimates developed from observational data were revealed. The differences were discussed, and a final process map was agreed upon. This was repeated for each type of activity performed at the HND Center.
5.7.2.4 Estimate the cost of resources (step 5)
Resource costs were estimated from two managerial accounting Microsoft Excel (Office 365) workbooks provided by hospital controllers. The first workbook provided accounting and ca-pacity data for HCPs working at the HND Center, which included sick leave, bonuses, vacation pay, overtime, and education-based pay. Social insurance costs were applied according to Swe-dish standards at a rate of 47% of base salary. The second workbook provided costs generated in the hospital’s chart of accounts by HND patients. Costs included in the chart of accounts beyond HCP costs were facilities space, lab, radiology, and pharmaceuticals.

23
Pharmaceutical and facilities space costs were calculated by developing a standard outpatient fixed cost per visit for the entire Cardiology clinic and driven to each care delivery center (in-cluding the HND Center) according to the number of outpatient visits performed at that center. Radiology and lab costs were charged directly to the HND care center when ordered.
For this analysis, HCP resources were driven to activities using the amount of time they spent within each activity. Pharmaceutical, lab, and radiology costs were distributed among physi-cian and team visits, because they are prescribed and ordered by physicians. Facilities space were allocated to visits on a per-square-meter-per-minute basis.
5.7.2.5 Estimate the capacity and capacity cost rates of resources (step 6)
The first workbook provided by hospital staff also included capacity data for all HCPs working at the HND Center. The capacity data was provided as the number of Full-Time Equivalents (FTEs) of each HCP type working during a single year at the HND Center. The workbook included all theoretical capacity figures, including care delivery hours, sick leave, paid leave, parental leave, and teaching work. These figures, with the exception of care-delivery time, were aggregated for all HCP types, and therefore a single practical capacity adjustment figure was used to adjust down all FTEs to estimate the time used simply for care delivery. Further, ca-pacity data were not provided for physicians, but HND HCPs made it clear that one physician FTE was present each day of operation of the HND Center.
Given the capacity-related challenges identified in the first workbook, researchers together with HCPs decided to manually process the calendar data for the 2018 year to obtain another capac-ity estimate for validation and comparison purposes with the workbook. Each day of the cal-endar was reviewed for the HND Center in the 2018 year, and the number of hours of each HCP type was manually counted. This data could not be extracted and processed using com-puter software, as hospital systems did not allow for this functionality. Therefore, data were manually entered into a Microsoft Excel (Office 365) file for processing.
After obtaining capacity estimates for each HCP type, the annual costs obtained in step five were used to estimate the cost per minute, or the CCR, for each resource.
5.7.2.6 Estimate the total cost of care (step 7)
The final step of this analysis was to calculate the total cost of HND care. The CCRs for each resource were multiplied by their corresponding duration-estimates for each activity performed at the HND Center. Other costs were driven to activities as described in Step 5, and the total cost of each activity was estimated. These costs were multiplied by the annual activity frequen-cies presented in the CDVC, and the sum of the total annual costs of each activity was used as the estimated total cost of HND care for the 2018 year.

24
5.8 STUDY IV
5.8.1 Study design
The fourth study of this thesis was also a TDABC cost analysis using multiple methods to collect and analyze real world data and aimed to compare the costs and select care utilization outcomes of HND and traditional care processes for HND patients. The comparison used the randomization from the HND RCT, and thus the inclusion criteria were the same. Patients could choose to cross over from one arm to the other arm one year after being included in the RCT. The cost comparison was performed within the 2018 fiscal year, and patients included in this study were those that had been randomized within the RCT during or before 2018, which included 54 patients in the traditional care arm and 65 in the HND care arm.
5.8.2 Data collection and analysis
5.8.2.1 TDABC costing
The data pulled from the RCT included the patient’s ID number, the arm to which each patient was randomized, the date of inclusion in the study, and if they patient had died, the date of death. Beyond the patient information, data was collected to complete the modified seven-step TDABC cost analysis of traditional and HND care processes in 2018. Data were also collected on key care utilization variables including emergency room visits, inpatient visits, hospital days, and primary care visits.
For the first step of the seven-step approach, the condition was defined according to the inclu-sion criteria for patients recruited to the HND RCT.
In Study III of this thesis, the CDVCs of HND care processes were collected from the HND Center’s calendar system. This was appropriate because Study III included all patients who had been exposed to HND care. Study IV only analyzed patients randomized to the RCT, and there-fore the scheduling system was not appropriate as it could not be filtered to include only ran-domized patients. Therefore, the patient journals were accessed to collect CDVC data. Patient journal data could be viewed digitally in tabular form but could not be downloaded or copied into a data table. Therefore, the author together with Gudrun Even, a fellow doctoral student, manually counted clinical event data for each randomized patient for the entire 2018 year. The activity data recorded for each clinical event included the type of visit, the patient’s ID, the visit date, and the visit location. Data for each patient included the patient’s ID, mortality data, date of inclusion in the RCT, date of ability to crossover, and the decision to crossover.
As the CDVC data was collected, key care utilization variables outside the defined CDVC were also counted. The number of primary care visits, inpatient visits, inpatient days, and emergency room visits were also recorded for each patient. The patient ID and date associated with each visit was recorded.
Through discussions with HND health care professionals, it was known that the first year of HND care could be care intensive in order to stabilize care processes for HND patients newly

25
recruited to the (R Core Team, 2019)center. Therefore, a set of six CDVCs were defined: first year HND patients, first year traditional care patients, second year HND patients, second year traditional care patients, HND patients that crossed over to traditional care, and traditional care patients that crossed over to HND care.
Process data were collected according to the same approach established in the second study. However, because processes were to be observed outside the HND Center in the kidney and cardiology outpatient wards, it was important that they were performed by a hospital employee. Gudrun Even was not only a fellow doctoral student in the HND initiative but also a nurse at the hospital. She collected all observational data used to construct process maps for each visit occurring in the different CDVCs. As in the second study, she used a hand-held mobile data collection device to collect data and upload it to a secure data cloud. She recorded 163 obser-vations at the HND Center, 284 observations at the nephrology ward, and 250 at the cardiology ward. These data were used to construct process maps which, as in Study III, were validated with HND HCPs.
Hospital controllers provided financial data for the HND Center, the nephrology outpatient center, and the cardiology outpatient center. The same procedures used to analyze costs at the HND Center in Study III, in 2018, were applied at each individual center in 2018. The same Excel Workbooks provided in 2017 for the HND Center were provided for each of the three settings for the 2018 year. Capacity and cost data again included sick leave, bonuses, vacation pay, overtime, and education-based pay. Social insurance cost was again applied at a rate of 47% of base salary. Non-staff costs including facilities, pharmaceuticals, radiology, and lab costs were all applied to clinical activities using appropriate cost drivers.
One key difference in this study as compared to Study III, was that HND patients only com-prised of a fraction of the care delivered at each setting. Many of the patients treated at the cardiology center and the nephrology center were not HND patients. Even at the HND Center, many of the patients treated were not recruited to the RCT. Therefore, non-staff cost resource pools could not be driven according to manually counted visit frequencies within the CDVCs. To estimate appropriate cost drivers, the Qlikview EHR data was used to obtain rough estimates of all visit frequencies in each of the three locations. The proportion of visits counted within the CDVCs for randomized patients in each of the three settings, as compared to the total num-ber of visits that occurred in each of the three settings, was used to drive non-staff costs to activities.
HCP FTE estimates at each of the three settings were again obtained by Microsoft Excel (Office 365) workbooks provided by controllers. Practical capacity estimates were made, again after accounting for sick leave, paid leave, parental leave, and teaching work. Capacity estimates for HCPs were again manually obtained from the calendar data in each setting. Gudrun Even was granted access to the scheduling systems in each of the three settings. To estimate the capacity cost rates for each HCP type in each setting, their respective annual costs were divided by their annual capacities.

26
In the final step of the costing analysis, all non-staff costs were driven to activities and the HCP CCRs were applied to their respective working durations in each activity. The frequency of each activity in each CDVC was multiplied by its corresponding cost to estimate the total cost of each CDVC for the 2018 year.
5.8.2.2 The cost comparison of HND and traditional care
Statistical analyses were performed to compare the cost of HND Center care processes to those of traditional care. First the TDABC total cost estimate of each CDVC was divided by the total number of days patients were exposed to each CDVC, in order to estimate the cost of care per patient-day of exposure. These figures were extrapolated out to a year to estimate the cost per year of treatment for a specific CDVC.
General linear models (GLM) were used to compare care utilization variables between HND and traditional care. Event based data is skewed right, occasionally without equal variance, and occasionally zero-inflated. An appropriate GLM was identified for each care utilization varia-ble: ED visits, inpatient visits, hospital days, and primary care visits. If a dataset had equal variance and no zero inflation, a Poisson regression model was used for the comparison. If there was no-equal variance and no zero inflation, a negative binomial model was used. Finally, in the case of unequal variance and zero inflation, a hurdle model was used for the comparison. The four GLMs were used to test for statistically significant differences in the mean frequencies of care utilization variables occurring per year during exposure to different CDVCs. This was done through exponentiating the model coefficients to obtain the odds ratios specific to each care utilization variable.
Cost estimates were obtained for Region Stockholm for a single occurrence of each of the four care utilization variables. Statistically significant differences in annual care utilization frequen-cies were converted to monetary cost differences. The annual cost of care obtained from the TDABC analysis was combined with the added cost of each of the care utilization variables for each of the CDVCs. The comparison of these total costs represented to cost differences between each CDVC, including the cost of the four selected care utilization variables.
5.9 ETHICAL CONSIDERATIONS
Both the Personal Data Act and the Ethical Review Act apply to this research project because data involving human subjects is collected. Clear guidelines and an ethical review process are available to ensure that issues of informed consent and personal data protection are considered and handled appropriately.
This research was careful to maintain ethical rigor throughout the research process, and care-fully adhered to established ethical guidelines, principles, and standards. All studies within this thesis were approved by the Regional Ethical Review Board in Stockholm, Sweden through two overlapping ethical approval committees (diary numbers: 2014/384-31/1412 and 2017/999-31/2).

27
All patients included in the HND RCT provided consent for this research, and all patients were given the opportunity to withdraw from the research at any point. The written informed consent document is stored within the patient’s medical record at the hospital. In the event of a data withdraw, all data specific to that particular patient would have been removed. No patient re-quested to be withdrawn from the study. All patient data was collected by hand (never emailed, faxed, or mailed) and was coded using conditional random fields (CRF). All data collected from the hospital was done so following the establishment of a signed data-sharing contract between the hospital and the research institution. All personal sensitive data extracted from the hospital was encrypted and stored on secure servers at the research institution. The CRF model remains on site, and data was brought to the CRF for compilation and processing when neces-sary.
The demonstration of objective and appropriate handling of informed consent and sensitive information is easily documented using established and accepted practices. However, for some other ethical considerations, reflection on and demonstration of the correct course of action becomes less objectively clear. It is also important to consider other ethical implications that are not as clear as ethical recommendations and guidelines. This research is grounded in an empirical real-world setting, which surfaces two ethical issues.
First, the collection of financial and human resource data is sensitive information for the or-ganization and its employees. The hospital was open to sharing such information with the re-search group because the project was collaborative, and part of our objective was to support the hospital in understanding the cost of HND patient care processes. The physician employed by the hospital who leads the HND initiative is a member of the research group, and, through him, the group established a strong relationship of trust with the organization. All submitted manuscripts were reviewed by hospital staff prior to submission, and hospital staff were closely involved in each step of the research process. Routine contact was maintained with clinical staff on the floor, economic staff in the administrative department, and managerial staff at the hospital. Consensus among the research group was established around all information sharing decisions.
Second, the results of this project may influence the decisions of providers and managers at the hospital, and possibly other hospitals. Therefore, it is crucial that data collection, analysis, and reporting are conducted with care and attention to detail, using established methods, and are presented in a fair and objective way that acknowledges limitations. Further, it is important that we as researchers remind management, and other decision makers, that our findings should be presented and inferred cautiously and objectively. Specifically, that costs are not the only com-ponent of decisions around care delivery, and estimations may change over time and between contexts. The cost implications emerging from this study must be considered in combination with quality outcomes to ensure that beneficial care is not abandoned solely based on its ex-pense.


29
6 FINDINGS
6.1 STUDY I
6.1.1 Study selection
After running the search strategies of the seven major databases (Appendix 1), 780 records were identified for review (Figure 2). After removing duplicates and excluding records and articles, 25 articles were selected for analysis that described applications of TDABC in practice. The content of these 25 articles served as the data for analysis in this review.
Figure 2: PRISMA flow diagram of the systematic literature review
An increasing number of studies were conducted over time, and 80% of the articles were con-ducted after 2013. The majority (88%) of these studies were performed in a hospital setting, and 68% were performed in a surgical setting. The remaining studies costing patient care were performed in an outpatient or primary care setting.
Records identified through database
searching(n = 774)
Additional records identified through other sources (official websites of
payer organizations and snowballing)(n = 6)
Records after duplicates removed(n = 525)
Records screened(n = 151)
Records excluded after reading titles & abstracts
(n = 96)
Full-text articles assessed for eligibility
(n = 55)Full-text articles excluded
(n = 30)
Studies included in data analysis(n = 25)
Records excluded because TDABC not mentioned in the title, abstract, or key words
(n = 374)

30
6.1.2 Why TDABC was applied in health care
The articles identified in the review chose to apply TDABC because of its potential contribu-tions to operational improvement and reimbursement policy. More specifically, articles fol-lowed claims in the existing literature base that TDABC was simple to apply, capable of efficiently and accurately capturing the cost of care processes, and managing the complexity of those processes. Many of these claims came from industries outside of health care. This was particularly appealing given the surge of interest in VBHC, which brought to the fore the im-portance of costing care pathways and processes at the level of the medical condition. A Har-vard Business Review article touted the method as ideal for the VBHC framework less than a year before a surge in TDABC health care publications, and 56% of the articles reported the strength of the method associated with the VBHC agenda.
6.1.3 Reported strengths and limitations of TDABC
Articles in the review sometimes reported that TDABC was simple to apply and allowed for self-explanatory cost assignment to care delivery activities through the use of the CCR and time estimates. The method was reported, in 10 of the 25 cases, as a highly accurate approach to costing, which is most-likely attributable to TDABC being a form of micro-costing. Micro-costing is a historically accurate, but work-intensive, approach to costing processes. Almost fifty percent of articles reported that TDABC allowed for better informed quality improvement initiatives, including reduction in wait times, waste, and redundant staff. While no article re-ported cases where TDABC influenced reimbursement schemes, some papers alluded to the method’s potential in this regard.
6.1.4 Observing the applications of TDABC through the lens of the seven-step framework
Interestingly, none of the 25 applications reported a tight adherence to the seven-step health-care-specific approach to TDABC. However, all applications reflected the seven-step approach in some way.
With respect to the first step – selecting the medical condition – a medical condition is defined as an “interrelated set of patient circumstances that are best addressed in a coordinated way and should be broadly defined to include common complications and comorbidities” (Kaplan and Porter, 2011). All but three articles selected care processes that were specific to a medical con-dition or set of medical conditions. Of these condition-related TDABC applications, all were of single procedures or outpatient visits. No article included comorbidities, adverse events or complications, and no article performed an analysis of an entire care pathway or costed care beyond the walls of a single department or clinic.
Defining the CDVC was the most poorly performed of the seven steps in the applications iden-tified in the review. Only two articles charted activities outside of a single process within the patients’ care pathway. These two articles costed the highly standardized care pathways for hip and knee surgery. The remaining twenty condition-specific articles only costed the process of

31
a single clinical activity. This step must be performed if part of the objective is to inform bun-dled payment reimbursement. One article did estimate the cost of a bundle for hip and knee replacements.
All articles except for one mapped at least one care process and time estimates of process steps. Of these, 71% of articles used contextual observations to collect process mapping and time estimate data. Forty-six percent used interviews together with contextual observations. Six studies used team meetings or workshops, and three studies used all three methods to collect process data. Interviews or round-table discussions were sometimes used to validate observa-tional data, and observational data was preferred for longer and more complex activities. In one case, process maps pulled data directly from the hospital’s EHR. The process of collecting data for mapping processes and collecting time estimates was reported to be the most time-consum-ing and difficult step in the application of TDABC, however this was only reported by articles performing contextual observations – four of which reported using only contextual observa-tions. Six articles reported a high likelihood of inaccuracies in the process data collected, which included data entry, reporting errors, difficulties with rare event capture, and the Hawthorne effect.
Most articles in the review reported the collection of personnel costs, and some reported phy-sician costs as difficult to estimate. No article comprehensively developed CCRs for and cap-tured all direct costs. Support center costs are those costs incurred by activities and resources that are not directly involved in patient care, like economy and laundry. Several articles did not include indirect or support center costs, and when included these costs were allocated using a range of approaches. Some articles applied support costs as a fixed percentage of direct costs. Otherwise, indirect and support center costs were generally allocated using a cost driver like square footage or bed days.
While capacity data collection and analysis were reported in all articles, practical capacity ad-justments were applied occasionally and in several different ways. Occasionally practical ca-pacity adjustments were not necessary given the scope and nature of the cost analysis. However, if these analyses had been more thorough and comprehensive, practical capacity ad-justments would have been required. In a few cases, practical capacity adjustments were not made when they were in fact necessary. When included, practical capacity adjustments were more often applied at a flat rate percentage of theoretical capacity.
All articles that estimated the cost of resources also calculated CCRs. Of these, all but two calculated the CCRs of individual resources. The remaining two calculated the CCR for entire processes or for resource pools. One study applied a single CCR for all support center costs and applied them at a per-minute basis to all activities.
All but two articles estimated the total cost of a care process or set of care processes. One article estimated the total cost of a care bundle.

32
6.2 STUDY II
6.2.1 Characterization of HND patients and their care
HND patients were mostly over 65 years old and the majority were male Table 2. Patients typically had over a dozen diagnoses and generally high CCI scores. The minimum number of diagnoses an HND patient experienced was 5, while the maximum was 44. Despite randomi-zation, HND patients in the intervention arm generally had more diagnoses and significantly higher CCI scores. HND patients are high consumers of care, regularly experiencing ten health care encounters each month, both during the years before and the months after the intervention Table 3. During the six months following the randomization, there was no detectable difference in care utilization between the two groups. There was a significant increase in telephone con-sults in the intervention arm, otherwise care utilization remained the same.
Table 2: Baseline demographics and multimorbidity of study groups (intervention compared to control)
Characteristics
Control Arm (traditional)
Intervention Arm (HND)
Number of participants
35 42
Gender Female 11 (31.4%) 7 (16.7%)
Male 24 (68.6%) 35 (83.3%)
Age years mean (Median)
76.26 (75) 74.2 (75)
Participants based on age subgroups (%) 50–59 0 (0 %) 1 (2.38%)
60–69 7 (20%) 9 (21.4%)
70–79 16 (45.7%) 20 (47.6%)
80–89 12 (34.3%) 12 (29%)
Median diagnoses per patient (Range)
14.0 (5–44) 17.0 (5–38)
CCI Score
Median 4.0 5.5
Mean 4.3 5.4
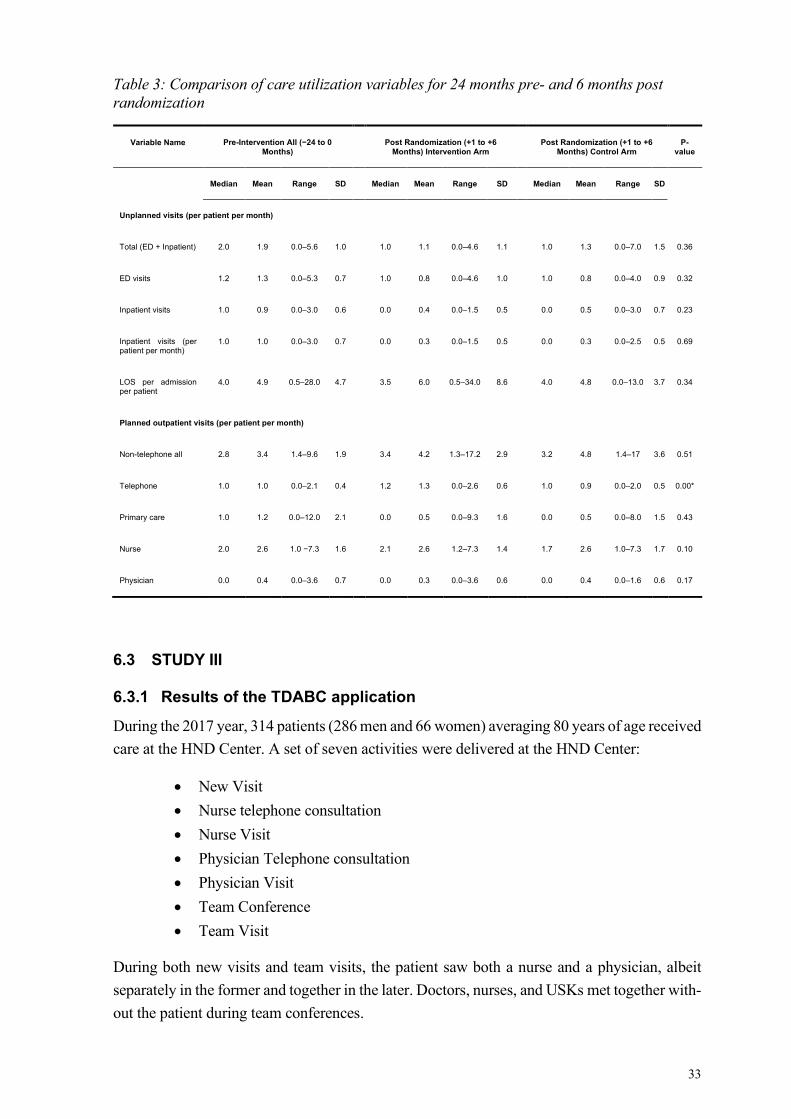
33
Table 3: Comparison of care utilization variables for 24 months pre- and 6 months post randomization
Variable Name Pre-Intervention All (−24 to 0 Months)
Post Randomization (+1 to +6 Months) Intervention Arm
Post Randomization (+1 to +6 Months) Control Arm
P-value
Median Mean Range SD Median Mean Range SD Median Mean Range SD
Unplanned visits (per patient per month)
Total (ED + Inpatient) 2.0 1.9 0.0–5.6 1.0 1.0 1.1 0.0–4.6 1.1 1.0 1.3 0.0–7.0 1.5 0.36
ED visits 1.2 1.3 0.0–5.3 0.7 1.0 0.8 0.0–4.6 1.0 1.0 0.8 0.0–4.0 0.9 0.32
Inpatient visits 1.0 0.9 0.0–3.0 0.6 0.0 0.4 0.0–1.5 0.5 0.0 0.5 0.0–3.0 0.7 0.23
Inpatient visits (per patient per month)
1.0 1.0 0.0–3.0 0.7 0.0 0.3 0.0–1.5 0.5 0.0 0.3 0.0–2.5 0.5 0.69
LOS per admission per patient
4.0 4.9 0.5–28.0 4.7 3.5 6.0 0.5–34.0 8.6 4.0 4.8 0.0–13.0 3.7 0.34
Planned outpatient visits (per patient per month)
Non-telephone all 2.8 3.4 1.4–9.6 1.9 3.4 4.2 1.3–17.2 2.9 3.2 4.8 1.4–17 3.6 0.51
Telephone 1.0 1.0 0.0–2.1 0.4 1.2 1.3 0.0–2.6 0.6 1.0 0.9 0.0–2.0 0.5 0.00*
Primary care 1.0 1.2 0.0–12.0 2.1 0.0 0.5 0.0–9.3 1.6 0.0 0.5 0.0–8.0 1.5 0.43
Nurse 2.0 2.6 1.0 −7.3 1.6 2.1 2.6 1.2–7.3 1.4 1.7 2.6 1.0–7.3 1.7 0.10
Physician 0.0 0.4 0.0–3.6 0.7 0.0 0.3 0.0–3.6 0.6 0.0 0.4 0.0–1.6 0.6 0.17
6.3 STUDY III
6.3.1 Results of the TDABC application
During the 2017 year, 314 patients (286 men and 66 women) averaging 80 years of age received care at the HND Center. A set of seven activities were delivered at the HND Center:
• New Visit • Nurse telephone consultation • Nurse Visit • Physician Telephone consultation • Physician Visit • Team Conference • Team Visit
During both new visits and team visits, the patient saw both a nurse and a physician, albeit separately in the former and together in the later. Doctors, nurses, and USKs met together with-out the patient during team conferences.

34
The EHR data provided significantly less data when compared to the manually extracted cal-endar data. After discussing this discrepancy with HND HCPs, it was clear that the EHR data was decidedly incomplete. This was confirmed by hospital administrative staff who explained that the EHR data was pre-processed in order to comply with municipality reporting standards and policies and thus was likely incomplete for operational purposes. The visit frequencies obtained from the calendar data were used in the TDABC analysis and are shown in Table 6. Detailed process maps with time estimates are presented in tabular form in Appendix 3, and an example process map is presented in Figure 3.
Figure 3: An HCP-validated process map for a new visit at the HND Center.
Each process step is labeled with the HCP types involved and their corresponding duration of involvement in minutes.
Each human resource is listed in Table 4 together with the corresponding annual capacities (FTEs), costs, and calculated CCRs (costs are always rounded to the Euro). The remaining costs are provided in Table 5 with their respective cost drivers. The resulting cost per processes, and their annual frequencies are summed together to calculate the total 2017 HND cost of care in Table 6.
Patient Arrives
New Visit
Visit Booking
USK 5,0
Morning planning discussion
USK 15,0
RN 25,0
Arrange patient transport
USK 15,0
Vitals
RN 7,5
Pre-consultation preparation
RN 7,0
MD 9,0
RN Consultation
RN 45,0
MD Consultation
RN 39,0
Post-consultation chart update
RN 10,0
MD 10,0
Patient Leaves
Booking of ordered tests
USK 10,0
Enter ordered presrciptions
RN 10,0
Follow-up scheduling
RN 5,0
Pre-visit
Patient Visit
Post-visit

35
Table 4: Human resource capacity estimates and CCRs
A. Monthly Cost (€)
B. FTEs
C. [A x B x 12] Annual clini-cal care cost
(€)
D. Care de-
livery FTEs
E. Days pre-sent at the
HND Center
F. [D x E]
Total care delivery
days
G. Work
hours per week
H. [(G ÷ 5) - 1] work day
hrs minus 1 hr break
I. [F x H]
Care deliv-ery hrs per
year
J. [(C ÷ I) ÷ 60]
CCR (€/ min)
Physician 5,550.00 1 66,600.00 1.0 202.5 202.5 50 7 1,417.5 0.78
Nurse 3,022.00 2.79 101,359.00 1.76 231 406.6 37 6.4 2,594.7 0.65
USK 2,913.63 0.15 5,381.00 0.116 231 26.9 38.25 6.7 178.6 0.50
Table 5: Non-human resource costs and corresponding drivers
Resource Source Cost (€/mo) Driver
Facility costs HND Center chart of accounts 4,923.00 minutes per square meter
Social welfare Staffing sheets 7,979.00 Personnel
Clinical chemistry HND Center chart of accounts 3,112.00 Physician visits
Pharmacy HND Center chart of accounts 3,851.00 Visits
Radiology HND Center chart of accounts 1,440.00 In-person visits
Other lab costs HND Center chart of accounts 1,033.00 Visits
Table 6: Annual activity frequency, marginal cost, and total annual cost
Activity Annual Count Cost** (€) Annual Cost* (€) New visit 143 367.00 52,528.00 Nurse telephone consultation 1545 51.00 78,286.00 Nurse visit 278 211.00 5,854.00 Physician telephone consultation 159 60.00 9,469.00 Physician visit 151 297.00 44,780.00 Team conference 240 115.00 27,470.00 Team visit 478 369.00 176,567.00 Uncaptured capacity
24,138.00 Total
471,791.00
*Arithmetic comes out differently as decimal values are not shown in the table.
**The cost of each of these activities in the economy department price list was 187.20 €.

36
6.4 STUDY IV
By the close of 2018, the HND RCT had recruited and randomized 119 patients, eight had died, five had been excluded for clinical reasons, 59 were randomized to HND care, and 47 to stand-ard care. Of the randomized 106 patients, 23 female patients were 76 years old, and the 83 male patients averaged 74 years old. Within the standard arm, 29 patients chose to cross over to HND care after one year, and one patient randomized to the HND arm decided to cross over to traditional care.
6.4.1 Results of the cost analysis
The frequencies of clinical events within each of the CDVCs for all three outpatient centers are provided in Appendix 2. The durations of each HCP’s involvement in the steps within each activity’s process map are provided in Appendix 3. The cost of each HCP, and the calculations for their corresponding CCRs are provided in Table 7. Other costs are presented in Table 8, and the rates at which they were adjusted down to account for costs incurred by non-HND patient visits are presented in Table 9.
Table 7: HCP costs and CCRs
A. Monthly cost (€)
B. FTEs
C. [A x B x 12] Annual clini-cal care cost
(€)
D. Care delivery
FTEs
E. Days pre-sent at the
HND Center
F. [D x E]
Total care de-livery days
G. Work hours
per week
H. [(G ÷ 5) - 1]
work day hrs minus 1 hr
break
I. [F x H]
Care de-livery hrs per year
J. [(C ÷ I) ÷ 60]
CCR (€/ min)
USK 3,645.00 0.70 2,553.00 0.50 212 106.8 38.25 6.65 710 0.06
HND Cen-ter RN 26,149.00 2.48 64,887.00 1.78 212 378.3 37.00 6.40 2421 0.45
MD 43,082.00 1.00 43,082.00 1.00 212 212.0 40.00 7.00 1484 0.48
USK 30,818.00 1.16 35,722.00 0.97 212 205.8 38.25 6.65 1369 0.43
Nephrology Clinic RN 38,951.00 9.18 357,759.00 7.69 212 1631.1 37.00 6.40 10439 0.57
MD 43,082.00 1.00 43,082.00 1.00 212 212.0 40.00 7.00 1484 0.48
Cardiology Clinic RN 35,052.00 7.21 252,884.00 6.10 212 1293.7 37.00 6.40 8280 0.51
MD 43,082.00 1.00 43,082.00 1.00 212 212.0 40.00 7.00 1484 0.48

37
Table 8: Non-HCP costs
Facility Resource Monthly resource cost € Driver
HND Center
Facilities 13,606.00 0.04 €/min/Sqmtr
Radiology 2,409.00 visits
Clinical Chemistry 3,232.00 physician visits
Physiology 1,913.00 visits
Immaterial costs 329.00 visits
Kidney Clinic
Facilities 99,772.00 0.29 €/min/Sqmtr
Radiology 9,662.00 visits
Clinical Chemistry 23,301.00 physician visits
Physiology 8,145.00 visits
Other lab costs 10,381.00 physician visits
Pharmaceuticals 10,610.00 visits
Immaterial costs 9,777.00 visits
Cardiology Clinic
Facilities 42,417.00 0.12 €/min/Sqmtr
Radiology 14,650.00 visits
Clinical Chemistry 7,863.00 physician visits
Physiology 35,397.00 visits
Immaterial costs 1,525.00 visits
Table 9: Non-HCP cost adjustments
Facility Driver RCT visit count Setting visit count Cost adjustment
HND Center Physician visits 66 328 20.12% In-person visits 845 2,904 29.10%
Kidney Clinic Physician visits 4 3387 0,12% In-person visits 7 8,875 0,07%
Cardiology Clinic Physician visits 14 3316 0,42% In-person visits 38 6968 0,54%
The total cost per day for each of each CDVCs is presented in Table 10, together with total patient exposure, cost per day exposure, and care utilization frequencies. For all patients, the first year of care following randomization was more expensive than the second. Patients that had crossed over to HND care were less expensive than both years of patients in the HND care arm.
The number of patients that experienced care within each of the six CDVCs, and the corre-sponding number of exposure days experienced by all patients is provided in Table 10. Only one patient crossed over to Standard care from HND care, and this patient did not experience any visits. At least 25 patients experienced care in the other CDVCs, except for the second year of traditional care, where 10 patients experienced care. The unadjusted frequencies of the four care utilization variables for each of the CDVCs are also presented in Table 10.

38
Table 10: CDVC costs, patient exposure, and care utilization
Visits outside the defined CDVC
CDVC Total TDABC costs for each
CDVC (€)
Patients expe-riencing the
CDVC
Total days of exposure
to the CDVC
Cost per day expo-sure (€)
Primary care vis-
its
Hospital days
Inpatient visits
Emergency visits
HND 1st yr 19,580.00 40 7,483 2.60 199 4 6 1 Traditional 1st yr 1,856.00 30 6,475 0.29 134 157 13 5 HND 2nd yr 23,561.00 46 11,088 2.12 94 111 29 4 Traditional 2nd yr 84.00 10 1,651 0.51 17 54 7 3 HND crossed to traditional 0.00 1 365 0.00 10 0 0 0 Traditional crossed to HND 14,953.00 27 7,564 1.98 161 212 18 8 All HND care 58,094.00 113 26,135 2.22 454 327 53 13 All traditional care 1,941.00 41 8,491 0.23 161 211 20 8
Three of the four care utilization variables – hospitalizations, hospitalization days, primary care visits, and inpatient visits – all tested positive for overdispersion and zero inflation. Hurdle models were used to compare these variables between HND and traditional care. The emer-gency visit data was not over dispersed or zero inflated, and therefore a Poisson model was used for the comparison of emergency visit rates between HND and traditional care. All GLMs compared a care utilization variable between HND care and traditional care, and controlled for duration of exposure, and the proportion of a patients’ duration that was second year exposure. The results of the four GLM comparisons is presented in Table 11. There was a statistically significant decrease in hospital days and emergency visits when transitioning within the GLM from traditional care to HND care. There was no significant difference between the two groups with respect to primary care visits or inpatient visit frequencies.
Patients in the HND arm, experienced 327 hospital days and 13 emergency visits over an ex-posure duration of 26,135 days, which amounts to 4.57 hospital days and 0.78 emergency visits per year. The hurdle model applied to hospital days generated a coefficient of 1.77083182 which was exponentiated to an odds ratio of 5.17. Thus, when compared to patients receiving HND care, the odds of experiencing hospital days for patients receiving traditional care was 5.17 times that of HND patients. With a coefficient of 1.327589, the Poisson model applied to ED visits estimated that the odds of patients within traditional care processes experiencing an ED visit was 3.77 times higher than that of patients exposed to HND processes. Traditional care is thus estimated to experience 23.63 hospital days and 2.94 emergency visits in one year. The TDABC cost analysis estimated that HND care comes at an added cost of 1.99 € per day, which comes out to 726.85 € per year per patient (Table 12). The cost of an emergency visit and a hospital day are 450.00 € (Karolinska University Hospital, 2019) and 254.62 € (Adam et al., 2003), respectively, and thus one year of HND patient care saves the hospital 5,098.00 €.

39
Table 11: General linear model results
Response Model Predictor Odds Ratios (CI) p-Value Inpatient bed days
Count model count group 5.17 (1.88-15.1) 0.0026** count duration 0.99 (0.96-1.01) 0.3017 count proportion2ndYr 0.91 (0.69-1.19) 0.4991 Zero hurdle model zero (Intercept) 0.03 (0.00-0.58) 0.0212* zero group 1.16 (1.77-1.50) 0.7408 zero duration 1.01 (1.00-1.03) 0.0653 zero proportion2ndYr 0.89(.72-1.09) 0.2705
Primary care visits
Count model count group 1.12 (0.57-2.20) 0.7435 count duration 1.00 (0.99-1.01) 0.8208 count proportion2ndYr 1.10 (0.97-1.25) 0.1336 Zero hurdle model zero (Intercept) 0.06 (0.01-0.53) 0.0121* zero group 2.34(0.98-5.59) 0.0551 zero duration 1.01 (1.00-1.01) 0.0205* zero proportion2ndYr 1.37 (1.02-1.83) 0.0347*
Inpatient visits
Count model count group 1.38 (0.44-4.28) 0.5795 count duration 0.99 (0.97-1.01) 0.5217 count proportion2ndYr 0.64 (0.37-1.11) 0.1101 Zero hurdle model zero (Intercept) 0.03 (0.00-0.58) 0.0212* zero group 1.16 (0.49-2.74) 0.7408 zero duration 1.01 (1.00-1.01) 0.0653 zero proportion2ndYr 0.89 (0.721.09) 0.2705
ED visits
Poisson model group 3.77 (1.48-11.53) 0.0096** duration 1.01 (1.00-1.02) 0.1678 proportion2ndYr 0.87 (0.62-1.08) 0.3024 ** P < 0.01; * P < 0.05

40
Table 12: Cost comparison of HND and traditional care
Annual cost per
patient (€)
Annual Hospital days per patient
Annual Emergency visits per patient
Annual hos-pital day monetary value (€)
Annual ED visit mon-
etary value (€)
Total €
HND care 810.86 4.57 0.78 1,163.61 351.00 2,325.47
Traditional care
84.01 23.63 2,94 6016.67 1323.00 7,423.68
Difference 726.85 -19,06 2,16 -2264.48 -972.00 -5,098.21

41
7 DISCUSSION While the first published application of TDABC in health care was in 2009 (Demeere et al., 2009), TDABC gained global attention in 2011 when it was highlighted in a Harvard Business Review (HBR) publication as the foundation of the solution to the cost crisis in health care (Kaplan and Porter, 2011). The article primarily called on providers to lead the initiative en-couraging them to adopt a new approach to cost accounting and financial reporting. Following this publication, applications of TDABC spiked internationally. As detailed in the results of Study I of this thesis, the wave of publications that emerged confirmed the claims made in the HBR article reporting on the method’s accuracy, simplicity, and informative contributions to decision making. This thesis demonstrates how TDABC can be applied to capture and compare costs of processes for patients with multiple chronic conditions.
More broadly, this thesis demonstrates how to conceptualize and evaluate real-world care path-ways for patients with multiple chronic conditions in order inform actionable changes to clini-cal management within hospitals. It lays the groundwork for empowering hospitals and other providers to incorporate financial analyses into their evidence development and decision mak-ing, and to contribute to the wider financial and economic systems in health care.
Specifically this thesis establishes a firm understanding of the relevant existing literature re-garding how to bets apply a promising progressive costing system (Study I), characterizes care utilization within traditional and IMD-Care delivery models for MCC patients (Study II), and adapts and applies TDABC on traditional and IMD-Care processes (Study III and IV). The practical implications for bringing these findings into practice will then be presented and dis-cussed in order to prepare health care professionals, finance directors, and clinic, department and hospital managers for how best to make use of the results and apply them in their organi-zation.
7.1 COUNTING WHAT DOESN’T COUNT
Thus far, applications of TDABC in health care have made a great contribution to the literature base in describing experiences and identifying some practical lessons when applying TDABC in health care (Study I), but they fall short of achieving the wider goals of the seven-step ap-proach. TDABC was invariably praised in the published literature for its accuracy and simplic-ity. However, these applications have also solidified the existing inherent mismatch between our health care system and the needs of the modern patient. The fragmented nature of the health care system combined with the care pathway data requirements of TDABC bound the wave of applications to cost well-standardized and non-chronic conditions.
If the data requirements and steps involved in TDABC applications are considered, it makes sense to focus on a well-standardized condition whose treatment has a clearly defined start and endpoint. The entire care pathway, together with all inherent processes, resources, and time estimates must be documented and analyzed. When care delivery requirements for MCC pa-tients are considered, it immediately becomes clear that the task is not feasible. As a result, TDABC cost applications have yielded to the nature of the reductionist health care system, and

42
perpetuate the siloed, single treatment, single condition, single cause mindset. Applications of TDABC have not addressed the major challenges of costing care for modern patients, and the cost crisis continues (Study I).
The key finding of the literature review was that while some steps can be taken to optimize TDABC applications, its ability to capture cost of medical conditions and CDVCs as intended remains to be demonstrated. Given that MCC patients are driving system-wide increases in health care costs, if TDABC is to contribute to solving the cost crisis, it must be capable of costing coordinated care designed to treat an interrelated set of patient circumstances including complications and comorbidities. This challenge relates specifically to the first two steps, and begs the question how can an MCC patient’s condition be defined, and how can the corre-sponding CDVC be characterized?
7.2 MEDICAL CONDITIONS WITH HIGH VARIATION AND HIGH-VOLUME: PATIENTS WITH MULTIPLE CHRONIC CONDITIONS
The experiences of MCC patients within the health care system are characterized by variation and high frequency (OECD, 2011, Fortin et al., 2007), and HND patients are no exception (Study II). Defining a CDVC that spans the care pathway is clearly a barrier that needs to be broken in the context of a medical condition which requires coordinated care to treat interre-lated patient circumstances including comorbidities. Study II in this thesis provided the scope and complexity that characterizes HND patient care clinically and geographically. Prior to be-ing recruited to the HND study, patients experienced an average of seven outpatient visits, a primary care visit, a visit to the emergency room, and five days in the hospital every month. These patients also had a median of 14 diagnoses, and comorbidity score of five on the six-point scale of the Charlson Comorbidity Index (Charlson et al., 2008, Charlson et al., 1987).
The care experience associated with a condition of this intensity and complexity is perhaps best portrayed in Figure 4. The figure is the output of a process mining software, Disco (Fluxicon BV, 2020). The EHR data (Qlikview data) of HND patients was uploaded to the software which depicted all possible care pathways as they existed in practice, presenting the multitude of pa-tient paths taken between different settings within one hospital. It quickly becomes clear why clinical providers have struggled to create standards of care for MCC patients. This is likely a large part of the reason why the literature review identified no study attempting to costing care for MCC patients.
As an IMD-Care center, the HND Center works to assess each individual patient’s needs, and steer the care pathway specific for that patient, guided by available standards that apply to each comorbidity. One objective of the HND Center was to integrate care and reduce unnecessary health care visits in order to manage the unstable care seen in Figure 4 using the workflows presented in Figure 1. Intrinsic to the HND Center’s IMD-Care approach is a switch in the way of thinking away from care standardization to evidence-informed collaboratively generated care pathway management to address each person’s needs.

43
Figure 4: Characterization of the HND clinical experience
This figure is the result of plugging one year of time-stamped EHR (Qlikview) data for 314 HND patients into a process mining software called Disco (Fluxicon BV, 2020). Each line represents a unique path that multiple patients can follow over time, and the rectangles represent different locations at the hospital the patients encounter. If all patients followed the same care pathway, there would be only one path.
7.3 TDABC APPLIED: COSTING CARE WITH HIGH VARIATION
The lessons accrued in this thesis and its four individual studies provide a firm foundation for how hospital financial departments and managers of patient flows, units and clinics can cost care pathways for patients with complex care needs. The following section draws upon the collected results of the four studies and this thesis to present a strategy for TDABC application for costing complex care processes with high degrees of variation. It is most likely even appli-cable when care processes are less complex, which is why efforts have been made to establish a common language and adopt an inclusive approach. Robert Kaplan, the co-founder of both TDABC (Kaplan and Anderson, 2004, Kaplan and Anderson, 2007) and the seven-step health care approach (Kaplan and Porter, 2011), was a reviewer the study upon which this method was developed (Study II), and he recommended the manuscript for publication.
7.3.1 Step 1) Define the medical condition
Careful attention should be paid to defining the medical condition for patients with a specified set of chronic conditions. The definition must go beyond a set of named conditions lumped together. A group of relevant specialists should join as an IMD-Care team, perhaps as an IMD-

44
Care center, to provide the clinical justification for combining care for a carefully selected set of chronic conditions. The team should provide explicitly formulated clinical requirements for inclusion in the patient group. As these conditions are chronic, a time period must be set for the cost analysis, for example one year (Studies III and IV).
7.3.2 Step 2) Define the CDVC
One major contribution of this thesis is the ability to cost clinical conditions in the absence of a standard CDVC (Study III). This is done through the modification of the second step of TDABC, moving from defining a standard CDVC, to statistically characterizing the non-stand-ardized CDVC as it exists in practice. IMD-Care mitigates two challenges inherent to this mod-ified approach: 1) high variation, the number of pathways occurring among patients, and 2) process instability, the constancy of processes over time (de Bruin et al., 2012). In the absence of IMD-Care, MCC patients would experience more variation instability, compromising the consistency of per-patient-cost estimates based on visit frequencies (Study III). IMD-Care cen-ters stabilize care delivery, and coordination between settings eliminates some level of varia-tion within the care processes. This statistical stability in care delivery allows for the characterization of the CDVC, and thus the costing of non-standardized care.
As in Step 1, the CDVCs should be defined by a group of relevant specialists. Ideally, the CDVC should broadly incorporate all activities involved in treating the medical condition in-cluding, for example, inpatient visits, emergency care, and perhaps primary care. This is yet to be achieved in the published literature for MCC patients and remains as a challenge for future research. In this thesis, the hospital lacked the information systems and data required to make a comprehensive analysis feasible, and care utilization measures were used in place of TDABC cost estimates to approximate the wider economic impact beyond the outpatient centers (Study IV).
7.3.3 Steps 3) and 4) Develop process maps and estimate the time of activities
Steps 3 and 4 are merged to form a single process mapping step. To avoid developing excess methodologies, and to maintain fidelity to the original seven-step approach to TDABC for health care, they are not reduced to a single “Step 3”.
7.3.3.1 Step 3-4a) Assess the validity of available process data
Many hospitals collect some form of process data for DRG costing purposes (Busse et al., 2013), and some hospitals collect detailed process data that could suffice for a TDABC analy-sis. In order to be sufficient for a TDABC analysis, maps must exist for all activities defined in the CDVC. These maps should be complete with process steps, the location of the activity, resources used in the process steps, and their duration of use (Studies III and IV).
Existing process maps should be assessed for their suitability in a TDABC analysis. Process owners – the HCPs who are responsible for the activity – should review the validity of time estimates including how they were collected, how stable processes are expected to be, and the

45
amount of time that has passed since the maps were developed. It is important to note if time estimates were made from direct observation, reporting from HCPs, or estimates from stand-ards. Observations are most reliable, and guidelines least. Based on the assessment of the qual-ity of process data, new process data may need to be collected.
7.3.3.2 Step 3-4b) Collect observational data of care processes
If existing process data are not available, process data should be collected through direct ob-servations by process owners with the support of controllers and operations staff (Studies III and IV). RFID has been discussed as an automated alternative (Kaplan and Porter, 2011), but has not been reported empirically in the published literature. As an external analyst or re-searcher, collecting process data is inefficient because they are not familiar with existing prac-tice. Instead, process owners should be identified, and assigned to collect observational process data with the support of quality management and process improvement staff. Data should be collected using a standardized electronic device that will minimize data entry error, and that can be uploaded to a database for smooth incorporation into a cost-accounting system. The process steps, the location, resources used, and their duration of use should be collected for each activity. Multiple observations should be made to improve the accuracy of estimates, and to allow for statistical analysis.
7.3.3.3 Step 3-4c) Build process maps and validate them with health care professionals
The construction of process maps from the uploaded data should be automated, requiring no additional work from hospital HCPs (Studies III and IV). HCPs should be able to upload their data, and immediately view the resulting maps for validation with their colleagues. Any adjust-ments should be made based on their clinical experience before finalizing the process maps.
7.3.3.4 Step 3-4d) Monitor process stability and update accordingly
Processes that are likely to remain stable could be updated less frequently, but less stable pro-cesses should be updated more often. Process owners should review their processes in standard intervals to look for those that are at risk of becoming outdated, paying special attention to less stable processes.
7.3.4 Step 5) Estimate the cost of supplying patient care resources
The annual cost of all resources should be obtained from the hospital’s economy department. Until standard or automated costing procedures are established, process owners and controllers should review the hospital’s chart of accounts to identify all direct, indirect, and support center costs required by the activities included in the CDVC (Studies III and IV). If the chart of ac-counts is not very resolute, indirect and support center resources may need to be driven to activities on a volume bases as was done in this thesis – i.e. distributed evenly among appro-priate activity types. However, if the chart of accounts is sufficiently detailed, support center resources can be allocated to direct costs such as HCPs or facilities space and added to the numerator of their capacity cost rate. This will generate much more accurate cost estimates. If the TDABC analysis is detailed enough, the cost of supplies can be included and should be

46
allocated to the activities in which they are used. The cost of supplies should include any costs required to make them available for patients, including storage and delivery (Kaplan and Porter, 2011).
The seven-step approach to TDABC calls for the mapping of support center processes as done in steps 3 and 4, using the sterilization of surgical equipment as an example (Kaplan and Porter, 2011). However, this costing practice is yet to be described in the published literature. It would be useful to develop evidence detailing how this can be done empirically, but this exercise should be deferred until a functional TDABC system has been established.
7.3.5 Step 6) Estimate the capacity of each resource, and calculate the capacity cost rate
The concept of capacity should be carefully discussed with both HCPs and controllers to iden-tify what datasets could be used to best estimate the capacity of resources active in the CDVC (Studies III and IV). For HCPs, information on FTEs from the chart of accounts or on HCP attendance from the scheduling system of the care center could be used to estimate capacity. Similar approaches can be taken for equipment. Careful attention should be paid to separate out time resources are not available for care delivery. The identified capacity datasets should be reviewed carefully to make valid practical capacity adjustments to resources, using the da-taset that is most reflective of what happens in practice.
The annual cost and practical capacity estimates of resources are used to calculate CCRs. One-time-use supplies do not have a capacity, are allocated directly to activities.
7.3.6 Step 7) Calculate the total cost of patient care
The total cost of care is calculated by using the CCRs and process data to estimate the cost of all activities in the CDVC. The product of these costs and their corresponding annual mean frequencies is the annual cost of each activity in the CDVC. The sum of these annual costs is the total annual cost of the CDVC for the group of MCC patients (Studies III and IV).
While a state-of-the-art information system would generate the most reliable cost estimates, these systems are rarely available and functional in practice. Room for flexibility and creativity should be allowed where information is left to be desired. In this thesis, a range of assumptions had to be made to achieve its aims.
7.4 WHY KNOWING HOW TO COUNT IS NOT ENOUGH
Without a holistic understanding of how TDABC-based costing system complements tradi-tional approaches to hospital costing, the individual justifications for adopting such a system

47
can seem unclear and unconvincing on their own. The hospital in which this research was con-ducted has a costing system that is viewed locally as an effective example to follow. In fact, it had a reputation in the region for the best cost estimates.
The hospital contributes annual DRG cost estimates to a national DRG database and generates cost estimates for any given patient, department, or visit. Specifically, for HND care, the exist-ing hospital costing system can estimate the cost of the HND Center, generate an approximate single cost applied to all HND outpatient visits, and estimate the annual cost for each HND patient. Clinical managers can understand how much they spend on traditional care versus HND care for HND patients, how much each patient costs in each setting, and how much a typical HND outpatient visit costs. From this information, a clinical manager can, if they want, know if they spend more on HND care than they do on traditional care per patient each year, and how much the HND Center costs the hospital. Management is appreciative of the infor-mation coming out of the economy department, and managers have no incentive to modify a system that functions perfectly well.
Even if management and HCPs were aware of the limitations of the existing costing system, they would likely not be concerned. HCP, pharmaceutical, and support center costs charged to the HND Center are all allocated evenly among outpatient visits within the clinic. This gener-ates a single cost estimate for all outpatient visits in the cardiology clinic. Physician telephone consults and physician outpatient visits both cost the same amount. In 2017, the TDABC anal-ysis estimated the cost of an HND telephone consult to be 60.00 € and a physician visit 297.00 € (Study III). The hospital lists all outpatient visits at the HND Center at 187.00 €. In the grand scheme of the budget for an entire clinic, these differences are miniscule and not worth inves-tigating. Lab tests and radiology costs can be linked directly to patients, and when used together with visit costs, a reasonable cost estimate for patients can be made. The generation of more accurate visit costs is not appealing in and of itself.
The advantages of TDABC become slightly clearer when considering new cost insights at the process level. In addition to distinguishing cost differences between different types of outpa-tient visits, the TDABC system could depict where in processes each resource cost is incurred and its magnitude (Study III). From this information, clinical managers can understand how much is saved by substituting visits and resources within the care pathway and removing or shortening process steps where possible. They also get more accurate cost estimates of visits and patients. The benefits of activity and resource substitution decisions, however, are already apparent to providers. Physicians are aware that phone consults are less expensive than in-person visits, and that nurse time is more affordable than physician time. It is perhaps not con-vincing enough for managers to decide to overhaul cost-accounting infrastructure, when they

48
feel the information available is sufficient for economic decision making. However, the fol-lowing section explains why this type of thinking is limiting.
7.5 THE IMPACT OF COUNTING WHAT COUNTS
It is not until TDABC systems are combined with strong research and development (R&D) internal to the organization, that the benefits of TDABC begin to demonstrate an impact that will capture the attention of hospital management. This is perhaps best discussed within the context of the VBHC framework. According to the VBHC literature, changes in both costs and outcomes over the entire care cycle need to be considered together in order to capture the value contribution of different interventions. The VBHC framework, however, often discusses com-parisons between organizations, i.e. which organizations can provide the best outcomes at the lowest cost for a given condition. However, for decisions within organizations, simply knowing the outcomes achieved per unit cost when treating a condition is not productive because no alternative is available for comparison. Organizations must adopt internal research practices to assess changes in value before and after care interventions, or between different approaches to care delivery.
In this thesis, a comparison was made based on an RCT performed within the hospital. TDABC generated the cost component of the value comparison of HND and traditional care, and the outcomes used in the analysis were care utilization parameters. Patients in the traditional care arm experienced more primary care and inpatient visits than patients in the HND arm. This difference is aligned with the program theory of the HND Center, but the coefficients associ-ated with the odds ratios were not statistically significant. The odds ratios associated with the higher number of ED visits and hospital days seen in the traditional care arm were statistically significant (Study IV). This was also in line with the HND program theory. The analysis ulti-mately found that the HND Center saved the hospital 5,098.00 € per patient treated at the HND Center through the reduction of hospital days and ED visits (Study IV). In 2018, the HND Center treated 403 patients, saving the hospital 2,054,494.00 €. For perspective, the hospital’s chart of accounts lists the HND Center at a cost of 573,389.00 € that year. In 2018, the tradi-tional costing system estimated the cost of HND visit, kidney clinic visit, and cardiology clinic visit to be 198.00 €, 489.00 € and 244.00 € respectively. If these figures had been used to estimate the cost of HND care and plugged into the same RCT-based cost analysis, the esti-mated cost savings of the HND program would have been 127.00 € per patient, or 51,272.00 € per year. This completely fails to capture the significant financial benefit of the HND Center, which is saving the hospital a few million Euro in added costs, and likely improving patient outcomes. If organizations begin to apply internal R&D initiatives in order to improve the ef-ficiency of care delivery in terms of costs and outcomes, the consequences of having traditional costing will be problematic.
The benefits of TDABC combined with R&D go deeper still. According to the traditional cost accounting system, the hospital spent 592,387.00 € in 2017 and 573,389.00 € in 2018, a 3.2% decrease. The 314 patients treated at the HND Center in 2017 increased by 28% to 403 in 2018, suggesting a decrease in the cost per patient from 1,887.00 € to 1443.00 €, a 23% decrease in

49
the cost per patient. The traditional accounting system also reported that HCP costs at the HND Center were 315,520.00 € in 2018, 1% higher than the 2017 cost of 310,942.00 €. It is likely that the hospital is not aware of this increase in efficiency, as the approach was simply to roll the 2017 budget over to 2018. The situation becomes interesting only when you observed through a TDABC lens. According to the TDABC cost analysis, the traditional costing figures are simply incorrect, and no longer relevant. The TDABC analyses show that the cost per pa-tient per day of HND care decreased from 4.55 €to 2.20 € from 2017 (Study III) to 2018 (Study IV), a 52% decrease. However, the HCP cost per patient per day changed from 1.64 € in 2017 to 1.12 € in 2018, a decrease of 32%. The HND Center used 52% fewer resources and 32% fewer HCPs to treat 28% more patients. This is a remarkable accomplishment, and one could become concerned that HCPs may be at risk of burnout. A deeper look shows that the propor-tion of both new visits and team visits, which are both in-person visits involving both a doctor and a nurse, decreased substantially in 2018, as did nurse telephone consults. Even as in-person doctor visits and nurse-visits both increased in 2018, this cost was more than offset by the reduction in new visits and team visits. This is well aligned with the intendend workflow of the HND Center. As a lower proportion of patients are new, less require the initial new and team visits Figure 1. Essentially, as the HND Center becomes more established with a smaller pro-portion of new patients, providers and patients settle into more efficient care delivery routines.
The contribution of TDABC as compared to traditional become clear when the method is ap-plied as it was intended: to solve the cost crisis by costing care across disciplinary boundaries, including comorbidities, which demands a change in how the CDVC is understood. Prior to this research, the hospital perceived HND as expensive using their usual costing approach. This research enabled them to see the savings generated by HND care, and management decided to continue with their support for the HND Center which has been able to continue its operations and spread the concept.
7.6 THE CASE FOR INTEGRATED MULTIDISCIPLINARY CARE MODELS
This thesis makes the case for IMD-Care centers because ineffective integrated care theory is moving practice in a counterproductive direction. It has long since been acknowledged that MCC patients generate the large amount of costs, that they are increasing in prevalence each year, and are of the highest priority to health care providers, managers, and policy makers (Clarke et al., 2017, Lehnert et al., 2011, OECD, 2011). Recent solutions have been to transition the coordination of care for these patients outside of hospitals, and into primary care where care delivery is less expensive (Boehmer et al., 2018, Coleman et al., 2009, de Bruin et al., 2012). For example, in Sweden, the government has commissioned a report, God Och Nära Vård (Quality Care Close to Patients), to develop an integrated care model similar to the Chronic Care Model and the Medical Home Model, with a clear focus on primary care. This initiative has a special focus on patients with complex conditions. While integrated care coordinated by general practitioners may be good for many patients (Coleman et al., 2009), this thesis high-lights the flawed reasoning behind taking the most complex and difficult patients, moving them away from the providers with the most expertise in their treatment, and placing them in the care

50
of those educated to treat the general population in the most non-specialized setting. Instead of addressing the inefficiencies of the current specialist care reductionist system, which is expen-sive because of the lack of coordination around the most expensive patients, the proposed so-lution is to distance patients from the specialists they need. This has not generated an improvement in patient outcomes or a reduction in costs (de Bruin et al., 2012, Boehmer et al., 2018).
This thesis demonstrates that care coordination, backed by R&D and proper systems integra-tion within the hospital organizations can lead to reduction in costs and care utilization. A team of specialists worked together to integrate care processes for complex patients, integrating ex-pertise from their disease area, reduced the number of inpatient bed days and the number of emergency care visits. Patients with the option to choose HND or traditional care almost always choose HND care, and other research has shown that HCPs believe that HND care is the best approach to care for these patients (Even et al., 2019). Decision makers and clinical manage-ment should consider shifting prioritization from moving integrated care to primary care and focus on reorganizing hospital care delivery to allow for specialists to work together with ad-ministrative staff to align and coordinate care delivery for these patients.
7.7 A NEED FOR COLLABORATION BETWEEN ECONOMY AND HEALTH CARE PROFESSIONALS
Within the existing health care system, financial incentives and budget constraints incentivize administrative staff to focus on financial reporting. The Qlikview data was not usable within this TDABC analysis because policies were in place that dictated which visits should be re-ported to Stockholm Region to support remuneration decisions. Cost estimates are calculated for DRGs annually to report to the Swedish National Board of Health and Welfare in order to maintain a national cost database for health economic analyses (Busse et al., 2013, Welfare, 2007). Inconsistent costs are reported between institutions, which is problematic for health eco-nomic analyses (Busse et al., 2013, Lindgren, 2014), and the focus of many DRG improvement initiatives is on how to make organizations report costs more consistently (Busse et al., 2013, Chapman et al., 2016). The heavy focus on reporting strains the work capacity of administrative staff towards reporting, and they have no time to look inwards within the organization to work with providers to improve care delivery (Chapman et al., 2016). Meanwhile, clinicians and managerial staff are informed of budget cuts on a semi-annual basis to which they must accom-modate.
Instead of prioritizing only event-based reporting in order to inform reimbursement and budg-etary decisions, hospitals need to create space to prioritize data preservation and systems inte-gration for internal managerial and clinical decision making. This will better enable hospitals to report more accurately, and better understand how to control costs for patients. A TDABC approach to costing, like the one used in this thesis, will equip managers with the tools to work with clinicians, justify costs, and demonstrate how to optimize outcomes for patients with the available resources.

51
8 METHODOLOGICAL CONSIDERATIONS
8.1 THE CHALLENGE OF OBTAINING RELIABLE DATA
Beyond the challenge of mitigating variation and stability in the CDVC, is the challenge of obtaining reliable data that accurately represent the patient experience. If data is unreliable, the CDVCs do not reflect care delivery, and the cost analysis is systematically compromised. If the data cannot be efficiently obtained and updated, the scalability of the cost analysis is com-promised. The available datasets for estimating frequencies within the studies of this thesis were either unreliable or not digitally accessible. The Qlikview data that was initially obtained for frequency data in this thesis was assumed to be valid, but over time HCPs and researchers became suspicious of mismatches between the Qlikview data and clinical practice at the HND Center. After examining the data with controllers and HCPs, it was found that within the Qlik-view dataset, repeat visits were consistently removed, canceled visits were removed even though they had required actions by providers, and non-billable events were removed. These changes all compromised the validity of a cost analysis, and therefore another alternative ap-proach was chosen as described in the thesis. Datasets should therefore be carefully reviewed and well understood, so that process owners are confident they reflect work-as-done. The al-ternative dataset used was the clinical journal data available in an old system called TakeCare. This data was not digitally available for manipulation and analysis even to HCPs at the hospital. As a result, the author and a nurse sat together to manually pull clinical event data from patient journals to obtain valid data for the analysis. Like CDVC data, process data is a difficult dataset to obtain. It is expensive to collect and is difficult to keep up to date. As in other hospitals, process data were collected annually for DRG costing initiatives. However, this data was not digitally available, and did not exist at all for the HND Center. All process data was manually collected within this thesis, and the methods for collecting these data were iteratively developed and piloted.
Together with integrated multidisciplinary care, stronger information systems, and R&D com-petencies, TDABC can meet the needs of today’s patients where traditional cost-accounting will fail. However, absent these added competencies, the approach taken in this research is currently not scalable from the HND Center to the rest of the hospital under current conditions. This need is not easy to demonstrate when existing cost accounting infrastructures continue to function as well as they always have.
8.2 INTERPRETATION OF THE GENERAL LINEAR MODELS
The general linear regression analyses in the Study IV are representative of the care utilization of HND patients during the 2018 year. While there is a statistically significant odds ratio with respect to inpatient visits and emergency visits, the 95% confidence intervals around these ra-tios still imply a high likelihood of strong savings associated with HND care in 2018. It should also be noted that although this is what the data looked like in 2018, it is never certain how these predictions may play out in the future, especially with rare event data.

52
8.3 PERSONAL REFLECTIONS ON AN ACTION LEARNING JOURNEY
The section below will elaborate on the lessons learned through the research process and the implications they may have for similar applications of TDABC in the health care context. I will begin writing in first person, as it is more appropriate for these reflections.
Upon beginning the empirical research, I was content in my naïve notion that my comprehen-sive academic understanding of TDABC had already empowered me to apply the method in real-world health care organizations. I was immediately humbled and found myself feeling confused and insecure. I had absolutely no idea where I was, what I was doing, and how my theoretical knowledge base should or even could be applied. I bounced between clinical pro-viders, patient visits, fellow researchers, and hospital economic staff, iteratively looping through my own learning, struggling to build some semblance of a picture around how the organization functioned. During the first half (two years) of my time as an empirical researcher at the hospital, I felt completely unfamiliar with the organization and had no idea how much progress was being made. Evered and Louis (1981) describe this process as “groping in the dark” or “messy, iterative groping”.
Change within an organization may only be achieved through experiencing and living the pro-cesses and culture as you attempt to bring about change (Schein, 2010). I find this to be true, because I was unable to ask relevant questions until I had attempted to bring about change within the hospital. This two-year learning period was an iterative process through which I came to realize that the initial questions I had set out to answer were simply not relevant yet. They were too broad. Both myself and the organization were not yet prepared to ask the ques-tion: “How can we cost integrated care at a hospital, and learn from our findings?” I first needed to identify the actual issues that were currently important barriers for the organization, a process that has been described as iterative and ever changing (Dutton et al., 1983). Some examples of issues I ran into included:
1. How can we efficiently map care processes in a useful and productive way, and quickly?
2. How can we understand, as researchers and clinicians, how costs are allocated within the cost accounting infrastructure?
3. Why do different information systems at the hospital fail to reconcile properly, and what adjustments need to be made so that they do reconcile?
4. Why is management reulctant to make needed changes in cost-accounting systems in order to get a better understanding the cost of care processes?
5. How can we help management to see the potential benefits and opporutnities to be gained if there is a willingness to change the way costs are approached, used, and understood?

53
Dutton et al. (1983) explain that the identification of issues such as those mentioned above is fluid, dynamic, and emergent. I found that boundaries are difficult to create around depart-ments, staff, topics, or issues in an attempt to isolate them for the purpose of relevancy in prob-lem solving. As a result, I became more and more drawn to attempting to understand the organization’s entire infrastructure. This was dynamic in that as my understanding deepened, and questions were slowly answered, my attention moved to newer and somewhat deeper is-sues. My emerging understanding of these newer and deeper issues only came to light as other issues were solved or understood.
As a researcher I sought to engage in practice but found myself to be mainly an outsider to the organization, particularly during the initial period. During the first few years, I spent ten days in the hospital for observations, and then would travel to hospital meetings only a few times a term. Gaining access to needed information was often cumbersome. I had direct access to the lead physician at the HND Center. However, in consideration of the physician’s clinical obli-gations, I needed to be respectful of his time as well as that of supporting staff. He was also often out of town, as he was working part-time to develop a similar system in Canada. Eco-nomic staff were often slow to respond to my emails. In the early stages of getting acquainted with their staff, I found that the best way to gain access was to show up unannounced at the economics department with a data sharing contract to get the information I needed.
Over time, and especially in the final years, I found myself at the hospital on almost a weekly basis. I began to feel as if I were a member of the organization. I had a contract signed by the hospital Chief Executive Officer (CEO) giving me access to the organization, its data, and its staff, and the CEO put the weight of her full support behind our initiative. It took some time, but I eventually delved deeply into what Schön (1995) refers to as the “swampy lowlands”, where the real “in-practice” problems became clear to me. For example, from the high grounds, estimating the actual cost of HND care was the main priority. However, once immersed in the context, I came to understand that, outside the HND Center, not everyone was invested in the importance of estimating the cost of HND care. Clinicians wanted to provide quality care to the patients they saw. Economists wanted to report up-to-standard financial information to management. Clinical heads wanted to increase budgets, so that they could provide clinicians with the tools they needed to provide quality care to patients. Management wanted to pull in more money from the regional government and figure out the best way to distribute those re-sources fairly to the clinics based on the expressed needs of the clinical heads. The politics of the context almost completely overshadowed the objective of my research, and focus was needed for myself and my fellow researchers to stay the course. This was the core benefit of being an outsider, as described by Schön (1995) where I could objectively observe the organi-zation and its workings from a distance.
Political dynamics played a substantial role in how I thought and behaved throughout my pro-ject. While my project was designed to understand how to implement TDABC to cost MCC patients, I knew also that I had been tasked with supporting an economic evaluation of the HND

54
Center. This could be understood as what Zuber‐Skerritt (2002) describe as the difference be-tween “core” and “thesis” research. This also connects to the topic of role duality typical of empirical research projects, where the line dividing the role of researcher and organizational member begins to blur. I found myself in an ethical dilemma where I knew I should present my research objectively, however, I had to be careful at times how I presented my research. If it were misinterpreted or poorly received by individuals in key positions at the hospital, conse-quences could immediately result that could negatively impact patient care. On multiple occa-sions, I found inconsistencies within the hospital’s data, information systems, and infrastructure. I often had no way to identify which individual or group was responsible. If my reporting were to reflect badly on staff working within a related role, I knew I would have difficulty gaining their support thereafter. So, I had to tread carefully, walking a fine line to balance the need for staff to be comfortable with my reporting and the requirement that I convey my information in the most objective and correct way possible. Finally, I found that the HND Center was expensive as compared to traditional care, and I became concerned that if I reported my findings too soon, the HND initiative might be abandoned and the center closed. I could tell from my own observations that patients appreciated this new form of care. Furthermore, we had determined that HCPs working at the center believed this was the best way to treat patients (Even et al., 2019). I had to be conscious of my desire to protect the HND Center in order to keep a careful check on my confirmation biases, preventing them from influencing the costing analysis. This is the practice of knowing-in-action, being mindfully aware of my own tendencies to jump to conclusions due to emotional reasoning (Coghlan et al., 2015). A clear understanding of the cost-accounting tools and the theory behind the most innovative frame-works is only the first step in preparing an organization for changing their cost infrastructures. Navigating the complexity of implementing a new and innovative approach within an organi-zation can be a protracted, interesting, and challenging endeavor.

55
9 CONCLUSION Health care system improvement efforts are currently committed to regaining stability within a failing reductionist system that is not well-suited to the needs of today’s patients. The result-ing inefficiencies have created cost and quality challenges for patients, providers, and systems. This thesis demonstrated that a hospital-based integrated multidisciplinary care approach to a complex medical condition makes economic sense for the hospital, the system, the HCPs, and importantly for the patient. The TDABC approach developed in this thesis project to cost care pathways for patients with multiple chronic conditions brings to light a set of elements which can be prioritized in future quality improvement efforts. In doing so, the thesis moves the fields of clinical management, clinical quality improvement, and cost-accounting in health care a step forward by identifying a set of core capacities that can be developed in health care organiza-tions to make wiser decisions about integrated and interprofessional care.
IMD-Care should be broadly incorporated into hospital service delivery. The process can be initiated by leveraging the competencies of specialists to identify medical conditions and in-clusion criteria. When necessary, IMD-Care teams can take responsibility for the care of pa-tients with pertinent conditions, by developing focused IMD-Care centers to manage person-centered care. Over time, the case mix presenting to the hospital should be reviewed regularly to ensure that existing IMD-Care centers are in sync with the dynamics of the case mix over time. To that end, AI approaches that are currently under development could prove valuable as our information systems improve (Rafiq et al., 2019).
Information systems need to be developed to include three capacities. First, standard routines need to be developed for the collection of process data. This includes the allocation of a certain proportion of staff time to quality improvement work in order to generate necessary datasets for core processes. Second, a relational database with standard data definitions must be devel-oped that integrates process, event, cost, and clinical data across a unified platform. This chal-lenge must include dedicated IT staff devoted to database management and development. Finally, an analytical tool should be developed or acquired that generates patient-specific, inter-locational, and useful value-based information for clinicians and managers. The adapted TDBAC approach described in this thesis is a viable costing method to identify system ineffi-ciencies, economic implications, and financial improvements (as well as process improvement opportunities) if these supporting other core capacities are developed.
Research and Development competencies will need to be developed internally within hospitals. These competencies are crucial for well-designed interventions that will boost the actionability of information as it emerges from new information systems. Patient-safety, quality improve-ment, and costing have traditionally been seen as separate competencies within hospitals, often working in separate silos. Instead, these competencies can be combined such that care teams within IMD-Care centers could be tightly coordinated with organizational R&D units to co-develop interventions and studies. Sound scientific practice is crucial to ensure that quality information and evidence serve as the basis for action.

56
Through these core capacities, clinical organizations will hopefully become empowered to make wise, value-driven decisions that will serve as the new incentive for organizational im-provement. Information that demonstrates value delivery will make financial needs clear to managers and policy makers, who in turn should understand that evidence-based investment in care facilities and services will ultimately demonstrate a return, benefiting not only IMD-Care patients, but also the larger populations they serve.

57
10 ACKNOWLEDGEMENTS THESIS SUPERVISORS As we wrap up this journey, I wish to express my deepest gratitude to my supervisors. It’s difficult to write an acknowledgement for them because no matter what I write, it cannot ex-press the amount of support and time they’ve committed to our work and my development as a researcher and a person. In the final stages, I have felt joy when reading all your insights and enhancements of the ideas and writing within my/our research. There is something about the way all of you think that inspires me to learn more and to keep growing. I have a deep respect for each of you, and I couldn’t be more thankful.
My main supervisor, Dr. Pamela Mazzocato, has always kept her feet on the ground and has held me accountable to the method of research. At the same time, she has been endlessly pa-tient, supportive, understanding, and encouraging. She has helped me to remain at peace through all of this, and I am grateful beyond word.
Dr. Carl Savage, other main supervisor Carl (co-supervisor only on paper) kept my head in the sky. Always making room for a bigger picture, another perspective, and all the things I hadn’t thought of yet, but would come to understand. Most times I would get frustrated because I did not understand what Carl was trying to tell me, I would later have an epiphany moment that he’d had long before. I am thankful for Carl’s patience with my stubbornness, expectation that I understand fully, and dragging my feet until I “Grok” the concept. He has also become a great friend.
Dr. Jonas Spaak was always a source of encouragement and knowledge for me. He laughed almost every time I spoke. He was the word of clinical wisdom and patience in the room. He always had a way of making things clear, told me when things made sense, and corrected me when they did not. He always listened hard before he spoke, and his feedback was always valuable.
If Dr. Jonas Spaak always listened hard when he spoke, then Dr. Peter Lindgren always listened and sometimes spoke. But when Peter chose to speak, it broke new ground and changed my thinking. If Pamela kept my feet on the ground, Peter told me what the ground was. He is a methodological wiz, and was a source of security and stability for me throughout this research process. I’m fortunate enough to begin working for Peter in this next period of my life at the Swedish Institute for Health Economics.
Dr. Mats Brommels sits on another level of research for me. He was somehow never available but always available. Never around but always around. Mats was always supportive; was the expert among us. He had so much experience working with these topics, and I’d be fortunate to one day develop his expertise and ability to encourage learning in others.
If there is one reason I am most thankful to all of my supervisors, it is that they believed in me every step of the way, and I cannot thank them enough for that. Self-doubt haunted me fre-quently, but they never doubted me and it has kept me going. Thank you all.

58
RESEARCH PARTNERS Thanks to my mentors, Dr. Mats Rosenlund and Dr. Niklas Juth, for making themselves avail-able for coffees and meetings to discuss my academic and professional goals.
When I first showed up at the HND Center, I felt like a goat in a horse pasture. I was walking on eggshells and trying to stay out of the way. I didn’t speak any Swedish, and so I felt like the strange American in a place where difficult decisions were being made. The HND Staff wel-comed me and helped me to let go of these feelings and settle into their work processes. Over time, I came to know many of them by name, and came to work with them to make this research more valuable. This research was significantly improved by their support, insights, and contri-butions.
The research owes thanks to each of the controllers and analysts at the hospital. Thank you for being patient with my onslaught of emails, questions, and unannounced visits as you helped me to understand cost accounting practices in your organization. We worked out many issues together, and came to some of the most interesting insights in this project through our meetings.
A special thanks to my doctoral colleague and co-researcher Gudrun Even for sitting through countless hours with me counting visits in patient journals, and for sitting for many more hours recording observational data at various outpatient clinics. The last manuscript stands on your work, and it was a great experience working with you.
Thank you to all other outpatient staff at the hospital for making room for the observational data collection and process mapping work.
Thank you to Ismael and Daniel for committing your Master’s theses to this research; for work-ing long and hard to collect and analyze observational data. Thank you, Ismael, for your in-credible work with R analyses and your ability to turn ideas into code. Both your contributions have a placed this work on a firm footing.
COLLEAGUES A big thank you to my colleagues within the Clinical Management Research Group. Rafiq Muhammad, Mairi Savage, Pamela Mazzocato, Carl Savage, Marie Storkholm, Padro Ramos, Nidhi Singh, Clara Fischer, Jens Jacob Fredriksson, Mats Brommels, and Karin Solberg Karls-son.
My friend and colleague, Rafiq, has sat for many hours discussing anything from research, to politics, family, and culture. We have worked together in this field for a long time and I cannot express my gratitude for your friendship, patience, and wisdom throughout this process enough.
Thank you Mairi. I guess it’s going on a decade ago now since we first stepped onto the KI campus as Masters students to begin this long journey into health economics, policy, and man-agement research. You are an inspiration to work with. You have shown incredible leadership, professionalism, kindness, compassion, and a supportive smile that keeps the room at peace

59
and moving forward. You aren’t afraid to speak your mind, and you inspire truth in people, and me. Thank you.
Thank you Karin for always being willing to share your support, and for being so fantastically reliable. I’ve enjoyed getting to know you and sharing an office space over the years, talking about life, work, and sharing laughs.
Pedro, thank you for stopping me and asking me about my research at KI at that conference in, Hamburg was it? I won’t forget the first day you walked into the office. It has been great getting to know you.
Thank you Christian Guttman, a skillful researcher, writer, and gifted thinker who has always been a voice of logic in the development of methods and manuscripts.
Many thanks to the “Supercore crew” of Sara Korlen, Anne Leppänen, Sofia Svereus, Mairi Savage, and Rafiq Muhammad for meeting together regularly to discuss our doctoral student experiences and support each other through this unique time in our careers. It was a privilege sharing this experience with you, and because of your friendships, I never felt alone in this process.
Thank you Monica Nyström Niklas Zethraeus, Vibeke Sparring, Taina Mäntaranta, and Clas Reinberg for allowing me in on all of your teaching initiatives. Because of you, and some others mentioned here, I’ve come to love to teach. Thank you all.
Thank you for all of my other colleagues and staff at LIME for the many laughs, nights out, collaborations, and company through this journey.
Thanks to Sofia Svereus, Eva Hagel, Mesfin Tessma, and Daniel Olsson for being willing to discuss my quantitative questions as I randomly pop into your office. Thanks to Ingrid Smed-berg and Tomas Månsson for keeping me administrative on track, and for being patient with my last-minute requests for support.
Thanks to Carl Johan Sundberg for taking the time to always be a positive source of support, encouragement, and advice when I needed it, and for chairing my defense.
Thanks to Eva Wittbom, Birger Forsberg, Peter Graff, and Carola Lemne for serving as com-mittee members during the viva. Eva, Birger, and Peter provided valuable feedback at my half-time seminar members. Thank you, Carola for agreeing to serve as a committee member so late in the process. And thank you to Markus Lingman for agreeing to be the opponent at my viva.
REVIEWERS
A special thanks to all of the reviewers who took their time to review my work, and ensure its validity for publication. A special thanks to Robert Kaplan and Jonathan Stokes for their con-tributions to Study III.

60
FRIENDS
Thank you to all my friends, too many to name, for always being voices of support and under-standing. You kept me sane. Especially Finn Fröst, Marcus Bergman, Jessica Lambert, Jan Dilberowic, Mat Dyczynski, David Schimdt, David Grommisch, Darrel Johnsson (DJ), Wolf-gang Hofmeister, Francesca Bignami, Nadim Anani, Annelise Lilienthal, Carolina Wann-heden, and John Östholm.
FAMILY Thanks to my three brothers for not letting me get too serious, and for being such great friends.
Thanks to my Mother for checking in on me, being an open ear, and providing me with ac-counting pointers here and there.
Thanks to my father, Dr. James F. Keel III, for his inputs on my research throughout this pro-cess, and for taking the time to tease out errors in my text before printing.
Thanks to my son Hayden for being the source of motivation and inspiration in my work and life.
Thanks to my partner, Anna, for mindfully and patiently supporting me through this last stretch of my journey. I look forward to where our future is headed.

61
11 REFERENCES
ADAM, T., EVANS, D. B. & MURRAY, C. J. 2003. Econometric estimation of country-specific hospital costs. Cost Eff Resour Alloc, 1, 3.
BARNETT, P. G. 2009. An improved set of standards for finding cost for cost-effectiveness analysis. Med Care, 47, S82-8.
BERWICK, D. M., NOLAN, T. W. & WHITTINGTON, J. 2008. The triple aim: care, health, and cost. Health Aff (Millwood), 27, 759-69.
BHASKAR, R. 2013. A Realist Theory of Science, Taylor & Francis.
BOEHMER, K. R., ABU DABRH, A. M., GIONFRIDDO, M. R., ERWIN, P. & MONTORI, V. M. 2018. Does the chronic care model meet the emerging needs of people living with multimorbidity? A systematic review and thematic synthesis. PloS one, 13, e0190852-e0190852.
BOULT, C., GREEN, A. F., BOULT, L. B., PACALA, J. T., SNYDER, C. & LEFF, B. 2009. Successful models of comprehensive care for older adults with chronic conditions: evidence for the Institute of Medicine's "retooling for an aging America" report. J Am Geriatr Soc, 57, 2328-37.
BOYD, C. M. & FORTIN, M. 2010. Future of Multimorbidity Research: How Should Understanding of Multimorbidity Inform Health System Design? Public Health Reviews, 32, 451-474.
BUSSE, R., GEISSLER, A., AAVIKSOO, A., COTS, F., HAKKINEN, U., KOBEL, C., MATEUS, C., OR, Z., O'REILLY, J., SERDEN, L., STREET, A., TAN, S. S. & QUENTIN, W. 2013. Diagnosis related groups in Europe: moving towards transparency, efficiency, and quality in hospitals? BMJ, 346, f3197.
BUTTORFF, C., RUDER, T. & BAUMAN, M. 2017. Multiple Chronic Conditions in the United States. Santa Monica, CA: RAND Corporation.
CHAPMAN, C. S., KERN, A., LAGUECIR, A. & QUENTIN, W. 2016. Management accounting and efficiency in health services: the foundational role of cost analysis. In: CYLUS J., PAPANICOLAS I. & P.C., S. (eds.) Health system efficiency: How to make measurement matter for policy and management. Copenhagen (Denmark): European Observatory on Health Systems and Policies.
CHARLSON, M. E., CHARLSON, R. E., PETERSON, J. C., MARINOPOULOS, S. S., BRIGGS, W. M. & HOLLENBERG, J. P. 2008. The Charlson comorbidity index is adapted to predict costs of chronic disease in primary care patients. Journal of Clinical Epidemiology, 61, 1234-1240.
CHARLSON, M. E., POMPEI, P., ALES, K. L. & MACKENZIE, C. R. 1987. A new method of classifying prognostic comorbidity in longitudinal studies: development and validation. J Chronic Dis, 40, 373-83.
CLARKE, J. L., BOURN, S., SKOUFALOS, A., BECK, E. H. & CASTILLO, D. J. 2017. An Innovative Approach to Health Care Delivery for Patients with Chronic Conditions. Popul Health Manag, 20, 23-30.
COGHLAN, D., RASHFORD, N. S. & DE FIGUEIREDO, J. N. 2015. Organizational Change and Strategy: An Interlevel Dynamics Approach, Routledge, Taylor & Francis Group.

62
COLEMAN, K., AUSTIN, B. T., BRACH, C. & WAGNER, E. H. 2009. Evidence on the Chronic Care Model in the new millennium. Health affairs (Project Hope), 28, 75-85.
DE BRUIN, S. R., VERSNEL, N., LEMMENS, L. C., MOLEMA, C. C., SCHELLEVIS, F. G., NIJPELS, G. & BAAN, C. A. 2012. Comprehensive care programs for patients with multiple chronic conditions: a systematic literature review. Health Policy, 107, 108-45.
DEMEERE, N., STOUTHUYSEN, K. & ROODHOOFT, F. 2009. Time-driven activity-based costing in an outpatient clinic environment: development, relevance and managerial impact. Health Policy, 92, 296-304.
DRUMMOND, M. 2005. Methods for the economic evaluation of health care programmes, Oxford ; New York, Oxford University Press.
DUTTON, J. E., FAHEY, L. & NARAYANAN, V. K. 1983. Toward understanding strategic issue diagnosis. Strategic Management Journal, 4, 307-323.
EPSTEIN, N. E. 2014. Multidisciplinary in-hospital teams improve patient outcomes: A review. Surg Neurol Int, 5, S295-303.
EVEN, G., SPAAK, J., VON ARBIN, M., FRANZEN-DAHLIN, A. & STENFORS, T. 2019. Health care professionals' experiences and enactment of person-centered care at a multidisciplinary outpatient specialty clinic. J Multidiscip Healthc, 12, 137-148.
EVERED, R. & LOUIS, M. R. 1981. Alternative Perspectives in the Organizational Sciences: "Inquiry from the inside" and "Inquiry from the outside". The Academy of Management Review, 6, 385-395.
FLUXICON BV 2020. Disco. Eindhoven, The Netherlands.
FORTIN, M., SOUBHI, H., HUDON, C., BAYLISS, E. A. & VAN DEN AKKER, M. 2007. Multimorbidity's many challenges. BMJ, 334, 1016-7.
GRANEHEIM, U. H. & LUNDMAN, B. 2004. Qualitative content analysis in nursing research: concepts, procedures and measures to achieve trustworthiness. Nurse Educ Today, 24, 105-12.
GUBA, E. G. & LINCOLN, Y. S. 1994. Competing paradigms in qualitative research. Handbook of qualitative research. Thousand Oaks, CA, US: Sage Publications, Inc.
HAGGERTY, J. L. 2012. Ordering the chaos for patients with multimorbidity. BMJ, 345, e5915.
HEALY, M. & PERRY, C. 2000. Comprehensive criteria to judge validity and reliability of qualitative research within the realism paradigm. Qualitative Market Research: An International Journal, 3, 118-126.
HEIDER, A.-K. & MANG, H. 2020. Effects of Monetary Incentives in Physician Groups: A Systematic Review of Reviews. Applied Health Economics and Health Policy.
HENNRIKUS, W. P., WATERS, P., BAE, D. S., VIRK, S. S. & APURVA, S. S. 2012. Inside value revolution at Children's Hospital Boston: Time-driven Activity-based costing in Orthopedic surgery. The Harvard Orthopaedic Journal, 14, 50-57.
HSIEH, H. F. & SHANNON, S. E. 2005. Three approaches to qualitative content analysis. Qual Health Res, 15, 1277-88.
63
KAPLAN, R. S. & ANDERSON, S. R. 2004. Time-driven activity-based costing. Harv Bus Rev, 82, 131-8, 150.
KAPLAN, R. S. & ANDERSON, S. R. 2007. Time-driven activity-based costing : a simpler and more powerful path to higher profits, Boston, Harvard Business School Press.
KAPLAN, R. S. & PORTER, M. E. 2011. How to solve the cost crisis in health care. Harv Bus Rev, 89, 46-52, 54, 56-61 passim.
KAROLINSKA UNIVERSITY HOSPITAL 2019. Prislista för utomlänsvård samt för EU/EES och Schweiz 2019.
KORLÉN, S., ESSÉN, A., LINDGREN, P., AMER-WAHLIN, I. & VON THIELE SCHWARZ, U. 2017. Managerial strategies to make incentives meaningful and motivating. Journal of health organization and management, 31, 126-141.
LEHNERT, T., HEIDER, D., LEICHT, H., HEINRICH, S., CORRIERI, S., LUPPA, M., RIEDEL-HELLER, S. & KONIG, H. H. 2011. Review: health care utilization and costs of elderly persons with multiple chronic conditions. Med Care Res Rev, 68, 387-420.
LINDGREN, P. 2014. Remuneration in health care: models, effects, and recommendations.
MADDOX, K. E. J. & EPSTEIN, A. M. 2018. Using Bundled Payments to Improve the Patient Experience. Harv Bus Rev.
MANDAVIA, R., MEHTA, N., SCHILDER, A. & MOSSIALOS, E. 2017. Effectiveness of UK provider financial incentives on quality of care: a systematic review. Br J Gen Pract, 67, e800-e815.
MIHAILOVIC, N., KOCIC, S. & JAKOVLJEVIC, M. 2016. Review of Diagnosis-Related Group-Based Financing of Hospital Care. Health Serv Res Manag Epidemiol, 3, 2333392816647892.
MOHER, D., LIBERATI, A., TETZLAFF, J., ALTMAN, D. G. & GROUP, P. 2009. Preferred reporting items for systematic reviews and meta-analyses: the PRISMA statement. BMJ, 339, b2535.
NORBECK, T. B. 2013. Drivers of health care costs. A Physicians Foundation white paper - second of a three-part series. Mo Med, 110, 113-8.
OECD 2010. Health Care Systems: Getting more value for money. OECD Economics Department Policy Notes.
OECD 2011. Health reform : meeting the challenge of ageing and multiple morbidities, Paris, OECD.
OECD 2017. Health at a glance 2017 : OECD indicators, Paris, OECD.
OECD/EUROPEAN UNION 2018. Health expenditure in hospitals. Health at a Glance: Europe 2018: State of Health in the EU Cycle. Paris/European Union, Brussels: OECD Publishing.
PORTER, M. E. & LEE, T. H. 2013. The Strategy That Will Fix Health Care. Harvard Business Review, 91, 24-24.
PORTER, M. E. & TEISBERG, E. O. 2006. Redefining health care : creating value-based competition on results, Boston, Mass., Harvard Business School Press.
R CORE TEAM 2019. R: A Language and Environment for Statistical Computing. Vienna, Austria: R Foundation for Statistical Computing.

64
RAFIQ, M., KEEL, G., MAZZOCATO, P., SPAAK, J., SAVAGE, C. & GUTTMANN, C. Deep Learning Architectures for Vector Representations of Patients and Exploring Predictors of 30-Day Hospital Readmissions in Patients with Multiple Chronic Conditions. In: KOCH, F., KOSTER, A., RIAÑO, D., MONTAGNA, S., SCHUMACHER, M., TEN TEIJE, A., GUTTMANN, C., REICHERT, M., BICHINDARITZ, I., HERRERO, P., LENZ, R., LÓPEZ, B., MARLING, C., MARTIN, C., MONTANI, S. & WIRATUNGA, N., eds. Artificial Intelligence in Health, 2019// 2019 Cham. Springer International Publishing, 228-244.
SCHEIN, E. H. 2010. Organizational culture and leadership, San Francisco, Jossey-Bass.
SCHÖN, D. A. 1995. Knowing-In-Action: The New Scholarship Requires a New Epistemology. Change: The Magazine of Higher Learning, 27, 27-34.
SPAAK, J. 2015. Research plan: Integrated, Multidisciplinary, Person-centered Care for Patients With Complex Comorbidities: heart, kidney and diabetes - a randomized trial. Stockholm: Clinical Trials.gov.
STORKHOLM, M. H., MAZZOCATO, P., SAVAGE, M. & SAVAGE, C. 2017. Money's (not) on my mind: a qualitative study of how staff and managers understand health care's triple Aim. BMC Health Serv Res, 17, 98.
STURMBERG, J. P., O'HALLORAN, D. M. & MARTIN, C. M. 2012. Understanding health system reform - a complex adaptive systems perspective. J Eval Clin Pract, 18, 202-8.
UDPA, S. 1996. Activity-based costing for hospitals. Health Care Manage Rev, 21, 83-96.
VAN HARTEN, W. H. 2018. Turning teams and pathways into integrated practice units: Appearance characteristics and added value. International journal of care coordination, 21, 113-116.
VARE, P., NIKIPHOROU, E., HANNONEN, P. & SOKKA, T. 2016. Delivering a one-stop, integrated, and patient-centered service for patients with rheumatic diseases. SAGE Open Med, 4, 2050312116654404.
VERSNEL, N., WELSCHEN, L. M., BAAN, C. A., NIJPELS, G. & SCHELLEVIS, F. G. 2011. The effectiveness of case management for comorbid diabetes type 2 patients; the CasCo study. Design of a randomized controlled trial. BMC Fam Pract, 12, 68.
WEBER, C., BEAULIEU, M., DJURDJEV, O., ER, L., TAYLOR, P., IGNASZEWSKI, A., BURNETT, S. & LEVIN, A. 2012. Towards rational approaches of health care utilization in complex patients: an exploratory randomized trial comparing a novel combined clinic to multiple specialty clinics in patients with renal disease-cardiovascular disease-diabetes. Nephrol Dial Transplant, 27 Suppl 3, iii104-10.
WELFARE, S. N. B. O. H. A. 2007. Health and Medical Statistics Yearbook 2000 (Hälso-och sjukbårdsstatistik årsbok 2000). Stockholm, Sweden.
WHO. 2016. Integrated care models: an overview. WHO Regional Office for Europe.
WOLFF, J. L., STARFIELD, B. & ANDERSON, G. 2002. Prevalence, expenditures, and complications of multiple chronic conditions in the elderly. Arch Intern Med, 162, 2269-76.
ZUBER‐SKERRITT, O. 2002. Action research within organisations and university thesis writing. The Learning Organization, 9, 171-179.

65
12 APPENDIX 1: SYSTEMATIC REVIEW SEARCH STRATEGIES
Table 13: Search strategies for each journal
Database Search strategy
PubMed\MED-LINE
"time driven activity based cost*" OR "time-driven activity-based cost*" OR "TD-ABC" OR "TDABC" OR "time-driven activity based cost*" OR "time driven activity-based cost*" OR "time driven ABC*" OR "time driven activity based cost*" OR "time-driven activity-based cost*" OR "TD-ABC" OR "TD ABC" OR "time-driven activity based cost*" OR "time driven activity-based cost*" OR "time-driven ABC" OR "time-driven activity"
WebOfScience
"time driven activity based cost*" OR "time-driven activity-based cost*" OR "TD-ABC" OR "TDABC" OR "time-driven activity based cost*" OR "time driven activity-based cost*" OR "time driven ABC*" OR "time driven activity based cost*" OR "time-driven activity-based cost*" OR "TD-ABC" OR "TD ABC" OR "time-driven activity based cost*" OR "time driven activity-based cost*" OR "time-driven ABC" OR "time-driven activity"
EMBASE
("time driven activity based cost" OR "time-driven activity-based cost" OR "TD-ABC" OR "TDABC" OR "time-driven activity based cost" OR "time driven activity-based cost" OR "time driven ABC" OR "time driven activity based cost" OR "time-driven activity-based cost" OR "TD-ABC" OR "TD ABC" OR "time-driven activity based cost" OR "time driven activity-based cost" OR "time-driven ABC" OR "time-driven activity") AND ("time driven activity based costing" OR "time-driven activity-based costing" OR "TD-ABC" OR "TD ABC" OR "time-driven activity based costing" OR "time driven activity-based costing" OR "time driven ABC" OR "time driven activity based costing" OR "time-driven activity-based costing" OR "TD-ABC" OR "TD ABC" OR "time-driven activity based costing" OR "time driven activity-based costing" OR "time-driven ABC" OR "time-driven activity")
OvidSP
"time driven activity based cost*" OR "time-driven activity-based cost*" OR "TD-ABC" OR "TDABC" OR "time-driven activity based cost*" OR "time driven activity-based cost*" OR "time driven ABC*" OR "time driven activity based cost*" OR "time-driven activity-based cost*" OR "TD-ABC" OR "TD ABC" OR "time-driven activity based cost*" OR "time driven activity-based cost*" OR "time-driven ABC" OR "time-driven activity"
Scopus
"time driven activity based cost*" OR "time-driven activity-based cost*" OR "TD-ABC" OR "TDABC" OR "time-driven activity based cost*" OR "time driven activity-based cost*" OR "time driven ABC*" OR "time driven activity based cost*" OR "time-driven activity-based cost*" OR "TD-ABC" OR "TD ABC" OR "time-driven activity based cost*" OR "time driven activity-based cost*" OR "time-driven ABC" OR "time-driven activity"
CINAHL "time driven activity based cost*" OR "time-driven activity-based cost*" OR "TD-ABC" OR "TDABC" OR "time-driven activity based cost*" OR "time driven activity-based cost*" OR "time driven ABC*" OR "time driven activity based cost*" OR "time-driven activity-based cost*" OR "TD-ABC" OR "TD ABC" OR "time-driven activity based cost*" OR "time driven activity-based cost*" OR "time-driven ABC" OR "time-driven

66
Database Search strategy
activity"
Science Direct
(ALL("time driven activity based cost") OR ALL("time-driven activity-based cost") OR ALL("TD-ABC") OR ALL("TDABC") OR ALL("time driven activity-based cost") OR ALL("time-driven activity based cost") OR ALL("time driven ABC") OR ALL("time driven activity based cost") OR ALL("time-driven activity-based cost") OR ALL("time driven activity based costing") OR ALL("time-driven activity-based costing") OR ALL("TD-ABC") OR ALL("TD ABC") OR ALL("time driven activity-based costing") OR ALL("time-driven activity based costing") OR ALL("time driven ABC") OR ALL("time driven activity based costing") OR ALL("time-driven activity-based costing"))
Google Scholar ("time driven activity based cost*" OR TDABC OR "time driven ABC*" OR "TD ABC") AND (hospital OR hospitals OR health* OR Medicine OR Medical OR *Care OR clinic OR "Primary Care" OR "Practitioner" OR "patient*" OR "doctor" OR "physician")

67
13 APPENDIX 2: CDVCS WITH VISIT FREQUENCIES
Setting Process CDVC Visit count
Kidney clinic
Nurse phone consultation Traditional care year 2 1 Physician phone consultation Traditional care 1
Physician Visit Traditional care 3 Physician Visit Traditional care crossed to HND 1
Cardiology clinic
Nurse phone consultation HND care 1 Nurse phone consultation Traditional care crossed to HND 1
Nurse Visit HND care 2 Nurse Visit Traditional care 1 Nurse Visit Traditional care year 2 2 Nurse Visit Traditional care crossed to HND 2
Physician phone consultation HND care year 2 1 Physician phone consultation Traditional care 2
Physician Visit HND care 1 Physician Visit HND care year 2 3 Physician Visit Traditional care 3 Physician Visit Traditional care year 2 3 Physician Visit Traditional care crossed to HND 4
HND Center
New Visit HND care 6 New Visit HND care year 2 5 New Visit Traditional care crossed to HND 9
Nurse phone consultation HND care 93 Nurse phone consultation HND care year 2 90 Nurse phone consultation Traditional care 1 Nurse phone consultation Traditional care crossed to HND 37
Nurse Visit HND care 35 Nurse Visit HND care year 2 48 Nurse Visit Traditional care crossed to HND 15
Physician phone consultation HND care 12 Physician phone consultation HND care year 2 20 Physician phone consultation Traditional care 1 Physician phone consultation Traditional care crossed to HND 4
Physician Visit HND care 19 Physician Visit HND care year 2 32 Physician Visit Traditional care 2 Physician Visit Traditional care crossed to HND 13
Team Conference HND care 19 Team Conference HND care year 2 29 Team Conference Traditional care crossed to HND 14
Team Visit HND care 35 Team Visit HND care year 2 25 Team Visit Traditional care crossed to HND 16

68
15 APPENDIX 3: PROCESS MAPS IN TABULAR FORM
Department Process Resource Activity Minutes Cardiology Clinic
New Visit Physician Post-consult chart update 11.15 New Visit Physician Physician Consultation 25.89
Physician Telephone consulta-tion Physician Post call chart update 3.50
Physician Visit Physician Pre-consult preparation 4.86 Physician Telephone consulta-
tion Physician Telephone consultation prepara-tion 4.00
Physician Visit Physician Physician Consultation 24.79 Physician Visit Physician Post-consult chart update 8.58
New Visit Physician Pre-consult preparation 7.00 Team Visit Physician Physician Consultation 21.50
Physician Telephone consulta-tion Physician Telephone consultation 6.33
Nurse telephone consultation RN Telephone consultation 6.88 New Visit RN Nurse Consultation 14.00
Nurse telephone consultation RN Post call chart update 2.33 Nurse Visit RN Vitals 9.00
Nurse telephone consultation RN Follow-up Scheduling 2.92 Nurse Visit RN Nurse Consultation 28.10 Team Visit RN Nurse Consultation 35.50
Nurse telephone consultation RN Telephone consultation prepara-tion 2.33
HND Center Physician Telephone consulta-tion Physician Telephone consultation 7.00
New Visit Physician Physician Consultation 39.00 Physician Visit Physician Post-consult chart update 10.00
Physician Telephone consulta-tion Physician Post-consult chart update 10.00
Team Visit Physician Post-consult chart update 10.00 Nurse telephone consultation Physician Request support from physician 1.50
Team Conference Physician Pre-conference preparation 15.00 New Visit Physician Pre-consult preparation 9.00
Team Conference Physician Team Conference 21.00 New Visit Physician Post-consult chart update 10.00
Physician Telephone consulta-tion Physician Re-booked call prep 4.24
Team Visit Physician Discussion to plan visit 3.00 Physician Visit Physician Pre-consult preparation 5.00
Team Visit Physician Pre-consult preparation 9.00 Physician Visit Physician Physician Consultation 39.00
Team Visit Physician Physician & Nurse consultation 45.00 Physician Telephone consulta-
tion Physician Call-back 0.30
Team Conference Physician Post-conference chart update 15.00 Team Visit Physician Post-consultation discussion 1.50
Physician Telephone consulta-tion Physician Pre-consult preparation 5.00
New Visit RN Nurse Consultation 45.00 New Visit RN Follow-up Scheduling 5.00 New Visit RN Post-consult chart update 10.00 New Visit RN Pre-consult preparation 7.00 New Visit RN Vitals 5.00
Nurse telephone consultation RN Call-back 0.30 Nurse telephone consultation RN Post-consult chart update 7.00 Nurse telephone consultation RN Pre-consult preparation 5.00 Nurse telephone consultation RN Re-booked call prep 4.24
Team Visit RN Vitals 7.50 Nurse telephone consultation RN Request support from physician 2.00

69
Department Process Resource Activity Minutes Nurse telephone consultation RN Second Telephone consultation 0.30 Nurse telephone consultation RN Telephone consultation 7.00
Nurse Visit RN Follow-up Scheduling 5.00 Nurse Visit RN Nurse Consultation 45.00 Team Visit RN Physician & Nurse consultation 45.00 Nurse Visit RN Post-consult chart update 10.00 Nurse Visit RN Pre-consult preparation 7.00 Nurse Visit RN Vitals 5.00
Team Conference RN Pre-conference preparation 1.00 Team Visit RN Discussion to plan visit 3.00
Team Conference RN Team Conference 14.00 Team Visit RN Post-consult chart update 7.00 Team Visit RN Post-consultation discussion 1.50 Team Visit RN Pre-consult preparation 7.00 Team Visit USK Follow-up Scheduling 12.50
Physician Visit USK Follow-up Scheduling 12.50 Physician Visit USK Vitals 15.00
Team Conference USK Team Conference 7.00 Kidney Clinic Physician Telephone consulta-
tion Physician Post-consult chart update 2.80
Nurse Visit Physician Request support from physician 6.30 Physician Visit Physician Post-consult chart update 6.60 Physician Visit Physician Pre-consult preparation 3.30
Physician Telephone consulta-tion Physician Physician telephone consultation 3.40
Physician Visit Physician Physician Consultation 21.10 Nurse telephone consultation RN Request support from physician 2.60
Nurse Visit RN Post-consult chart update 6.80 Nurse Visit RN Pre-consult preparation 5.90
Nurse telephone consultation RN Pre-consult preparation 2.40 Physician Visit RN Pre-consult preparation 7.20
Nurse telephone consultation RN Nurse Consultation 3.50 Nurse telephone consultation RN Post-consult chart update 4.20
Nurse Visit RN Nurse Consultation 44.90 Nurse Visit USK Pre-consult preparation 7.50
Physician Visit USK Follow-up Scheduling 7.50 Physician Visit USK Vitals 9.50
Nurse Visit USK Vitals 12.90 Physician Visit USK Pre-consult preparation 4.40

70

71
16 POPULAR SCIENCE SUMMARY: COUNTING WHAT COUNTS IN HEALTH CARE
It is difficult to ignore the discussion about how health care costs have been rising for decades and how most countries are forecast to increase national spending on health care through 2030. To put it bluntly, this is a problem. Health care resources are already spread thin, and providers are struggling to provide quality care under limited budgets. The consequences are felt through-out society, as patients wait in long queues, are faced with higher deductibles, pay more out of pocket, or simply don’t get the care they need. To put things in perspective, Sweden spent 7% of its national budget on health care at the start of the century, and now spends 11%. The US has gone from 13% to 18% over the same period.
At the core of this problem, ironically, is the fact that health care has substantially improved. People now survive chronic diseases longer than they used to; many survive long enough to develop multiple chronic conditions (MCCs). One in ten people has five or more chronic con-ditions, and more than half the population has at least two. There are a range of other factors that drive rising costs including patient lifestyles and advances in technologies, but MCC pa-tients require the bulk of health care resources. Health care policy makers, managers, and pro-viders haven’t managed to find a way to mitigate rising costs, and they’ve been working at it for decades. This thesis has worked to get at the core of this problem and attempts to lay a path forward for health care managers, clinicians, and policy makers to consider. We feel that the secret to fixing this problem may lie within the combination of two ideas.
The first idea is integrated multi-professional care within hospitals. Health care is divided into parts, where each part represents a field of medicine, like cardiology or pulmonology. These different parts all operate on their own, and don’t really work together much. Integrated care is a way of treating patients that brings together all the people and specialties that a patient with a certain type of condition can be expected to need in a coordinated, thought through manner.
The second idea is a modern cost-accounting tool called Time-Driven Activity-Based Costing (TDABC). TDABC is a unique cost-accounting tool that is relatively simple to apply and ap-propriate for costing care processes in health care but was difficult to apply to cost care for patients with multiple chronic conditions. This purpose of this thesis was to modify the TDABC costing approach for use on processes for patients with multiple chronic conditions, and then apply this modified method to cost care at an integrated multi-professional care center at a hospital.
The impact was impressive. The integrated care center had been established to treat patients with heart disease, chronic kidney disease, and diabetes. The center demonstrated that it was beneficial for patients, and patients and providers were clearly satisfied with the results, in particular the patient-centered approach. However, the center appeared to be expensive under the existing (and less accurate) costing system. The TDABC analysis demonstrated that the Center was actually saving the hospital four times what it cost to keep the center in operation! The implications of these findings are profound, because this analysis was of a single center

72
that accounts for less than 1% of the hospital’s budget. If the hospital were empowered to make heavy cost savings like this on a regular basis, massive savings could be realized. We hope that this research can help hospitals to begin to invest in a few key elements that make this kind of analysis a success. These elements include integrated multidisciplinary approaches to chronic care, improved information systems in hospitals, and a time-driven activity-based costing tool to process data and deliver actionable information.