council of state and territorial epidemiologists · the ohis that use data from state workers’...
TRANSCRIPT

Council of State and Territorial Epidemiologists
In collaboration withNational Institute for Occupational Safety and Health
Centers for Disease Control and Prevention
Putting Data to Work:Occupational Health Indicators from
Thirteen Pilot States for 2000October 2005

The Council of State and Territorial Epidemiologists (CSTE) in collaboration with the National Institute for Occupational Safety and Health (NIOSH) within
the Centers for Disease Control and Prevention (CDC) are pleased to present the results of the pilot of CSTE’s Occupational Health Indicators. CSTE would like
to acknowledge the workgroup members for their numerous contributions to this document, namely for collecting data, offering technical advice and prepar-
ing the report. CSTE would also like to thank the Bureau of Labor Statistics and the Occupational Safety and Health Administration in the U.S. Department
of Labor for facilitating state access to data for several of the indicators. This report would not be possible without the cooperation of state health depart-
ments and their federal occupational health partners.
CSTE produced this report with support from Cooperative Agreement # AU60/CCU007277 between CDC and CSTE.
Suggested Citation: Council of State and Territorial Epidemiologists. Putting Data to Work: Occupational Health Indicators from Thirteen Pilot States for 2000.
September 2005.
Putting Data to Work: Occupational Health Indicators from Thirteen Pilot States for 2000
Foreword The Council of State and Territorial Epidemiologists (CSTE) has worked collaboratively with the National Institute for OccupationalSafety and Health (NIOSH) to develop a set of occupational health indicators (OHIs). A good indicator anticipates early problem areasfor attention. Outcomes of a system that utilizes indicators are ably demonstrated in this document, and serves as an important mile-stone in the progress towards a national system of occupational health surveillance.
Like other public health problems, those in the workplace are preventable. When the effect of an exposure or hazard can be measured,it is often possible and more feasible to construct useful preventative measures.
The states and federal government need to be able to measure the baseline health of their populations and changes that take placeover time. A standard set of indicators allow for assessment and monitoring of the overall health and also provides comparisons whichenhance the usefulness of the indicators in policy development, service planning and evaluation. The set of OHIs presented here ispart of a larger national process of public health indicator development including injury, environmental, chronic disease and the“Leading Health Indicators” of the Healthy People 2010 project.
As a comprehensive and recommended set of measures, these OHIs are intended to increase the consistency and availability of occu-pational disease and injury surveillance data at the state and federal levels. Epidemiologists and other public health professionals canuse these materials to enhance surveillance, generate hypotheses and serve as reference material as they develop, implement and eval-uate public heath prevention activities.
A Workgroup of state CSTE representatives went through a multi-year process of defining 19 OHIs. Thirteen states then agreed to pilotthe generation of data from 2000 for these 19 OHIs, and this document presents the results of that pilot. The data provide a baselinefrom which comparisons and trends over time can be tracked.
CSTE and NIOSH look forward to working together to sustain the existing occupational health indicator project, involving more states,and expanding activity to ensure a comprehensive system for tracking work-related injury and illness.
C. Mack Sewell, DrPH, MS John Howard, M.D.CSTE President Director, NIOSH
JANE MCGINNIS, Nebraska Department of Health and Human Services
STEPHANIE MORAGA-MCHALEY, University of New Mexico School of Medicine
KAREN MULLOY, University of New Mexico School of Medicine
JOHN MYERS, National Institute for Occupational Safety and Health
WILLIAM PATE, North Carolina Department of Health and Human Services
RUKMANI RAMASPRAD, New Jersey Department of Health and Senior Services
FLORENCE REINISCH, California Department of Health Services
ROBERT ROSCOE, National Institute for Occupational Safety and Health
KENNETH ROSENMAN, Michigan State University
LEE SANDERSON, National Institute for Occupational Safety and Health
PATRICIA SCHLIEFF, National Institute for Occupational Safety and Health
ANDREW SMITH, Maine Department of Health and Human Services
MARTHA STANBURY, Michigan Department of Community Health
THOMAS ST. LOUIS, Connecticut Department of Public Health
JOHN SESTITO, National Institute for Occupational Safety and Health
CATHERINE THOMSEN, Oregon Department of Human Services
DAVID VALIANTE, New Jersey Department of Health and Senior Services
JENNIFER WOLF, New Jersey Department of Health and Senior Services
Putting Data to Work: Occupational Health Indicators from Thirteen Pilot States for 2000
ContributorsHENRY ANDERSON, Wisconsin Department of Health and Family Services
CARRIE BRETON, Massachusetts Department of Public Health
DAVID BONAUTO, Washington Department of Labor and Industries
GEOFFERY CALVERT, National Institute for Occupational Safety and Health
ROBERT CASTELLAN, National Institute for Occupational Safety and Health
DAWN CASTILLO, National Institute for Occupational Safety and Health
CHRISTY CURWICK, Washington Department of Labor and Industries
LETITIA DAVIS, Massachusetts Department of Public Health
ALICIA FLETCHER, New York State Department of Health
BRETT FOLEY, Nebraska Department of Health and Human Services
KITTY GELBERG, New York State Department of Health
ROBERT HARRISON, California Department of Health Services
KITTY HERRIN, North Carolina Department of Health and Human Services
KM MONIRUL ISLAM, Wisconsin Department of Health and Family Services
THOMAS LARGO, Michigan Department of Community Health
KIM LIM, Maine Department of Labor
BARBARA MATERNA, California Department of Health Services
ALFRED MAY, Maine Department of Health and Human Services
JACKIE MCCLAIN, Council of State and Territorial Epidemiologists

Table of ContentsIntroduction . . . . . . . . . . . . . . . . . . . . . . . . . . . . . . . . . . . . . . . . . . . . . . . . . . . . . . . . . . . . . . . . 1Employment Demographics Profile . . . . . . . . . . . . . . . . . . . . . . . . . . . . . . . . . . . . . . . . . . . . . . . . . 4Indicator 1: Non-Fatal Injuries and Illnesses Reported by Employers . . . . . . . . . . . . . . . . . . . . . . . . 7Indicator 2: Work-Related Hospitalizations . . . . . . . . . . . . . . . . . . . . . . . . . . . . . . . . . . . . . . . . . 10Indicator 3: Fatal Work-Related Injuries . . . . . . . . . . . . . . . . . . . . . . . . . . . . . . . . . . . . . . . . . . . 12Indicator 4: Amputations Reported by Employers . . . . . . . . . . . . . . . . . . . . . . . . . . . . . . . . . . . . 14Indicator 5: Amputations Identified in State Workers’ Compensation Systems . . . . . . . . . . . . . . . . 16Indicator 6: Hospitalizations for Work-Related Burns . . . . . . . . . . . . . . . . . . . . . . . . . . . . . . . . . . 19Indicator 7. Musculoskeletal Disorders Reported by Employers . . . . . . . . . . . . . . . . . . . . . . . . . . . 21Indicator 8: Carpal Tunnel Syndrome Cases Identified in State Workers’ Compensation Systems . . . . 24Indicator 9: Pneumoconiosis Hospitalizations . . . . . . . . . . . . . . . . . . . . . . . . . . . . . . . . . . . . . . . 27Indicator 10: Pneumoconiosis Mortality . . . . . . . . . . . . . . . . . . . . . . . . . . . . . . . . . . . . . . . . . . . . 30Indicator 11: Acute Work-Related Pesticide Poisonings Reported to Poison Control Centers . . . . . . . . 33Indicator 12: Incidence of Malignant Mesothelioma. . . . . . . . . . . . . . . . . . . . . . . . . . . . . . . . . . . . 35Indicator 13: Elevated Blood Lead Levels among Adults . . . . . . . . . . . . . . . . . . . . . . . . . . . . . . . . . 37Indicator 14: Workers Employed in Industries with High Risk for Occupational Morbidity . . . . . . . . . 40Indicator 15: Workers Employed in Occupations with High Risk for Occupational Morbidity . . . . . . . 42Indicator 16: Workers Employed in Industries and Occupations with High Risk for
Occupational Mortality . . . . . . . . . . . . . . . . . . . . . . . . . . . . . . . . . . . . . . . . . . . . . . 44Indicator 17: Occupational Safety and Health Professionals . . . . . . . . . . . . . . . . . . . . . . . . . . . . . . 46Indicator 18. Occupational Safety and Health Administration (OSHA) Enforcement Activities . . . . . . 49Indicator 19: Workers’ Compensation Awards . . . . . . . . . . . . . . . . . . . . . . . . . . . . . . . . . . . . . . . . 53Data Sources . . . . . . . . . . . . . . . . . . . . . . . . . . . . . . . . . . . . . . . . . . . . . . . . . . . . . . . . . . . . . . . 55Glossary. . . . . . . . . . . . . . . . . . . . . . . . . . . . . . . . . . . . . . . . . . . . . . . . . . . . . . . . . . . . . . . . . . . 67References . . . . . . . . . . . . . . . . . . . . . . . . . . . . . . . . . . . . . . . . . . . . . . . . . . . . . . . . . . . . . . . . . 69Appendix A . . . . . . . . . . . . . . . . . . . . . . . . . . . . . . . . . . . . . . . . . . . . . . . . . . . . . . . . . . . . . . . . 74Appendix B . . . . . . . . . . . . . . . . . . . . . . . . . . . . . . . . . . . . . . . . . . . . . . . . . . . . . . . . . . . . . . . . 75Appendix C . . . . . . . . . . . . . . . . . . . . . . . . . . . . . . . . . . . . . . . . . . . . . . . . . . . . . . . . . . . . . . . . 76
Putting Data to Work: Occupational Health Indicators from Thirteen Pilot States for 2000

Putting Data to Work: Occupational Health Indicators from Thirteen Pilot States for 2000

measure the effectiveness of prevention activities,and to identify workplace health and safety prob-lems that need further investigation.
Although there is a comprehensive national sur-veillance system for fatal occupational injuries,the current nationwide system for surveillance ofoccupational illnesses and non-fatal occupationalinjuries has substantial gaps. Recognizing theneed for more comprehensive occupational healthsurveillance data, the Council of State andTerritorial Epidemiologists (CSTE) convened aworkgroup of State and Federal occupationalhealth professionals. In October 2003, CSTE pub-lished Occupational Health Indicators: A Guide for
Tracking OccupationalHealth Conditions and TheirDeterminants, which detailsa core set of occupationalhealth indicators (OHIs)identified and developed bythe workgroup.3 These OHIsare a set of surveillancemeasures that allow statesand territories to uniformlydefine, collect, and reportoccupational illness, injury,
More than 135 million individuals work inthe United States. Every year, millionsof these workers are injured on the job
or become ill as a result of exposure to healthhazards at work. These work-related injuries andillnesses result in substantial human and eco-nomic costs not only for workers and employers,but also for society at large. Workers’ compensa-tion claims alone cost approximately $46 billionin 2000.1 It has been estimated that the directand indirect costs of work-related injuries and ill-nesses exceed $170 billion annually.2
Work-related injuries and illnesses can be pre-vented. Successful approaches to makingworkplaces safer andhealthier begin with hav-ing the data necessary tounderstand the problem.Public health surveillancedata are needed to deter-mine the magnitude ofwork-related injuries andillnesses, identify workersat greatest risk, and estab-lish prevention priorities.Data are also necessary to
Introduction 1
Putting Data to Work: Occupational Health Indicators from Thirteen Pilot States for 2000
Introduction
What is an OccupationalHealth Indicator?An occupational health indicator is a spe-cific measure of a work-related disease orinjury, or a factor associated with occupa-tional health, such as workplace exposures,hazards, or interventions, in a specified pop-ulation. These indicators can be generatedby states to track trends in the occupationalhealth status of the working population.

and risk data. They were selected because of theirimportance to public health and the availabilityof easily obtainable statewide data in most states.
CSTE’s published Occupational Health Indicatorsdocument3 defines 19 OHIs and one “EmploymentDemographics” profile. The document defineseach OHI by one or more measures of frequency.It also provides a brief discussion of the signifi-cance and limitations of the measure(s) andrecommendations for additional data analysis. A“how-to” guide outlining a step-by-step processfor generating individual state indicator data fol-lows each OHI definition.
This report presents the application of the OHImethodology in 13 states that participated in apilot project of these indicators for the year 2000.The report begins with demographic profiles ofthe workforce in the U.S. and participating states.Each OHI measure is presented with 2000 datalisted alphabetically by state in each figure andtable. A brief narrative about the significance ofthe OHI precedes each indicator’s data. Whereavailable, information for the nation is providedas a basis for comparison. A description of thedata sources used to generate the OHIs, includingsignificant data limitations, is provided after theOHI chapters (see page 61).
Putting Data to Work: Occupational Health Indicators from Thirteen Pilot States for 2000
Occupational Health Indicators
Employment Demographics Profile n Non-fatal injuries and illnesses reported by employersn Work-related hospitalizationsn Fatal work-related injuriesn Amputations reported by employersn Amputations identified in state workers’ compensa-
tion systemsn Hospitalizations for work-related burnsn Musculoskeletal disorders reported by employersn Carpal tunnel syndrome cases identified in state
workers’ compensation systemsn Pneumoconiosis hospitalizationsn Pneumoconiosis mortalityn Acute work-related pesticide poisonings reported to
poison control centersn Incidence of malignant mesothelioman Elevated blood lead levels among adultsn Workers employed in industries with high risk for
occupational morbidityn Workers employed in occupations with high risk for
occupational morbidityn Workers in occupations and industries with high risk
for occupational mortalityn Occupational health and safety professionalsn OSHA enforcement activitiesn Workers’ compensation awards
2 Introduction

report of one year of data on the 19 OHIs from 13states, it is hoped that additional states will joinin this national initiative and that multiple yearsof data will be collected and presented. Statesand the nation as a whole can use these OHIs totarget resources and measure progress in prevent-ing work-related diseases and injuries.
The workgroup acknowledges significant limita-tions in the design of these OHIs, intrinsic to boththe nature of the OHIs and to the data sourcesupon which they rely. Because of these limita-tions, caution is advised when interpreting theOHIs. Data limitations that should be consideredare noted in the box.
Comparing data across states is not advised forthe OHIs that use data from state workers’ com-pensation systems because of the manydifferences across states in eligibility require-ments and other administrative factors that affectthe numbers and types of submitted claims.
These OHIs are meant to assist states in buildingcapacity for occupational health surveillance byproviding states with tools to generate importantinformation about occupational health status ofthe state population. The benefits of generatingthe OHIs extend beyond producing new data. Forexample, the process of generating the OHIs canhelp raise awareness, build capacity for usingavailable data, and open dialogue for future col-laboration with occupational health partnerswithin the state.
These data will be most useful when multipleyears of data are available to highlight trendsobserved within each state. By producing this
Putting Data to Work: Occupational Health Indicators from Thirteen Pilot States for 2000
Factors affecting quality andcomparability of Stateoccupational health indicator datan Underreporting of occupational injuries and
illnesses by employees, physicians, andemployers;
n Inadequate health care provider recognition ofoccupational injuries and illnesses;
n Difficulties in attributing diseases with longlatency from time of exposure to disease man-ifestation (e.g., silicosis) and/or frommulti-factorial causes (e.g., lung cancer) tooccupational causation;
n Possible exclusion of at-risk populations fromsurveillance (e.g., self-employed, military)
n Injury, illness, or death coding discrepancies;n State-specific differences in structure of
administrative databases used for surveillance(e.g., workers’ compensation, hospital dis-charge data).
Introduction 3

of the workforce, while Hispanics ranged from2.5% to 37.5%.
Table P2 provides the distributions of the work-force in the major industry and occupationclassifications by state. Among the industries,services employed the largest proportion of work-ers nationally (25.2%) and in all 13 states.Nationwide, agriculture employed the least(2.4%). The most notable differences across thesestates were in the proportion of workers in man-ufacturing of durable goods (3.5% to 17.8%) andagriculture (0.7% to 8.6%). There were fewer dif-ferences in the occupational distributions amongthe states. The most noteworthy was in farming,forestry, and fishing: the percentage of workers inthat occupation group ranged from 0.7% to 8.5%of the workforce.
As the United States moves into thetwenty-first century, its workforce ismore diverse than ever. This diversity in
age, race, ethnicity, and levels of employment incertain industries and occupations varies fromstate to state. State-to-state differences areimportant to consider because these workforcecharacteristics can impact rates of work-relatedinjury and illness.
Table P1 presents characteristics of the workingpopulation in the 13 participating states and theU.S. in 2000. The national unemployment ratewas 4.0%. Approximately 7.0% of workers wereself-employed (range among the states: 5.0% to11.8%) and one in six were employed part-time(range: 13.8% to 21.0%). Nearly one-thirdworked more than 40 hours per week (range:26.9% to 37.6%).
The gender composition of the workforce was verysimilar across states, with males comprising about53%. There were very minor differences amongthe states in worker age distributions. More sub-stantial differences were in state racial and ethniccompositions: Blacks ranged from 2.4% to 21.9%
Putting Data to Work: Occupational Health Indicators from Thirteen Pilot States for 2000
4 Employment Demographics Profile
Employment Demographics Profile
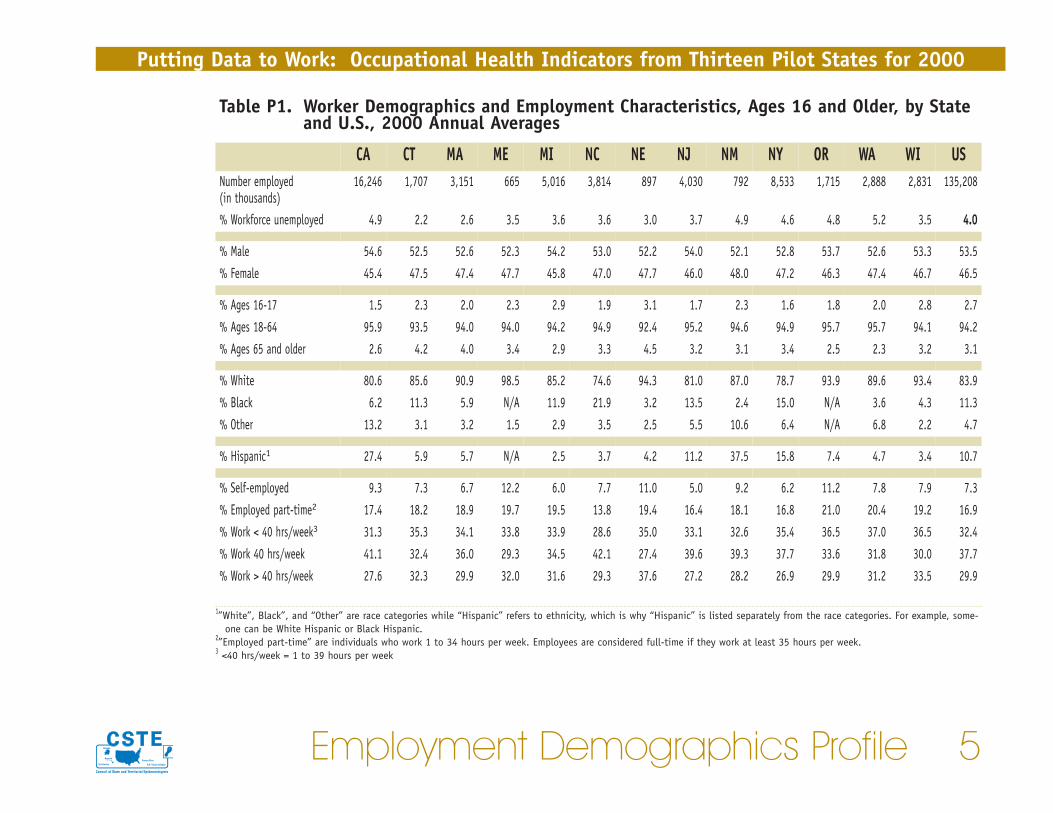
1”White”, Black”, and “Other” are race categories while “Hispanic” refers to ethnicity, which is why “Hispanic” is listed separately from the race categories. For example, some-one can be White Hispanic or Black Hispanic.
2”Employed part-time” are individuals who work 1 to 34 hours per week. Employees are considered full-time if they work at least 35 hours per week.3 <40 hrs/week = 1 to 39 hours per week
Employment Demographics Profile 5
Putting Data to Work: Occupational Health Indicators from Thirteen Pilot States for 2000
Table P1. Worker Demographics and Employment Characteristics, Ages 16 and Older, by Stateand U.S., 2000 Annual Averages
CA CT MA ME MI NC NE NJ NM NY OR WA WI USNumber employed (in thousands)
16,246 1,707 3,151 665 5,016 3,814 897 4,030 792 8,533 1,715 2,888 2,831 135,208
% Workforce unemployed 4.9 2.2 2.6 3.5 3.6 3.6 3.0 3.7 4.9 4.6 4.8 5.2 3.5 4.0
% Male 54.6 52.5 52.6 52.3 54.2 53.0 52.2 54.0 52.1 52.8 53.7 52.6 53.3 53.5
% Female 45.4 47.5 47.4 47.7 45.8 47.0 47.7 46.0 48.0 47.2 46.3 47.4 46.7 46.5
% Ages 16-17 1.5 2.3 2.0 2.3 2.9 1.9 3.1 1.7 2.3 1.6 1.8 2.0 2.8 2.7
% Ages 18-64 95.9 93.5 94.0 94.0 94.2 94.9 92.4 95.2 94.6 94.9 95.7 95.7 94.1 94.2
% Ages 65 and older 2.6 4.2 4.0 3.4 2.9 3.3 4.5 3.2 3.1 3.4 2.5 2.3 3.2 3.1
% White 80.6 85.6 90.9 98.5 85.2 74.6 94.3 81.0 87.0 78.7 93.9 89.6 93.4 83.9
% Black 6.2 11.3 5.9 N/A 11.9 21.9 3.2 13.5 2.4 15.0 N/A 3.6 4.3 11.3
% Other 13.2 3.1 3.2 1.5 2.9 3.5 2.5 5.5 10.6 6.4 N/A 6.8 2.2 4.7
% Hispanic1 27.4 5.9 5.7 N/A 2.5 3.7 4.2 11.2 37.5 15.8 7.4 4.7 3.4 10.7
% Self-employed 9.3 7.3 6.7 12.2 6.0 7.7 11.0 5.0 9.2 6.2 11.2 7.8 7.9 7.3
% Employed part-time2 17.4 18.2 18.9 19.7 19.5 13.8 19.4 16.4 18.1 16.8 21.0 20.4 19.2 16.9
% Work < 40 hrs/week3 31.3 35.3 34.1 33.8 33.9 28.6 35.0 33.1 32.6 35.4 36.5 37.0 36.5 32.4
% Work 40 hrs/week 41.1 32.4 36.0 29.3 34.5 42.1 27.4 39.6 39.3 37.7 33.6 31.8 30.0 37.7
% Work > 40 hrs/week 27.6 32.3 29.9 32.0 31.6 29.3 37.6 27.2 28.2 26.9 29.9 31.2 33.5 29.9

DATA SOURCES: Bureau of Labor Statistics’ Current Population Survey and Geographic Profile of Employment and Unemployment.
Putting Data to Work: Occupational Health Indicators from Thirteen Pilot States for 2000
6 Employment Demographics Profile
Table P2. Distribution of Workforce by Major Industry and Occupation Groups by State and U.S.,2000 Annual Averages
CA CT MA ME MI NC NE NJ NM NY OR WA WI USNumber Employed (in thousands) 16,246 1,707 3,151 665 5,016 3,814 897 4,030 792 8,533 1,715 2,888 2,831 135,208I N D U S T R Y% Construction 4.9 4.0 4.7 5.4 4.8 7.2 4.2 4.4 4.8 4.8 5.0 6.8 5.0 5.4% Manufacturing: Durable goods 8.7 11.0 8.9 6.2 17.8 10.4 6.0 5.4 3.5 6.2 10.8 8.0 13.8 8.8% Manufacturing: Nondurable goods 5.0 5.8 4.8 6.3 4.8 10.1 5.6 7.4 1.8 4.8 4.0 3.2 8.8 5.6% Transportation, communications, public utilities 5.3 4.6 4.3 4.1 4.0 4.7 5.8 7.6 5.2 5.8 5.7 5.2 4.8 5.7% Trade 18.3 17.2 18.0 20.9 20.5 18.8 18.3 19.3 21.5 17.6 19.7 20.5 17.8 19.4% Finance, insurance, real estate 5.3 8.6 7.0 5.1 4.8 4.7 7.5 8.6 4.4 7.7 4.6 5.9 5.4 5.8% Services 25.4 28.1 31.9 23.9 23.6 20.8 23.4 26.8 22.0 28.3 24.0 24.8 21.9 25.2% Government 13.8 11.8 12.2 13.8 11.9 13.3 14.0 14.3 22.7 16.5 12.1 15.1 12.4 14.1% Agriculture 3.3 0.9 1.1 2.4 1.9 2.6 8.6 0.7 2.7 1.3 3.9 2.7 3.0 2.4O C C U P A T I O N% Executive, administrative, managerial 15.6 16.9 17.5 12.2 13.9 13.5 13.0 16.6 14.1 14.3 15.9 15.2 12.5 14.6% Professional specialty 16.5 19.4 19.5 14.6 15.4 13.9 12.8 16.4 16.0 17.0 16.0 16.8 13.7 15.6% Technicians and related support 3.3 3.0 3.5 2.9 3.2 2.9 3.8 3.3 3.4 3.1 2.4 3.1 2.6 3.2% Sales 12.3 12.0 10.7 12.2 11.0 11.5 11.5 13.0 12.2 11.4 11.4 12.4 10.5 12.1% Administrative support including clerical 13.9 14.6 13.9 14.6 13.1 12.4 15.7 15.7 13.6 15.2 13.3 13.4 14.3 13.8% Service occupations 13.0 12.1 13.2 12.5 13.3 12.1 11.8 12.8 15.5 17.1 13.0 13.8 13.1 13.5% Precision production, craft, repair 10.2 9.9 10.0 12.9 11.4 13.1 10.1 9.5 11.7 9.1 10.5 10.6 12.3 11.0% Machine operators, assemblers, inspectors 4.9 4.5 4.7 5.3 8.8 9.2 4.8 4.4 2.8 3.9 4.9 3.7 8.5 5.4% Transportation, material moving 3.2 3.5 2.8 5.1 3.8 4.7 4.3 4.0 4.4 3.9 4.0 3.5 4.2 4.1% Handlers, equipment cleaners, helpers, laborers 3.8 3.2 3.0 3.8 4.1 4.4 3.7 3.5 3.2 3.5 4.4 3.8 5.2 4.0% Farming, forestry, fishing 3.3 0.8 1.2 4.2 1.9 2.5 8.5 0.7 2.9 1.5 1.7 3.6 3.1 2.5

appear until many years after the individualshave left employment.
The Bureau of Labor Statistics’ (BLS) AnnualSurvey of Occupational Injuries and Illnesses(Annual Survey) provides yearly estimates of thenumbers and incidence rates of work-relatedinjuries and illnesses at national and state levels.Information is collected from a nationwide sampleof employers on all work-related injuries and ill-nesses that result in death, lost work-time,medical treatment other than first aid, loss ofconsciousness, restriction of work activity, ortransfer to another job.
Work-related injuries are generallydefined as injuries that result from sin-gle events such as falls, being struck or
crushed by objects, electric shocks, or assaults.Work-related illnesses, such as asthma, silicosisand carpal tunnel syndrome, typically occur asthe result of longer-term exposure to hazardouschemicals, physical hazards (e.g., radiation,noise), or repeated stress or strain at work.Infectious diseases also can be caused by work-place exposures. It is more difficult to trackwork-related illnesses than injuries because manyof the conditions also can be caused by non-occu-pational factors. Also, many work-relatedillnesses take a long time to develop and may not
Indicator One 7
Putting Data to Work: Occupational Health Indicators from Thirteen Pilot States for 2000
INDICATOR 1:
Non-Fatal Injuries and Illnesses Reported by Employers
• Estimated annual number and rate of work-related injuries and illnessesamong private sector workers
• Estimated annual number and rate of work-related injuries and illnessesinvolving days away from work
• Estimated annual number of injuries and illnesses involving more than 10days away from work

sampling error. Additional data sources used ingenerating other occupational health indicatorsin this report provide important supplementaryinformation that, together with the AnnualSurvey, provides a more complete picture of occu-pational health in the states.
According to the Annual Survey, private sectorworkers nationwide sustained an estimated 5.7million work-related injuries and illnesses in2000, resulting in an annual incidence rate of6,100 per 100,000 full-time workers. Twenty-ninepercent (1.7 million) of these injuries and ill-
While the Annual Survey is a valuable source ofinformation about work-related injuries and ill-nesses, it is well recognized that it has a numberof limitations and underestimates the full extentof the problem. Excluded from the national esti-mates provided by the Annual Survey are publicsector workers, the self-employed, householdworkers, and workers on farms with fewer than 11employees. Together these sectors compriseapproximately 21% of the U.S. workforce.4
Occupational diseases are not well documented inthe Annual Survey and there is evidence thatinjuries are underreported5,6. It is also subject to
Putting Data to Work: Occupational Health Indicators from Thirteen Pilot States for 2000
8 Indicator One
0
1000
2000
3000
4000
5000
6000
7000
8000
9000
10000 Cases involving days away from workAll work-related injury and illness
Case
s pe
r 10
0,00
0 fu
ll-ti
me
wor
kers
USWIWAORNYNMNJNENCMIMEMACTCA
Figure 1: Rates of Non-Fatal Work-Related Injuries and Illnesses Reported by Private Sector Employers by State and U.S., 2000
6,100
6,700
5,500
9,000
8,100
5,300
1,900 2,100 2,200 2,700
1,800 1,400
2,100
6,600
4,900 4,400
3,900
6,300
8,500 8,900
6,100
1,800 1,600 1,900 1,900
2,600 2,500
1,800

The corresponding estimated numbers of cases bystate are presented in Table 1. Included in thistable are the numbers of cases resulting in morethan 10 days away from work. Nationwide, 11%of the reported cases resulted in more than 10lost workdays. This percentage ranged from 8.4%to 21.7% across these states.
nesses resulted in days away from work. Figure 1illustrates the rates of non-fatal injuries and ill-nesses for 13 states and the U.S. The rates of allwork-related injuries and illnesses varied acrossthese states, from 3,900 to 9,000 per 100,000 full-time workers. Rates involving days away fromwork ranged from 1,400 to 2,700, with more thanhalf of these states falling above the nationalaverage of 1,800 per 100,000 full-time workers.
Indicator One 9
Putting Data to Work: Occupational Health Indicators from Thirteen Pilot States for 2000
Table 1. Numbers of Non-Fatal Work-Related Injuries and Illnesses Reported by PrivateSector Employers by State and U.S., 2000
CA CT MA ME MI NC NE NJ NM NY OR WA WI USAll cases of work-relatedinjuries and illnesses
640,900 82,700 132,200 36,000 262,000 146,500 40,800 132,500 21,900 230,200 72,300 145,900 175,500 5,650,100
Cases involving days awayfrom work
201,300 25,600 52,800 10,900 59,500 37,300 12,900 50,200 7,700 112,900 22,300 44,400 49,500 1,664,000
Cases involving more than 10days away from work
88,752 8,967 18,477 3,721 24,430 12,356 4,603 19,831 2,560 49,846 7,653 14,609 16,465 639,373
DATA SOURCE: Bureau of Labor Statistics’ Annual Survey of Occupational Injuries and Illnesses
TECHNICAL NOTES:• The rates published by BLS are the number of injury and illness cases per 100 FTEs. The rates presented here, which are cases per 100,000
FTEs, were derived by multiplying BLS published rates by 1,000. These converted rates are not as precise as those that would be calculatedfrom the raw Annual Survey data.

work-related hospitalizations are for treatment ofmusculoskeletal disorders and acute injuries.7
State hospital discharge data are useful for sur-veillance of serious health conditions. Whilethese state data sets do not include explicitinformation about “work-relatedness” of thehealth conditions for which a patient is hospital-
I ndividuals hospitalized for work-relatedinjuries and illnesses have some of the mostserious and costly adverse work-related
health conditions. It has been estimated that,nationwide, approximately 3% of workplaceinjuries and illnesses result in hospitalizations,and that hospital charges for work-related condi-tions exceed $3 billion annually. Most identified
Putting Data to Work: Occupational Health Indicators from Thirteen Pilot States for 2000
10 Indicator Two
INDICATOR 2:
Work-Related Hospitalizations• Annual number and rate of hospitalizations of persons 16 years or older
with workers’ compensation reported as the primary payer
Figure 2: Rate of Work-Related Hospitalizations by State and U.S., 2000
143
128
112
50
113
86
112
166
176
192
130
142
179
Hos
piti
laza
tion
s pe
r 10
0,00
0 w
orke
rs
0
50
100
150
200
USWIWAORNYNM NENCMIMEMACTCA
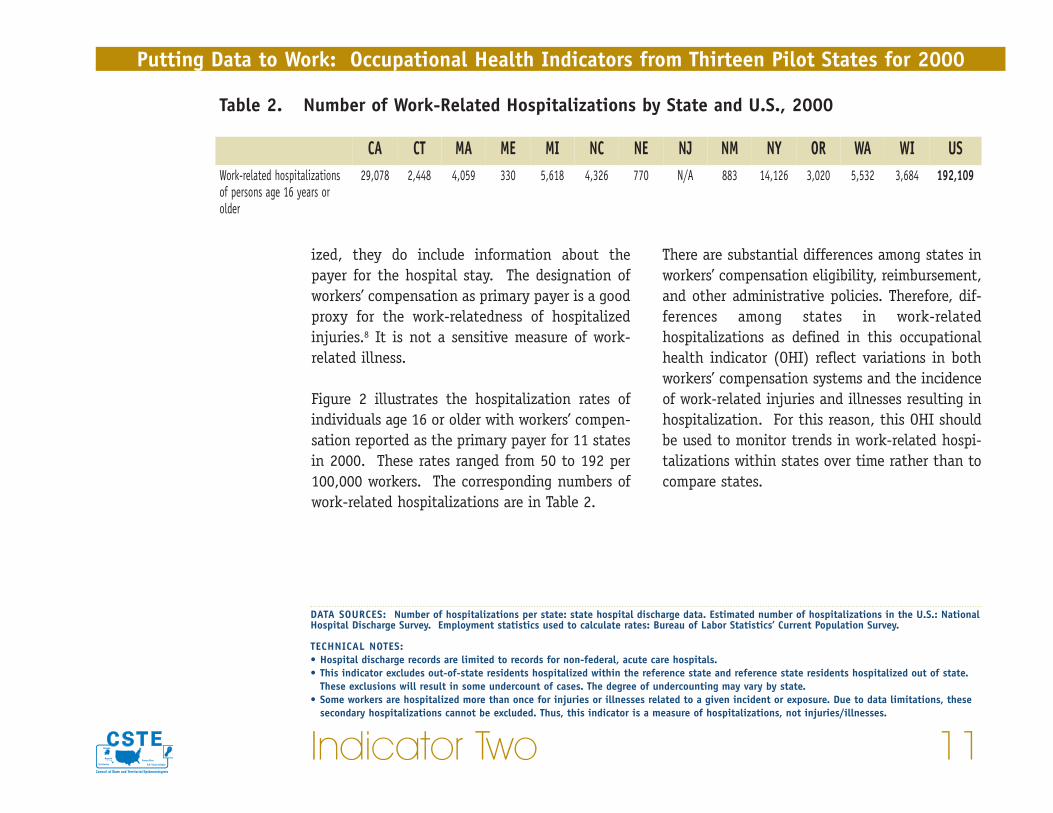
There are substantial differences among states inworkers’ compensation eligibility, reimbursement,and other administrative policies. Therefore, dif-ferences among states in work-relatedhospitalizations as defined in this occupationalhealth indicator (OHI) reflect variations in bothworkers’ compensation systems and the incidenceof work-related injuries and illnesses resulting inhospitalization. For this reason, this OHI shouldbe used to monitor trends in work-related hospi-talizations within states over time rather than tocompare states.
ized, they do include information about thepayer for the hospital stay. The designation ofworkers’ compensation as primary payer is a goodproxy for the work-relatedness of hospitalizedinjuries.8 It is not a sensitive measure of work-related illness.
Figure 2 illustrates the hospitalization rates ofindividuals age 16 or older with workers’ compen-sation reported as the primary payer for 11 statesin 2000. These rates ranged from 50 to 192 per100,000 workers. The corresponding numbers ofwork-related hospitalizations are in Table 2.
Indicator Two 11
Putting Data to Work: Occupational Health Indicators from Thirteen Pilot States for 2000
Table 2. Number of Work-Related Hospitalizations by State and U.S., 2000
CA CT MA ME MI NC NE NJ NM NY OR WA WI USWork-related hospitalizationsof persons age 16 years orolder
29,078 2,448 4,059 330 5,618 4,326 770 N/A 883 14,126 3,020 5,532 3,684 192,109
DATA SOURCES: Number of hospitalizations per state: state hospital discharge data. Estimated number of hospitalizations in the U.S.: NationalHospital Discharge Survey. Employment statistics used to calculate rates: Bureau of Labor Statistics’ Current Population Survey.
TECHNICAL NOTES:• Hospital discharge records are limited to records for non-federal, acute care hospitals.• This indicator excludes out-of-state residents hospitalized within the reference state and reference state residents hospitalized out of state.
These exclusions will result in some undercount of cases. The degree of undercounting may vary by state.• Some workers are hospitalized more than once for injuries or illnesses related to a given incident or exposure. Due to data limitations, these
secondary hospitalizations cannot be excluded. Thus, this indicator is a measure of hospitalizations, not injuries/illnesses.
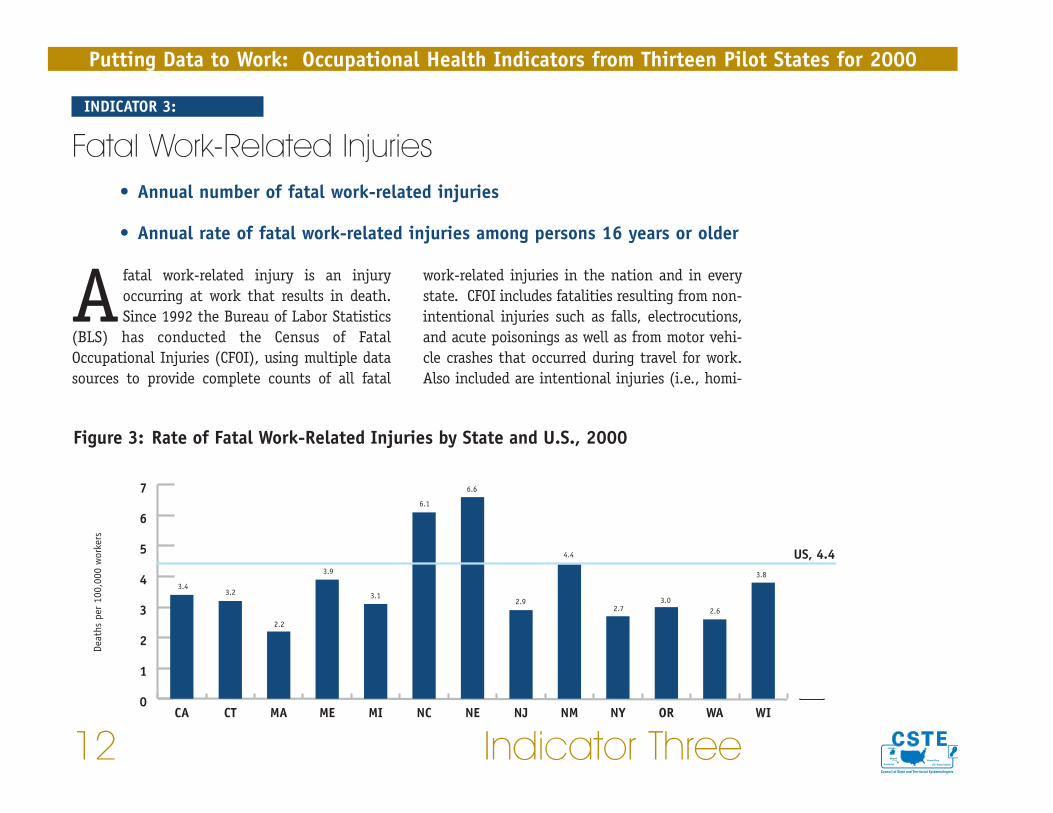
work-related injuries in the nation and in everystate. CFOI includes fatalities resulting from non-intentional injuries such as falls, electrocutions,and acute poisonings as well as from motor vehi-cle crashes that occurred during travel for work.Also included are intentional injuries (i.e., homi-
Afatal work-related injury is an injuryoccurring at work that results in death.Since 1992 the Bureau of Labor Statistics
(BLS) has conducted the Census of FatalOccupational Injuries (CFOI), using multiple datasources to provide complete counts of all fatal
Putting Data to Work: Occupational Health Indicators from Thirteen Pilot States for 2000
12 Indicator Three
INDICATOR 3:
Fatal Work-Related Injuries• Annual number of fatal work-related injuries
• Annual rate of fatal work-related injuries among persons 16 years or older
Figure 3: Rate of Fatal Work-Related Injuries by State and U.S., 2000
3.43.2
2.2
3.9
3.1
6.1
6.6
2.9
4.4
2.73.0
2.6
3.8
0
1
2
3
4
5
6
7
USWIWAORNYNMNJNENCMIMEMACTCA
Deat
hs p
er 1
00,0
00 w
orke
rs
US, 4.4
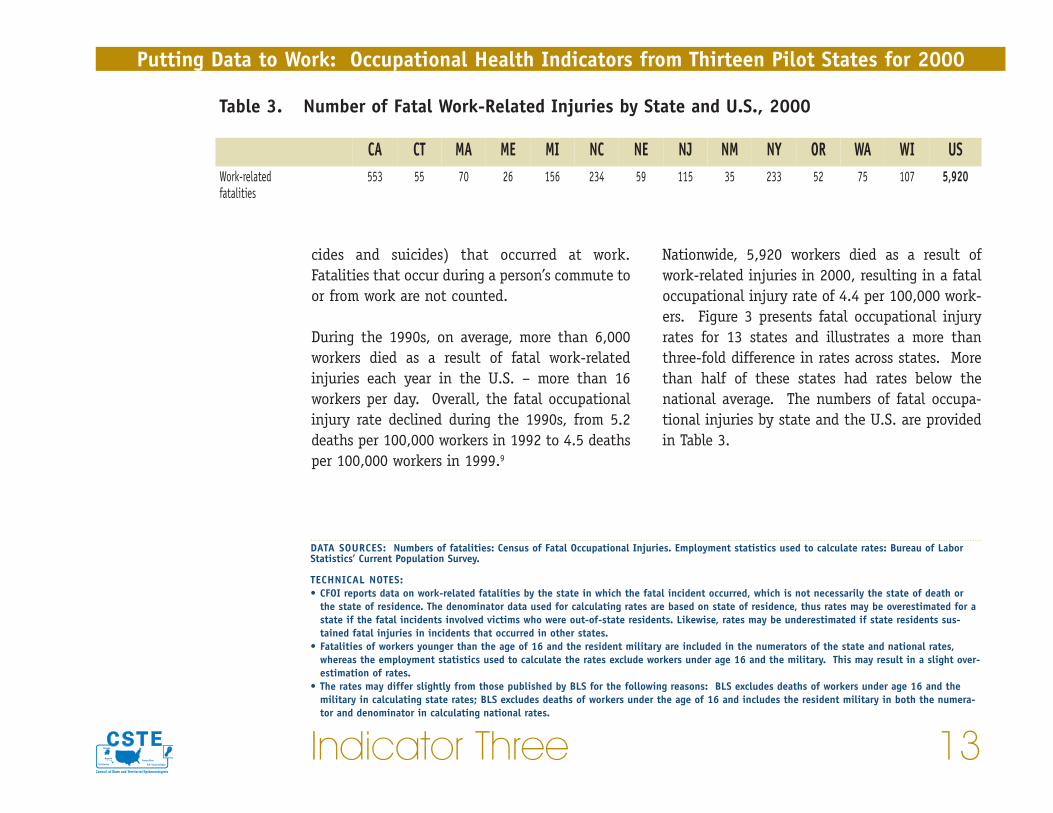
Nationwide, 5,920 workers died as a result ofwork-related injuries in 2000, resulting in a fataloccupational injury rate of 4.4 per 100,000 work-ers. Figure 3 presents fatal occupational injuryrates for 13 states and illustrates a more thanthree-fold difference in rates across states. Morethan half of these states had rates below thenational average. The numbers of fatal occupa-tional injuries by state and the U.S. are providedin Table 3.
cides and suicides) that occurred at work.Fatalities that occur during a person’s commute toor from work are not counted.
During the 1990s, on average, more than 6,000workers died as a result of fatal work-relatedinjuries each year in the U.S. – more than 16workers per day. Overall, the fatal occupationalinjury rate declined during the 1990s, from 5.2deaths per 100,000 workers in 1992 to 4.5 deathsper 100,000 workers in 1999.9
Indicator Three 13
Putting Data to Work: Occupational Health Indicators from Thirteen Pilot States for 2000
Table 3. Number of Fatal Work-Related Injuries by State and U.S., 2000
CA CT MA ME MI NC NE NJ NM NY OR WA WI USWork-related fatalities
553 55 70 26 156 234 59 115 35 233 52 75 107 5,920
DATA SOURCES: Numbers of fatalities: Census of Fatal Occupational Injuries. Employment statistics used to calculate rates: Bureau of LaborStatistics’ Current Population Survey.
TECHNICAL NOTES:• CFOI reports data on work-related fatalities by the state in which the fatal incident occurred, which is not necessarily the state of death or
the state of residence. The denominator data used for calculating rates are based on state of residence, thus rates may be overestimated for astate if the fatal incidents involved victims who were out-of-state residents. Likewise, rates may be underestimated if state residents sus-tained fatal injuries in incidents that occurred in other states.
• Fatalities of workers younger than the age of 16 and the resident military are included in the numerators of the state and national rates,whereas the employment statistics used to calculate the rates exclude workers under age 16 and the military. This may result in a slight over-estimation of rates.
• The rates may differ slightly from those published by BLS for the following reasons: BLS excludes deaths of workers under age 16 and themilitary in calculating state rates; BLS excludes deaths of workers under the age of 16 and includes the resident military in both the numera-tor and denominator in calculating national rates.
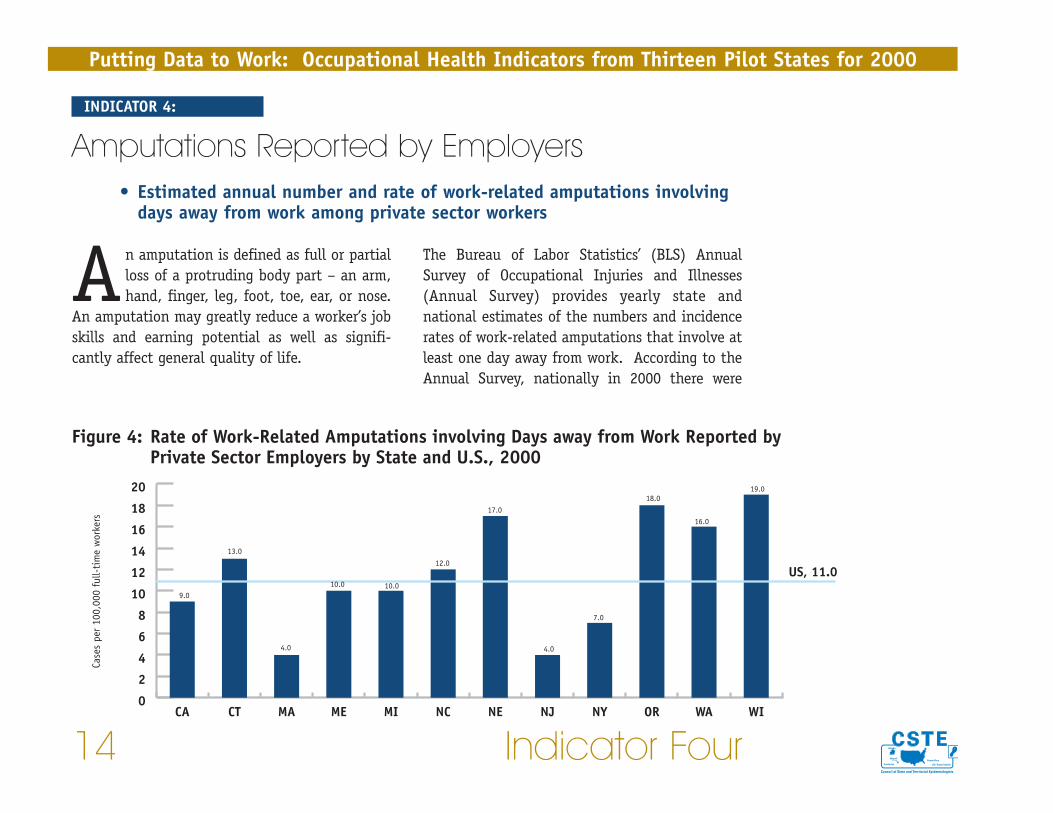
The Bureau of Labor Statistics’ (BLS) AnnualSurvey of Occupational Injuries and Illnesses(Annual Survey) provides yearly state andnational estimates of the numbers and incidencerates of work-related amputations that involve atleast one day away from work. According to theAnnual Survey, nationally in 2000 there were
An amputation is defined as full or partialloss of a protruding body part – an arm,hand, finger, leg, foot, toe, ear, or nose.
An amputation may greatly reduce a worker’s jobskills and earning potential as well as signifi-cantly affect general quality of life.
Putting Data to Work: Occupational Health Indicators from Thirteen Pilot States for 2000
14 Indicator Four
INDICATOR 4:
Amputations Reported by Employers• Estimated annual number and rate of work-related amputations involving
days away from work among private sector workers
Figure 4: Rate of Work-Related Amputations involving Days away from Work Reported by Private Sector Employers by State and U.S., 2000
9.0
13.0
4.0
10.0
12.0
17.0
4.0
7.0
18.0
16.0
19.0
0
2
4
6
8
10
12
14
16
18
20
USAWIWAORNYNJNENCMIMEMACTCA
Case
s pe
r 10
0,00
0 fu
ll-ti
me
wor
kers
US, 11.010.0

is a valuable source of information about work-related injuries, it has a number of limitations.Excluded from the estimates are public sectorworkers, the self-employed, household workers,and workers on farms with fewer than 11 employ-ees. Together these sectors compriseapproximately 21% of the U.S. workforce.4 Inaddition, there is evidence that injuries areunderreported on the Occupational Safety andHealth Administration (OSHA) logs.5,6 The AnnualSurvey is also subject to sampling error. Stateworkers’ compensation data used in Indicator 5 inthis report are another source of informationabout work-related amputations in the states.
9,658 workers in private industry who sustainedamputations that resulted in days lost from work.Ninety-one percent (91%) of these amputationsinvolved fingers. The median number of lostworkdays was 18 for amputation cases comparedto a median of six days for all work-relatedinjuries and illnesses, and 35% of the amputationcases involved loss of 31 or more days of work.
Figure 4 illustrates the estimated rates of work-related amputations for 12 states in 2000. Ratesranged from 4.0 to 19.0 per 100,000 full-timeworkers. The estimated numbers of amputationsby state are included in Table 4.
The Annual Survey is based on data collectedfrom a nationwide sample of employers. While it
Indicator Four 15
Putting Data to Work: Occupational Health Indicators from Thirteen Pilot States for 2000
DATA SOURCE: Bureau of Labor Statistics’ Annual Survey of Occupational Injuries and Illnesses
TECHNICAL NOTES:• The rates published by BLS are the number of amputation cases per 10,000 FTEs. The rates presented here, which are amputation cases per
100,000 FTEs, were derived by multiplying BLS published rates by 10. These converted rates are not as precise as those that would be calcu-lated from the raw Annual Survey data.
Table 4. Number of Work-Related Amputations involving Days away from Work Reported byPrivate Sector Employers by State and U.S., 2000
CA CT MA ME MI NC NE NJ NM NY OR WA WI USAmputations involving daysaway from work
960 163 84 40 312 342 104 117 N/A 420 201 282 375 9,658

The Bureau of Labor Statistics (BLS) estimatedthat nationally in 2000 there were 9,658 work-ers in private industry who sustained anamputation that resulted in days away fromwork. Ninety-one percent (91%) of these ampu-tations involved fingers.
An amputation is defined as full or partialloss of a protruding body part – an arm,hand, finger, leg, foot, toe, nose, or ear.
An amputation may greatly reduce a worker’s jobskills and earning potential as well as signifi-cantly affect general quality of life.
Putting Data to Work: Occupational Health Indicators from Thirteen Pilot States for 2000
16 Indicator Five
Figure 5: Rate of Lost Work Time Claims for Amputations identified in Workers’ CompensationSystems by State, 2000
7.5
10.0
8.4
11.010.1
7.9
6.2
16.0
6.3
8.1
0
2
4
6
8
10
12
14
16
18
WIWAORNM NENCMIMEMACT
Clai
ms
per
100,
000
wor
kers
INDICATOR 5:
Amputations Identified in State Workers’Compensation Systems
• Annual number and rate of amputations identified in state workers’compensation systems
tions within states over time rather than to com-pare states.
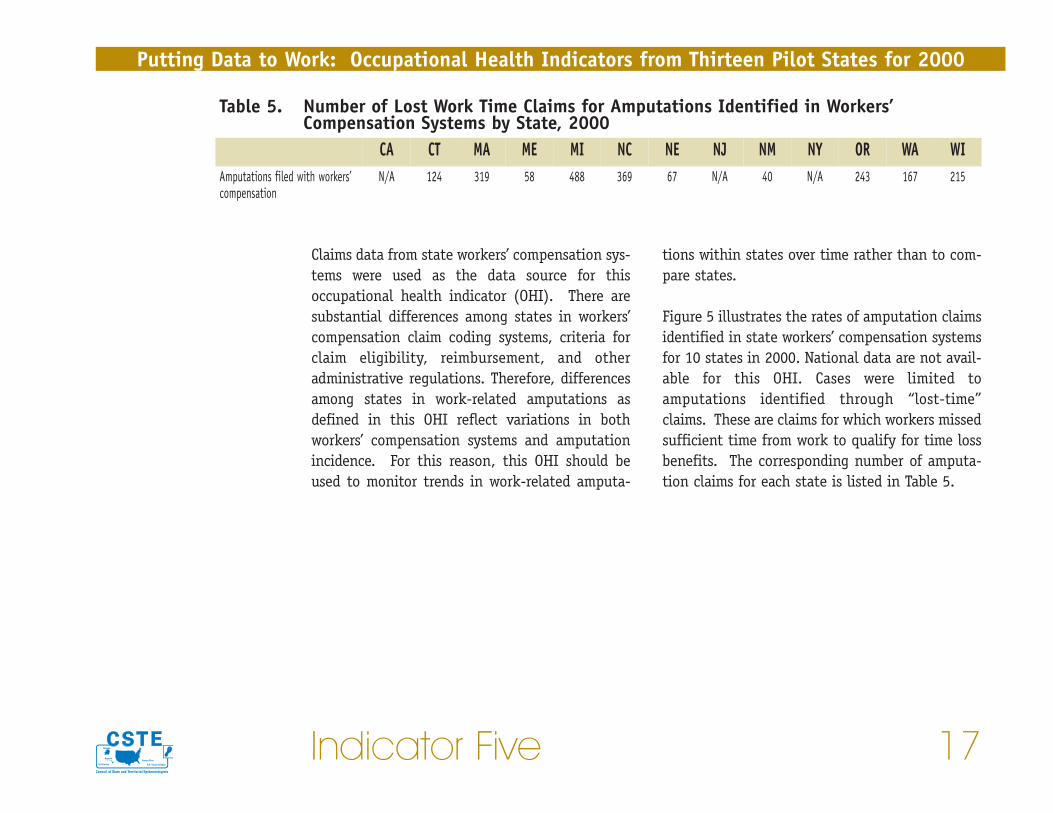
Figure 5 illustrates the rates of amputation claimsidentified in state workers’ compensation systemsfor 10 states in 2000. National data are not avail-able for this OHI. Cases were limited toamputations identified through “lost-time”claims. These are claims for which workers missedsufficient time from work to qualify for time lossbenefits. The corresponding number of amputa-tion claims for each state is listed in Table 5.
Claims data from state workers’ compensation sys-tems were used as the data source for thisoccupational health indicator (OHI). There aresubstantial differences among states in workers’compensation claim coding systems, criteria forclaim eligibility, reimbursement, and otheradministrative regulations. Therefore, differencesamong states in work-related amputations asdefined in this OHI reflect variations in bothworkers’ compensation systems and amputationincidence. For this reason, this OHI should beused to monitor trends in work-related amputa-
Indicator Five 17
Putting Data to Work: Occupational Health Indicators from Thirteen Pilot States for 2000
Table 5. Number of Lost Work Time Claims for Amputations Identified in Workers’Compensation Systems by State, 2000
CA CT MA ME MI NC NE NJ NM NY OR WA WIAmputations filed with workers’compensation
N/A 124 319 58 488 369 67 N/A 40 N/A 243 167 215
Putting Data to Work: Occupational Health Indicators from Thirteen Pilot States for 2000
18 Indicator Five
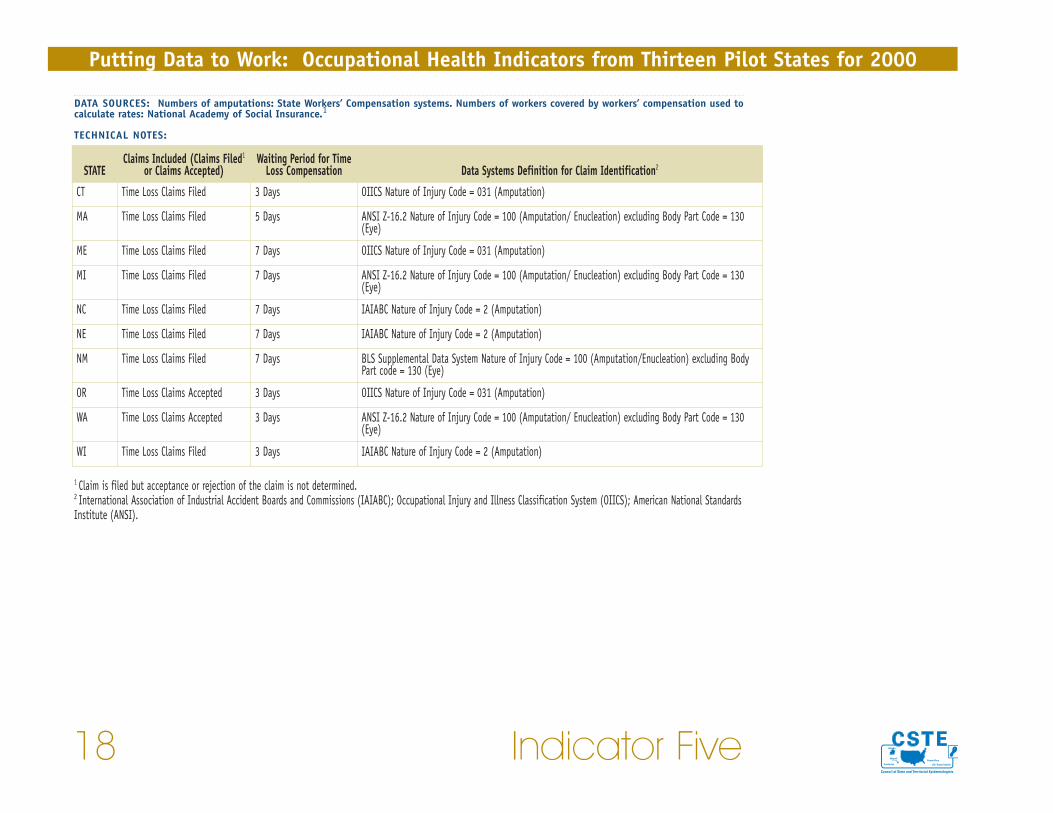
DATA SOURCES: Numbers of amputations: State Workers’ Compensation systems. Numbers of workers covered by workers’ compensation used tocalculate rates: National Academy of Social Insurance.1
TECHNICAL NOTES:
1 Claim is filed but acceptance or rejection of the claim is not determined.2 International Association of Industrial Accident Boards and Commissions (IAIABC); Occupational Injury and Illness Classification System (OIICS); American National StandardsInstitute (ANSI).
STATEClaims Included (Claims Filed1
or Claims Accepted)Waiting Period for Time
Loss Compensation Data Systems Definition for Claim Identification2
CT Time Loss Claims Filed 3 Days OIICS Nature of Injury Code = 031 (Amputation)
MA Time Loss Claims Filed 5 Days ANSI Z-16.2 Nature of Injury Code = 100 (Amputation/ Enucleation) excluding Body Part Code = 130(Eye)
ME Time Loss Claims Filed 7 Days OIICS Nature of Injury Code = 031 (Amputation)
MI Time Loss Claims Filed 7 Days ANSI Z-16.2 Nature of Injury Code = 100 (Amputation/ Enucleation) excluding Body Part Code = 130(Eye)
NC Time Loss Claims Filed 7 Days IAIABC Nature of Injury Code = 2 (Amputation)
NE Time Loss Claims Filed 7 Days IAIABC Nature of Injury Code = 2 (Amputation)
NM Time Loss Claims Filed 7 Days BLS Supplemental Data System Nature of Injury Code = 100 (Amputation/Enucleation) excluding BodyPart code = 130 (Eye)
OR Time Loss Claims Accepted 3 Days OIICS Nature of Injury Code = 031 (Amputation)
WA Time Loss Claims Accepted 3 Days ANSI Z-16.2 Nature of Injury Code = 100 (Amputation/ Enucleation) excluding Body Part Code = 130(Eye)
WI Time Loss Claims Filed 3 Days IAIABC Nature of Injury Code = 2 (Amputation)
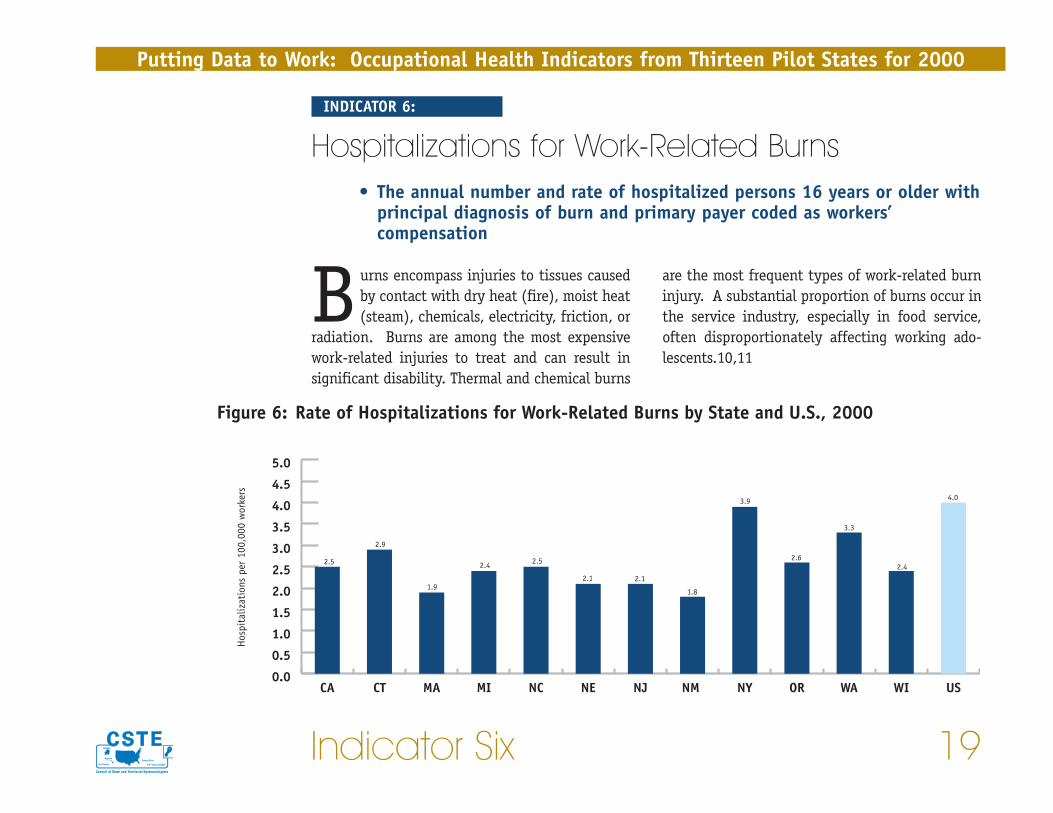
are the most frequent types of work-related burninjury. A substantial proportion of burns occur inthe service industry, especially in food service,often disproportionately affecting working ado-lescents.10,11
Burns encompass injuries to tissues causedby contact with dry heat (fire), moist heat(steam), chemicals, electricity, friction, or
radiation. Burns are among the most expensivework-related injuries to treat and can result insignificant disability. Thermal and chemical burns
Indicator Six 19
Putting Data to Work: Occupational Health Indicators from Thirteen Pilot States for 2000
INDICATOR 6:
Hospitalizations for Work-Related Burns• The annual number and rate of hospitalized persons 16 years or older with
principal diagnosis of burn and primary payer coded as workers’compensation
Figure 6: Rate of Hospitalizations for Work-Related Burns by State and U.S., 2000
2.5
2.9
1.9
2.4 2.5
2.1 2.1
1.8
3.9
2.6
3.3
2.4
4.0
0.0
0.5
1.0
1.5
2.0
2.5
3.0
3.5
4.0
4.5
5.0
USWIWAORNYNM NJNENCMIMACTCA
Hos
pita
lizat
ions
per
100
,000
wor
kers
Putting Data to Work: Occupational Health Indicators from Thirteen Pilot States for 2000
20 Indicator Six
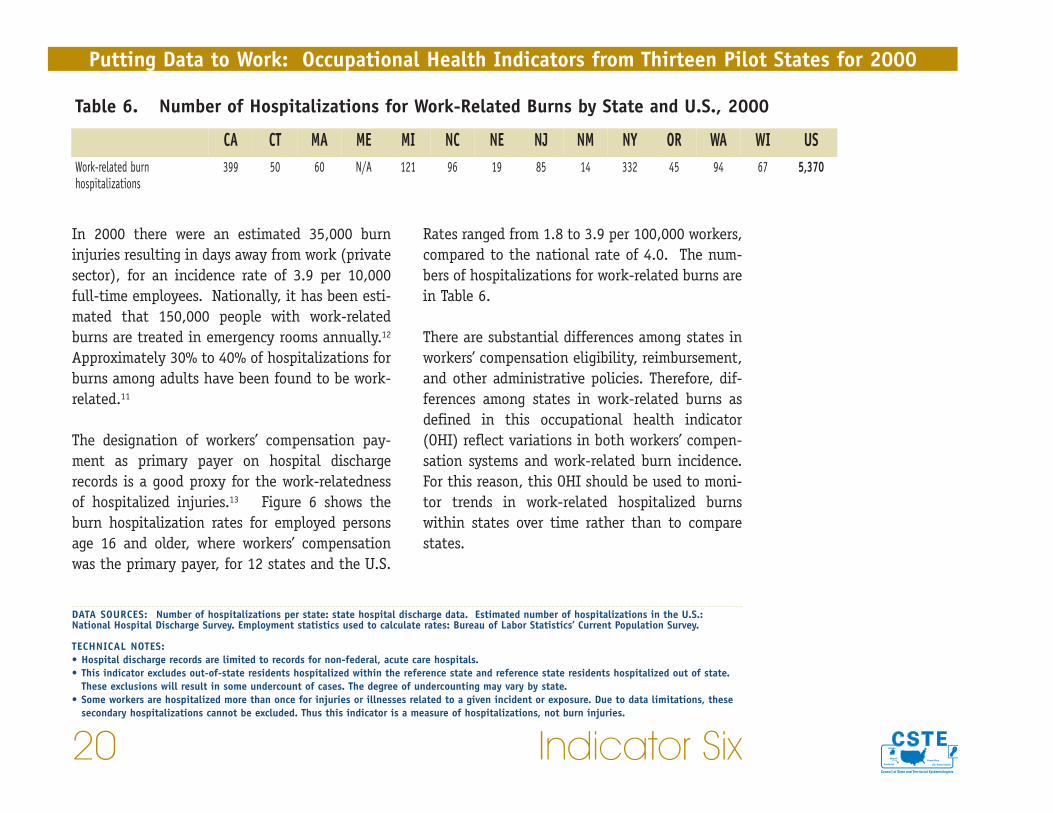
Rates ranged from 1.8 to 3.9 per 100,000 workers,compared to the national rate of 4.0. The num-bers of hospitalizations for work-related burns arein Table 6.
There are substantial differences among states inworkers’ compensation eligibility, reimbursement,and other administrative policies. Therefore, dif-ferences among states in work-related burns asdefined in this occupational health indicator(OHI) reflect variations in both workers’ compen-sation systems and work-related burn incidence.For this reason, this OHI should be used to moni-tor trends in work-related hospitalized burnswithin states over time rather than to comparestates.
In 2000 there were an estimated 35,000 burninjuries resulting in days away from work (privatesector), for an incidence rate of 3.9 per 10,000full-time employees. Nationally, it has been esti-mated that 150,000 people with work-relatedburns are treated in emergency rooms annually.12
Approximately 30% to 40% of hospitalizations forburns among adults have been found to be work-related.11
The designation of workers’ compensation pay-ment as primary payer on hospital dischargerecords is a good proxy for the work-relatednessof hospitalized injuries.13 Figure 6 shows theburn hospitalization rates for employed personsage 16 and older, where workers’ compensationwas the primary payer, for 12 states and the U.S.
Table 6. Number of Hospitalizations for Work-Related Burns by State and U.S., 2000
CA CT MA ME MI NC NE NJ NM NY OR WA WI USWork-related burnhospitalizations
399 50 60 N/A 121 96 19 85 14 332 45 94 67 5,370
DATA SOURCES: Number of hospitalizations per state: state hospital discharge data. Estimated number of hospitalizations in the U.S.:National Hospital Discharge Survey. Employment statistics used to calculate rates: Bureau of Labor Statistics’ Current Population Survey.
TECHNICAL NOTES:• Hospital discharge records are limited to records for non-federal, acute care hospitals.• This indicator excludes out-of-state residents hospitalized within the reference state and reference state residents hospitalized out of state.
These exclusions will result in some undercount of cases. The degree of undercounting may vary by state.• Some workers are hospitalized more than once for injuries or illnesses related to a given incident or exposure. Due to data limitations, these
secondary hospitalizations cannot be excluded. Thus this indicator is a measure of hospitalizations, not burn injuries.
definition of MSDs includes sprains, strains, pain,hurt back, carpal tunnel syndrome, and hernia inwhich the event leading to the condition isreported as overexertion, repetitive motion, orbending, reaching, or twisting. BLS excludesMSDs reportedly caused by single events such asslips and falls, and motor vehicle crashes.
MSDs are some of the most common and costlywork-related health problems. These injuries cansignificantly impact the ability of workers to per-form their jobs and affect quality of life both onand off the job. According to the Annual Survey,MSDs have consistently accounted for over one-third of all work-related injuries and illnessesinvolving days away from work reported by
Work-related musculoskeletal disorders(MSDs) are injuries or disorders of mus-cles, tendons, nerves, ligaments, joints,
or spinal discs that are caused or aggravated bywork activities. Workplace risk factors for MSDsinclude repetitive forceful motions, awkward pos-tures, use of vibrating tools or equipment, andmanual handling of heavy, awkward loads. Thesedisorders also can be caused by single, traumaticevents such as falls. Both single events and wearand tear over time can play a role in these disorders.
This occupational health indicator is based ondata collected by the Bureau of Labor Statistics(BLS) in the Annual Survey of OccupationalInjuries and Illnesses (Annual Survey). The BLS
Indicator Seven 21
Putting Data to Work: Occupational Health Indicators from Thirteen Pilot States for 2000
INDICATOR 7:
Musculoskeletal Disorders Reported by Employers• Estimated annual number and rate of musculoskeletal disorders (MSDs)
involving days away from work among private sector workers
• Estimated annual number and rate of MSDs of the back
• Estimated annual number and rate of MSDs of the upper extremities, neck,and shoulder
• Estimated annual number and rate of carpal tunnel syndrome cases
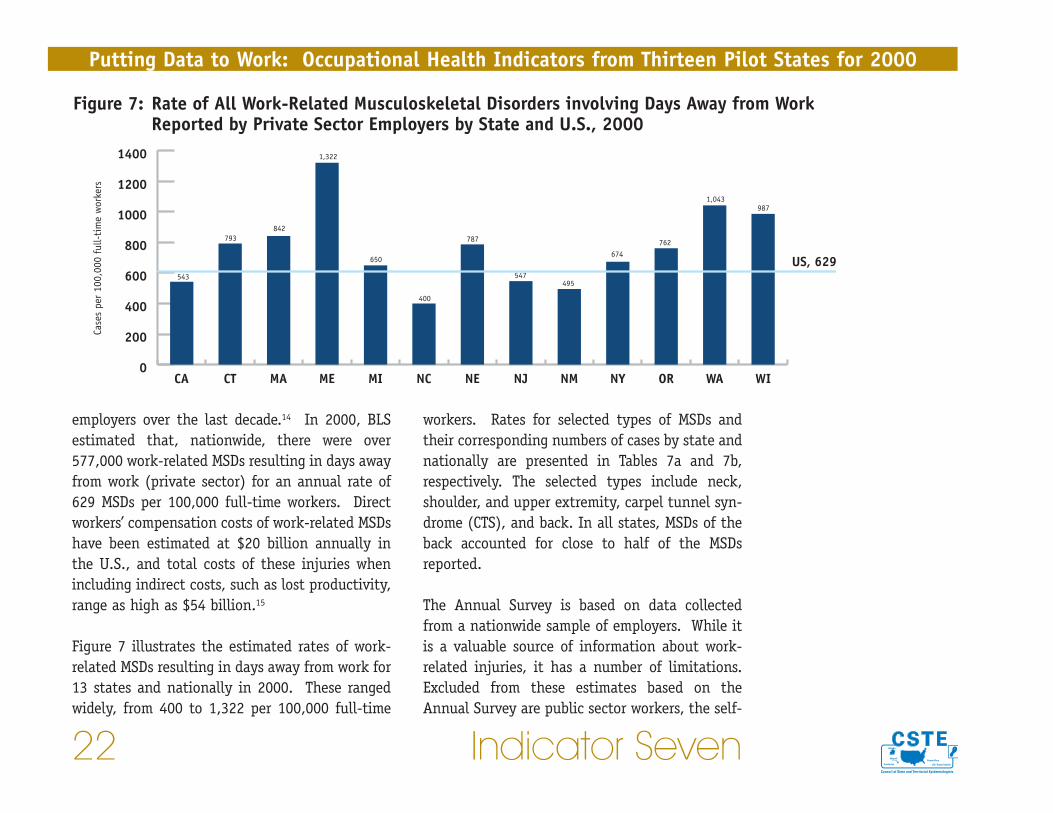
workers. Rates for selected types of MSDs andtheir corresponding numbers of cases by state andnationally are presented in Tables 7a and 7b,respectively. The selected types include neck,shoulder, and upper extremity, carpel tunnel syn-drome (CTS), and back. In all states, MSDs of theback accounted for close to half of the MSDsreported.
The Annual Survey is based on data collectedfrom a nationwide sample of employers. While itis a valuable source of information about work-related injuries, it has a number of limitations.Excluded from these estimates based on theAnnual Survey are public sector workers, the self-
employers over the last decade.14 In 2000, BLSestimated that, nationwide, there were over577,000 work-related MSDs resulting in days awayfrom work (private sector) for an annual rate of629 MSDs per 100,000 full-time workers. Directworkers’ compensation costs of work-related MSDshave been estimated at $20 billion annually inthe U.S., and total costs of these injuries whenincluding indirect costs, such as lost productivity,range as high as $54 billion.15
Figure 7 illustrates the estimated rates of work-related MSDs resulting in days away from work for13 states and nationally in 2000. These rangedwidely, from 400 to 1,322 per 100,000 full-time
Putting Data to Work: Occupational Health Indicators from Thirteen Pilot States for 2000
22 Indicator Seven
Figure 7: Rate of All Work-Related Musculoskeletal Disorders involving Days Away from Work Reported by Private Sector Employers by State and U.S., 2000
543
793842
1,322
650
400
787
547495
674762
1,043987
0
200
400
600
800
1000
1200
1400
WIWAORNYNMNJNENCMIMEMACTCA
Case
s pe
r 10
0,00
0 fu
ll-ti
me
wor
kers
US, 629
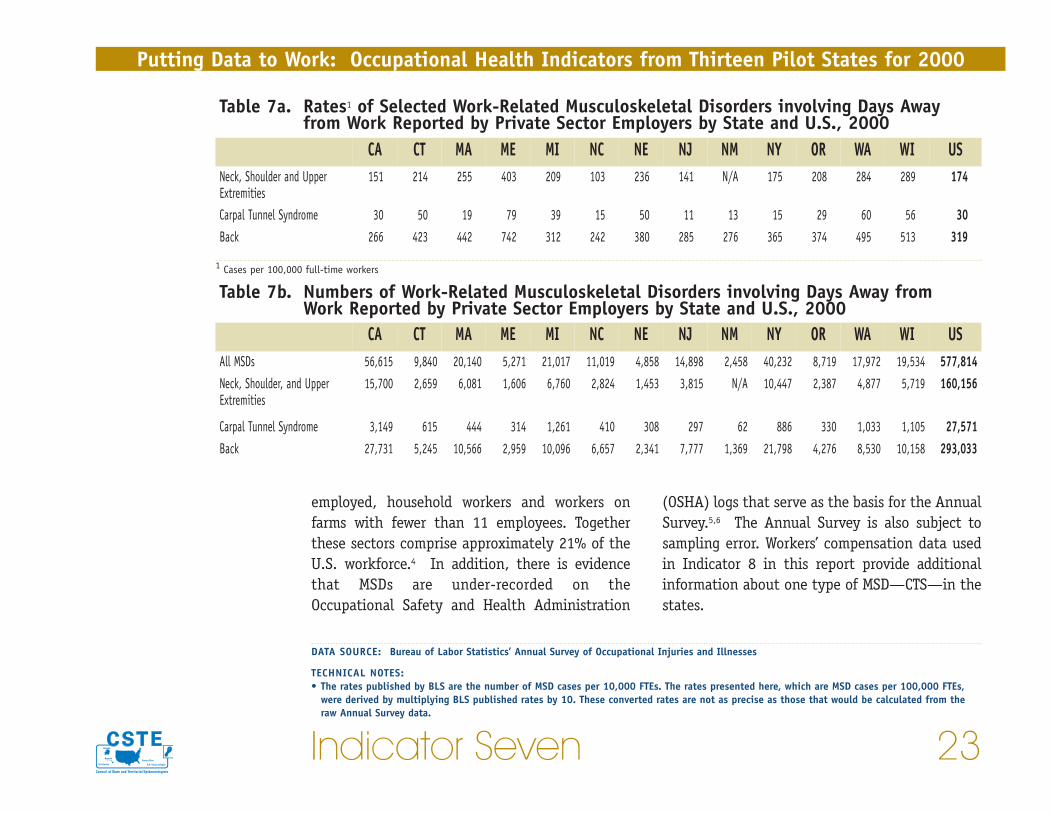
(OSHA) logs that serve as the basis for the AnnualSurvey.5,6 The Annual Survey is also subject tosampling error. Workers’ compensation data usedin Indicator 8 in this report provide additionalinformation about one type of MSD—CTS—in thestates.
employed, household workers and workers onfarms with fewer than 11 employees. Togetherthese sectors comprise approximately 21% of theU.S. workforce.4 In addition, there is evidencethat MSDs are under-recorded on theOccupational Safety and Health Administration
Indicator Seven 23
Putting Data to Work: Occupational Health Indicators from Thirteen Pilot States for 2000
DATA SOURCE: Bureau of Labor Statistics’ Annual Survey of Occupational Injuries and Illnesses
TECHNICAL NOTES:• The rates published by BLS are the number of MSD cases per 10,000 FTEs. The rates presented here, which are MSD cases per 100,000 FTEs,
were derived by multiplying BLS published rates by 10. These converted rates are not as precise as those that would be calculated from theraw Annual Survey data.
Table 7a. Rates1 of Selected Work-Related Musculoskeletal Disorders involving Days Awayfrom Work Reported by Private Sector Employers by State and U.S., 2000
CA CT MA ME MI NC NE NJ NM NY OR WA WI USNeck, Shoulder and UpperExtremities
151 214 255 403 209 103 236 141 N/A 175 208 284 289 174
Carpal Tunnel Syndrome 30 50 19 79 39 15 50 11 13 15 29 60 56 30Back 266 423 442 742 312 242 380 285 276 365 374 495 513 319
Table 7b. Numbers of Work-Related Musculoskeletal Disorders involving Days Away fromWork Reported by Private Sector Employers by State and U.S., 2000
CA CT MA ME MI NC NE NJ NM NY OR WA WI USAll MSDs 56,615 9,840 20,140 5,271 21,017 11,019 4,858 14,898 2,458 40,232 8,719 17,972 19,534 577,814Neck, Shoulder, and UpperExtremities
15,700 2,659 6,081 1,606 6,760 2,824 1,453 3,815 N/A 10,447 2,387 4,877 5,719 160,156
Carpal Tunnel Syndrome 3,149 615 444 314 1,261 410 308 297 62 886 330 1,033 1,105 27,571Back 27,731 5,245 10,566 2,959 10,096 6,657 2,341 7,777 1,369 21,798 4,276 8,530 10,158 293,033
1 Cases per 100,000 full-time workers
trauma, repetitive forceful motions or awkwardpostures of the hands, and use of vibrating toolsor equipment.16
CTS has the longest average disability durationamong the top 10 workers’ compensation condi-
Carpal tunnel syndrome (CTS) occurs whenthe median nerve is compressed at thewrist. Symptoms range from a burning, tin-
gling, or numbness in the fingers to difficultygripping or holding objects. Workplace factorsthat may cause or aggravate CTS include direct
Putting Data to Work: Occupational Health Indicators from Thirteen Pilot States for 2000
24 Indicator Eight
INDICATOR 8:
Carpal Tunnel Syndrome Cases Identified inState Workers’ Compensation Systems
• Annual number and rate of carpal tunnel syndrome cases identified instate workers’ compensation systems
Figure 8: Rate of Lost Work Time Claims for Carpal Tunnel Syndrome Cases identified in State Workers' Compensation Systems by State, 2000
34.4
28.1
44.0
23.2
30.327.7
8.5
47.0
58.6
36.9
0
10
20
30
40
50
60
70
WIWAORNMNENCMIMEMACT
Clai
ms
per
100,
000
wor
kers
drome as defined in this OHI reflect variations inboth workers’ compensation systems and CTS inci-dence. For this reason, this OHI should be usedto monitor trends in work-related carpal tunnelsyndrome within states over time rather than tocompare states.
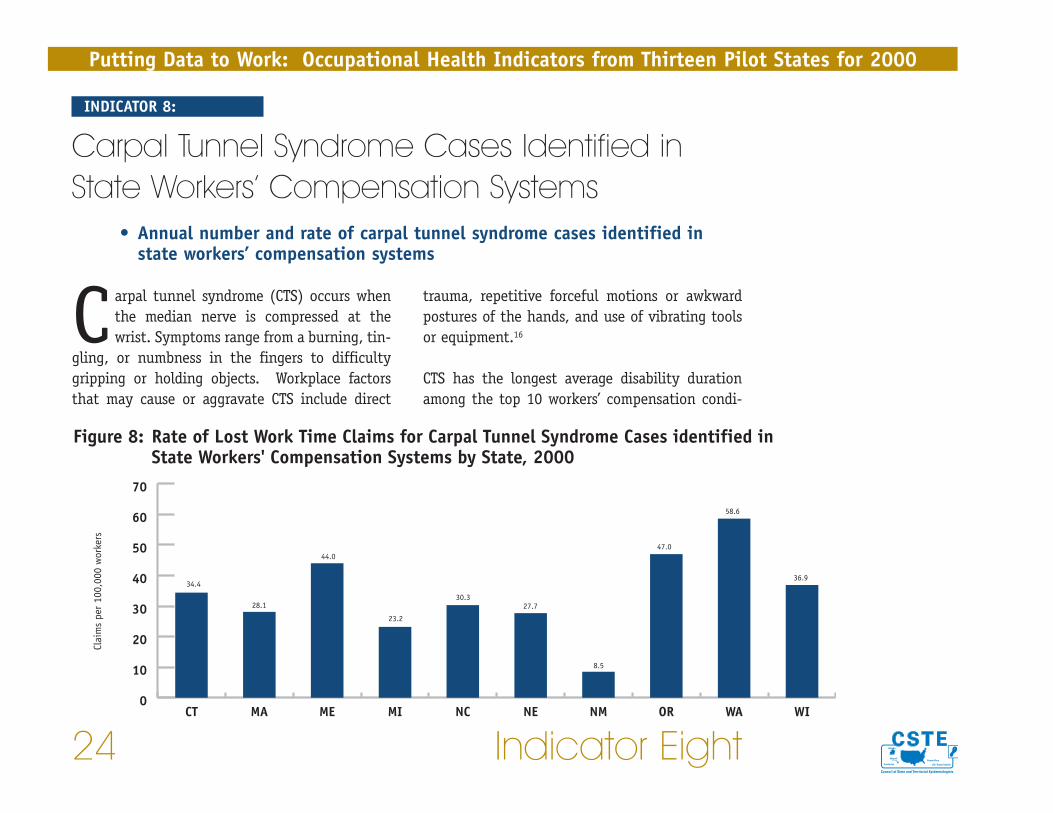
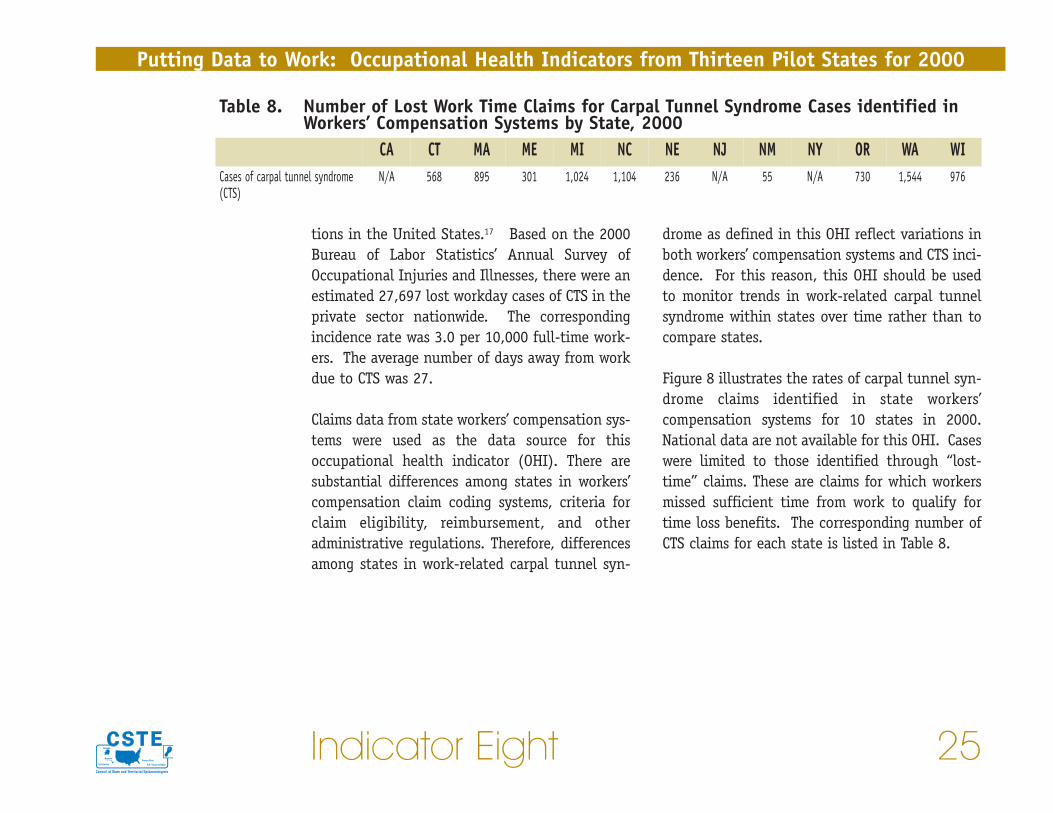
Figure 8 illustrates the rates of carpal tunnel syn-drome claims identified in state workers’compensation systems for 10 states in 2000.National data are not available for this OHI. Caseswere limited to those identified through “lost-time” claims. These are claims for which workersmissed sufficient time from work to qualify fortime loss benefits. The corresponding number ofCTS claims for each state is listed in Table 8.
tions in the United States.17 Based on the 2000Bureau of Labor Statistics’ Annual Survey ofOccupational Injuries and Illnesses, there were anestimated 27,697 lost workday cases of CTS in theprivate sector nationwide. The correspondingincidence rate was 3.0 per 10,000 full-time work-ers. The average number of days away from workdue to CTS was 27.
Claims data from state workers’ compensation sys-tems were used as the data source for thisoccupational health indicator (OHI). There aresubstantial differences among states in workers’compensation claim coding systems, criteria forclaim eligibility, reimbursement, and otheradministrative regulations. Therefore, differencesamong states in work-related carpal tunnel syn-
Indicator Eight 25
Putting Data to Work: Occupational Health Indicators from Thirteen Pilot States for 2000
Table 8. Number of Lost Work Time Claims for Carpal Tunnel Syndrome Cases identified inWorkers’ Compensation Systems by State, 2000
CA CT MA ME MI NC NE NJ NM NY OR WA WICases of carpal tunnel syndrome(CTS)
N/A 568 895 301 1,024 1,104 236 N/A 55 N/A 730 1,544 976

Putting Data to Work: Occupational Health Indicators from Thirteen Pilot States for 2000
26 Indicator Eight
DATA SOURCES: Numbers of CTS cases: State workers’ compensation systems. Numbers of workers covered by workers’ compensation used tocalculate rates: National Academy of Social Insurance.
TECHNICAL NOTES:
1 Claim is filed but acceptance or rejection of the claim is not determined.2 International Association of Industrial Accident Boards and Commissions (IAIABC); Occupational Injury and Illness Classification System (OIICS); American National StandardsInstitute (ANSI).
STATEClaims Included (Claims Filed1
or Claims Accepted)Waiting Period for Time Loss
Compensation Data Systems Definition for Claim Identification2
CT Time Loss Claims Filed 3 Days OIICS Nature of Injury Code = 1241 (Carpal Tunnel Syndrome)
MA Time Loss Claims Filed 5 Days Unique Massachusetts Nature of Injury Code (N=265) for Carpal Tunnel Syndrome (added to the ANSI Z-16.2 structure)
ME Time Loss Claims Filed 7 Days OIICS Nature of Injury Code = 1241 (Carpal Tunnel Syndrome)
MI Time Loss Claims Filed 7 Days ANSI Z-16.2 Nature of Injury Code = 562 (Carpal Tunnel Syndrome) and Body Part Code = 320 (Wrist)
NC Time Loss Claims Filed 7 Days IAIABC Nature of Injury Code = 78 (Carpal Tunnel Syndrome)
NE Time Loss Claims Filed 7 Days IAIABC Nature of Injury Code = 78 (Carpal Tunnel Syndrome)
NM Time Loss Claims Filed 7 Days BLS Supplemental Data System Nature of Injury Code = 265 (Carpal Tunnel Syndrome) and Type ofInjury Code = 12* (Overexertion) and Body Part Code = 320 (Wrist)
OR Time Loss Claims Accepted 3 Days OIICS Nature Code = 1241 (Carpal Tunnel Syndrome) and Event or Exposure Code = 12* (Overexertion)and Body Part Code = 32 (Wrist)
WA Time Loss Claims Accepted 3 Days ANSI Z-16.2 Nature of Injury Code = 562 (Carpal Tunnel Syndrome) and Type of Injury Code = 12*(Overexertion) and Body Part Code = 320 (Wrist)
WI Time Loss Claims Filed 3 Days IAIABC Nature of Injury Code = 78 (Carpal Tunnel Syndrome)

onset of exposure. These diseases are incurableand may ultimately result in death.18
Pneumoconiosis includes: silicosis, asbestosis,coal workers’ pneumoconiosis (CWP), and, lesscommonly, pneumoconiosis due to a variety ofother mineral dusts, including talc, aluminum,
Pneumoconiosis is a term for a class of non-malignant lung diseases caused by theinhalation of mineral dust, nearly always
in occupational settings. Most cases of pneumo-coniosis develop only after many years ofcumulative exposure; thus they are usually diag-nosed in older individuals, often long after the
Indicator Nine 27
Putting Data to Work: Occupational Health Indicators from Thirteen Pilot States for 2000
INDICATOR 9:
Pneumoconiosis Hospitalizations • The annual number and rate of hospitalizations with pneumoconiosis as a
principal or secondary discharge diagnosis
Figure 9: Age-Standardized Rates of Hospitalizations from or with Total Pneumoconiosis and Asbestosis by State and U.S., 2000
81.9
106.0
80.6
141.0128.3
161.9153.1
98.7
62.8
117.9
76.1
21.3 16.1
303.0
277.0
82.5
25.0
106.4
84.475.0
61.9
166.3154.7
48.831.0
146.5
93.3
68.6
0
50
100
150
200
250
300
350
USWIWAORNYNM NJNENCMIMEMACTCA
Hos
pita
lizat
ions
per
mill
ion
resi
dent
s
AsbestosisTotal pneumoconiosis

State-based hospital discharge data are a usefulpopulation-based surveillance data source forquantifying pneumoconiosis even though only asmall number of individuals with pneumoconiosisare hospitalized for that condition.
It is widely recognized that pneumoconiosis andother long latency diseases are very poorly docu-
bauxite, and graphite. Byssinosis and severalother dust-related lung diseases are sometimesgrouped with “pneumoconiosis,” even thoughthey are caused by occupational exposure toorganic (e.g., cotton) dust. Individuals with cer-tain kinds of pneumoconiosis are at increased riskof other diseases, including cancer, tuberculosis,autoimmune conditions, and chronic renal failure.
Putting Data to Work: Occupational Health Indicators from Thirteen Pilot States for 2000
28 Indicator Nine
Table 9a. Age-Standardized Rates1 of Hospitalizations from or with Selected Pneumoconiosisby State and U.S., 2000
CA CT MA ME MI NC NE NJ NM NY OR WA WI USCoal workers’ pneumoconiosis 8.1 16.8 4.7 —2 20.2 20.6 — 17.6 42.0 11.3 6.6 5.7 5.4 44.9Silicosis 3.0 7.4 4.6 5.3 13.9 10.5 — 6.8 11.4 7.7 6.5 4.5 13.0 5.2Other and unspecifiedpneumoconiosis
2.3 1.7 3.4 — 2.2 10.7 — 3.2 4.0 3.0 — 1.4 — 4.4
Table 9b. Numbers1 of Hospitalizations from or with Pneumoconiosis by State and U.S., 2000
CA CT MA ME MI NC NE NJ NM NY OR WA WI USTotal pneumoconiosis 1,841 309 759 183 752 712 30 2,101 104 1,614 207 698 212 31,755Coal workers’ pneumoconiosis 185 48 25 <5 153 125 <5 121 52 172 18 25 23 9,715Asbestosis 1,541 235 691 173 479 460 23 1,919 32 1,281 171 648 135 20,223Silicosis 67 21 25 6 106 64 <5 47 15 117 18 19 54 1,128Other and unspecifiedpneumoconiosis
53 5 18 <5 17 63 <5 22 <10 45 <5 6 <5 952
1 Hospitalizations per one million residents2 Rates were not calculated for states with fewer than five cases in a category.
1 The sum of particular types of pneumoconioses may be greater than the total because cases could be hospitalized with more than one type of pneumoconiosis.

pitalizations were specifically for asbestosis in allstates, except for New Mexico, where pneumoco-nioses associated with mining (CWP and silicosis)predominated. Table 9a provides the age-stan-dardized rates for other types of pneumoconioses.Table 9b provides the numbers for each of the spe-cific types of pneumoconiosis. It should be notedthat the Annual Survey estimated 1,700 dust-related illnesses nationwide in 2000, while therewere 9,552 and 31,755 pneumoconiosis hospitaldischarges in the 13 states and nationwide,respectively.
mented in the Bureau of Labor Statistics’ AnnualSurvey (Annual Survey). Thus, hospital dischargedata are an important source for quantifying theburden of pneumoconiosis, even though they cap-ture only hospitalized cases.
Figure 9 displays age-standardized hospitalizationrates in 2000 for all pneumoconioses and forasbestosis, where these were principal or second-ary diagnoses, for 13 states and the U.S. Ratesvaried widely across the states, most likelyreflecting differences in the manufacturing anduse of asbestos. Over 75% of pneumoconiosis hos-
Indicator Nine 29
Putting Data to Work: Occupational Health Indicators from Thirteen Pilot States for 2000
DATA SOURCES: Number of hospitalizations per state: State hospital discharge data. Estimated number of hospitalizations in the U.S.: NationalHospital Discharge Survey. Population statistics used to calculate rates: U.S. Census Bureau.
TECHNICAL NOTES:• Hospital discharge records are limited to records for non-federal, acute care hospitals.• This indicator excludes out-of-state residents hospitalized within the reference state and reference state residents hospitalized out of state.
These exclusions will result in some undercount of cases. The degree of undercounting may vary by state.• Some workers are hospitalized more than once for pneumoconiosis. Due to data limitations, these secondary hospitalizations cannot be
excluded. Thus, this indicator is a measure of hospitalizations for pneumoconiosis, not of pneumoconiosis.

exposure. These diseases are incurable and mayultimately result in death.18
Pneumoconiosis includes: silicosis, asbestosis,coal workers’ pneumoconiosis (CWP), and, lesscommonly, pneumoconiosis due to a variety ofother mineral dusts, including talc, aluminum,
Pneumoconiosis is a term for a class of non-malignant lung diseases caused by theinhalation of mineral dust, nearly always
in occupational settings. Most cases of pneumoco-niosis develop only after many years ofcumulative exposure; thus they are often diag-nosed in older individuals, long after the onset of
Putting Data to Work: Occupational Health Indicators from Thirteen Pilot States for 2000
30 Indicator Ten
INDICATOR 10:
Pneumoconiosis Mortality• Annual number and rate of deaths with pneumoconiosis as the underlying
or contributing cause of death
Figure 10: Age-Standardized Rates of Hospitalizations from or with Total Pneumoconiosis and Asbestosis by State and U.S., 2000
4.7
8.1
6.7
7.77.3
10.8
12.3 12.3
3.3
7.0
3.4 3.4
12.7
14.1
12.9
4.9 5.2
4.0
11.1
10.0
16.816.3
2.7
4.7
13.2
6.9
0
2
4
6
8
10
12
14
16
18
USWIWAORNYNM NJNENCMIMEMACTCA
Deat
hs p
er m
illio
n re
side
nts
5.4
AsbestosisTotal pneumoconiosis
5.5

All states collect cause-of-death information ondeath certificates, including both the underlyingand contributing causes of death. From 1990through 1999, pneumoconiosis was an underlyingor contributing cause of more than 30,000 deathsin the United States, for an overall age-adjustedannual mortality rate of 15.8 per million popula-
bauxite, and graphite. Byssinosis is sometimesgrouped with “pneumoconiosis,” even thoughbyssinosis is caused by occupational exposure toorganic (e.g., cotton) dust. Individuals with cer-tain kinds of pneumoconiosis are at increased riskof other diseases, including cancer, tuberculosis,autoimmune conditions, and chronic renal failure.
Indicator Ten 31
Putting Data to Work: Occupational Health Indicators from Thirteen Pilot States for 2000
Table 10a. Age-Standardized Mortality Rates1 from or with Selected Pneumoconiosis by Stateand U.S., 2000
CA CT MA ME MI NC NE NJ NM NY OR WA WI USCoal workers’ pneumoconiosis 0.3 —2 — — 1.2 1.6 — — 4.8 — — — — 4.4Silicosis 0.3 — — — 1.1 1.0 — — — 0.6 — — 1.4 0.7Other and unspecifiedpneumoconiosis
0.2 — — — — 1.4 — 0.9 — 0.3 — — — 1.4
Table 10b. Numbers of Deaths1 from or with Pneumoconiosis by State and U.S., 2000
CA CT MA ME MI NC NE NJ NM NY OR WA WI USAll pneumoconiosis 143 24 42 14 41 63 5 98 16 79 31 70 21 2,864Coal workers’ pneumoconiosis 8 <5 0 <5 9 9 0 <5 6 <5 <5 <5 <5 950Asbestosis 122 20 40 14 25 41 5 88 6 61 28 68 12 1,493Silicosis 8 <5 <5 <5 8 6 0 <5 <5 9 <5 <5 6 152Other and unspecifiedpneumoconiosis
5 <5 <5 <5 0 8 0 6 <5 5 <5 <5 <5 307
1 Deaths per one million residents2 Rates were not calculated for states with fewer than five deaths in a category.
1 The sum of these numbers may be greater than the total because deaths could occur with more than one type of pneumoconiosis diagnosis.
Figure 10 illustrates the age-adjusted rates for allpneumoconiosis deaths and for asbestosis deathsfor 13 states and the U.S. for 2000. Rates rangedfrom 3.4 to 16.8 deaths per million state residentsfor all pneumoconioses and from 2.7 to 16.3 forasbestosis. The death rate for the U.S. was 13.2per million persons for all pneumoconioses and6.9 for asbestosis. Rates of deaths for other typesof pneumoconiosis are presented in Table 10a. Thenumbers for all pneumoconioses combined and foreach specific disease are in Table 10b. Asbestosiscomprised 78% of all the pneumoconiosis-relateddeaths in 2000 in the 13 states, compared to 52%in the U.S.
tion among those age 15 and older.Pneumoconiosis was the underlying cause ofdeath in approximately one-third of thesedeaths.19 Mortality from most kinds of pneumo-coniosis has gradually declined over the pastthree decades with the exception of asbestosis,which has increased more than tenfold.
Deaths due to pneumoconiosis are undercountedon death certificates.20,21 Pneumoconiosis is likelyto be under-recorded on the death certificate as acause of death because it is under-recognized byclinicians for a number of reasons, including thelong latency between exposure and onset ofsymptoms, and the non-specificity of symptoms.
Putting Data to Work: Occupational Health Indicators from Thirteen Pilot States for 2000
32 Indicator TenDATA SOURCES: Numbers of deaths: State Vital Records. Numbers of deaths in the U.S.: National Center for Health Statistics multiple cause ofdeath file. Population statistics used to calculate rates: U.S. Census Bureau.

in more than 16,000 pesticide products.22 Althoughthe value of pesticides in protecting the food sup-ply and controlling disease vectors is wellrecognized, it is also recognized that pesticides cancause harm to people and the environment.
Apesticide is a substance or mixture of sub-stances used to prevent or controlundesired insects, plants, animals, or
fungi. In the U.S., approximately one billionpounds of pesticides are used annually, contained
Putting Data to Work: Occupational Health Indicators from Thirteen Pilot States for 2000
INDICATOR 11:
Acute Work-Related Pesticide PoisoningsReported to Poison Control Centers
• Annual number and rate of work-related pesticide poisonings reported tostate Poison Control Centers
Figure 11: Rate of Work-Related Pesticide-Associated Poisonings by State* and U.S., 2000
2.1
0.7
1.5
2.1
9.0
1.0
4.8
3.2
5.1
1.5
0
1
2
3
4
5
6
7
8
9
10
USWIWAORNYNM NJNENCMIMACTCA
Case
s pe
r 10
0,00
0 w
orke
rs
US, 2.1**1.8 1.7
* Rates were not calculated for states with fewer than five cases **Does not include Mississippi and North Dakota
Indicator Eleven 33

number of states have active programs for occupa-tional pesticide surveillance; seven of these statesdocumented 1,009 individuals with acute occupa-tional pesticide-related illness (including threedeaths) in a two-year period, for an incidence rateof 1.2 per 100,000 full-time workers. 23
Data from 13 states were compiled from state PCCdata. Incidence rates of pesticide poisonings per100,000 employed persons in 2000 for these statesand the U.S. are presented in Figure 11, and thenumbers are in Table 11. The incidence rates forthe states ranged from 0.7 to 9.0 per 100,000employed persons. Nationally, the number of pes-ticide-associated illnesses and injuries reported byPCCs in 2000 was 2,827, resulting in an incidencerate of 2.1 per 100,000 employed persons.
Adverse health effects from exposure vary depend-ing on the amount and route of exposure and thetype of chemical used. Agricultural workers andpesticide applicators are at greatest risk for themore severe pesticide poisonings.
The U.S. Environmental Protection Agency (EPA)estimates that there are 20,000 to 40,000 work-related pesticide poisonings per year.23 Nationalestimates of pesticide poisoning are not availablefrom the Bureau of Labor Statistics. Poison ControlCenter (PCC) data are useful for monitoring pesti-cide poisonings nationally because PCCs servicealmost the entire U.S. population, even thoughcalls to state and regional PCCs are estimated tocapture only approximately 10% of acute occupa-tional pesticide-related illness cases.24 A small
Putting Data to Work: Occupational Health Indicators from Thirteen Pilot States for 2000
34 Indicator Eleven
Table 11. Number of Work-Related Pesticide-Associated Poisonings Reported to PoisonControl Centers by State and U.S., 2000
CA CT MA ME MI NC NE NJ NM NY OR WA WI US1
Cases of pesticide-associatedpoisonings
284 35 23 <5 74 79 81 39 38 141 54 147 41 2,827
1 Does not include Mississippi and North Dakota
DATA SOURCES: Numbers of pesticide-associated illness and injury: American Association of Poison Control Centers. Employment statisticsused to calculate rates: Bureau of Labor Statistics’ Current Population Survey.
TECHNICAL NOTES: • Cases are counted in the Toxic Exposure Surveillance System (TESS) data system used by these states and nationally by the American
Association of Poison Control Centers according to the following TESS variable definitions:• Exposure to an agent included in one of the pesticide generic categories: fungicides, fumigants, herbicides, insecticides, repellents, disin-
fectants, or rodenticides; AND• Reason=occupational OR Exposure site=workplace; AND• Medical Outcome is one of the following: minor effect; moderate effect; major effect; death; not followed, minimal clinical effects possible;
or, unable to follow, judged as potentially toxic exposure
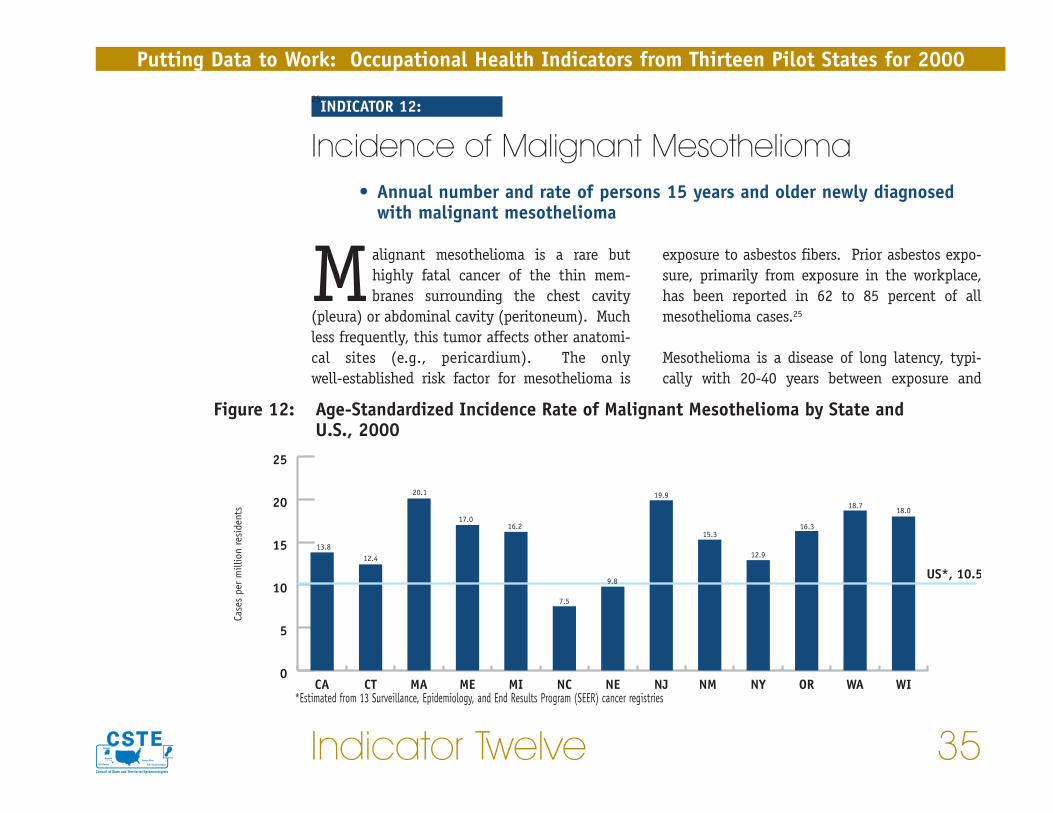
exposure to asbestos fibers. Prior asbestos expo-sure, primarily from exposure in the workplace,has been reported in 62 to 85 percent of allmesothelioma cases.25
Mesothelioma is a disease of long latency, typi-cally with 20-40 years between exposure and
Malignant mesothelioma is a rare buthighly fatal cancer of the thin mem-branes surrounding the chest cavity
(pleura) or abdominal cavity (peritoneum). Muchless frequently, this tumor affects other anatomi-cal sites (e.g., pericardium). The onlywell-established risk factor for mesothelioma is
Indicator Twelve 35
Putting Data to Work: Occupational Health Indicators from Thirteen Pilot States for 2000
25INDICATOR 12:
Incidence of Malignant Mesothelioma• Annual number and rate of persons 15 years and older newly diagnosed
with malignant mesothelioma
Figure 12: Age-Standardized Incidence Rate of Malignant Mesothelioma by State and U.S., 2000
0
5
10
15
20
25
USWIWAORNYNM NJNENCMIMEMACTCA
Case
s pe
r m
illio
n re
side
nts
US*, 10.5
13.812.4
20.1
17.016.2
7.5
15.3
12.9
16.3
18.718.0
19.9
9.8
*Estimated from 13 Surveillance, Epidemiology, and End Results Program (SEER) cancer registries

dreds of thousands of schools and public buildingsthroughout the country, and asbestos continuesto be used in many manufactured products.
State Cancer Registries collect data on newlydiagnosed cancer cases. Figure 12 illustrates theage-standardized incidence rates of malignantmesothelioma in 13 states and the estimated U.S.rate for 2000 based on 13 state cancer registriesin the Surveillance, Epidemiology, and EndResults (SEER) Program. The states’ rates variedwidely, ranging from 7.5 to 20.1 cases per millionresidents, most likely reflecting historical state-to-state differences in the use and manufacturingof asbestos-containing products. The correspon-ding numbers of cases for each state are listed inTable 12. National numbers are not available.
onset of disease. The incidence of mesotheliomain the United States has risen steadily since the1960s, reflecting high levels of asbestos use andoccupational exposure to asbestos during WorldWar II through the 1970s. In the 1970s, newOccupational Safety and Health Administrationregulations limited workplace exposures and theEnvironmental Protection Agency began regulat-ing asbestos uses. The mesothelioma incidencerate in the U.S. is projected to begin declining in2004.26
Approximately 1.3 million workers continue to beexposed directly or indirectly to asbestos in manyindustries and activities.27 Environmental expo-sure to asbestos is also a continuing concern.Asbestos-containing materials are found in hun-
Putting Data to Work: Occupational Health Indicators from Thirteen Pilot States for 2000
36 Indicator TwelveDATA SOURCES: Numbers of mesothelioma cases: State cancer registries. Population statistics used to calculate rates: U.S. Census Bureau.
Table 12. Number of Cases of Malignant Mesothelioma by State, 20001
CA CT MA ME MI NC NE NJ NM NY OR WA WIMesothelioma cases 315 36 107 19 124 46 14 138 20 196 45 79 76
1 National number is not available.

decreased fertility, and miscarriage. Workersbringing lead dust home on their clothing canexpose their children to lead.
The blood lead level (BLL) is the best biologicalindicator of recent lead exposure. A BLL of 25
Lead poisoning among adults is primarilydue to occupational exposure. Leadadversely affects multiple organ systems
and can cause permanent damage. Exposure tolead in adults can cause anemia, nervous systemdysfunction, kidney damage, hypertension,
Indicator Thirteen 37
Putting Data to Work: Occupational Health Indicators from Thirteen Pilot States for 2000
INDICATOR 13:
Elevated Blood Lead Levels among Adults• Annual numbers and rates (prevalence and incidence) of persons age 16
or older with blood lead levels greater than or equal to 25 micrograms perdeciliter (µg/dL) and greater than or equal to 40 µg/dL
Figure 13: Prevalence Rate of Persons with Blood Lead Levels ≥ 25 µg/dL and ≥ 40 µg/dL of Persons Age 16 Years or Older by State and U.S., 2000
5.7
0.8
5.2
0.9
11.5
2.3
4.7
1.0
6.9
4.0
10.5
1.32.8
9.9
1.9
10.5
2.23.9
0.9
3.3
12.3
28.8
2.4
13.3
0
5
10
15
20
25
30
35rates for ≥ 40 µg/dLrates for ≥ 25 µg/dL
US*WIWAORNYNJNENCMIMACTCA
Resi
dent
s w
ith
elev
ated
blo
od le
ad le
vels
per
100,
000
wor
kers
* Estimated from 25 states that participated in the Adult Blood Lead and Epidemiology Program (ABLES) in 2000.

micrograms per deciliter (µg/dL) or greater foradults is considered “elevated,” and the HealthyPeople 2010 goal is to eliminate BLLs above thislevel.28 The federal Occupational Safety andHealth Administration (OSHA) requires thatemployers regularly monitor the BLLs of workerswhere airborne lead in the workplace exceeds cer-tain levels. When a worker’s BLL is 40 µg/dL orgreater, the employer is required to offer anannual medical exam and other medical interven-tions depending on the BLL. However, adversehealth effects have been found with cumulativeexposure at BLLs lower than 40 µg/dL29 and 25 µg/dL.30 The average BLL for the general pop-ulation is less than 2 µg/dL.31
Many states, accounting for more than half of theU.S. population, participate in compiling data on
Putting Data to Work: Occupational Health Indicators from Thirteen Pilot States for 2000
38 Indicator Thirteen
laboratory reports of BLLs in adults for thenational Adult Blood Lead Epidemiology andSurveillance (ABLES) program.32 Reporting byclinical laboratories is mandatory in these states.ABLES programs are not always able to determinewhether reported cases were exposed to lead atwork or exposed in a non-occupational setting;several states have determined that occupationalexposures account for approximately 90% of allreported individuals.
Figure 13 presents prevalence rates per 100,000employed persons of BLLs > 25 µg/dL and > 40µg/dL among persons 16 years or older for 11states. Of note is the wide range in both ratesacross states. On the national level, 25 statesreported 2000 data to the ABLES program, with aprevalence rate of 12.3 per 100,000 workers for
Table 13a. Rate1 of Incident Cases of Persons Age 16 Years or Older with Elevated Blood LeadLevels by State and U.S., 2000
CA CT MA ME MI NC NE NJ NM NY OR WA WI US3
Rate of blood lead level ≥ 25µg/dL
3.2 4.1 8.4 N/A 3.5 4.1 3.0 7.5 N/A 6.0 5.7 2.6 8.3 5.5
Rate of blood lead level ≥ 40µg/dL
0.6 0.9 2.0 N/A 0.8 2.5 —2 1.3 N/A 1.5 1.2 0.7 1.5 1.0
1 Residents with elevated BLL per 100,000 workers2 Rates were not calculated for states with fewer than five cases3 U.S. incidence rate estimated from 24 ABLES states (see technical note)
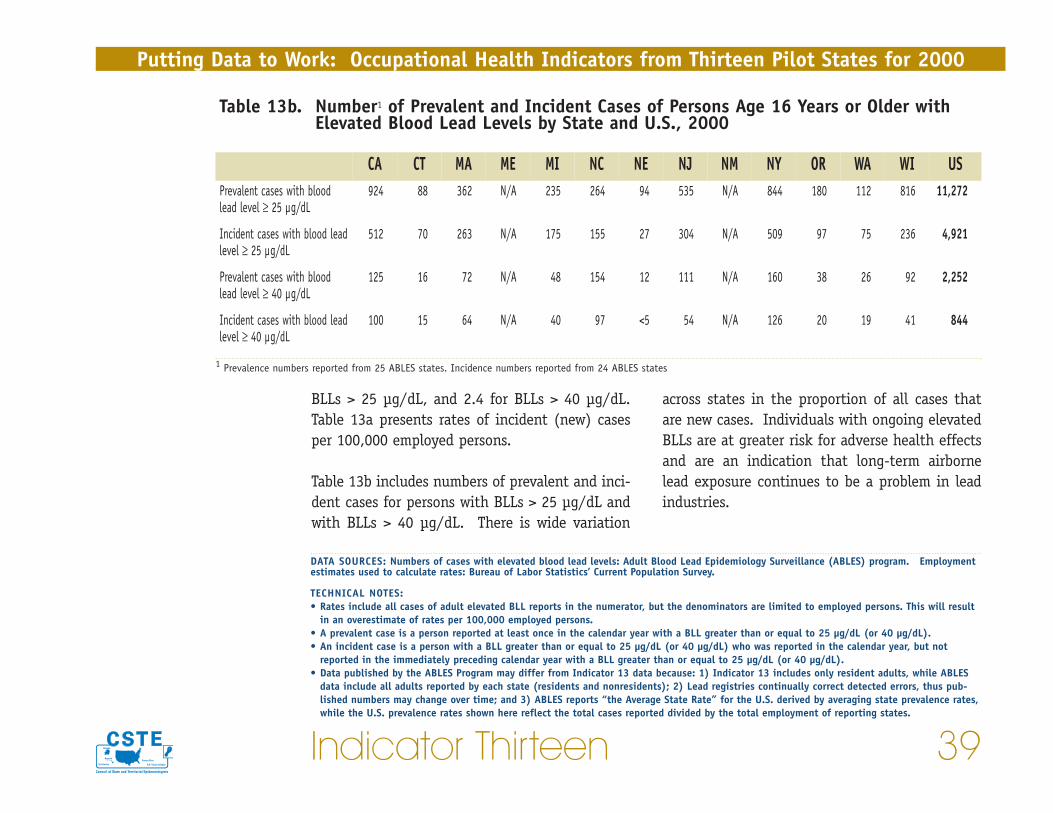
across states in the proportion of all cases thatare new cases. Individuals with ongoing elevatedBLLs are at greater risk for adverse health effectsand are an indication that long-term airbornelead exposure continues to be a problem in leadindustries.
BLLs > 25 µg/dL, and 2.4 for BLLs > 40 µg/dL.Table 13a presents rates of incident (new) casesper 100,000 employed persons.
Table 13b includes numbers of prevalent and inci-dent cases for persons with BLLs > 25 µg/dL andwith BLLs > 40 µg/dL. There is wide variation
Indicator Thirteen 39
Putting Data to Work: Occupational Health Indicators from Thirteen Pilot States for 2000
DATA SOURCES: Numbers of cases with elevated blood lead levels: Adult Blood Lead Epidemiology Surveillance (ABLES) program. Employmentestimates used to calculate rates: Bureau of Labor Statistics’ Current Population Survey.
TECHNICAL NOTES:• Rates include all cases of adult elevated BLL reports in the numerator, but the denominators are limited to employed persons. This will result
in an overestimate of rates per 100,000 employed persons. • A prevalent case is a person reported at least once in the calendar year with a BLL greater than or equal to 25 µg/dL (or 40 µg/dL). • An incident case is a person with a BLL greater than or equal to 25 µg/dL (or 40 µg/dL) who was reported in the calendar year, but not
reported in the immediately preceding calendar year with a BLL greater than or equal to 25 µg/dL (or 40 µg/dL). • Data published by the ABLES Program may differ from Indicator 13 data because: 1) Indicator 13 includes only resident adults, while ABLES
data include all adults reported by each state (residents and nonresidents); 2) Lead registries continually correct detected errors, thus pub-lished numbers may change over time; and 3) ABLES reports “the Average State Rate” for the U.S. derived by averaging state prevalence rates,while the U.S. prevalence rates shown here reflect the total cases reported divided by the total employment of reporting states.
Table 13b. Number1 of Prevalent and Incident Cases of Persons Age 16 Years or Older withElevated Blood Lead Levels by State and U.S., 2000
CA CT MA ME MI NC NE NJ NM NY OR WA WI USPrevalent cases with bloodlead level ≥ 25 µg/dL
924 88 362 N/A 235 264 94 535 N/A 844 180 112 816 11,272
Incident cases with blood leadlevel ≥ 25 µg/dL
512 70 263 N/A 175 155 27 304 N/A 509 97 75 236 4,921
Prevalent cases with bloodlead level ≥ 40 µg/dL
125 16 72 N/A 48 154 12 111 N/A 160 38 26 92 2,252
Incident cases with blood leadlevel ≥ 40 µg/dL
100 15 64 N/A 40 97 <5 54 N/A 126 20 19 41 844
1 Prevalence numbers reported from 25 ABLES states. Incidence numbers reported from 24 ABLES states

variation can help explain differences in injuryand illness rates among states.
In 1999, the Bureau of Labor Statistics (BLS) esti-mated that nationally there were 5.7 million
Workers in certain industries sustainnon-fatal injuries and illnesses at muchhigher rates than the overall workforce.
The proportion of the workforce that is employedin these high-risk industries varies by state. This
Putting Data to Work: Occupational Health Indicators from Thirteen Pilot States for 2000
40 Indicator Fourteen
INDICATOR 14:
Workers Employed in Industries with High Risk forOccupational Morbidity
• The number and percent of workers employed in industries with high riskfor occupational morbidity
Figure 14: Percentage of Workers in Industries with High Risk for Occupational Morbidity by State and U.S., 2000
0.0
2.0
4.0
6.0
8.0
10.0
12.0
WIWANYNM NJNENCMIMEMACTCA
Perc
enta
ge US, 6.2
4.0
5.7
4.4
10.310.7
6.4
9.2
3.3 3.5
4.74.1
10.3

A). The list of high risk industries was developedbased on 1999 BLS data from the Survey ofOccupational Injuries and Illness.
In 2000, the percentage of workers employed in25 high-risk industries ranged from 3.3% to10.7% of the total employed for 12 states (Figure14). The numbers of workers in each state andnationwide employed in these industries areshown in Table 14.
injury and illness cases within the private sector,which was equivalent to 6.3 cases per 100 full-time workers. Twenty-five industries hadoccupational injury and illness rates more thandouble the national rate.33 Workers in theseindustries made up 6% of the national privatesector workforce, but 17% of the OccupationalSafety and Health Administration (OSHA)-reportable injuries and illnesses. These 25industries comprised the “high-risk” industriesfor this occupational health indicator (Appendix
Indicator Fourteen 41
Putting Data to Work: Occupational Health Indicators from Thirteen Pilot States for 2000
DATA SOURCE: Census Bureau County Business Patterns
TECHNICAL NOTES:• The list of high-risk industries will be updated every five years since over time there will be some changes to the list as occupational morbid-
ity rates for individual industries fluctuate. It is not anticipated that year-to-year changes will have significant effect on comparative ortrend analyses, but these changes will be evaluated.
Table 14. Number of Workers Employed in Industries with High Risk for OccupationalMorbidity by State and U.S., 2000
CA CT MA ME MI NC NE NJ NM NY OR WA WI USWorkers in high-riskindustries
516,292 87,876 135,890 50,576 437,398 215,578 68,766 132,690 19,225 344,477 N/A 119,401 291,649 7,043,202
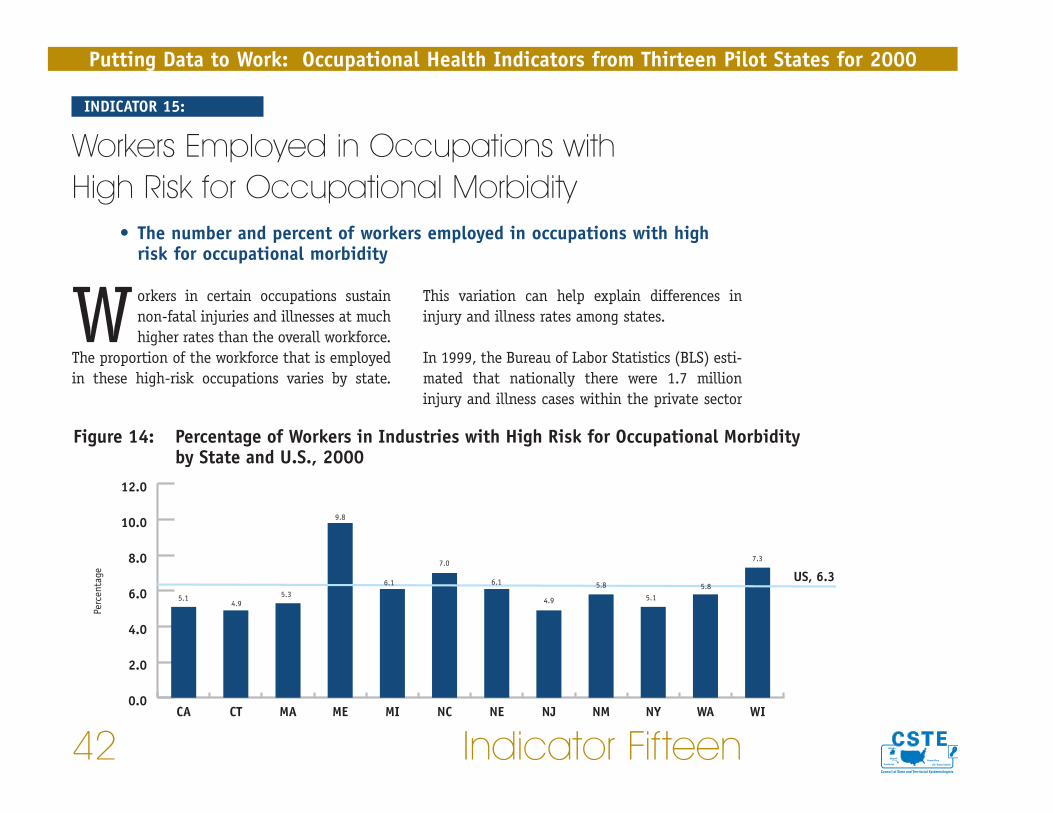
This variation can help explain differences ininjury and illness rates among states.
In 1999, the Bureau of Labor Statistics (BLS) esti-mated that nationally there were 1.7 millioninjury and illness cases within the private sector
Workers in certain occupations sustainnon-fatal injuries and illnesses at muchhigher rates than the overall workforce.
The proportion of the workforce that is employedin these high-risk occupations varies by state.
Putting Data to Work: Occupational Health Indicators from Thirteen Pilot States for 2000
42 Indicator Fifteen
INDICATOR 15:
Workers Employed in Occupations with High Risk for Occupational Morbidity
• The number and percent of workers employed in occupations with highrisk for occupational morbidity
Figure 14: Percentage of Workers in Industries with High Risk for Occupational Morbidity by State and U.S., 2000
0.0
2.0
4.0
6.0
8.0
10.0
12.0
USWIWANYNMNJNENCMIMEMACTCA
Perc
enta
ge US, 6.35.1
4.95.3
9.8
7.0
4.9 5.15.8
7.3
6.1 6.1 5.8

the “high-risk” occupations for this occupationalhealth indicator (Appendix B). The list of highrisk occupations was developed based on 1999BLS data from the Survey of Occupational Injuriesand Illness. In 2000, workers in high-risk occu-pations ranged from 4.9% to 9.8% of the totalemployed for 12 states (Figure 15). The numbersof workers in each state and nationwide employedin these occupations are shown in Table 15.
that resulted in days away from work. This wasequivalent to 1.9 cases per 100 full-time workers.Twenty-three occupations had injury and illnessrates of more than 5 per 100 full-time workers —more than two-and-a-half times the overall rate.While workers in these occupations made up only6% of the national private sector workforce, theyaccounted for 27% of cases with one or more daysaway from work. These 23 occupations comprised
Indicator Fifteen 43
Putting Data to Work: Occupational Health Indicators from Thirteen Pilot States for 2000
DATA SOURCE: Bureau of Labor Statistics’ Current Population Survey
TECHNICAL NOTES:• The list of high-risk occupations will be updated every five years since over time there will be some changes to the list as occupational mor-
bidity rates for individual occupations fluctuate. It is not anticipated that year-to-year changes will have significant effect on comparative ortrend analyses, but these changes will be evaluated.
Table 15. Number of Workers Employed in Occupations with High Risk for OccupationalMorbidity by State and U.S., 2000
CA CT MA ME MI NC NE NJ NM NY OR WA WI USWorkers in high-riskoccupations
823,344 81,070 168,952 48,357 303,658 266,035 54,349 197,938 46,559 438,564 N/A 167,147 205,222 8,165,899
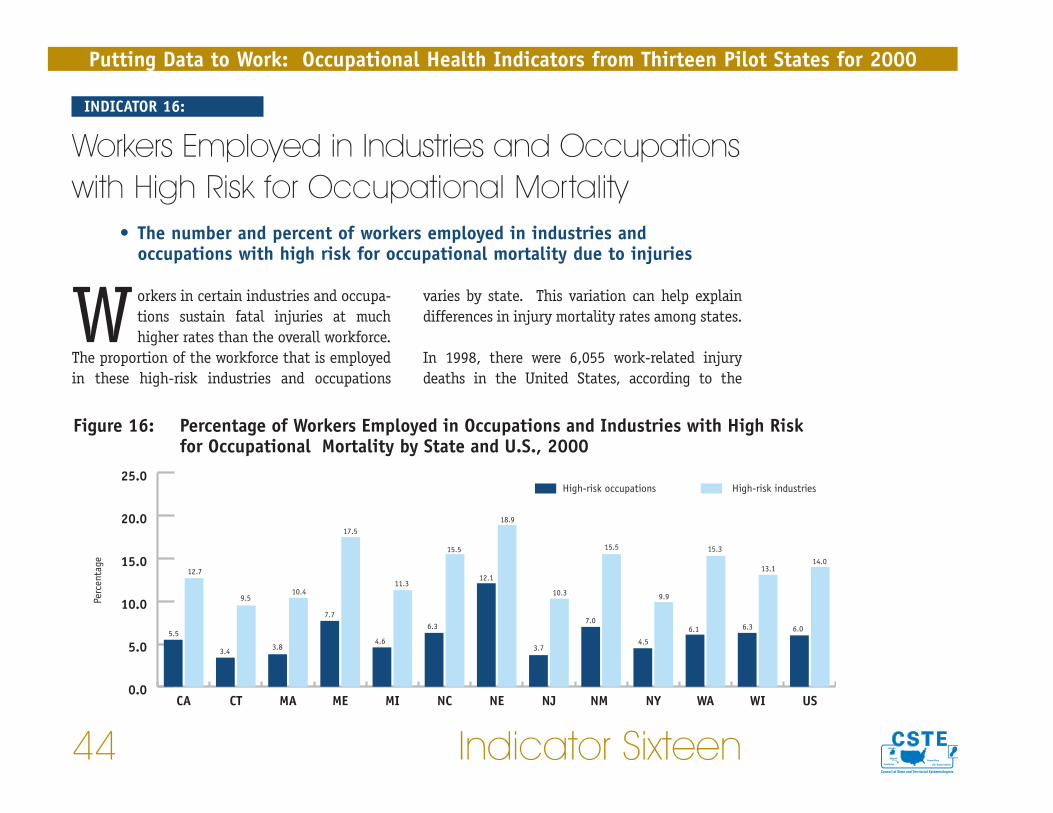
varies by state. This variation can help explaindifferences in injury mortality rates among states.
In 1998, there were 6,055 work-related injurydeaths in the United States, according to the
Workers in certain industries and occupa-tions sustain fatal injuries at muchhigher rates than the overall workforce.
The proportion of the workforce that is employedin these high-risk industries and occupations
Putting Data to Work: Occupational Health Indicators from Thirteen Pilot States for 2000
44 Indicator Sixteen
INDICATOR 16:
Workers Employed in Industries and Occupationswith High Risk for Occupational Mortality
• The number and percent of workers employed in industries andoccupations with high risk for occupational mortality due to injuries
Figure 16: Percentage of Workers Employed in Occupations and Industries with High Risk for Occupational Mortality by State and U.S., 2000
5.5
12.7
3.4
9.5
3.8
10.4
17.5
7.7
4.6
11.3
6.3
15.5
12.1
18.9
3.7
10.3
7.0
15.5
4.5
9.9
6.1
15.3
6.3
13.1
6.0
14.0
0.0
5.0
10.0
15.0
20.0
25.0High-risk industriesHigh-risk occupations
USWIWANYNM NJNENCMIMEMACTCA
Perc
enta
ge

was developed based on 1999 BLS data from theSurvey of Occupational Injuries and Illness.
In 2000, workers in high-risk industries for injurydeath ranged from 9.5% to 23.6% of the totalemployed in 12 states (Figure 16). The correspon-ding range for occupations was 3.4% to 12.1% for11 states. The numbers of workers employed inthese industries and occupations are shown foreach state and nationwide in Table 16.
Census of Fatal Occupational Injuries (CFOI),which is administered by the Bureau of LaborStatistics (BLS). This was equivalent to 4.5 deathsper 100,000 workers. Twenty-seven industrieshad injury fatality rates greater than 10 deathsper 100,000 workers in 1998. Workers in theseindustries comprised 14% of the private sectorworkforce, but sustained 58% of the fatal work-related injuries that year. Twenty-fouroccupations had fatality rates greater than 20 per100,000. Workers in these occupations made up6% of the private sector workforce, but sustained45% of the fatalities. These 27 industries and 24occupations comprised the “high-risk” groups forthis occupational health indicator (Appendix C).The list of high risk industries and occupations
Indicator Sixteen 45
Putting Data to Work: Occupational Health Indicators from Thirteen Pilot States for 2000
DATA SOURCE: Bureau of Labor Statistics’ Current Population Survey
TECHNICAL NOTES:• The list of high-risk industries and occupations will be updated every five years since over time there will be some changes to the list as
occupational mortality rates for individual occupations and industries fluctuate. It is not anticipated that year-to-year changes will have sig-nificant effect on comparative or trend analyses, but these changes will be evaluated.
Table 16. Number of Workers Employed in Occupations and Industries with High Risk forOccupational Mortality by State and U.S., 2000
CA CT MA ME MI NC NE NJ NM NY OR WA WI USWorkers in high-riskoccupations
900,723 57,487 122,124 50,985 229,095 242,142 107,761 149,603 56,081 385,518 N/A 176,948 177,067 7,729,698
Workers in high-riskindustries
2,059,762 158,799 330,864 116,171 564,231 592,293 168,235 416,753 122,986 852,171 N/A 441,669 370,917 18,117,819
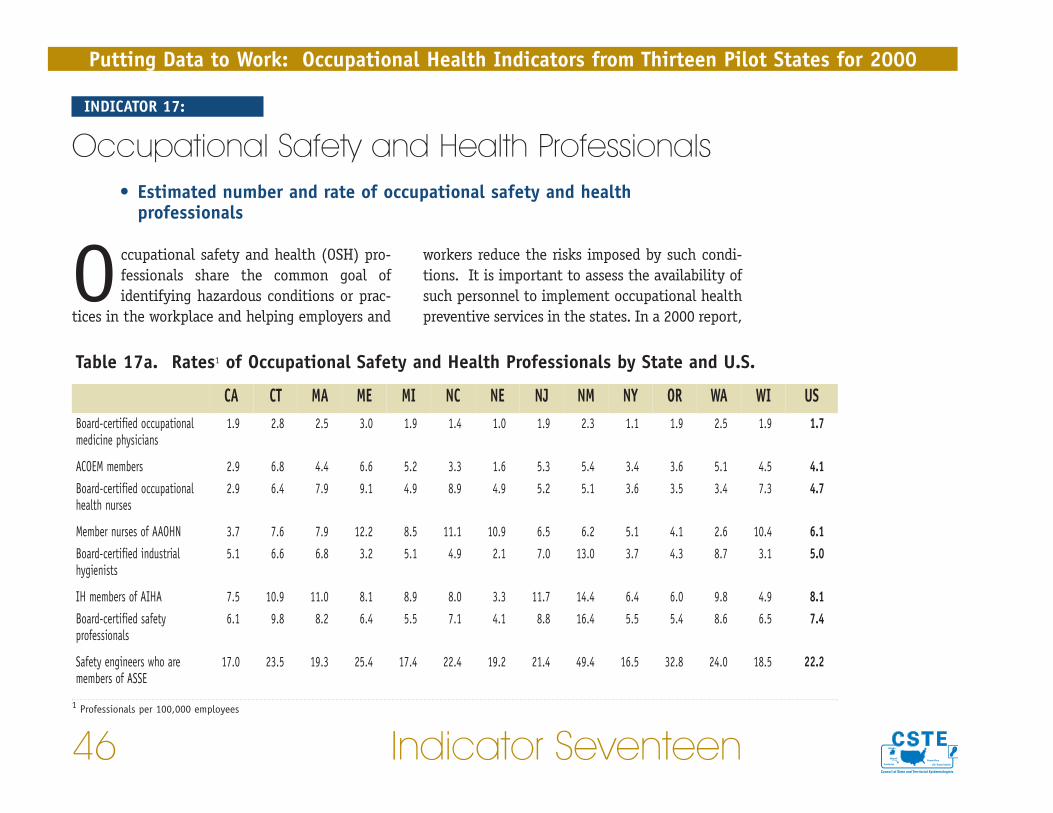
workers reduce the risks imposed by such condi-tions. It is important to assess the availability ofsuch personnel to implement occupational healthpreventive services in the states. In a 2000 report,
Occupational safety and health (OSH) pro-fessionals share the common goal ofidentifying hazardous conditions or prac-
tices in the workplace and helping employers and
Putting Data to Work: Occupational Health Indicators from Thirteen Pilot States for 2000
46 Indicator Seventeen
INDICATOR 17:
Occupational Safety and Health Professionals • Estimated number and rate of occupational safety and health
professionals
Table 17a. Rates1 of Occupational Safety and Health Professionals by State and U.S.
CA CT MA ME MI NC NE NJ NM NY OR WA WI USBoard-certified occupationalmedicine physicians
1.9 2.8 2.5 3.0 1.9 1.4 1.0 1.9 2.3 1.1 1.9 2.5 1.9 1.7
ACOEM members 2.9 6.8 4.4 6.6 5.2 3.3 1.6 5.3 5.4 3.4 3.6 5.1 4.5 4.1Board-certified occupationalhealth nurses
2.9 6.4 7.9 9.1 4.9 8.9 4.9 5.2 5.1 3.6 3.5 3.4 7.3 4.7
Member nurses of AAOHN 3.7 7.6 7.9 12.2 8.5 11.1 10.9 6.5 6.2 5.1 4.1 2.6 10.4 6.1Board-certified industrialhygienists
5.1 6.6 6.8 3.2 5.1 4.9 2.1 7.0 13.0 3.7 4.3 8.7 3.1 5.0
IH members of AIHA 7.5 10.9 11.0 8.1 8.9 8.0 3.3 11.7 14.4 6.4 6.0 9.8 4.9 8.1Board-certified safetyprofessionals
6.1 9.8 8.2 6.4 5.5 7.1 4.1 8.8 16.4 5.5 5.4 8.6 6.5 7.4
Safety engineers who aremembers of ASSE
17.0 23.5 19.3 25.4 17.4 22.4 19.2 21.4 49.4 16.5 32.8 24.0 18.5 22.2
1 Professionals per 100,000 employees

Association recommended a ratio of one OSHphysician per 1,000 employees.
This occupational health indicator provides infor-mation about occupational safety and healthprofessionals who are board-certified occupa-tional medicine physicians, members of theAmerican College of Occupational andEnvironmental Medicine (ACOEM), board-certifiedoccupational health nurses, members of theAmerican Association of Occupational HealthNurses (AAOHN), board-certified industrial
the Institute of Medicine estimated that approxi-mately 75,000 to 125,000 Americans are active oreligible members of professional societies repre-senting core OSH disciplines of occupationalsafety, industrial hygiene, occupational medicine,and occupational health nursing.34 The reportconcluded that “the continuing burden of largelypreventable occupational diseases and injuriesand lack of adequate OSH services in most smalland many large workplaces indicate a clear needfor more OSH professionals at all levels.”Previously, in 1989, the American Medical
Indicator Seventeen 47
Putting Data to Work: Occupational Health Indicators from Thirteen Pilot States for 2000
Table 17b. Numbers of Occupational Safety and Health Professionals by State and U.S.
CA CT MA ME MI NC NE NJ NM NY OR WA WI USBoard-certified occupationalmedicine physicians
303 47 79 21 94 53 9 78 18 97 33 73 53 2,341
ACOEM members 463 116 138 43 261 126 14 213 43 290 62 147 127 5,532Board-certified occupationalhealth nurses
466 110 250 63 240 339 44 208 40 306 60 97 206 6,637
Member nurses of AAOHN 594 129 250 84 425 424 98 263 49 436 71 74 293 8,182Board-certified industrialhygienists
824 113 214 22 257 188 19 284 103 316 74 251 87 6,688
IH members of AIHA 1,212 186 346 56 447 306 30 471 114 543 103 282 139 10,983Board-certified safetyprofessionals
995 168 257 44 278 269 37 354 130 466 92 249 185 9,992
Safety engineers who aremembers of ASSE
2,757 401 609 175 873 854 172 864 391 1,406 563 694 524 29,980
hygienists, members of the American IndustrialHygiene Association (AIHA), board-certifiedsafety professionals, and members of theAmerican Society of Safety Engineers (ASSE).
Rates of OSH professionals are shown in Table 17aby state and the U.S. Corresponding numbers areshown in Table 17b.
Putting Data to Work: Occupational Health Indicators from Thirteen Pilot States for 2000
48 Indicator Seventeen
DATA SOURCES: Numbers of health and safety professionals: Current membership rosters of cited organizations. Employment estimates used tocalculate rates: Bureau of Labor Statistics’ Current Population Survey.
TECHNICAL NOTES:• Records of past membership totals do not exist for most organizations. For this reason, membership counts for 2003 were used in the numera-
tor of this Indicator, while the number employed in 2000 was used in the denominator. • Counts of safety and health professionals may include retired individuals and individuals who devote the majority of their time to research
and have limited or no time for provision of actual preventive services. An individual may practice part-time or even full-time in the field ofoccupational health and not be board-certified or a member of the organization representing occupational health professionals.
• The completeness and frequency of updating addresses varies by each organization. Members are often listed in a database by a preferredaddress, which may not be the address where they practice.
• Other important occupational health specialties such as fire prevention, health physicists, occupational health psychologists, employee-assis-tance professionals, ergonomists, and health educators are not included.
issued by the agency. OSHA may issue citationsand impose fines on employers if violations arefound.
OSHA inspects worksites in response to reports offatal injuries or incidents resulting in multiplehospitalizations, worker complaints, and referralsfrom other agencies. OSHA also conducts pro-grammed inspections aimed at specific high-risk
The Occupational Safety and Health Act of1970 was passed by Congress to assure safeand healthy working conditions for every
working man and woman in the nation. Underthe Act, the United States Department of Labor’sOccupational Safety and Health Administration(OSHA) is authorized to conduct worksite inspec-tions to determine whether employers arecomplying with health and safety standards
Indicator Eighteen 49
Putting Data to Work: Occupational Health Indicators from Thirteen Pilot States for 2000
INDICATOR 18:
Occupational Safety and Health Administration(OSHA) Enforcement Activities
• Total number of establishments in the state under Federal/state OSHAjurisdiction
• Annual number of establishments inspected by Federal/state OSHA
• Annual number of employees whose work areas were inspected byFederal/state OSHA
• Percent of establishments under Federal/state OSHA jurisdiction inspectedby Federal/state OSHA
• Percent of employees in establishments under Federal/state OSHAjurisdiction whose work areas were inspected

tor worksites are subject to occupational safetyand health inspections conducted by state OSHAprograms. In 2000, there were 25 states and ter-ritories in which OSHA protections extended topublic sector workers. Farms with ten or fewerpaid employees, while technically under federalOSHA jurisdiction, are exempt from federal OSHAinspections, unless they have a temporary labor
industries, occupations or worksites with highinjury rates. Federal OSHA jurisdiction includesFederal employment but does not extend to stateand municipal government workplaces. However,under the OSHA Act, states may elect to adminis-ter their own safety and health programs that areat least as effective as federal OSHA programs. Inthese “state plan” states, public and private sec-
Putting Data to Work: Occupational Health Indicators from Thirteen Pilot States for 2000
50 Indicator Eighteen
Figure 18: Percentage† of Establishments under OSHA Jurisdiction Inspected by OSHA and of Workers in Establishments under OSHA Jurisdiction Whose Work Areas Were Inspected by OSHA, by State and U.S., 2000
1.0
3.2
0.9
2.8
0.9
2.0 2.0
6.3
2.6
5.9
1.8
5.1
0.6
1.61.2
3.2
0.9
2.5
0.9
4.03.8
8.3
3.2
8.5
0.9
6.2
1.2
3.4
0
1
2
3
4
5
6
7
8
9Estimated percentage of employees in establishments under OSHA jurisdiction whose work areas were inspected
Estimated percentage of all establishments under OSHA jurisdiction inspected by OSHA
US***WIWA*ORNY**NM*NJNENC*MI*MEMACT**CA*
Perc
enta
ge
† State-specific denominators exclude mining for all states, exclude agriculture for all states except CA and NC, and exclude public sector workers in MA, NE and WI. Dataincludes both federal OSHA coverage (including federal agencies) and OSHA-approved state plan coverage (including state and local government)
* These states are “state plan” states, which cover both the private and public sectors.** These states have “public sector only” state plans where federal OSHA has jurisdiction over the private sector and state agencies have jurisdiction over the public sector.***The U.S. percentage is for private sector only and excludes mining and agriculture.

suade employers from violating health andsafety standards.35
This occupational health indicator (OHI) providesa measure of the numbers and proportions ofworkers and worksites potentially benefitingdirectly from Federal/State OSHA inspectionactivity. Nationwide in 2000, Federal and StateOSHA programs conducted approximately 91,563workplace inspections. Approximately 4,423,300individuals, or 3.4% of the workforce underFederal or State OSHA jurisdiction, were employedin work areas covered by these inspections. The
camp. They are also exempt from inspections inmost state plan states. The mining industry iscovered by a separate federal agency – the MineSafety and Health Administration.
Nationwide, almost eight million workplaces arecovered by the OSHA Act. Federal OSHA and“state-plan” states have approximately 1,100and 1,350 inspectors, respectively. Clearly onlya small percentage of worksites can be inspectedon an annual basis. The possibility of inspectionand of subsequent penalties if violations arefound is intended as a general deterrent to dis-
Indicator Eighteen 51
Putting Data to Work: Occupational Health Indicators from Thirteen Pilot States for 2000
Table 18. Number of Establishments Inspected by OSHA and Numbers of Workers Covered byInspections, by State and U.S., 20001
CA CT MA ME MI NC NE NJ NM NY OR WA WI USTotal number ofestablishments underFederal/State OSHAjurisdiction
1,026,355 107,787 187,391 44,865 260,885 222,234 48,127 270,384 44,956 529,104 107,268 221,150 145,872 7,870,222
Annual number ofestablishments inspectedby Federal/State OSHA
10,022 997 1,590 784 6,810 3,859 291 3,332 409 4,741 4,071 7,021 1,264 91,563
Annual number ofemployees whose workareas were inspected byFederal/State OSHA
473,543 46,817 56,343 30,758 270,338 193,857 11,666 123,661 17,640 289,549 131,307 229,100 151,287 4,423,312
1 Data includes both federal OSHA coverage (including federal agencies) and OSHA-approved state plan coverage (including state and local government)

binding standards and voluntary guidelines prom-ulgated by Federal and State OSHA and supporteducational outreach and programs for employersand employees. In addition, OSHA funds a consul-tation program delivered by the states. This OHIdoes not measure these activities. Nor does thisOHI measure the quality of OSHA inspections,such as the extent to which the worksite target-ing activity has successfully identified workplaceswhere there are violations of worksite health andsafety standards.
percentage of all establishments under OSHAjurisdiction that were actually inspected by OSHA in 2000 ranged from 0.6% to 3.8%. Thehighest percentages were observed in several“state plan” states. The percentage of workers inestablishments under OSHA jurisdiction whosework areas were inspected ranged from 1.6% to8.5% (Figure 18). The corresponding numbers ofestablishments under Federal or State OSHA juris-diction, inspections, and workers covered in eachstate are included in Table 18.
Federal OSHA and State plans also conducts arange of activities in addition to enforcement.They provide assistance in complying with legally
Putting Data to Work: Occupational Health Indicators from Thirteen Pilot States for 2000
52 Indicator Eighteen
DATA SOURCES: Numbers of OSHA inspections and workers covered by OSHA inspections: OSHA Office of Statistics. Number of establishmentsand workforce estimates: Bureau of Labor Statistics’ Covered Employers and Wages (ES 202).
TECHNICAL NOTES:• Because OSHA may conduct multiple inspections of the same establishment during the calendar year, the percent of establishments inspected
may be slightly overestimated. Likewise, if OSHA conducts multiple inspections of the same worksite during the year, the number of workerscovered by OSHA inspections may be over-counted. Given that relatively few repeat inspections of the same establishments are conducted byOSHA each year, the impact on the Indicator values should be negligible.
• Although all farms technically are under jurisdiction, farms with fewer than 11 employees are not subject to federal OSHA inspection becauseof a congressional budgetary rider. Farming establishments were excluded from the denominator (i.e., the number of establishments underOSHA jurisdiction) in all states except CA and NC for the following reasons: 1) it was not possible to differentiate between large and smallfarms (with 10 or fewer employees); 2) data from the 2002 Census of Agriculture indicated that most farms had 10 or fewer employees andwere therefore not covered by OSHA; 3) evaluation of OSHA inspections in several states indicated few inspections of large farms were con-ducted. All farms are covered in CA and NC “state-plan” states, so these states did not exclude agriculture in their calculations.

injuries or illnesses while limiting the liabilityexposure of employers. Workers’ compensationprovides benefits to partially replace lost wagesand pay for medical expenses associated with awork-related injury or illness. In case of a
Workers’ compensation was first imple-mented in the United States in 1911in nine states and in subsequent years
by all states. This state-based social insuranceprogram was developed to provide guaranteedcompensation for workers with work-related
Indicator Nineteen 53
Putting Data to Work: Occupational Health Indicators from Thirteen Pilot States for 2000
Figure 19: Average Workers' Compensation Benefit Paid per Covered Worker* by State and U.S., 2000
2.5
613
404
209
437
356
216 211
280
211
340
265
568
290
363
0
100
200
300
400
500
600
700
USWIWAORNYNM NJNENCMIMEMACTCA
Dolla
rs P
aid
INDICATOR 19:
Workers’ Compensation Awards• Annual workers’ compensation benefits paid and average amount paid per
covered worker
*All workers in the state who are eligible for compensation should they sustain work-related injuries or illnesses are considered “covered” workers

sation eligibility, reimbursement, and otheradministrative regulations governing workers’compensation. Therefore, differences amongstates in benefits paid could be due to a varietyof factors other than injury and illness incidence.For this reason, this occupational health indicatorshould be used to monitor trends within statesover time rather than to compare states.
Figure 19 illustrates workers’ compensation bene-fits paid per covered worker for 13 states and theU.S. in 2000. All workers in the state who are eli-gible for compensation should they sustain awork-related injury or illness are considered “cov-ered” workers. The corresponding total annualbenefits paid are listed in Table 19. Benefits paidranged from $136.8 million to $8.9 billion.
death, the worker’s dependents are eligible forsurvivor benefits.
While the amount of benefits paid is an indica-tor of the direct financial cost of work-relatedinjuries and illnesses, it does not reflect theirtrue burden. Indirect costs to the employer andworker are not taken into account. In addition,some workers who are eligible for benefits donot file. Finally, several types of workers maynot be covered by state workers’ compensationsystems, including the self-employed, corporateexecutives, domestic and agricultural workers,federal employees, and railroad, long shore, andmaritime workers.
There are substantial differences between statesin wages and medical costs, in workers’ compen-
Putting Data to Work: Occupational Health Indicators from Thirteen Pilot States for 2000
54 Indicator Nineteen
Table 19. Workers’ Compensation Awards by State and U.S, 2000
CA CT MA ME MI NC NE NJ NM NY OR WA WI USTotalbenefits paid (in thousands $)
8,949,070 667,056 666,455 252,283 1,574,467 788,369 179,988 1,066,542 136,830 2,828,018 412,710 1,449,070 768,282 45,909,689
DATA SOURCE: Total amount and average benefits paid: National Academy of Social Insurance.

Data SourcesThe following sources were used to obtain data for the 19 occupational health indicators (OHIs) and theemployment demographics for the 13 states. The last five sources were used to quantify the appropriatepopulation at risk (i.e., denominators) for the calculation of rates.
Death Certificates Funeral directors, attending physicians, and medical examiners or coroners are usually respon-sible for the personal and medical information recorded on death certificates. Local registrarsassure that all deaths in their jurisdictions are registered and that required information isdocumented before sending certificates to the state registrar. State registrars number and filethe death certificates and forward certificates of nonresidents to the appropriate state. Allstates send death certificate data to the National Vital Statistics System, managed by theCDC’s National Center for Health Statistics.
The cause-of-death section on the certificate, which is similar in all states, contains theimmediate, contributing and underlying causes of death. Since 1999, these causes have beencoded according to the International Classification of Diseases, tenth revision (ICD-10)36 for-mat. For injury deaths, all state death certificates include a query about whether the incidentoccurred at work.
Cancer RegistriesData on cancer incidence are centralized in registries in all but five states in the UnitedStates. The sources of these data include hospitals, physician offices, surgery centers, labo-ratories, and death certificates. Legislation usually requires the reporting of all in situ ormalignant neoplasms, but there is some slight variation in reportable cases by state.Standards for the operation of registries (e.g., data definitions, data transmission methodolo-gies, and quality assurance) have been developed by the North American Association ofCentral Cancer Registries (NAACCR) (some state cancer registries do not yet meet all NAACR
Indicator 55
Putting Data to Work: Occupational Health Indicators from Thirteen Pilot States for 2000
Putting Data to Work: Occupational Health Indicators from Thirteen Pilot States for 2000
56 Data Sources
standards for data competencies and quality). Diagnoses are coded according to theInternational Classification of Diseases for Oncology (ICD-O).37
State Hospital Discharge Data Patient demographics, diagnoses, and billing information are contained within hospital med-ical records. Upon patient discharge from a hospital, these data are computerized usingstandard formats. Diagnoses are coded according to the International Classification ofDiseases system, currently ICD-9-CM.38 Pneumoconioses are considered, by definition, work-related diseases. Most acute-care hospitals participate in mandatory or voluntary systems forcompiling discharge data at the state level.
While there is no specific query as to the work-relatedness of any other illnesses or injuries,a useful proxy for work-related injury is workers’ compensation insurance as the payer.
Hospital discharge data have several limitations for providing information on occupationalhealth. Personal identifiers are not available in most states’ data sets, thus repeat hospitaliza-tions of the same individual cannot readily be identified. The ICD classification system by itselfcan be used to identify only one class of work-related illnesses, pneumoconiosis. Workers’ com-pensation as the payer source is more sensitive in identifying injuries than illnesses. Illnessesare much harder to associate with a work condition due to the non-specificity of many occupa-tional diseases or the long latency between exposure and onset of overt disease. Hospitaldischarge data generally do not include hospitalizations of their residents who have been hos-pitalized in another state. Federal hospitals (military and veterans hospitals) are not includedin most state hospital discharge data sets.
State Workers’ Compensation SystemsWorkers’ compensation is a no-fault insurance system designed to provide compensation toworkers who sustain work-related injuries or illnesses while limiting the legal liability ofemployers. All states and the District of Columbia have workers’ compensation systems, andall employers, except those in Texas, are required to have this form of insurance for their
Data Sources 57
Putting Data to Work: Occupational Health Indicators from Thirteen Pilot States for 2000
employees. Several federal workers’ compensation systems exist for the protection of selectgroups of workers, such as federal workers, and longshore, and harbor workers, and are out-side of state governance.
State workers’ compensation systems are the result of individual state legislation and regula-tion.39 States may allow employers to self-insure, group self-insure, insure through privatecarriers, or insure through a state fund. Coverage exemptions differ between states; commonexemptions include employment in the public and private sector, specified occupations, andthe size of the employer. Marked state-to-state differences exist in the statute of limitationsfor filing a work-related injury or illness claim, the procedures for filing a claim, and therequirements governing claim adjudication. State laws governing benefits for disability, wait-ing periods for wage replacement, wage replacement amounts, medical payments, andvocational rehabilitation make comparisons of benefits across states difficult. In addition,there may be considerable variability in the types of data collected, the data coding systemsused, and the availability of data for research purposes. The variability in workers’ compen-sation laws across states represents a significant limitation of using these data to makestate-to-state comparisons.
Occupational Safety and Health Professionals Members of occupational safety and health professional associations, including the AmericanCollege of Occupational and Environmental Medicine (ACOEM), the American Association ofOccupational Health Nurses (AAOHN), the American Industrial Hygiene Association (AIHA),and the American Society of Safety Engineers (ASSE), serve as resources to promote primary,secondary, and tertiary prevention of occupational injury and illness. Certain educationaland/or work experiences are required for membership and typically a fee is charged.
Certification in an occupational health specialty demonstrates satisfactory completion ofaccepted criteria developed by a specialty board (e.g., American Board of Occupational HealthNursing). To be board-certified, the occupational safety and health professional must pass a

Putting Data to Work: Occupational Health Indicators from Thirteen Pilot States for 2000
58 Data Sources
certification exam, have practiced in his or her specialty area for a certain period of time, andhave completed certain educational requirements.
Using professional association data to assess the availability of occupational health profes-sionals has a number of limitations. Members often provide a preferred address that does notnecessarily represent their work location. Membership rolls may include retired occupationalhealth professionals. Organizations generally do not archive their membership informationthat would allow them to provide data on their membership rolls for previous years. The infor-mation obtained from organizations reflects current membership status. Some occupationalhealth professionals may not be members of these organizations.
Survey of Occupational Injuries and Illnesses The Survey of Occupational Injuries and Illnesses (Annual Survey), conducted by the Bureauof Labor Statistics (BLS) in the U.S. Department of Labor, provides annual estimates of thenumbers and incidence rates of work-related injuries and illnesses among private sector work-ers nationwide. Information is collected through an Annual Survey mailed to a stratifiedrandom sample of establishments. Employers are asked to provide information on all work-related injuries and illnesses recorded as required under the Occupational Safety and HealthAdministration (OSHA) record-keeping standard 29 CFR 1904. Recordable injuries and ill-nesses include those that result in loss of consciousness, one or more days away from work torecuperate, restricted work activity, transfer to another job, or medical treatment beyond sim-ple first aid. More detailed information on worker demographics and the nature andcircumstances of the injuries and illnesses is collected for cases resulting in days away fromwork. The Annual Survey also collects data on the average number of workers employed andthe total hours worked at each establishment, information that allows BLS to calculate rates.Since 1996, the Survey sample has included approximately 180,000 private sector establish-ments nationwide.
Many states choose to participate in the federal-state survey program, which involves alloca-tion of state resources. For these states, the survey data are used to generate state as well
Data Sources 59
Putting Data to Work: Occupational Health Indicators from Thirteen Pilot States for 2000
as national estimates. An independent sample is selected for each state. Annual Survey esti-mates are not produced for states not electing to participate (eight as of June, 2004). In 26states and U.S. territories – including all those where the public sector is covered by a stateOSHA plan – the Annual Survey includes public sector workers. Because the Annual Survey isbased on a sample – and not a census – of all establishments, the Survey findings are esti-mates with corresponding sampling errors. In some participating states, the sample sizes areinsufficient to generate statistically reliable state-specific results for all the detailed cate-gories BLS publishes for the nation. BLS adheres to strict publication guidelines based on thereliability of the estimates; numbers and rates are not published or released by BLS if the esti-mates do not meet these guidelines.
The self-employed, farms with fewer than 11 employees, private households, federal agencies,and the military are not covered in the Survey. In states that do not participate or choosenot to collect public sector data, the Survey also does not cover state and municipal employ-ees. In addition, it is well recognized that the Survey undercounts work-related illnesses,especially long-latency illnesses that may not appear until years after individuals have lefttheir place of employment. There is also some evidence that work-related injuries are under-reported.5,6
Census of Fatal Occupational InjuriesThe Census of Fatal Occupational Injuries (CFOI), conducted by the Bureau of Labor Statistics(BLS) in the U.S. Department of Labor, is a federal-state cooperative program that compilesan annual census of fatal occupational injuries at both the state and national levels. For adeath to be counted, the decedent must have been working for pay, compensation or profitat the time of the event, engaged in a legal work activity, or present at the site of the inci-dent as a requirement of his or her job. The census includes unintentional injuries (e.g., falls,electrocutions, motor vehicle crashes) and intentional injuries (homicide and suicide). Deathsdue to occupational illnesses are excluded.
Putting Data to Work: Occupational Health Indicators from Thirteen Pilot States for 2000
60 Data Sources
CFOI uses multiple data sources to identify and document work-related injury deaths. Thesesources include, among others, death certificates, workers’ compensation records, reports toregulatory agencies, and medical examiner and police reports, as well as reports in the newsmedia. Multiple sources are used because studies have found that no single source capturesall deaths. In addition, two or more sources are required to ensure an accurate count by inde-pendently substantiating that incidents were work-related. Due to this methodology, CFOIcounts are considered a complete or nearly complete ascertainment of work-related injurydeaths.
Poison Control CentersPoison control centers (PCCs) are available nationwide to provide assistance 24 hours a day tocallers with concerns about actual or potential exposure to substances. Most PCCs track callsand manage case information electronically using ToxiCall®. Centers submit data on a real-time basis to the American Association of Poison Control Centers (AAPCC) for inclusion in theirToxic Exposure Surveillance System (TESS). In 2002, 64 PCCs representing 99.8% of thenation’s population submitted data to the AAPCC.40
PCCs categorize inquiries as human or animal exposures, or non-exposures and information-only.For nearly half of human exposure calls, PCCs follow up to provide further guidance, confirm com-pliance with recommendations, and gather outcome data.40 The types of information gathered byPCCs include demographics, type of substance(s) involved, symptoms, intentionality of exposure,whether the exposure was work-related, location of exposure (e.g., workplace), and medical out-come. PCCs do not systematically collect information on industry and occupation. Centers thatuse ToxiCall® can generate nearly 100 standard reports or create ad hoc reports to meet more spe-cific needs.
A significant limitation of PCC data for occupational surveillance is that it is a passive sys-tem; that is, it relies on cases to be reported. To report a case, the poisoned individual or ahealth care worker has to know about the existence of a PCC, consider it a source of assis-tance for addressing a work-related illness, and know how to contact the PCC. Because of the

Data Sources 61
Putting Data to Work: Occupational Health Indicators from Thirteen Pilot States for 2000
passive surveillance system design, it is likely that PCC data underestimate the true extent ofwork-related chemical exposures. Furthermore, health care workers with more experience inmanaging work-related poisoning may be less likely to use PCCs. Thus, under-reporting mayvary by state to some degree according to the experience and expertise of health care work-ers.
Adult Blood Lead Epidemiology and SurveillanceThe Adult Blood Lead Epidemiology and Surveillance (ABLES) system, a state-based programfunded by CDC’s National Institute for Occupational Safety and Health (NIOSH), commenced in1987 in four states. By 2004, 37 states were participating in the system. Surveillance of elevatedblood lead levels (BLLs) provides a method for identifying industries and occupations whereworkers are at high risk for exposure to lead.
States participating in ABLES require that clinical laboratories report BLL results to a stateagency. The lowest BLL to be reported varies from state to state. Laboratory reports includebasic demographic information. States use unique identifiers to differentiate between newand existing cases and to account for multiple reports for the same person. In some ABLESstates, physicians also are required to report adults with elevated BLLs. Most states follow upreports of elevated BLLs to determine the sources of lead exposure, including the name of theemployer, and additional information about the exposed individual.
The Occupational Safety and Health Administration (OSHA) requires that lead be measured clini-cally in workers exposed to airborne lead exceeding a certain level. Because of this requirementand because laboratories generally comply with the reporting requirement, ABLES programs arebelieved to identify a substantial portion of lead-exposed workers. However, they do not capturelead-exposed individuals whose employers are not in compliance with the biological monitoringrequirements, or individuals tested by laboratories that are not compliant with the reportingrequirement.

Putting Data to Work: Occupational Health Indicators from Thirteen Pilot States for 2000
62 Data Sources
Data from ABLES states are submitted to NIOSH, where they are aggregated. Analyses basedon the aggregate data are published in CDC’s Morbidity and Mortality Weekly Report (MMWR).The aggregated data from ABLES are not necessarily representative of the nation as there isless than 100% participation; states that participate were not selected based on representa-tiveness.
OSHA Integrated Management Information SystemThe mission of the Occupational Safety and Health Administration (OSHA) is to prevent work-related injuries, illnesses, and deaths. To address this mission, OSHA develops standards,enforces compliance with these standards, and provides compliance assistance. OSHA con-ducts both referral and non-referral inspections to address compliance issues. Enforcementinspections are performed in the following conditions: the worksite was selected randomly;the worksite belongs to an industry with an excessive injury rate; there was an injury fatal-ity or other catastrophe; a worker filed a complaint; or an outside source made a referral toOSHA.
Information on enforcement inspections is maintained in the Integrated ManagementInformation System (IMIS). IMIS is utilized by OSHA as an electronic management tool andinformation resource to help direct its resources. It is used also by state agencies that carryout federally-approved OSHA programs. A wide variety of data are contained within IMIS,including the type of inspection conducted, reason for inspection, inspection date, state inwhich the worksite is located, worksite type, and number of employees at each inspectedworksite. The source of information in IMIS is the local, state, or federal office in the geo-graphical area where the activity occurred. Information is entered in an ongoing manner inthe course of agency activities.
It is difficult to quantify the number of unique establishments inspected (and thus uniqueworkers impacted) because IMIS has entries listed by inspections rather than establishment.Because IMIS is an administrative database, the data are not static, but can change over time.
Data Sources 63
Putting Data to Work: Occupational Health Indicators from Thirteen Pilot States for 2000
CensusThe U.S. Census Bureau takes the census of the entire nation in years ending in zero. The firstcensus of the U.S. was taken in 1790 as mandated by the Constitution for the purpose ofapportionment of representatives for the seats in the House of Representatives. Census dataalso are used to distribute government funding, draw state legislative districts, identify pop-ulations in need of services, determine business locations, and for many other purposes.
In Census 2000, a short form was sent to every household, and a long form with more detailedquestions was sent to a sample of about one in six households. The short form ascertainedbasic demographics, while the long form sought information on social, economic, and finan-cial characteristics of individuals, and physical characteristics of housing. The economiccharacteristics included labor force status, place of work, occupation, industry, work status,and income. Following Census 2000, there was debate about undercounting the population.Subsequently, the Census Bureau performed a coverage measurement survey. Based on surveyresults, the Bureau decided that no adjustments would be made.
County Business PatternsThe U.S. Census Bureau annually produces County Business Patterns (CBP), which providesnational economic data by industry. CBP data represent the number of employees working inthe primary industry of an establishment, regardless of the individuals’ occupations withinthat establishment. CBP data include the total number of establishments, mid-March employ-ment, first quarter and annual payroll, and number of establishments by nineemployment-size classes for all counties in the United States and the District of Columbia.
CBP data are extracted from the Business Register, the U.S. Census Bureau’s file of all knownsingle and multi-establishment companies. The Annual Company Organization Survey andEconomic Censuses, which are conducted every five years, provide individual establishmentdata for multi-location firms. Data for single-location firms are obtained from various pro-grams conducted by the Census Bureau, such as the Economic Censuses, the Annual Survey ofManufacturers, and Current Business Surveys, as well as from administrative records of the

Putting Data to Work: Occupational Health Indicators from Thirteen Pilot States for 2000
64 Data Sources
Internal Revenue Service (IRS), the Social Security Administration (SSA), and the Bureau ofLabor Statistics (BLS).
Data are obtained for all employees excluding self-employed individuals, employees of privatehouseholds, railroad employees, agricultural production employees, and most governmentemployees. CBP quantifies full- and part-time employees who are on the payroll in the payperiod including March 12. Beginning in 1998, data are tabulated by industry as defined inthe North American Industry Classification System: United States, 1997 (NAICS). Data for 1997and earlier years are based on the Standard Industrial Classification (SIC) System.
Current Population SurveyThe Current Population Survey (CPS) is a monthly survey of about 60,000 households repre-senting the civilian non-institutionalized population of the United States. It is conducted bythe U.S. Census Bureau for the Bureau of Labor Statistics. The CPS ascertains demographics,employment status, weekly hours worked, and industry and occupation of each householdmember aged 15 years and older. The inquiry relates to activity or status during the calen-dar week that includes the 12th day of the month. Among the ways BLS makes the surveydata available are an annual report titled “Geographic Profile of Employment andUnemployment” and a data analysis program, “DataFerrett,” that users can download from theInternet.
The occupational and industrial classifications of CPS data for 1992 through 2002 were basedon the coding systems used in the 1990 Census. Since then, the CPS has changed its codingsystems for occupation and industry. More information can be found at www.census.gov.
The CPS undercounts certain racial/ethnic workers who have no permanent address or aremigratory in nature. Because CPS estimates are based on a survey rather than a complete cen-sus of the population, they are subject to sampling error.

Data Sources 65
Putting Data to Work: Occupational Health Indicators from Thirteen Pilot States for 2000
National Academy of Social InsuranceThe National Academy of Social Insurance (NASI) is a non-profit, non-partisan organizationdedicated to the study of social insurance programs such as workers’ compensation, Medicare,and unemployment insurance. NASI produces an annual research report estimating theannual benefits, coverage, and costs associated with workers’ compensation systems at thestate level.
NASI estimates the number of workers covered by workers’ compensation insurance by utiliz-ing state unemployment insurance data. These data are then adjusted for differences inworkers’ compensation coverage laws with unemployment insurance coverage laws within astate. NASI estimates the cost of workers’ compensation benefits by soliciting informationfrom federal and state agencies, and by utilizing data from private organizations such as A.M.Best and the National Council on Compensation Insurance.
Workers’ compensation award payments are frequently made over time, thus the annualawards measured by NASI may not reflect the full cost of injuries and illnesses for a givenyear. There is significant variation in workers’ compensation systems from state to state.Therefore, comparisons across states for measures such as level of coverage and benefits paidper covered worker are problematic.
Quarterly Census of Employment and WagesThe Quarterly Census of Employment and Wages (QCEW) — previously known as the CoveredEmployment and Wages or the ES-202 program — is a near-census of monthly employmentand quarterly wage information. Employment data represent the number of workers coveredby state unemployment insurance laws who worked during, or received pay for, the pay periodincluding the 12th of the month. Excluded from the QCEW are those in the military, the self-employed, proprietors, domestic workers, unpaid family workers, and railroad workers. QCEWdata provide figures that represent where individuals work, not where they live.

Putting Data to Work: Occupational Health Indicators from Thirteen Pilot States for 2000
66 Data Sources
At the national level, QCEW publishes employment and wage data for nearly every NorthAmerican Industry Classification System (NAICS) industry. At the state, county, and metropol-itan levels, it publishes these data down to the 6-digit NAICS industry level, assuming thatconfidentiality can be maintained. QCEW publishes a subset of its quarterly data through anonline data query system and full quarterly industry detail data in ASCII format at all geo-graphic levels.

Glossary 67
Putting Data to Work: Occupational Health Indicators from Thirteen Pilot States for 2000
GlossaryEstablishments
The physical location of a certain economic activity — for example, a factory, mine, store, oroffice.
Incidence rateA measure of the frequency with which a new case of illness occurs in a population over aperiod of time. The denominator is the population at risk; the numerator is the number ofnew cases occurring during a given time period.
IndicatorA construct of public health surveillance that defines a measure of health (i.e., the occurrenceof a disease or other health-related event) or a factor associated with health (i.e., health sta-tus or other risk factor) among a specified population.
IndustryA group of establishments that produce similar products or provide similar services.
Lost-time claimA workers’ compensation term referring to a claim for benefits to partially reimburse anemployee for lost wages due to a work-related injury or illness.
Medical-only claimA workers’ compensation term referring to a claim for benefits to reimburse an employee formedical expenses but not lost wages due to a work-related injury or illness.
N/AAbbreviation for “not available”
Putting Data to Work: Occupational Health Indicators from Thirteen Pilot States for 2000
68 Glossary
OccupationAn occupation relates to the activity performed by a worker.
Prevalence rateThe proportion of persons in a population who have a particular disease or attribute at a spec-ified point in time or over a specified period of time.
Standardization An analytic procedure to reduce the biasing effect of confounding variables (e.g., age) whencomparing two or more populations, sometimes called adjustment.
SurveillanceThe ongoing, systematic collection, analysis, and interpretation of health data essential to theplanning, implementation, and evaluation of public health practice, closely integrated withthe timely dissemination of these data to those who need to know.
Work-related illnessAn illness arising out of employment due to exposure to a health hazard. Because of thelatency of some illnesses (i.e., a lengthy period between first exposure and development ofdisease), some work-related illnesses occur when the individual is no longer employed in thejob where exposure occurred.
Work-related injuryAn injury arising out of or during the course of employment.
References 69
Putting Data to Work: Occupational Health Indicators from Thirteen Pilot States for 2000
References1 National Academy of Social Insurance. Workers’ Compensation: Benefits, Coverage, and Costs,2000 New estimates. June 2002. Available: http://www.nasi.org/usr_doc/nasi_wkrs_comp_6_26_02_pdf
2 Leigh JP, Markowitz SB, Fahs M, Shin C, Landrigan PJ. Occupational Injury and Illnesses inthe United States Estimates of Costs, Morbidity and Mortality. Arch of Intern Med1997;157:1557-1568.
3 Council of State and Territorial Epidemiologists. Occupational Health Indicators: A Guide forTracking Occupational Conditions. Nov. 2004. Available: http://www.cste.org/pdffiles/Revised%20Indicators_12. 14.04.pdf
4 Leigh JP et al. An estimate of the US governments’s undercount of nonfatal occupationalinjuries. J Occup and Environ. Med. 2004; 46 (No. 1)
5 Conway H, Svenson J. Occupational injury and illness rates,1992-1996: why they fell. MonLabor Rev. 1998; 121(11)36-58.
6 Azaroff LS, Levenstein C, Wegman DH. Occupational Injury and Illness Surveillance:Conceptual Filters Explain Underreporting. AJPH. 2002; 92(9):1421-1429.
7 Dembe AE, Mastroberti MA, Fox SE, Bigelow C, Banks SM. Inpatient hospital care for work-related injuries and illnesses. Am J Ind Med 2003; 44:331-342.
8 Sorock GS, Smith E, Hall N. An evaluation of New Jersey’s hospital discharge database forsurveillance of severe occupational injuries. Am J Ind Med 1993; 23:427-437.

Putting Data to Work: Occupational Health Indicators from Thirteen Pilot States for 2000
70 References
9 National Institute for Occupational Safety and Health. Worker Health Chartbook, 2004.Cincinnati, OH: U.S. Department of Health and Human Services, Center for Disease Control andPrevention, DHHS (NIOSH) Publication No. 2004-146. 2004. Available:http://www.cdc.gov/niosh/docs/chartbook/pdfs/2004-146.pdf
10 Centers for Disease Control and Prevention. Occupational burns among restaurant workers– Colorado and Minnesota. MMWR. 1993; 42:713-716.
11 Baggs J, Curwick C, Silverstein B. Work-related burns in Washington State, 1994-1998. JOccup Environ Med. 2002; 44:692-9.
12 Rossignol AM, Locke JA, Burke JF. Employment status and the frequency and causes of burninjuries in New England. J Occup Med. 1989; 31:751-757.
13 Sorock GS, Smith E, Hall N. An evaluation of New Jersey’s hospital discharge database forsurveillance of severe occupational injuries. Am J Ind Med. 1993; 23:427-437.
14 National Institute for Occupational Safety and Health. Worker Health Chartbook, 2004.Cincinnati OH: U.S. Department of Health and Human Services, Center for Disease Control andPrevention, DHHS (NIOSH) Publication No. 2004-146. 2004. Available: http://www.cdc.gov/niosh/docs/chartbook/pdfs/2004-146.pdf
15 Institute of Medicine and National Research Council, Musculoskeletal Disorders and theWorkplace; Low back and Upper Extremities. National Academy Press, Washington, D.C. 2001,page 58.
16 National Institute for Occupational Safety and Health. Musculoskeletal disorders and work-place factors: a critical review of epidemiologic evidence for work-related musculoskeletal disordersof the neck, upper extremity, and low back. Cincinnati, OH: U.S. Department of Health and

References 71
Putting Data to Work: Occupational Health Indicators from Thirteen Pilot States for 2000
Human Services, Centers for Disease Control and Prevention. DHHS (NIOSH) Publication No.97-141. 1997.
17 Tanaka S, Wild DL, Seligman PJ, Halperin WE, Behrens VJ, Putz-Anderson V. Prevalence andwork-relatedness of self-reported carpal tunnel syndrome among U.S. workers: analysis of theoccupational health supplement data of the 1988 national health interview survey. Am J IndMed. 1995; 27:451-470.
18 Christiani DC, Wegman DH. Respiratory disorders, In: Occupational Health: Recognizing andPreventing Work-Related Disease (3rd ed.) Levy BS, Wegman DH (eds.) Little, Brown, 1995:427-454.
19 National Institute for Occupational Safety and Health. Work-related lung disease surveillancereport 2002. Cincinnati, OH: U.S. Department of Health and Human Services, Centers forDisease Control and Prevention. DHHS (NIOSH) Number 2003-111. 2003.
20 Rosenman KD, Reilly MJ, Henneberger PK. Estimating the total number of newly recognizedsilicosis cases in the United States. Am J Ind Med. 2003; 44:141-147.
21 Goodwin S., Stanbury M, Wang, M-L, Silbergeld, E, Parker, JE. Previously undetected silico-sis in New Jersey decedents. Am J Ind Med. 2003; 44:304-311.
22 Calvert GM, Plate DK, Das R, Rosales R, Shafey O, Thomsen C, Males D, Beckman J, Arvizu,E, Lackovic M. Acute occupational pesticide-related illness in the US, 1998-1999: Surveillancefindings from the SENSOR-pesticides program. Am J Ind Med. 2004; 45:114-23.
23 Blondell J. Epidemiology of pesticide poisonings in the United States, with special refer-ence to occupational cases. J Occup Med. 1997;12:209-220.

Putting Data to Work: Occupational Health Indicators from Thirteen Pilot States for 2000
72 References
24 Calvert GM, Mehler LN, Rosales R, Baum L, Thomsen C, Male D, Shafey O, Das R, LackovicM, Arvizu E. Acute pesticide-related illnesses among working youths, 1988-1999. Am J PublicHealth. 2003; 93:605-610.
25 Albin, M, Magnani, C, Krstev, S, Rapiti, E, and Shefer, I. Asbestos and cancer: An overviewof current trends in Europe. Environ Health Perspect. 1999; 107(2): 289-298.
26 Price, B and Ware, A. Mesothelioma trends in the United States: an update based onSurveillance, Epidemiology, and End Results Program data for 1973 through 2003. Am JEpidemiol. 2004;159(2): 107-112.
27 U.S. Department of Labor. Program Highlights; Fact Sheet No. OSHA 92-06, 2004 Available at:www.pp.okstate.edu/ehs/training/oshasbes.htm
28 U.S. Department of Health and Human Services. Healthy People 2010. 2nd edition.Washington DC. US Government Printing Office. November 2000. Objective 20-7.
29 Rosenman KD, Sims A, Luo Z, Gardiner J. Occurrence of lead-related symptoms below thecurrent Occupational Safety and Health Act allowable blood lead levels. J Occup Environ Med.2003; 45:546-555
30 Schwartz J. Lead, blood pressure and cardiovascular disease in men. Arch Environ Health.1995; 50:31-37.
31 Centers for Disease Control and Prevention. Second National Report on Human Exposure toEnvironmental Chemicals. Atlanta, Ga: U.S Department of Health and Human Services. NCEH Pub.No. 03-0022, Lead CAS No. 7439-92-1. 2003. Available at: http://www.cdc.gov/exposurereport
32 Roscoe RJ, Ball W, Curran JJ, et al. Adult blood lead epidemiology and surveillance —United States, 1998 - 2001. MMWR December 13, 2002; 51(No. SS11);1-10.
References 73
Putting Data to Work: Occupational Health Indicators from Thirteen Pilot States for 2000
33 United States Department of Labor, BLS Bulletin 2551. Occupational Injuries and Illnesses:Counts, Rates, and Characteristics, 1999. September 2002
34 Institute of Medicine. Safe Work in the 21st Century: Education and Training Needs for the NextDecade’s Occupational Safety and Health Personnel. 2000
35 McQuiston TH, Zakocs RC, Loomis DL . The case for stronger OSHA enforcement – Evidencefrom evaluation research. Am J Public Health. 1998; 88:7.
36 World Health Organization, International Statistical Classification of Diseases and RelatedHealth Problems, Tenth Revision. Geneva, Switzerland. 1992. Updated and Corrected by theNational Center of Health Statistics, October 1998.
37 World Health Organization. International Classification of Diseases for Oncology. GenevaSwitzerland. Last updated 2000
38 World Health Organization. International Classification of Diseases, Ninth Revision, ClinicalModification. Last Updated 2003.
39 U.S. Chamber of Commerce. 2003 Analysis of Workers’ Compensation Laws. U.S. Chamber ofCommerce; Statistics and Research Center, Washington, D.C. 2003.
40 Watson WA, Litovitz TL, Rodgers GC, et. al. 2002 Annual report of the American Associationof Poison Control Centers Toxic Exposure Surveillance System.” Am J Emerg Med. September2003; 21:5.

SIC 346: Metal Forgings and StampingsSIC 353: Construction, Mining, and Materials
Handling Machinery and Equipment SIC 358: Refrigeration and Service Industry
MachinerySIC 371: Motor Vehicles and Motor Vehicle
EquipmentSIC 373: Ship and Boat Building and RepairingSIC 375: Motorcycles, Bicycles, and PartsSIC 375: Miscellaneous Transportation
EquipmentSIC 451: Scheduled Air Transportation and Air
Courier Services SIC 505: Wholesale of Metals and Minerals,
Except Petroleum SIC 805: Nursing and Personal Care Facilities SIC 842: Botanical and Zoological Gardens
SIC 201: Meat ProductsSIC 242: Sawmills and Planing MillsSIC 244: Wood ContainersSIC 253: Public Building and Related Furniture SIC 254: Partitions and Fixtures SIC 321: Flat GlassSIC 326: Pottery and Related ProductsSIC 327: Concrete, Gypsum, and Plaster ProductsSIC 332: Iron and Steel FoundriesSIC 333: Primary Smelting and Refining of
Nonferrous MetalsSIC 334: Secondary Smelting and Refining of
Nonferrous MetalsSIC 336: Nonferrous Foundries (Castings)SIC 342: Cutlery, Handtools, and General
HardwareSIC 344: Fabricated Structural Metal Products
Putting Data to Work: Occupational Health Indicators from Thirteen Pilot States for 2000
74 Appendix A
APPENDIX A:
Industries with High Risk for Occupational MorbidityThis list represents 25 high risk industries based on the Standard Industrial Classification (SIC) system,the traditional governmental industrial coding system. The SIC system is being replaced by the NorthAmerican Industrial Classification System (NAICS). In order to utilize the currently available data, theSIC codes were converted to NAICS codes. More than 25 NAICS codes were needed to match the originalSIC industry list. The NAICS codes are listed in the “how-to” guide for this Indicator.

Appendix B 75
Putting Data to Work: Occupational Health Indicators from Thirteen Pilot States for 2000
APPENDIX B:
Occupations with High Risk for Occupational Morbidity
n Technicians, n.e.c.n Miscellaneous food preparation occupationsn Public transportation attendantsn Timber cutting and logging occupationsn Telephone line installers and repairersn Electrician apprenticesn Sheetmetal duct installersn Structural metal workersn Punching and stamping press machine operatorsn Grinding, abrading, buffing and polishing machine operatorsn Sawing machine operatorsn Extruding and forming machine operatorsn Furnace, kiln, and oven operators, exc. foodn Crushing and grinding machine operatorsn Truck drivers n Driver-sales workersn Excavating and loading machine operatorsn Misc. material moving equipment operatorsn Helpers, construction tradesn Construction laborersn Production helpersn Freight, stock, and material handlers, necn Laborers, except construction

OccupationsAirplane pilots and navigatorsGuidesFarmers, except horticulturalManagers, farms, except horticulturalSupervisors, farm workersTimber cutting and logging occupationsFishersElectrician apprenticesElectrical power installers and repairersRoofersStructural metal workersConstructions trades, necSupervisors, extractive occupationsMining machine operatorsTruck driversDriver-sales workersTaxicab drivers and chauffeursSailors and deckhandsExcavating and loading machine operatorsGrader, dozer, and scraper operatorsMiscellaneous material moving equipment operatorsConstruction laborers
IndustriesAgricultural crop productionAgricultural livestock productionLandscape and horticultural servicesAgricultural servicesForestryFishing, hunting and trappingMetal miningCoal miningOil and gas extractionNonmetallic mining and quarrying, except fuelConstructionMiscellaneous petroleum and coal productsLoggingCement, concrete, gypsum and plaster productsShip and boat building and repairTaxicab serviceTrucking serviceWater transportationSanitary servicesWholesale motor vehicles and equipmentWholesale scrap and waste materialsWholesale farm product raw materialsWholesale petroleum productsMobile home dealersMiscellaneous vehicle dealersLiquor storesElectrical repair shops
Putting Data to Work: Occupational Health Indicators from Thirteen Pilot States for 2000
76 Appendix C
APPENDIX C:
Industries and Occupations with High Risk forOccupational Mortality
