cottonseed outlook 2003/04 ben morgan national cottonseed products association, inc
TRANSCRIPT
Cottonseed Outlook 2003/04
Ben MorganNational Cottonseed Products Association, Inc.
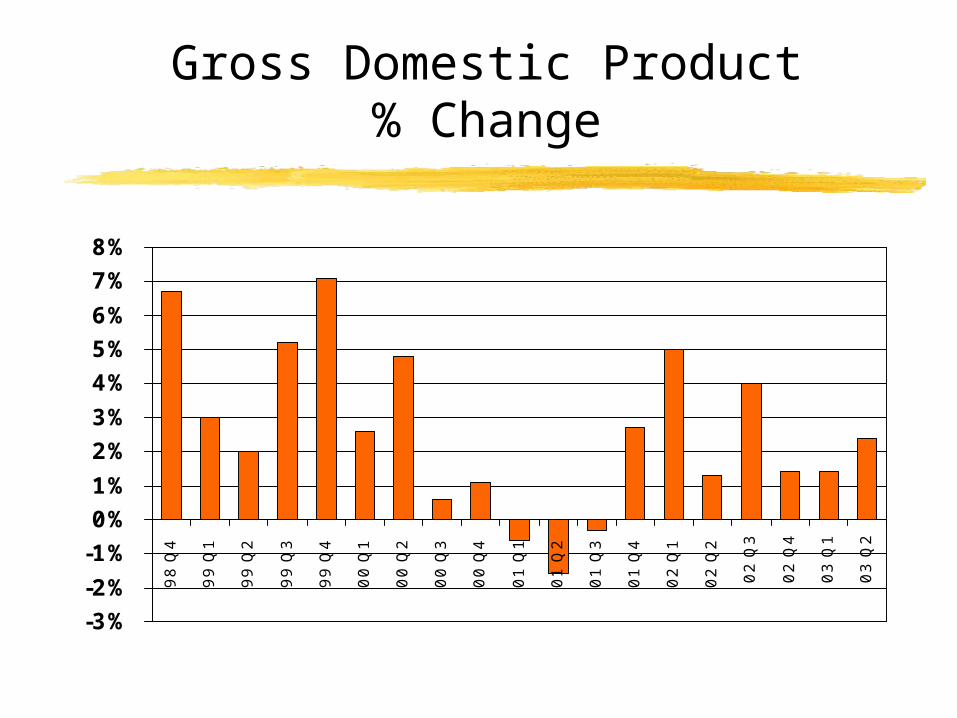
Gross Domestic Product% Change
-3%-2%
-1%
0%
1%
2%
3%
4%5%
6%
7%
8%
98
Q4
99
Q1
99
Q2
99
Q3
99
Q4
00
Q1
00
Q2
00
Q3
00
Q4
01
Q1
01
Q2
01
Q3
01
Q4
02
Q1
02
Q2
02
Q3
02
Q4
03
Q1
03
Q2
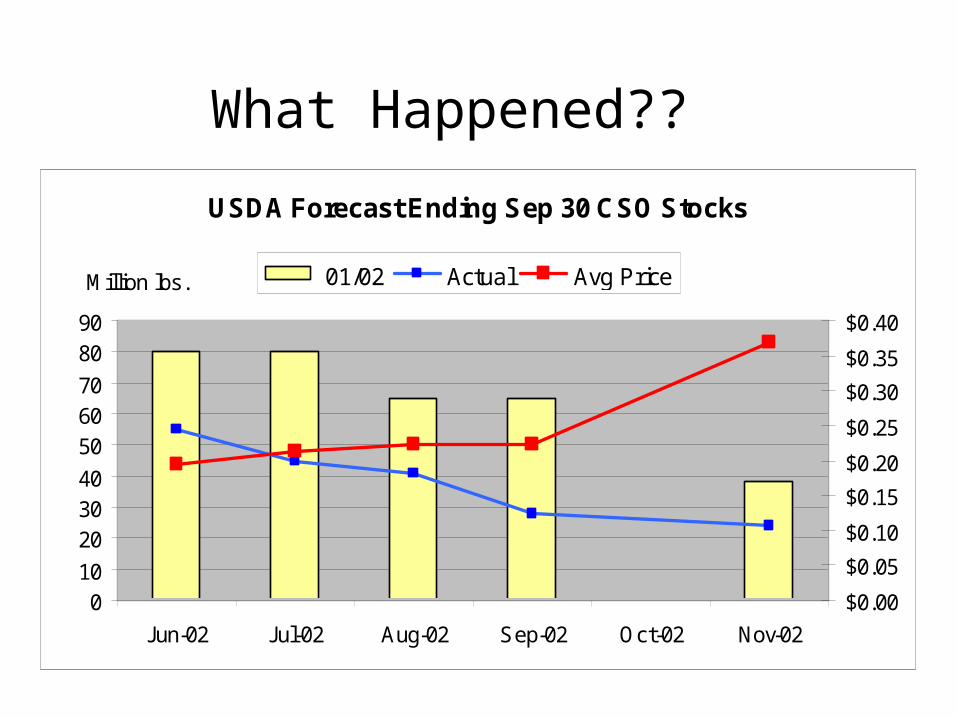
What Happened??
USDA Forecast Ending Sep 30 CSO Stocks
010
203040
506070
8090
Jun-02 Jul-02 Aug-02 Sep-02 Oct-02 Nov-02
Million lbs.
$0.00
$0.05
$0.10
$0.15
$0.20
$0.25
$0.30
$0.35
$0.40
01/02 Actual Avg Price
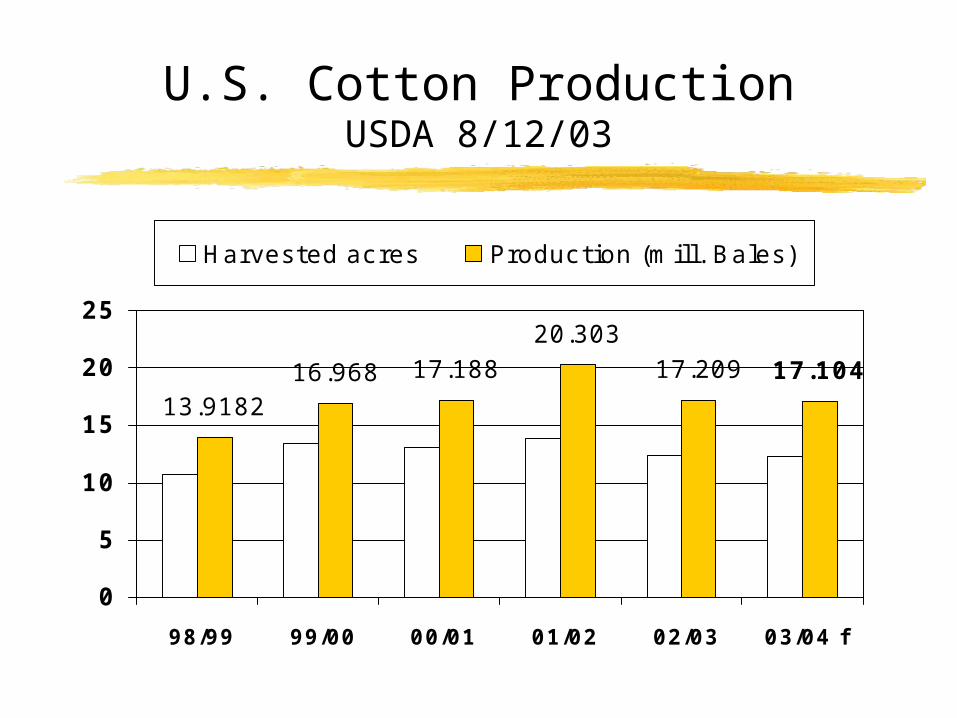
U.S. Cotton ProductionUSDA 8/12/03
17.104
13.918216.968 17.188
20.30317.209
0
5
10
15
20
25
98/99 99/00 00/01 01/02 02/03 03/04 f
Harvested acres Production (mill. Bales)
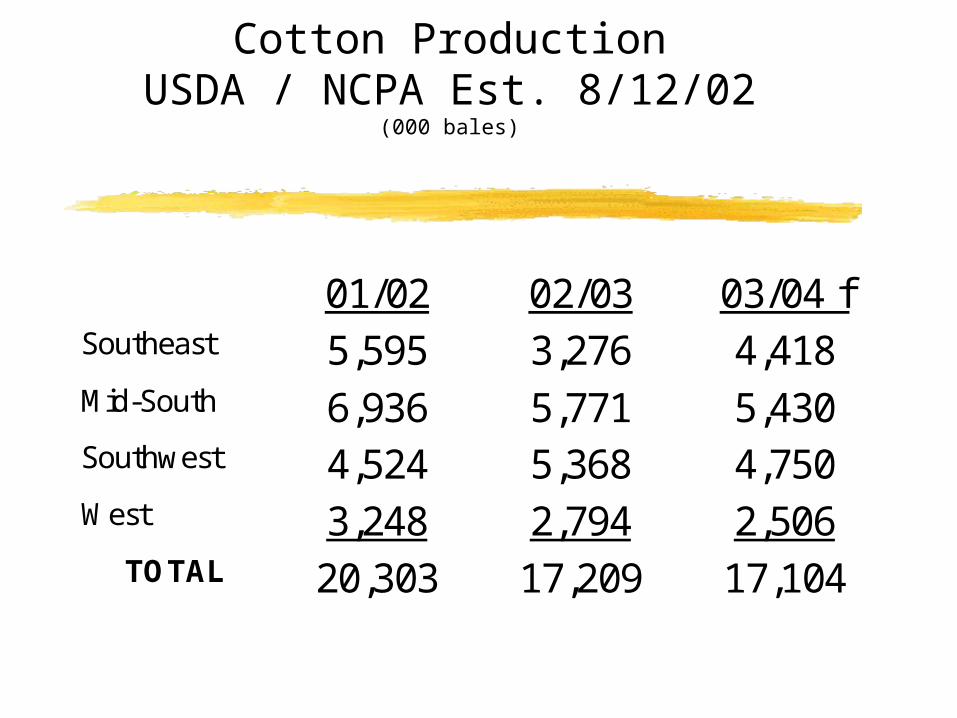
Cotton ProductionUSDA / NCPA Est. 8/12/02
(000 bales)
01/02 02/03 03/04 f Southeast 5,595 3,276 4,418 Mid-South 6,936 5,771 5,430 Southwest 4,524 5,368 4,750 West 3,248 2,794 2,506
TOTAL 20,303 17,209 17,104
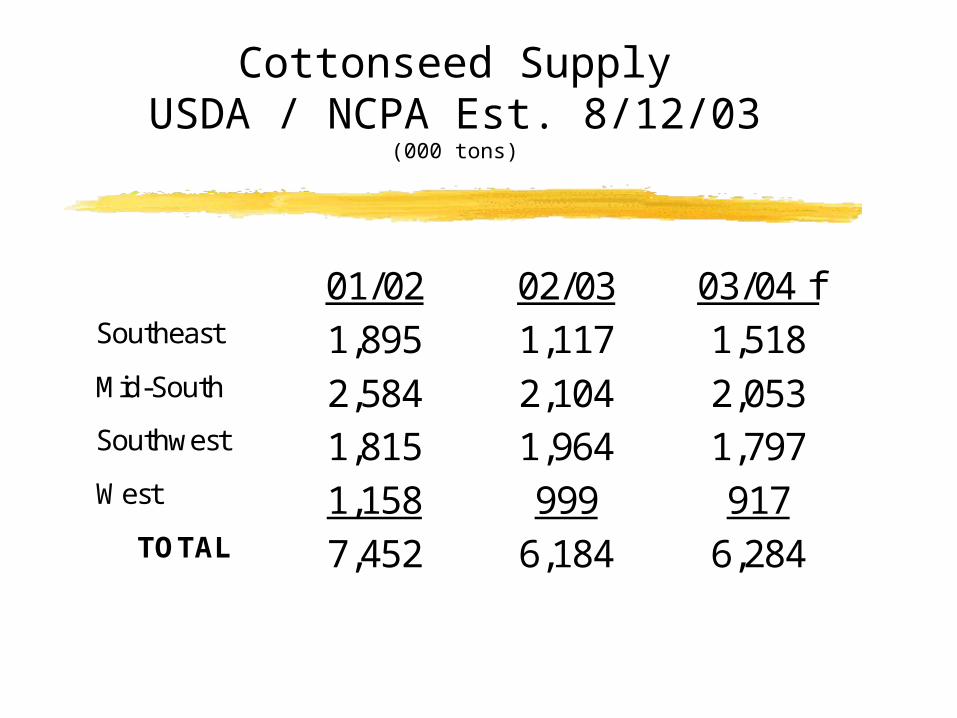
Cottonseed SupplyUSDA / NCPA Est. 8/12/03
(000 tons)
01/02 02/03 03/04 f Southeast 1,895 1,117 1,518 Mid-South 2,584 2,104 2,053 Southwest 1,815 1,964 1,797 West 1,158 999 917
TOTAL 7,452 6,184 6,284
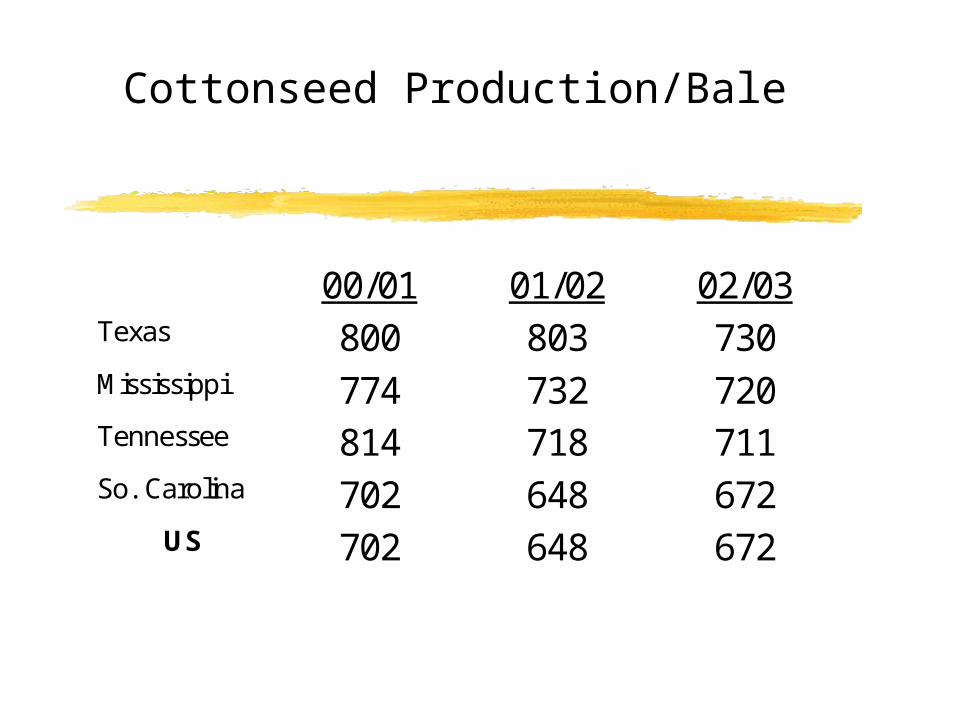
Cottonseed Production/Bale
00/01 01/02 02/03 Texas 800 803 730 Mississippi 774 732 720 Tennessee 814 718 711 So. Carolina 702 648 672
US 702 648 672
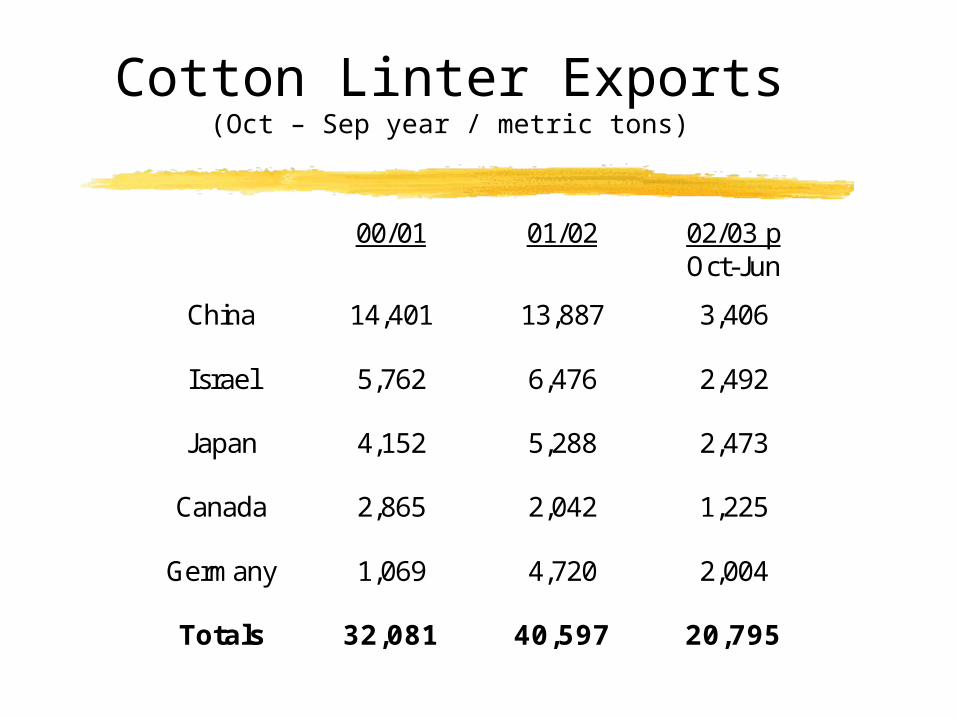
Cotton Linter Exports(Oct – Sep year / metric tons)
00/01 01/02 02/03 p Oct-Jun
China 14,401 13,887 3,406
Israel 5,762 6,476 2,492
Japan 4,152 5,288 2,473
Canada 2,865 2,042 1,225
Germany 1,069 4,720 2,004
Totals 32,081 40,597 20,795
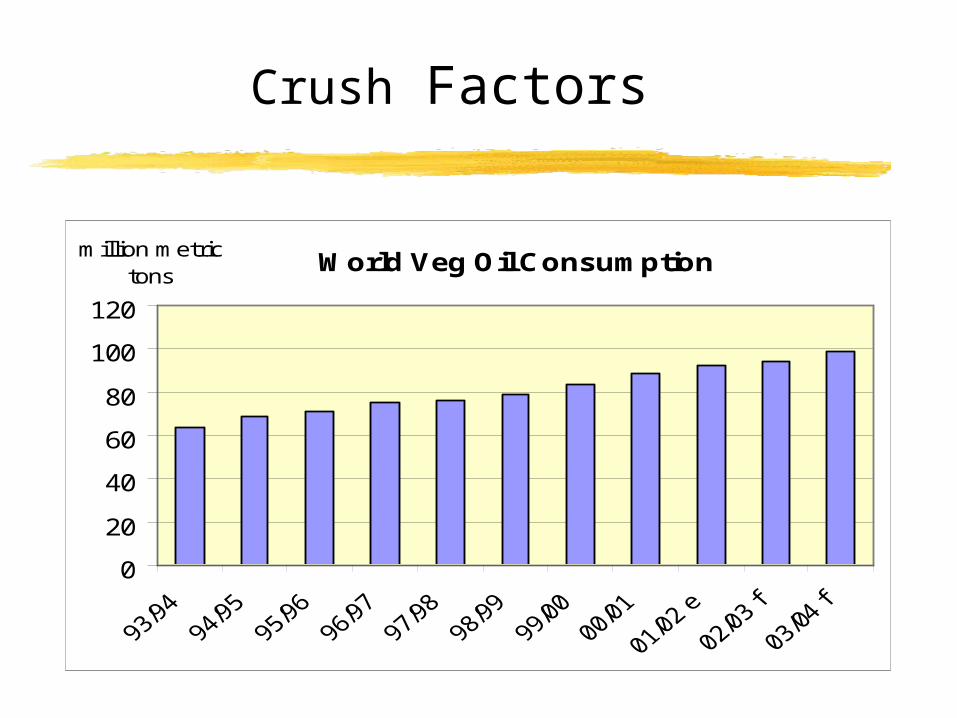
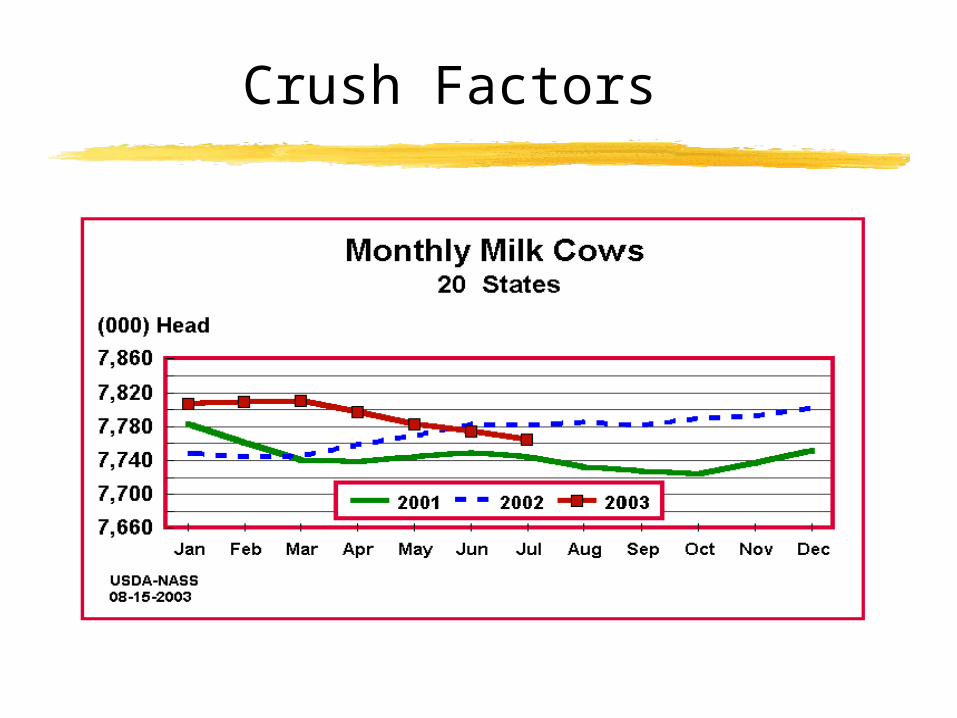
Crush Factors
World Veg Oil Consumption
0
20
40
60
80
100
120
million metric tons
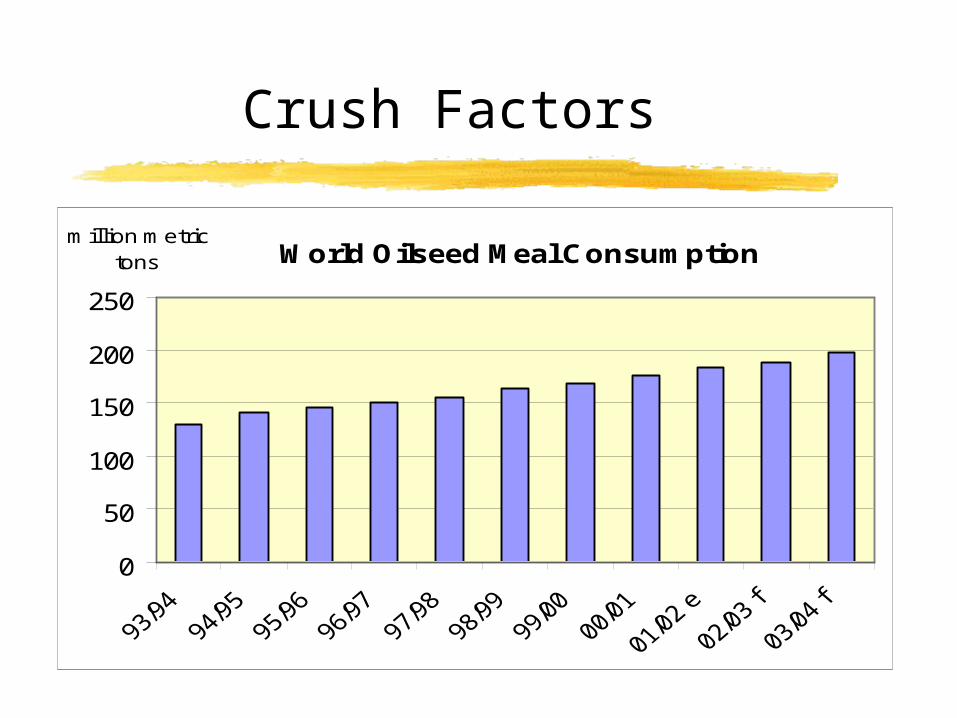
Crush Factors
World Oilseed Meal Consumption
0
50
100
150
200
250
million metric tons
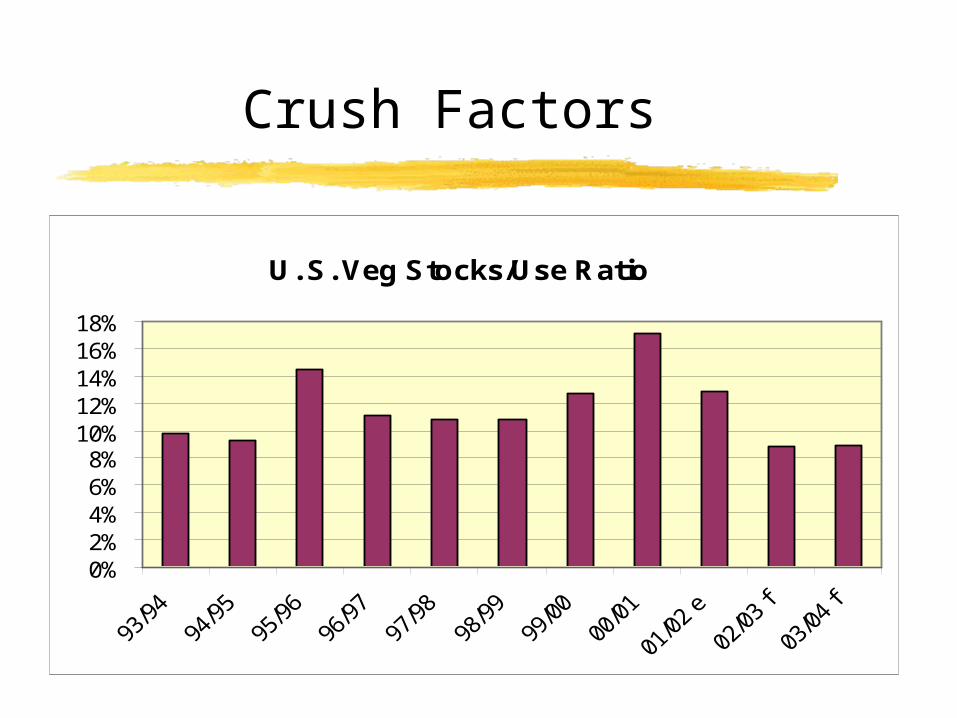
Crush Factors
U. S. Veg Stocks/Use Ratio
0%2%4%6%8%
10%12%14%16%18%
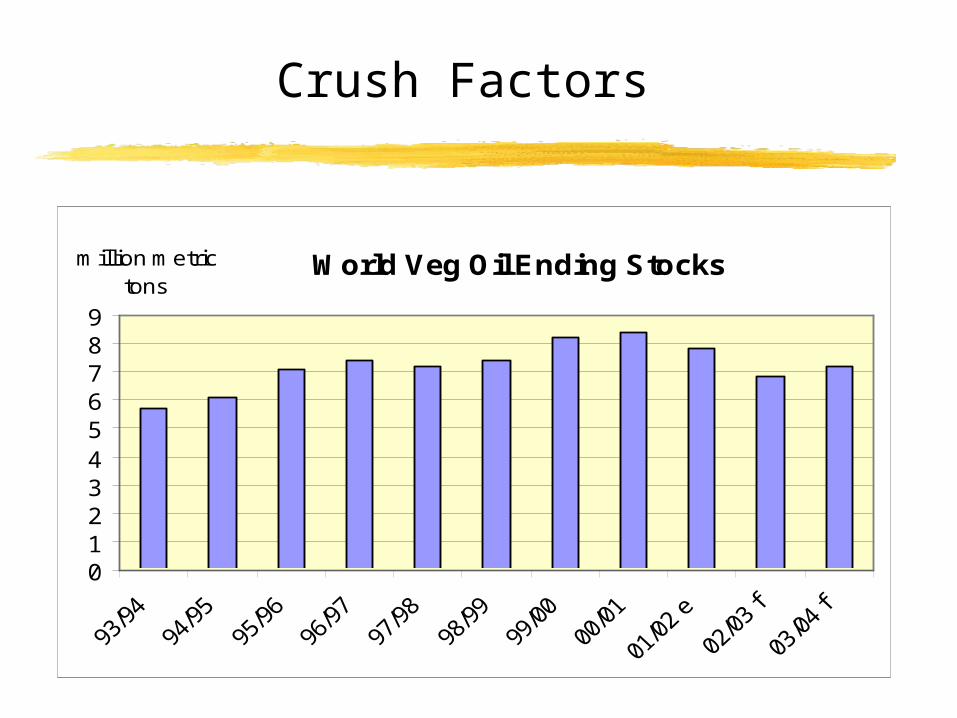
Crush Factors
World Veg Oil Ending Stocks
0123456789
million metric tons
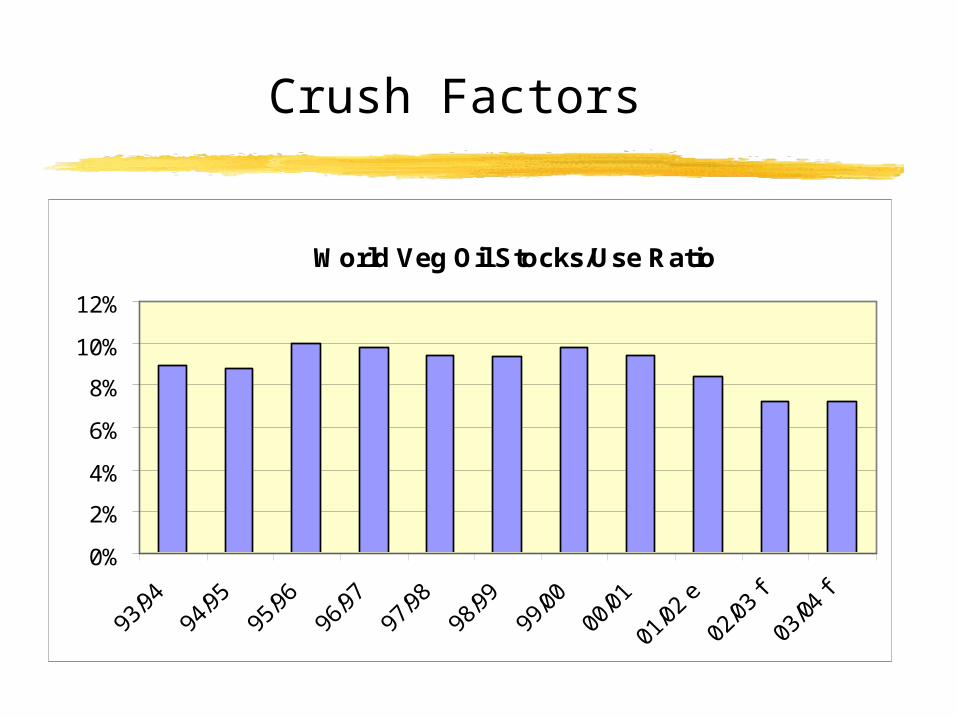
Crush Factors
World Veg Oil Stocks/Use Ratio
0%
2%
4%
6%
8%
10%
12%
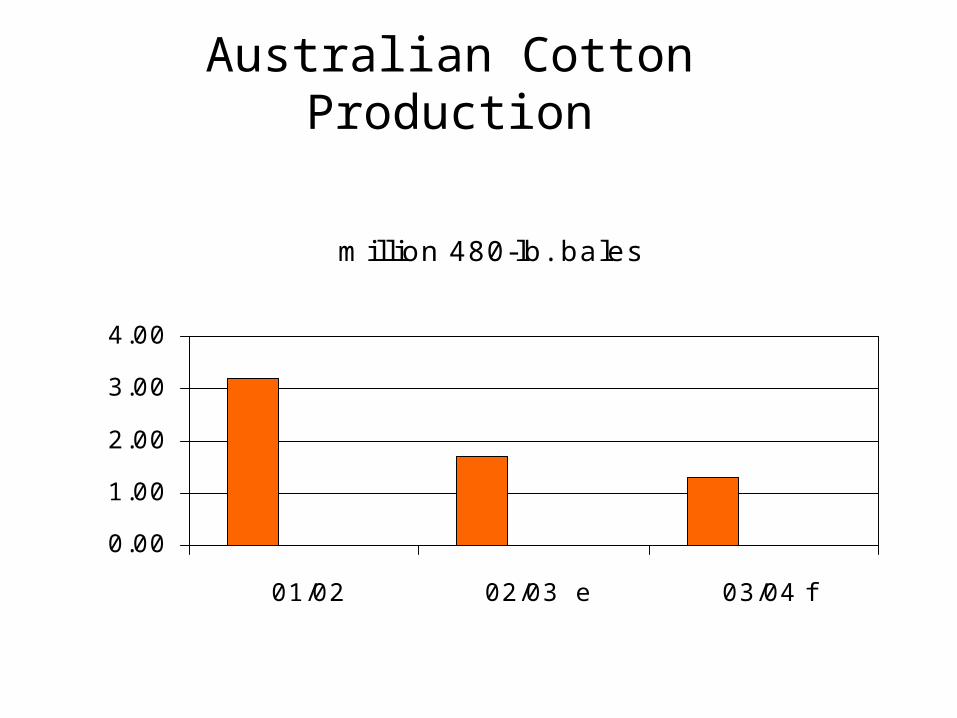
Australian Cotton Production
million 480-lb. bales
0.00
1.00
2.00
3.00
4.00
01/02 02/03 e 03/04 f
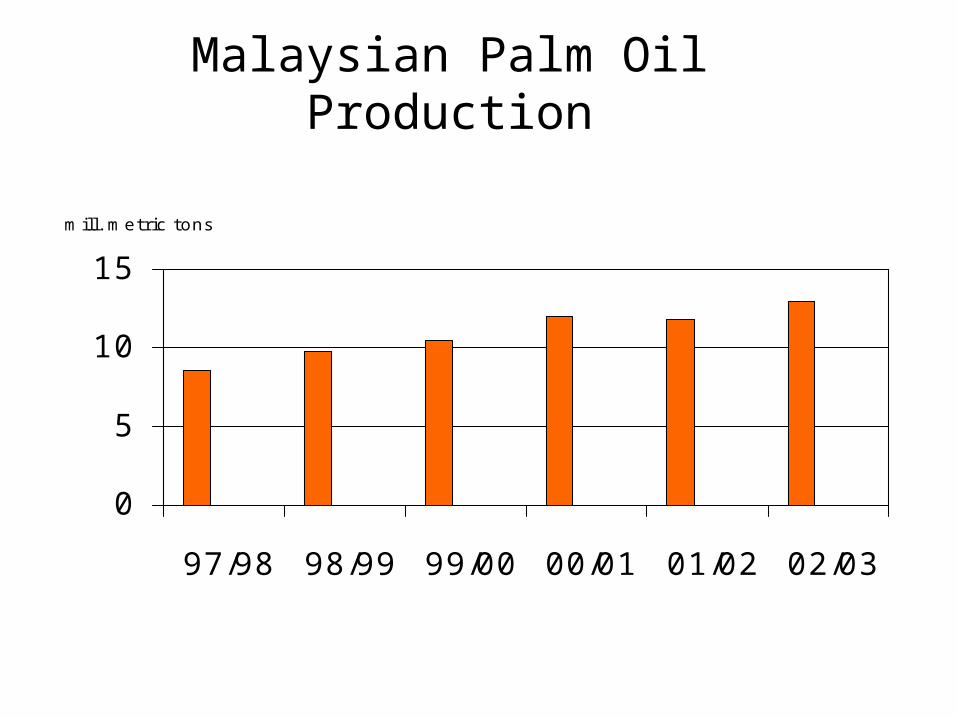
Malaysian Palm Oil Production
0
5
10
15
97/98 98/99 99/00 00/01 01/02 02/03
mill. metric tons
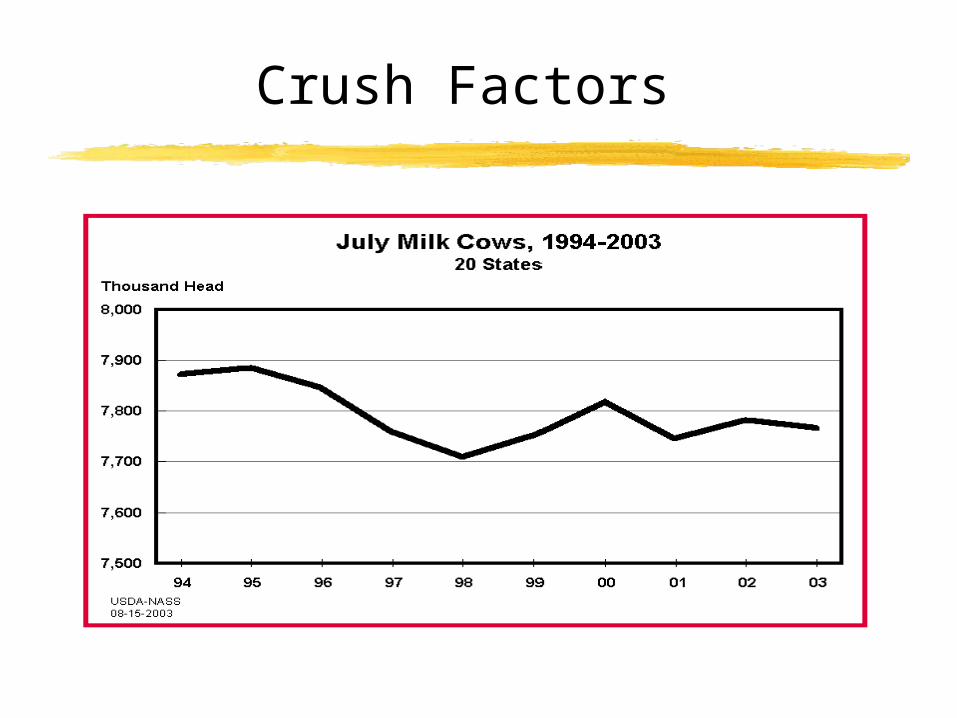
Crush Factors
Crush Factors
NCPA Activities
Monitoring whole cottonseed definition in California – likely to set a limit of 15% FFA
Project to consider acetone extraction process
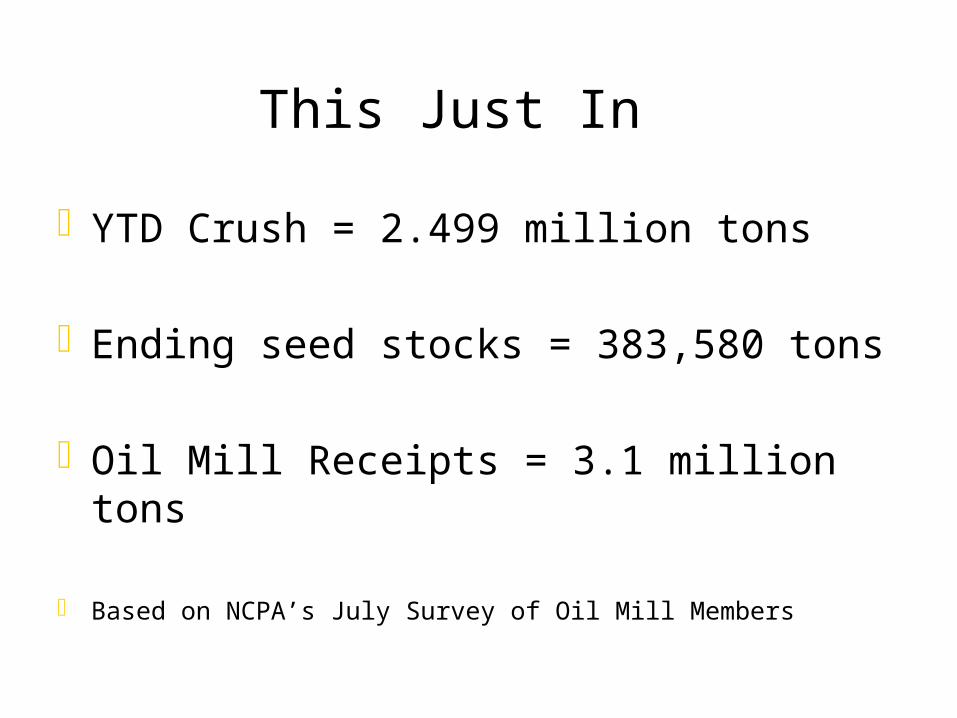
This Just In
YTD Crush = 2.499 million tons
Ending seed stocks = 383,580 tons
Oil Mill Receipts = 3.1 million tons
Based on NCPA’s July Survey of Oil Mill Members
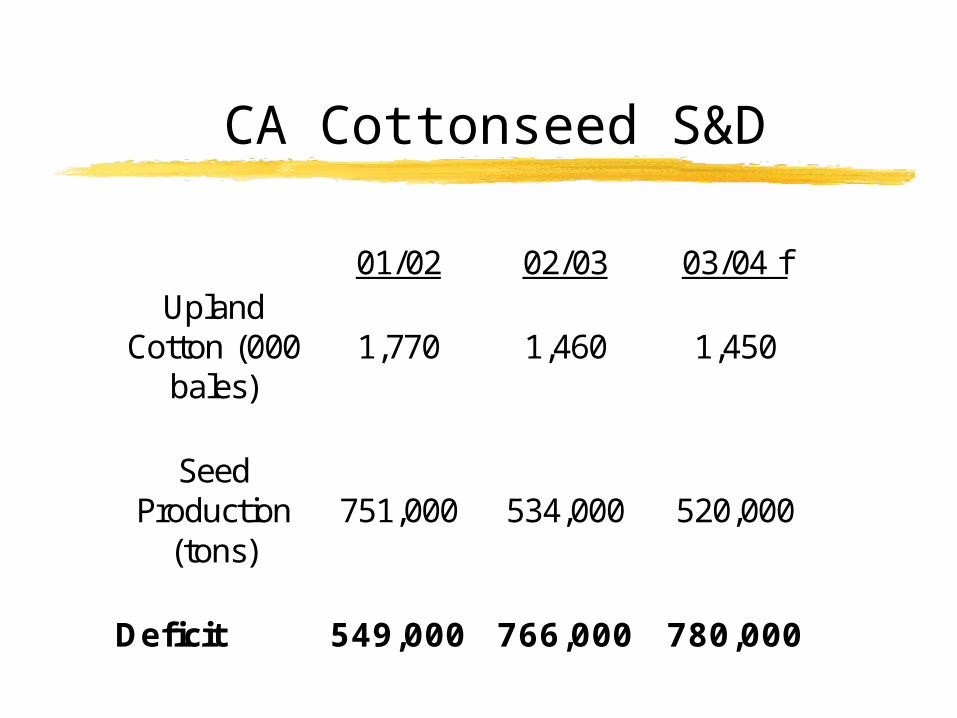
CA Cottonseed S&D
01/02 02/03 03/04 f Upland
Cotton (000 bales)
1,770 1,460 1,450
Seed
Production (tons)
751,000 534,000 520,000
Deficit 549,000 766,000 780,000
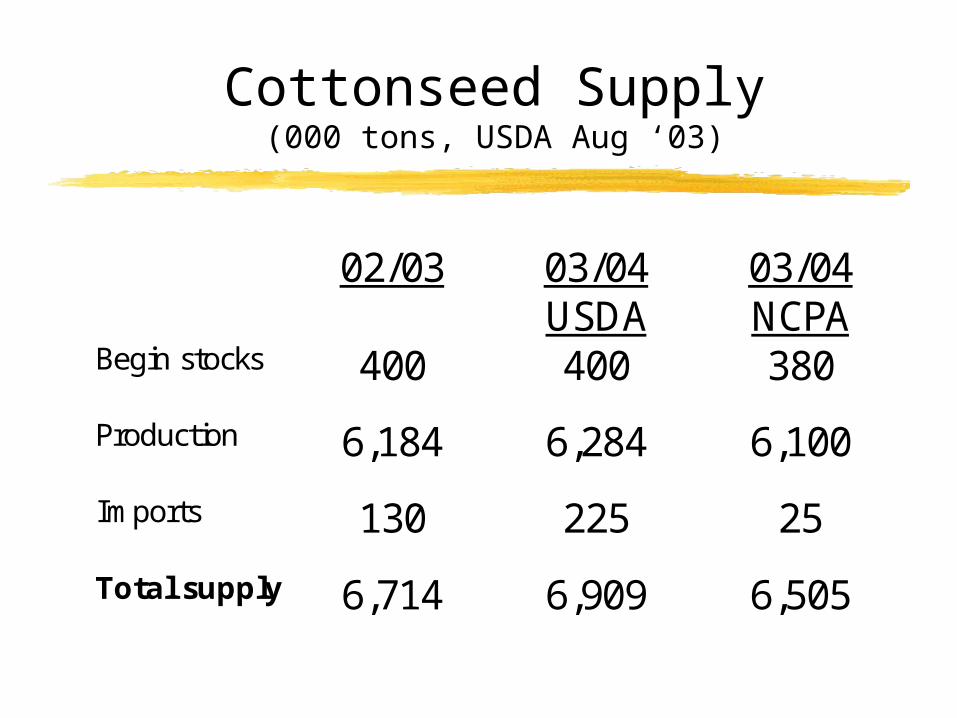
Cottonseed Supply(000 tons, USDA Aug ‘03)
02/03 03/04 USDA
03/04 NCPA
Begin stocks 400 400 380
Production 6,184 6,284 6,100
Imports 130 225 25
Total supply 6,714 6,909 6,505
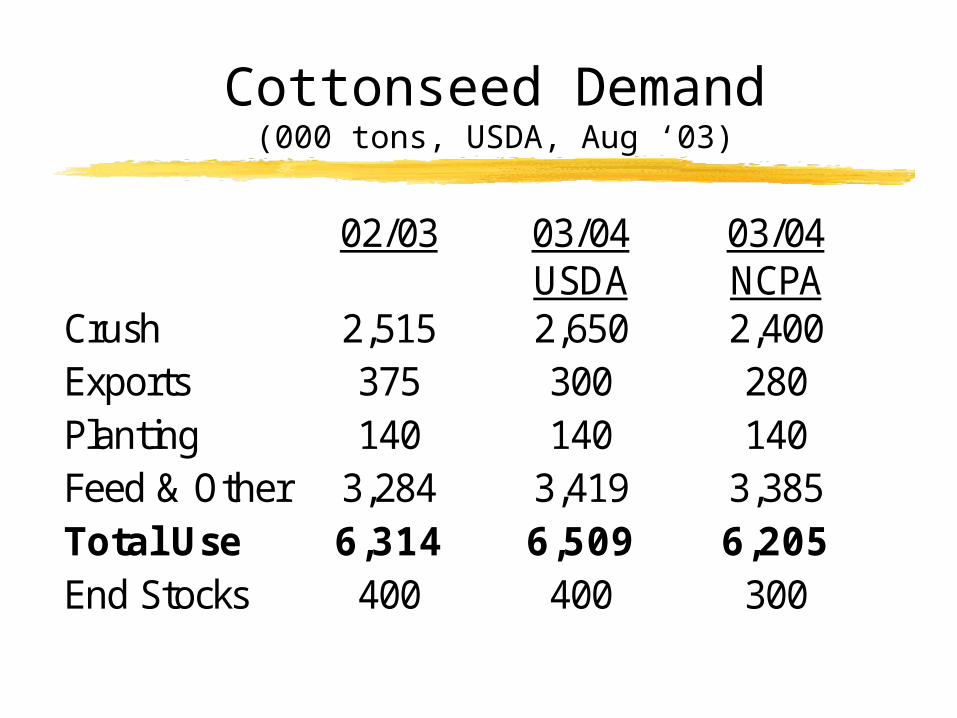
Cottonseed Demand(000 tons, USDA, Aug ‘03)
02/03 03/04 USDA
03/04 NCPA
Crush 2,515 2,650 2,400 Exports 375 300 280 Planting 140 140 140 Feed & Other 3,284 3,419 3,385 Total Use 6,314 6,509 6,205 End Stocks 400 400 300
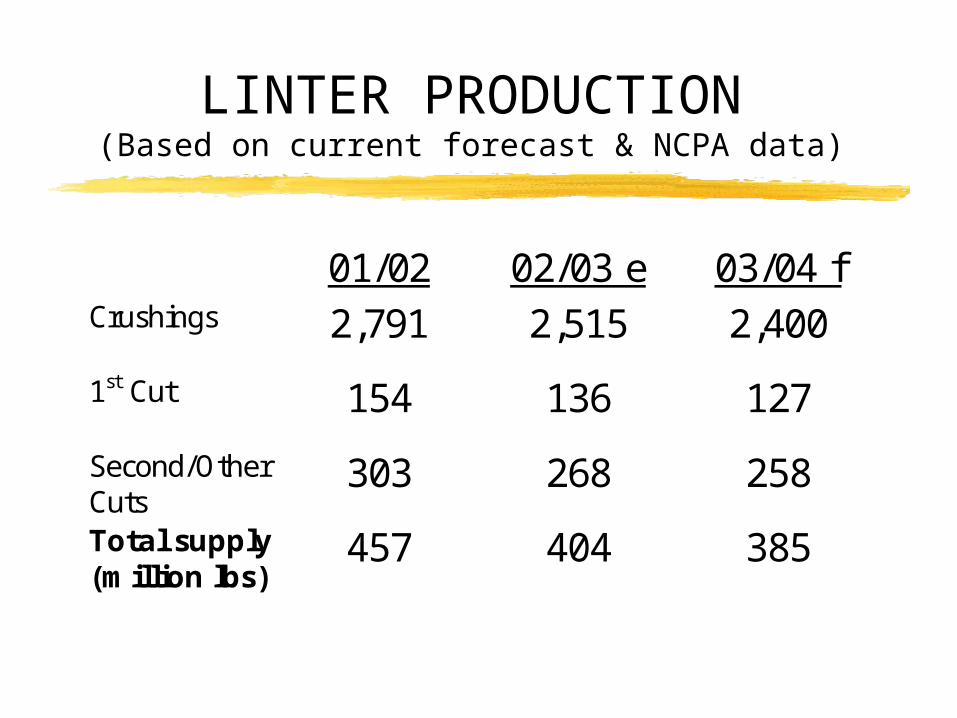
LINTER PRODUCTION(Based on current forecast & NCPA data)
01/02 02/03 e 03/04 f Crushings 2,791 2,515 2,400
1st Cut 154 136 127
Second/Other Cuts
303 268 258
Total supply (million lbs)
457 404 385