cotton production and climatic factors: studying the ... · pdf filecotton production and...
TRANSCRIPT

Sawan, Cogent Biology (2017), 3: 1292882http://dx.doi.org/10.1080/23312025.2017.1292882
PLANT SCIENCES | REVIEW ARTICLE
Cotton production and climatic factors: Studying the nature of its relationship by different statistical methodsZakaria M. Sawan1*
Abstract: This study investigates the statistical relationship between various climatic factors and overall flower and boll production. Also, the relationship between climatic factors and production of flowers and bolls obtained during the development periods of the flowering and boll stage. Further, predicting effects of climatic factors during different convenient intervals (in days) on cotton flower and boll production com-pared with daily observations. Furthermore, collects information about the nature of the relationship between various climatic factors and cotton boll development and the 15-day period both prior to and after initiation of individual bolls. And, it provides information on the effect of various climatic factors and soil moisture status during the development stage on flower and boll production in cotton. Evaporation, sun-shine duration, relative humidity, surface soil temperature at 18:00 h, and maximum air temperature, are the important climatic factors that significantly affect flower and boll production. The five-day interval was found to be more adequately and sensibly related to yield parameters. Evaporation; minimum humidity, and sunshine duration were the most effective climatic factors during preceding and succeeding periods on boll production and retention. There was a negative correlation between flower and boll production and either evaporation or sunshine duration, while that correlation with minimum relative humidity was positive.
*Corresponding author: Zakaria M. Sawan, Cotton Research Institute, Agricultural Research Center, Ministry of Agriculture & Land Reclamation, 9 Gamaa Street, 12619 Giza, Egypt. E-mail: [email protected]
Reviewing editor:Sabrina Sabatini, Sapienza University of Rome, Italy
Additional information is available at the end of the article
ABOUT THE AUTHORResponse of flower and boll development to climatic factors on the anthesis day. Effect of climatic factors during the development periods of flowering and boll formation on the production of cotton. Appropriate time scale for aggregating climatic data to predict flowering and boll setting behavior of cotton. Response of flower and boll development to climate factors before and after anthesis day. Cotton (Gossypium barbadense) flower and boll production as affected by climatic factors and soil moisture status. Effect of different rates and application systems of nitrogen fertilization and indole-3-butyric acid on Egyptian cotton growth and yield. Effect of concentration and time of application of the defoliant Harvade on the lint, seed, protein and oil yields, and oil properties of cottonseed. Effect of 1-naphthalene acetic acid and Kinetin on yield and fiber properties, seed, protein, oil, and fatty acids of Egyptian cotton. Plant growth retardants, plant nutrients, and cotton production.
PUBLIC INTEREST STATEMENTCotton yield is a function of growth rates, flower production rates, and flower and boll retention during the fruiting period. Information on the relationship between climatic factors and the cotton plant’s ability to produce and sustain flower buds, flowers, and bolls will allow one to model plant responses to conditions that frequently occur in the field and to predict developmental rate or the formation of these organs. Understanding the impacts of climatic factors on cotton production may help physiologists to determine the control mechanisms of boll retention in cotton. However, weather affects crop growth interactively, sometimes resulting in unexpected responses to prevailing conditions. The balance between vegetative and reproductive development can be influenced by soil fertility, soil moisture, cloudy weather, spacing, and perhaps other factors such as temperature and relative humidity. The early prediction of possible adverse effects of climatic factors might modify their effect on production of cotton.
Received: 13 October 2016Accepted: 05 February 2017First Published: 10 February 2017
Page 1 of 35
© 2017 The Author(s). This open access article is distributed under a Creative Commons Attribution (CC-BY) 4.0 license.

Page 2 of 35
Sawan, Cogent Biology (2017), 3: 1292882http://dx.doi.org/10.1080/23312025.2017.1292882
Subjects: Environment & Agriculture; Environmental Studies & Management; Mathematics & Statistics
Keywords: cotton flower and boll production; evaporation; relative humidity; soil moisture status; sunshine duration; temperature
1. IntroductionClimate affects crop growth interactively, sometimes resulting in unexpected responses to prevail-ing conditions. Many factors, such as length of the growing season, climate (including solar radia-tion, temperature, light, wind, rainfall, and dew), cultivar, availability of nutrients and soil moisture, pests and cultural practices affect cotton growth (El-Zik, 1980). The balance between vegetative and reproductive development can be influenced by soil fertility, soil moisture, cloudy weather, spacing and perhaps other factors such as temperature and relative humidity (Guinn, 1982). Weather, soil, cultivars, and cultural practices affect crop growth interactively, sometimes resulting in plants re-sponding in unexpected ways to their conditions (Hodges, Reddy, McKinion, & Reddy, 1993).
Water is a primary factor controlling plant growth. Xiao, Liu, Yu, Zhang, and Duan (2000) stated that, when water was applied at 0.85, 0.70, 0.55 or 0.40 ET (evapotranspiration) to cotton plants grown in pots, there was a close relationship between plant development and water supply. The fruit-bearing branches, square and boll numbers and boll size were increased with increased water supply. Barbour and Farquhar (2000) reported on greenhouse pot trials where cotton cv. CS50 plants were grown at 43 or 76% relative humidity (RH) and sprayed daily with abscisic acid (ABA) or distilled water. Plants grown at lower RH had higher transpiration rates, lower leaf temperatures and lower stomatal conductance. Plant biomass was also reduced at the lower RH. Within each RH environ-ment, increasing ABA concentration generally reduced stomatal conductance, evaporation rates, superficial leaf density and plant biomass, and increased leaf temperature and specific leaf area.
Temperature is also a primary factor controlling rates of plant growth and development. Burke, Mahan, and Hatfield (1988) have defined the optimum temperature range for biochemical and met-abolic activities of plants as the thermal kinetic window (TKW). Plant temperatures above or below the TKW result in stress that limits growth and yield. The TKW for cotton growth is 23.5–32°C, with an optimum temperature of 28°C. Biomass production is directly related to the amount of time that foliage temperature is within the TKW. Hodges et al. (1993) found that the optimum temperature for cotton stem and leaf growth, seedling development, and fruiting was almost 30°C, with fruit reten-tion decreasing rapidly as the time of exposure to 40°C increased. Reddy, Robana, Hodges, Liu, and McKinion (1998) found that when Upland cotton (Gossypium hirsutum) cv. DPL-51 was grown in naturally lit plant growth chambers at 30/22°C day/night temperatures from sowing until flower bud production, and at 20/12, 25/17, 30/22, 35/27 and 40/32°C for 42 days after flower bud production, fruit retention was severely curtailed at the two higher temperatures compared with 30/22°C. Species/cultivars that retain fruits at high temperatures would be more productive both in the pre-sent-day cotton production environments and even more in future warmer world. Schrader, Wise, Wacholtz, Ort, and Sharkey (2004) stated that high temperatures that plants are likely to experience inhibit photosynthesis.
Zhou, Meng, Pei, Shen, and Jia (2000) indicated that light duration is the key meteorological factor influencing the wheat-cotton cropping pattern and position of the bolls, while temperature had an important function on upper (node 7 to 9) and top (node 10) bolls, especially for double cropping patterns with early maturing varieties.

Page 3 of 35
Sawan, Cogent Biology (2017), 3: 1292882http://dx.doi.org/10.1080/23312025.2017.1292882
The objectives of this investigation were to study:
(1) The effect of various climatic factors on the overall flower and boll production in Egyptian cot-ton. This could pave the way for formulating advanced predictions as for the effect of certain climatic conditions on cotton production of Egyptian cotton. It would be useful to minimize the deleterious effects of the factors through utilizing proper cultural practices which would limit and control their negative effects, and this will lead to an increase in cotton yield.
(2) Also, this study investigated the relationship between climatic factors and production of flow-ers and bolls obtained during the development periods of the flowering and boll stage, and to determine the most representative period corresponding to the overall crop pattern.
(3) Further, this study aimed at predicting effects of climatic factors during different convenient intervals (in days) on cotton flower and boll production compared with daily observations. The study presents a rich effort focused on evaluating the efficacy of regression equations be-tween cotton crop data and climatic data grouped at different time intervals, to determine the appropriate time scale for aggregating climate data to be used for predicting flower and boll production in cotton.
(4) Furthermore, this study investigates and collects information about the nature of the relation-ship between various climatic factors and cotton boll development and the 15-day period both prior to and after initiation of individual bolls of field grown cotton plants in Egypt. This could pave the way for formulating advanced predictions as for the effect of certain climatic condi-tions on production of Egyptian cotton. It would be useful to minimize the deleterious effects of the factors through utilizing proper cultural practices which would limit and control their negative effects, and this will lead to an improvement in cotton yield.
(5) And provide information on the effect of various climatic factors and soil moisture status dur-ing the development stage on flower and boll production in Egyptian cotton. This could result in formulating advanced predictions as for the effect of certain climatic conditions on produc-tion of Egyptian cotton. Minimizing the deleterious effects of the factors through utilizing proper cultural practices will lead to improved cotton yield.
2. Data and methodsTwo uniform field trials were conducted at the experimental farm of the Agricultural Research Center, Ministry of Agriculture, Giza, Egypt (30° N, 31°: 28′ E at an altitude of 19 m), using the cotton cultivar Giza 75 (Gossypium barbadense L.) in 2 successive seasons (I and II). The soil texture was a clay loam, with an alluvial substratum (pH = 8.07, 42.13% clay, 27.35% silt, 22.54% fine sand, 3.22% coarse sand, 2.94% calcium carbonate and 1.70% organic matter) (Sawan, Hanna, McCuistion, & Foote, 2010).
In Egypt, there are no rain-fed areas for cultivating cotton. Water for the field trials was applied using surface irrigation. Total water consumed during each of two growing seasons supplied by sur-face irrigation was about 6,000 m³ h−1. The criteria used to determine amount of water applied to the crop depended on soil water status. Irrigation was applied when soil water content reached about 35% of field capacity (0–60 cm). In season I, the field was irrigated on 15 March (at planting), 8 April (first irrigation), 29 April, 17 May, 31 May, 14 June, 1 July, 16 July, and 12 August. In season II, the field was irrigated on 23 March (planting date), 20 April (first irrigation), 8 May, 22 May, 1 June, 18 June, 3 July, 20 July, 7 August and 28 August. Techniques normally used for growing cotton in Egypt were followed. Each experimental plot contained 13–15 ridges to facilitate proper surface irrigation. Ridge width was 60 cm and length was 4 m. Seeds were sown on 15 and 23 March in seasons I and II, respectively, in hills 20 cm apart on one side of the ridge. Seedlings were thinned to 2 plants per hill 6 weeks after planting, resulting in a plant density of about 166,000 plants ha−1. Phosphorus fertilizer was applied at a rate of 54 kg P2O5 ha−1 as calcium super phosphate during land prepara-tion. Potassium fertilizer was applied at a rate of 57 kg K2O ha−1 as potassium sulfate before the first irrigation (as a concentrated band close to the seed ridge). Nitrogen fertilizer was applied at a rate of 144 kg N ha−1 as ammonium nitrate in two equal doses: the first was applied after thinning just
Page 4 of 35
Sawan, Cogent Biology (2017), 3: 1292882http://dx.doi.org/10.1080/23312025.2017.1292882
before the second irrigation and the second was applied before the third irrigation. Rates of phos-phorus, potassium, and nitrogen fertilizer were the same in both seasons. These amounts were de-termined based on the use of soil tests (Sawan et al., 2010).
After thinning, 261 and 358 plants were randomly selected (precaution of border effect was taken into consideration by discarding the cotton plants in the first and last two hills of each ridge) from 9 to 11 inner ridges of the plot in seasons I, and II, respectively. Pest control management was carried out on an-as-needed basis, according to the local practices performed at the experimental (Sawan et al., 2010).
Flowers on all selected plants were tagged in order to count and record the number of open flow-ers, and set bolls on a daily basis. The flowering season commenced on the date of the first flower appearance and continued until the end of flowering season (31 August). The period of whole September (30 days) until the 20th of October (harvest date) allowed a minimum of 50 days to de-velop mature bolls. In season I, the flowering period extended from 17 June to 31 August, whereas in season II, the flowering period was from 21 June to 31 August. Flowers produced after 31 August were not expected to form sound harvestable bolls, and therefore were not taken into account (Sawan et al., 2010).
For statistical analysis, the following data of the dependent variables were collected: number of tagged flowers separately counted each day on all selected plants (Y1), number of retained bolls obtained from the total daily tagged flowers on all selected plants at harvest (Y2), and (Y3) percent-age of boll retention ([number of retained bolls obtained from the total number of daily tagged flow-ers in all selected plants at harvest]/[daily number of tagged flowers on each day in all selected plants] x 100).
As a rule, observations were recorded when the number of flowers on a given day was at least 5 flowers found in a population of 100 plants and this continued for at least five consecutive days. This rule omitted eight observations in the first season and ten observations in the second season. The number of observations (n) was 68 (23 June through 29 August) and 62 (29 June through 29 August) for the two seasons, respectively. Variables of the soil moisture status considered were, the day prior to irrigation, the day of irrigation, and the first and second days after the day of irrigation (Sawan et al., 2010).
The climatic factors (independent variables) considered were daily data of: maximum air tem-perature (°C, X1); minimum air temperature (°C, X2); maximum-minimum air temperature (diurnal temperature range) (°C, X3); evaporation (expressed as Piche evaporation) (mm day−1, X4); surface soil temperature, grass temperature or green cover temperature at 06:00 h (°C, X5) and 18:00 h (°C, X6); sunshine duration (h day−1, X7); maximum relative humidity (maxRH) (%, X8), minimum relative humidity (minRH) (%, X9) and wind speed (m s−1, X10) in season II only. The source of the climatic data was the Agricultural Meteorological Station of the Agricultural Research Station, Agricultural Research Center, Giza, Egypt. No rainfall occurred during the two growing seasons (Sawan, Hanna, & McCuistion, 2005).
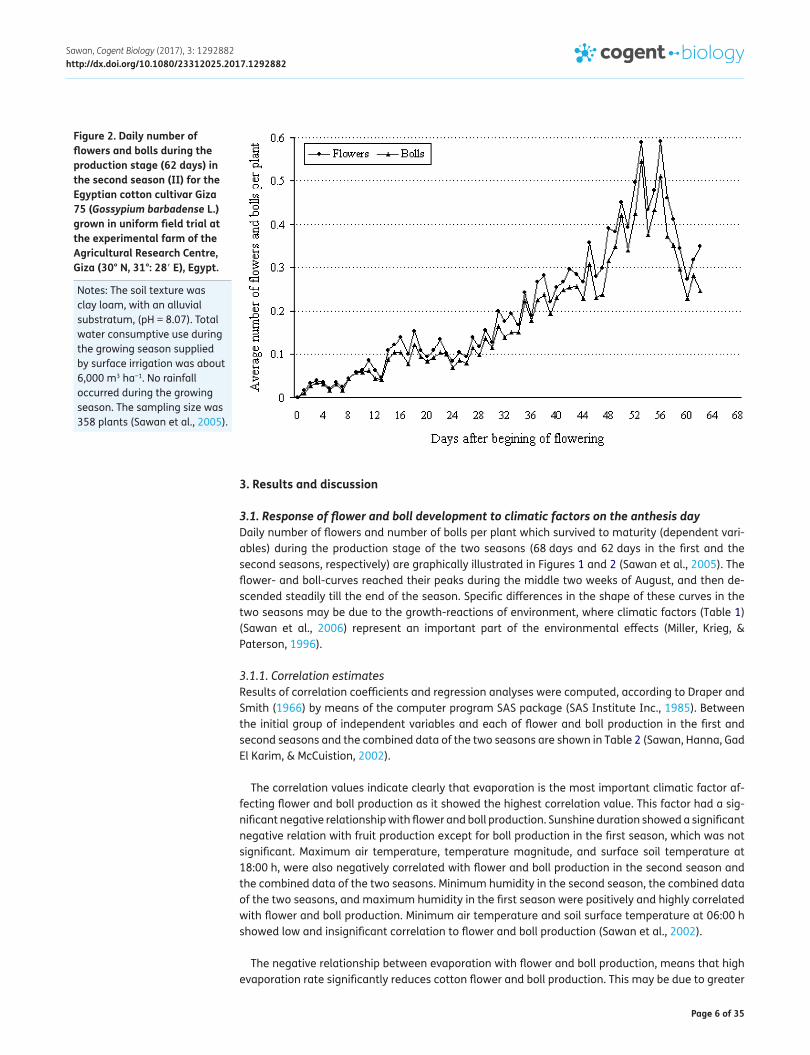
Daily records of the climatic factors (independent variables), were taken for each day during pro-duction stage in any season including two additional periods of 15 days preceding and after the production stage (Sawan et al., 2005). Range and mean values of the climatic parameters recorded during the production stage for both seasons and overall data are listed in Table 1 (Sawan, Hanna, & McCuistion, 2006). Daily number of flowers and number of bolls per plant which survived till maturity (dependent variables) during the production stage in the two seasons are graphically illustrated in Figures 1 and 2 (Sawan et al., 2005).

Page 5 of 35
Sawan, Cogent Biology (2017), 3: 1292882http://dx.doi.org/10.1080/23312025.2017.1292882
Figure 1. Daily number of flowers and bolls during the production stage (68 days) in the first season (I) for the Egyptian cotton cultivar Giza 75 (Gossypium barbadense L.) grown in uniform field trial at the experimental farm of the Agricultural Research Centre, Giza (30° N, 31°: 28′ E), Egypt.
Notes: The soil texture was clay loam, with an alluvial substratum, (pH = 8.07). Total water consumptive use during the growing season supplied by surface irrigation was about 6,000 m3 ha−1. No rainfall occurred during the growing season. The sampling size was 261 plants (Sawan et al., 2005).
Table 1. Range and mean values of the independent variables for the two seasons and over all data
Note: ND = not determined.Source: Sawan et al. (2006).aFlower and boll stage (68 days, from 23 June to 29 August).bFlower and boll stage (62 days, from 29 June to 29 August).cDiurnal temperature range.
Climatic factor’s
First seasona Second seasonb Over all data (Two seasons)
Range Mean Range Mean Range MeanMax. Temp. (°C), (X1) 31.0–44.0 34.3 30.6–38.8 34.1 30.6–44.0 34.2
Min. Temp. (°C), (X2) 18.6–24.5 21.9 18.4–23.9 21.8 18.4–24.5 21.8
Max.–Min. Temp. (°C), (X3)
c 9.4–20.9 12.4 8.5–17.6 12.2 8.5–20.9 12.3
Evap (mm d−1), (X4) 7.6–15.2 10.0 4.1–9.8 6.0 4.1–15.2 8.0
06:00 h Temp. (°C), (X5)
14.0–21.5 17.8 13.3–22.4 18.0 13.3–22.4 17.9
18:00 h Temp. (°C), (X6)
19.6–27.0 24.0 20.6–27.4 24.2 19.6–27.4 24.1
Sunshine (h d−1), (X7)
10.3–12.9 11.7 9.7–13.0 11.9 9.7–13.0 11.8
Max. RH (%), (X8) 62–96 85.4 51–84 73.2 51–96 79.6
Min. RH (%), (X9) 11–45 30.8 23–52 39.8 11–52 35.1
Wind speed (m s−1), (X10)
ND ND 2.2–7.8 4.6 ND ND
Page 6 of 35
Sawan, Cogent Biology (2017), 3: 1292882http://dx.doi.org/10.1080/23312025.2017.1292882
3. Results and discussion
3.1. Response of flower and boll development to climatic factors on the anthesis dayDaily number of flowers and number of bolls per plant which survived to maturity (dependent vari-ables) during the production stage of the two seasons (68 days and 62 days in the first and the second seasons, respectively) are graphically illustrated in Figures 1 and 2 (Sawan et al., 2005). The flower- and boll-curves reached their peaks during the middle two weeks of August, and then de-scended steadily till the end of the season. Specific differences in the shape of these curves in the two seasons may be due to the growth-reactions of environment, where climatic factors (Table 1) (Sawan et al., 2006) represent an important part of the environmental effects (Miller, Krieg, & Paterson, 1996).
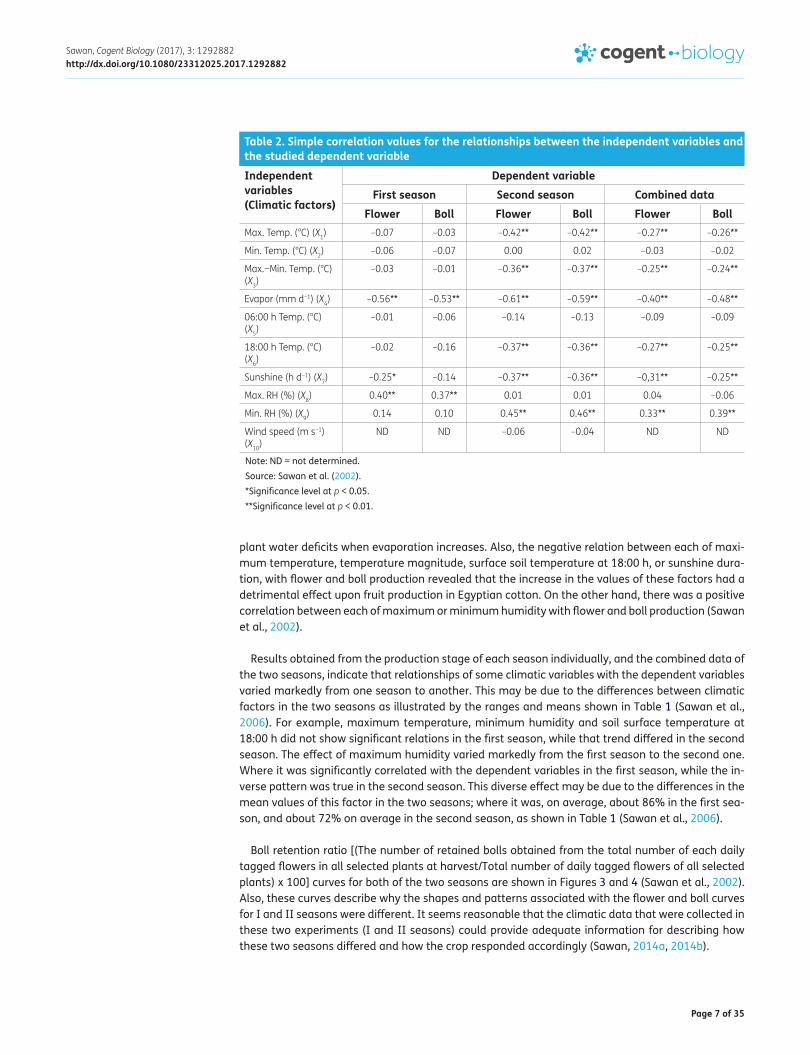
3.1.1. Correlation estimatesResults of correlation coefficients and regression analyses were computed, according to Draper and Smith (1966) by means of the computer program SAS package (SAS Institute Inc., 1985). Between the initial group of independent variables and each of flower and boll production in the first and second seasons and the combined data of the two seasons are shown in Table 2 (Sawan, Hanna, Gad El Karim, & McCuistion, 2002).
The correlation values indicate clearly that evaporation is the most important climatic factor af-fecting flower and boll production as it showed the highest correlation value. This factor had a sig-nificant negative relationship with flower and boll production. Sunshine duration showed a significant negative relation with fruit production except for boll production in the first season, which was not significant. Maximum air temperature, temperature magnitude, and surface soil temperature at 18:00 h, were also negatively correlated with flower and boll production in the second season and the combined data of the two seasons. Minimum humidity in the second season, the combined data of the two seasons, and maximum humidity in the first season were positively and highly correlated with flower and boll production. Minimum air temperature and soil surface temperature at 06:00 h showed low and insignificant correlation to flower and boll production (Sawan et al., 2002).
The negative relationship between evaporation with flower and boll production, means that high evaporation rate significantly reduces cotton flower and boll production. This may be due to greater
Figure 2. Daily number of flowers and bolls during the production stage (62 days) in the second season (II) for the Egyptian cotton cultivar Giza 75 (Gossypium barbadense L.) grown in uniform field trial at the experimental farm of the Agricultural Research Centre, Giza (30° N, 31°: 28′ E), Egypt.
Notes: The soil texture was clay loam, with an alluvial substratum, (pH = 8.07). Total water consumptive use during the growing season supplied by surface irrigation was about 6,000 m3 ha−1. No rainfall occurred during the growing season. The sampling size was 358 plants (Sawan et al., 2005).
Page 7 of 35
Sawan, Cogent Biology (2017), 3: 1292882http://dx.doi.org/10.1080/23312025.2017.1292882
plant water deficits when evaporation increases. Also, the negative relation between each of maxi-mum temperature, temperature magnitude, surface soil temperature at 18:00 h, or sunshine dura-tion, with flower and boll production revealed that the increase in the values of these factors had a detrimental effect upon fruit production in Egyptian cotton. On the other hand, there was a positive correlation between each of maximum or minimum humidity with flower and boll production (Sawan et al., 2002).
Results obtained from the production stage of each season individually, and the combined data of the two seasons, indicate that relationships of some climatic variables with the dependent variables varied markedly from one season to another. This may be due to the differences between climatic factors in the two seasons as illustrated by the ranges and means shown in Table 1 (Sawan et al., 2006). For example, maximum temperature, minimum humidity and soil surface temperature at 18:00 h did not show significant relations in the first season, while that trend differed in the second season. The effect of maximum humidity varied markedly from the first season to the second one. Where it was significantly correlated with the dependent variables in the first season, while the in-verse pattern was true in the second season. This diverse effect may be due to the differences in the mean values of this factor in the two seasons; where it was, on average, about 86% in the first sea-son, and about 72% on average in the second season, as shown in Table 1 (Sawan et al., 2006).
Boll retention ratio [(The number of retained bolls obtained from the total number of each daily tagged flowers in all selected plants at harvest/Total number of daily tagged flowers of all selected plants) x 100] curves for both of the two seasons are shown in Figures 3 and 4 (Sawan et al., 2002). Also, these curves describe why the shapes and patterns associated with the flower and boll curves for I and II seasons were different. It seems reasonable that the climatic data that were collected in these two experiments (I and II seasons) could provide adequate information for describing how these two seasons differed and how the crop responded accordingly (Sawan, 2014a, 2014b).
Table 2. Simple correlation values for the relationships between the independent variables and the studied dependent variable
Note: ND = not determined.Source: Sawan et al. (2002).*Significance level at p < 0.05.**Significance level at p < 0.01.
Independent variables (Climatic factors)
Dependent variableFirst season Second season Combined data
Flower Boll Flower Boll Flower BollMax. Temp. (°C) (X1) –0.07 –0.03 –0.42** –0.42** –0.27** –0.26**
Min. Temp. (°C) (X2) –0.06 –0.07 0.00 0.02 –0.03 –0.02
Max.−Min. Temp. (°C) (X3)
–0.03 –0.01 –0.36** –0.37** –0.25** –0.24**
Evapor (mm d−1) (X4) –0.56** –0.53** –0.61** –0.59** –0.40** –0.48**
06:00 h Temp. (°C) (X5)
–0.01 –0.06 –0.14 –0.13 –0.09 –0.09
18:00 h Temp. (°C) (X6)
–0.02 –0.16 –0.37** –0.36** –0.27** –0.25**
Sunshine (h d−1) (X7) –0.25* –0.14 –0.37** –0.36** –0,31** –0.25**
Max. RH (%) (X8) 0.40** 0.37** 0.01 0.01 0.04 –0.06
Min. RH (%) (X9) 0.14 0.10 0.45** 0.46** 0.33** 0.39**
Wind speed (m s−1) (X10)
ND ND –0.06 –0.04 ND ND

Page 8 of 35
Sawan, Cogent Biology (2017), 3: 1292882http://dx.doi.org/10.1080/23312025.2017.1292882
These results indicate that evaporation is the most effective and consistent climatic factor affect-ing boll production. As the sign of the relationship was negative, this means that an increase in evaporation would cause a significant reduction in boll number. Thus, applying specific treatments such as an additional irrigation, and use of plant growth regulators, would decrease the deleterious effect of evaporation after boll formation and hence contribute to an increase in cotton boll produc-tion and retention, and the consequence is an increase in cotton yield (Sawan et al., 2002). In this connection, Moseley, Landivar, and Locke (1994) stated that methanol has been reported to in-crease water use efficiency, growth and development of C3 plants in arid conditions, under intense sunlight. In field trials cotton cv. DPL-50 (G. hirsutum), was sprayed with a nutrient solution (1.33 lb N + 0.27 lb Fe + 0.27 lb Zn acre−1) or 30% methanol solution at a rate of 20 gallons acre−1, or
Figure 3. Daily boll retention ratio during the production stage (68 days) in the first season (I) for the Egyptian cotton cultivar Giza 75 (Gossypium barbadense L.) grown in uniform field trial at the experimental farm of the Agricultural Research Centre, Giza (30° N, 31°: 28′ E at an altitude 19 m), Egypt.
Notes: The soil texture was clay loam, with an alluvial substratum, (pH = 8.07). Total water consumptive use during the growing season supplied by surface irrigation was about 6,000 m3 ha−1. No rainfall occurred during the growing season. The sampling size was 261 plants (Sawan et al., 2002).
Figure 4. Daily boll retention ratio during the production stage (62 days) in the second (II) for the Egyptian cotton cultivar Giza 75 (Gossypium barbadense L.) grown in uniform field trial at the experimental farm of the Agricultural Research Centre, Giza (30° N, 31°: 28′ E at an altitude 19 m), Egypt.
Notes: The soil texture was clay loam, with an alluvial substratum, (pH = 8.07). Total water consumptive use during the growing season supplied by surface irrigation was about 6,000 m3 ha−1. No rainfall occurred during the growing season. The sampling size was 358 plants (Sawan et al., 2002).

Page 9 of 35
Sawan, Cogent Biology (2017), 3: 1292882http://dx.doi.org/10.1080/23312025.2017.1292882
sprayed with both the nutrient solution and methanol under two soil moisture regimes (irrigated and dry land). The foliar spray treatments were applied 6 times during the growing season beginning at first bloom. They found that irrigation (a total of 4.5 inches applied in July) increased lint yield across foliar spray treatments by 18%. Zhao and Oosterhuis (1997) reported that in a growth cham-ber when cotton (G. hirsutum cv. Stoneville 506) plants were treated with the plant growth regulator PGR-IV (gibberellic acid, IBA and a proprietary fermentation broth) under water deficit stress and found significantly higher dry weights of roots and floral buds than the untreated water-stressed plants. They concluded that PGR-IV can partially alleviate the detrimental effects of water stress on photosynthesis and dry matter accumulation and improves the growth and nutrient absorption of growth chamber-grown cotton plants. Meek, Oosterhuis, and Steger (1999) in a field experiment in Arkansas found that application of 3 or 6 kg glycine betaine (PGR) ha−1, to cotton plants had the po-tential for increasing yield in cotton exposed to mild water stress.
3.1.2. Multiple linear regression equationBy means of the multiple linear regression analysis, fitting predictive equations (having good fit) were computed for flower and boll production per plant using selected significant factors from the nine climatic variables studied in this investigation. Wind speed evaluated during the second season had no influence on the dependent variables. The equations obtained for each of the two dependent variables, i.e. number of flowers (Y1) and bolls per plant (Y2) in each season and for combined data from the two seasons (Table 2) (Sawan et al., 2002) are as follows:
First season: (n = 68)
While R2 for all studied variables was 0.4022.
Y2= 15.434 − 1.633X
4+ 0.159X
8, R = 0.589∗∗ and R2 = 0.3469 and R2 for all studied variables
was 0.3843.
Second season: (n = 62)
In addition, R2 for all studied variables was 0.4503 and 0.4287 for Y1 and Y2 equations, respectively.
Combined data for the two seasons: (n = 130)
While R2 for all studied variables was 0.4073 for Y1 and 0.3790 for Y2.
Three climatic factors, i.e. minimum air temperature, surface soil temperature at 06:00 h, and wind speed were not included in the equations since they had very little effect on production of cot-ton flowers and bolls. The sign of the partial regression coefficient for an independent variable (cli-matic factor) indicates its effect on the production value of the dependent variable (flowers or bolls). This means that high rates of humidity and/or low values of evaporation will increase fruit produc-tion (Sawan et al., 2002).
Y1= 21.691 − 1.968X
4− 0.241X
7+ 0.216X
8,R = 0.608∗∗andR2 = 0.3697,
Y1= 77.436 − 0.163X
1− 2.861X
4− 1.178X
7+ 0.269X
9, R = 0.644∗∗,R2 = 0.4147
Y2= 66.281 − 0.227X
1− 3.315X
4− 2.897X
7+ 0.196X
9, R = 0.629∗∗,R2 = 0.3956
Y1= 68.143 − 0.827X
4− 1.190X
6− 2.718X
7+ 0.512X
9, R = 0.613∗∗, R2 = 0.3758
Y2= 52.785 − 0.997X
4− 0.836X
6− 1.675X
7+ 0.426X
9, R = 0.569∗∗, R2 = 0.3552

Page 10 of 35
Sawan, Cogent Biology (2017), 3: 1292882http://dx.doi.org/10.1080/23312025.2017.1292882
3.1.3. Contribution of selected climatic factors to variations in the dependent variableRelative contributions (RC %) for each of the selected climatic factors to variation in flower and boll production is summarized in Table 3 (Sawan et al., 2002). Results in this table indicate that evapora-tion was the most important climatic factor affecting flower and boll production in Egyptian cotton. Sunshine duration is the second climatic factor of importance affecting production of flowers and bolls. Relative humidity and temperature at 18:00 h were factors of lower contribution than evapo-ration and sunshine duration/day. Maximum temperature made a contribution less than the other affecting factors.
The highest contribution of evaporation to the variation in both flower and boll production (Sawan et al., 2002) can, however, be explained in the light of results found by Ward and Bunce (1986) in sunflower (Helianthus annuus). They stated that decreases of humidity at both leaf surfaces reduced photosynthetic rate of the whole leaf for plants grown under a moderate temperature and medium light level. Kaur and Singh (1992) found in cotton that flower number was decreased by water stress, particularly when applied at flowering. Seed cotton yield was about halved by water stress at flower-ing, slightly decreased by stress at boll formation, and not significantly affected by stress in the vegetative stage (6–7 weeks after sowing). Orgaz, Mateos, and Fereres (1992) in field experiments at Cordoba, SW Spain, grew cotton cultivars Acala SJ-C1, GC-510, Coker-310 and Jean cultivar at evapo-transpiration (ET) levels ranging from 40 to 100% of maximum ET (ETmax) which were generated with sprinkler line irrigation. The water production function of Jean cultivar was linear; seed yield was 5.30 t ha−1 at ETmax (820 mm). In contrast, the production function of the three other cultivars was linear up to 85% of ETmax, but leveled off as ET approached ETmax (830 mm) because a fraction of the set bolls did not open by harvest at high ET levels. These authors concluded that it is possible to de-fine an optimum ET deficit for cotton based on cultivar earliness, growing-season length, and avail-ability of irrigation water.
The negative relationship between sunshine duration and cotton production may be due to the fact that the species of Gossypium used is known to be a short day plant (Hearn & Constable, 1984), so, an increase of sunshine duration above that needed for cotton plant growth will decrease flower
Table 3. Selected factors and their relative contribution to variations of flower and boll production
Notes: R.C. % = Relative contribution of each of the selected independent variables to variations of the dependent variable. R2 % = Coefficient of determination in percentage form.
Source: Sawan et al. (2002).
Selected climatic factors
Flower production Boll productionR.C. (%) R.C. (%)
First season
Second season
Combined data
First season
Second season
Combined data
Max. Temp. (°C) (X1) – 5.92 – – 5.03 –
Evapor (mm d−1) (X4) 19.08 23.45 16.06 23.04 22.39 22.89
18:00 h Temp. (°C) (X6)
– – 5.83 – – 2.52
Sunshine (h d−1) (X7) 9.43 7.77 8.31 11.65 7.88 5.47
Max. RH (%) (X8) 8.46 – – – – –
Min. RH (%) (X9) – 4.37 7.38 – 4.26 4.64
R2 % for selected factors
36.97 41.47 37.58 34.69 39.56 35.52
R2 % for factors studied
40.22 45.03 40.73 38.43 42.87 37.90
R2 % for factors deleted
3.25 3.56 3.15 3.74 3.31 2.38

Page 11 of 35
Sawan, Cogent Biology (2017), 3: 1292882http://dx.doi.org/10.1080/23312025.2017.1292882
and boll production. Oosterhuis (1997) studied the reasons for low and variable cotton yields in Arkansas, with unusually high insect pressures and the development of the boll load during an ex-ceptionally hot and dry August. Solutions to the problems are suggested i.e. selection of tolerant cultivars, effective and timely insect and weed control, adequate irrigation regime, use of proper crop monitoring techniques, and application of plant growth regulators.
3.2. Effect of climatic factors during the development periods of flowering and boll formation on the production of cottonDaily number of flowers and number of bolls per plant that survived to maturity (dependent varia-bles) during the production stage of the two growing seasons are graphically illustrated in Figures 5 and 6 (Sawan, Hanna, & McCuistion, 1999). Observations used in the statistical analysis were ob-tained during the flowering and boll stage (60 days for each season), which represent the entire production stage. The entire production stage was divided into four equivalent quarter’s periods (15 days each) and used for correlation and regression analyses.
Figure 5. Daily number of flowers and bolls during the production stage (60 days) in the first season (I) for the Egyptian cotton cultivar Giza 75 (Gossypium barbadense L.) grown in uniform field trial at the experimental farm of the Agricultural Research Centre, Giza (30° N, 31°: 28′ E), Egypt.
Notes: The soil texture was clay loam, with an alluvial substratum, (pH = 8.07). Total water consumptive use during the growing season supplied by surface irrigation was about 6,000 m3 ha−1. No rainfall occurred during the growing season. The sampling size was 261 plants (Sawan et al., 1999).
Figure 6. Daily number of flowers and bolls during the production stage (60 days) in the second season (II) for the Egyptian cotton cultivar Giza 75 (Gossypium barbadense L.) grown in uniform field trial at the experimental farm of the Agricultural Research Centre, Giza (30° N, 31°: 28′ E), Egypt.
Notes: The soil texture was clay loam, with an alluvial substratum, (pH = 8.07). Total water consumptive use during the growing season supplied by surface irrigation was about 6,000 m3 ha−1. No rainfall occurred during the growing season. The sampling size was 358 plants (Sawan et al., 1999).

Page 12 of 35
Sawan, Cogent Biology (2017), 3: 1292882http://dx.doi.org/10.1080/23312025.2017.1292882
Independent variables, their range and mean values for the two seasons and during the periods of flower and boll production are listed in Table 4 (Sawan et al., 1999). Both flower number and boll production show the higher value in the third and fourth quarters of production stage, accounting for about 70% of total production during the first season and about 80% of the total in the second season.
Table 4. Range and mean value of the independent variables (climatic factors) during the four periods of flower and boll production stage
Source: Sawan et al. (1999).
Climatic factors
First period Second period Third period Fourth periodRange Mean Range Mean Range Mean Range Mean
First season
Max. Temp. (°C), (X1)
31.0–37.3 33.7 33.0–37.3 34.7 32.4–37.2 34.5 32.0–38.4 33.8
Min. Temp. (°C), (X2)
18.6–23.5 21.4 20.6–23.5 22.3 18.9–24.4 21.6 19.6–23.8 21.8
Max.−Min. (°C), (X3)
9.4–14.8 12.3 9.8–15.6 12.4 9.7–18.3 12.9 9.5–14.6 12.0
Evapor. mm d−1, (X4)
10.2–15.2 11.7 8.0–13.2 `10.1 7.6–11.2 9.1 7.7–11.1 9.2
06:00 h Temp. (°C), (X5)
14.2–19.9 16.8 15.8–21.5 18.9 13.9–21.1 17.4 15.4–20.8 18.0
18:00 h Temp.(°C), (X6)
22.0–25,2 23.8 22.2–27.0 24.2 19.6–25.6 24.1 21.8–26.0 23.9
Sunshine h d−1, (X7)
11.4–12.9 12.4 10.4–12.4 11.5 10.5–12.4 11.6 9.9–12.2 11.4
Max. Hum. %, (X8)
62–88 80.7 84–94 88.4 85–96 89.9 76–96 87.4
Min. Hum. %, (X9)
21–37 28.2 22–43 31.4 17–42 29.9 24–45 34.0
Second season
Max. Temp. (°C), (X1)
31.4–38.8 35.5 31.4–35.5 33.4 32.6–37.9 34.4 30.6–34.6 32.8
Min. Temp. (°C), (X2)
20.1–23.4 21.3 19.6–23.1 21.7 18.4–24.3 22.3 18.6–23.9 21.7
Max.−Min. (°C), (X3)
9.4–17.6 14.2 10.1–15.0 11.7 9.6–17.0 12.1 8.5–12.6 11.0
Evapor. mm d−1, (X4)
5.9–9.8 7.5 5.0–7.0 6.0 4.3–7.1 5.6 4.1–6.1 4.9
06:00 h Temp. (°C), (X5)
15.5–20.4 17.5 15.2–21.4 18.4 12.9–22.4 18.7 13.3–21.0 17.5
18:00 h Temp. (°C), (X6)
22.8–26.5 24.4 22.2–26.5 24.2 22.9–27.4 24.4 20.6–25.8 23.6
Sunshine h d−1, (X7)
11.2–13.0 12.4 10.9–12.6 11.9 10.6–12.4 11.6 10.3–12.3 11.5
Max.−Hum. %, (X8)
62–83 71.7 51–82 72.8 59–81 74.7 64–84 73.3
Min. Hum. %, (X9)
23–44 33.1 32–50 41.3 29–51 39.9 37–52 44.7
Windspeed m/s, (X10)
2.8–6.8 5.1 3.4–6.6 4.5 2.2–7.8 4.4 3.4–5.8 4.5

Page 13 of 35
Sawan, Cogent Biology (2017), 3: 1292882http://dx.doi.org/10.1080/23312025.2017.1292882
Linear correlation between the climatic factors and the studied characteristics, i.e. flower, boll produc-tion and boll retention ratio, were calculated based on quarters of the production stage for each season. Significant relationships (≤0.15) are shown in Tables 5 and 6 (Sawan et al., 1999). Examining these tables, it is clear that the fourth quarter of production stage consistently exhibited the highest R2 values regard-less of the second quarter for boll retention ratio; however, less data pairs were used (n = 30 for com-bined data of the fourth quarter “n = 15 for each quarter of each season”) to calculate the relations.
Results obtained from the four quarters of the production period for each season separately and for the combined data of the two seasons, indicated that relationships varied markedly from one season to another. This may be due to the differences between the climatic factors in the two sea-sons; as illustrated by its ranges and means shown in Table 4 (Sawan et al., 1999). For example, maximum temperature and surface soil temperature at 18:00 h did not show significant effects in the first season, while this trend differed in the second season.
Table 5. Significant simple correlation values between the climatic factors and flower, boll production and boll retention ratio due to quarters of production stage
Notes: Wind speed did not show significant effect upon the studied production variables. NS = Means simple correlation coefficient is not significant at the 0.15 alpha level of significance; n = Number of data pairs used in calculation.
Source: Sawan et al. (1999).*Significant at 5% probability level.**Significant at 1% probability level.***Significant at 10% probability level.****Significant at 15% probability level.
Climatic factors Flower Boll Ratio: Bolls/Flowers (100)1st 2nd 3rd 4th 1st 2nd 3rd 4th 1st 2nd 3rd 4th
First season (n by quarter = 15)
Max. Temp. (°C), (X1)
NS NS NS NS NS NS NS NS NS NS NS NS.
Min. Temp. (°C), (X2) 0.516* 0.607* NS NS 0.561* 0.638** NS NS NS 0.680** NS NS
Max.−Min. (°C), (X3) NS NS 0.538* NS NS NS 0.494* NS 0.515* NS NS NS
Evapor. mm d−1, (X4)
0.512* −0.598* NS 0.424*** 0.397**** −0.500* −0.0321**** NS NS −0.387**** −0.287**** NS
06:00 h Temp. (°C), (X5)
−0.352**** 0.534* −0.358**** 0.301**** 0.402**** 0.516* −0.441*** NS NS 0.440*** NS −0.292****
18:00 h Temp. (°C), (X6)
NS NS NS NS NS NS NS NS NS NS NS NS
Sunshine h d−1, (X7) NS NS 0.346**** NS NS NS NS 0.430*** NS NS NS 0.480*
Max. Hum. %, (X8) −0.316**** −0.260**** 0.461*** 0.283**** NS NS 0.410*** NS 0.389**** NS NS −0.322****
Min. Hum. %, (X9) NS 0.309**** −0.436*** NS NS 0.436*** −0.316*** NS −0.473*** 0.527* NS NS
Second season (n by quarter = 15)
Max. Temp. (°C), (X1)
NS NS NS −0.730** NS NS NS −0.654** NS NS 0.407*** NS
Min. Temp. (°C), (X2) NS NS NS −0.451*** NS NS NS −0.343**** NS NS NS NS
Max.−Min. (°C), (X3) NS NS 0.598* NS NS NS 0.536* NS 0.456*** −0.416*** NS NS
Evapor. mm d−1, (X4)
NS NS 0.640** NS NS NS 0.580* NS NS −0.318**** NS NS
06:00 h Temp. (°C), (X5)
−0.397**** −0.301**** −0.407*** −0.506* −0.380**** −0.323**** −0.332**** −0.426*** NS NS 0.283**** NS
18:00 h Temp. (°C), (X6)
NS −.0440*** NS −0.656** NS −0.410*** NS −0.582* −.0626** NS NS NS
Sunshine h d−1, (X7) 0.362**** NS NS NS 0.340**** 0.308**** 0.354**** NS NS 0.409*** NS NS
Max. Hum. %, (X8) −0.523* 0.424*** −0.587* NS −0530* 0.431*** −0.586* NS NS NS NS NS
Min. Hum. %, (X9) NS NS −0.585* 0.639**** NS NS −0.517* 0.652** NS NS NS 0.420***

Page 14 of 35
Sawan, Cogent Biology (2017), 3: 1292882http://dx.doi.org/10.1080/23312025.2017.1292882
Multiple linear regression equations obtained from data of the fourth quarter, for:
1. Flower production
And R2 = 0.672**
2. Boll production
With an R2 = 0.747**
3. Boll retention ratio
And its R2 = 0.615**
The equation obtained from data of the second quarter of production stage for boll retention ratio,
And R2 = 0.737**
R2 values for these equations ranged from 0.615 to 0.747. It could be concluded that these equa-tions may predict flower and boll production and boll retention ratio from the fourth quarter period within about 62–75% of its actual means. Therefore, these equations seem to have practical value.
Y = 160.0 + 11.28X1− 4.45X
3− 2.93X
4− 5.05X
5− 11.3X
6− 0.962X
8+ 2.36X
9
Y = 125.4 + 13.74X1− 6.76X
3− 4.34X
4− 6.59X
5− 10.3X
6− 1.25X
8+ 2.16X
9
Y = 81.93 − 0.272X3− 2.98X
4+ 3.80X
7− 0.210X
8− 0.153X
9
Y = 92.81 − 0.107X3− 0.453X
4+ 0.298X
7− 0.194X
8+ 0.239X
9
Table 6. Significant simple correlation values between the climatic factors and flower, boll production, and boll retention ratio due to quarters periods of production stage for the combined data of the two seasons (n = 30)
Source: Sawan et al. (1999).*Significant at 5% probability level.**Significant at 1% probability level.***Significant at 10% probability level.****Significant at 15% probability level.
Climatic factors Flower Boll Ratio:Bolls/Flowers (100)1st 2nd 3rd 4th 1st 2nd 3rd 4th 1st 2nd 3rd 4th
Max. Temp. (°C), (X1) NS NS 0.29**** −0.48** NS NS 0.38*** −0.47** 0.27**** NS NS NS
Min. Temp. (°C), (X2) NS NS −0.35*** NS NS NS −0.28**** NS NS NS NS NS
Max.−Min. (°C), (X3) −0.40* −0.30**** 0.59** −0.36*** NS −0.48** 0.52** −0.38*** −0.40* −0.47** NS −0.28****
Evapor. mm d−1, (X4) 0.78** NS 0.32*** −0.67** 0.67** −0.51** NS −0.74** NS −0.82** −0.49** −0.72**
06:00 h Temp. (°C), (X5)
NS 0.27**** −0.43* −0.31**** NS NS −0.37*** −0.37*** NS NS NS NS
18:00 h Temp. (°C), (X6)
NS NS NS −0.42* NS NS NS −0.37*** NS NS NS NS
Sunshine h d−1, (X7) NS NS 0.38*** NS NS NS 0.32*** NS NS 0.30**** NS 0.27****
Max. Hum. %, (X8) NS NS NS −0.64** NS NS NS −0.71** NS −0.60** −0.44* −0.70**
Min. Hum. %, (X9) NS NS −0.54** 0.69** −0.32*** 0.42* −0.37*** 0.72** NS 0.72** 0.40* 0.56**
R2 0.667 0.116 0.496 0.672 0.446 0.335 0.389 0.747 0.219 0.737 0.269 0.615

Page 15 of 35
Sawan, Cogent Biology (2017), 3: 1292882http://dx.doi.org/10.1080/23312025.2017.1292882
Comparing Tables 6 and 7 (Sawan et al., 1999), it can be seen that differences in R2 between the fourth quarter and the entire production period of the two seasons for each of flower, boll produc-tion, and boll retention ratio were large (0.266, 0.325, and 0.279, respectively). These differences are sufficiently large to make a wide gap under a typical field sampling situation. This could be due to the high percentage of flower and boll production for the fourth quarter.
Equations obtained from data of the fourth quarter explained more variations of flower, boll pro-duction and boll retention ratio. Evaporation, humidity, and temperature are the principal climatic factors that govern cotton flower and boll production during the fourth quarter; since they were most strongly correlated with the dependent variables studied (Table 6) (Sawan et al., 1999).
Evaporation, that seems to be the most important climatic factor, had negative significant rela-tionship which means that high evaporation ratio reduces significantly flower and boll production. Maximum temperature, temperature-differentiates and maximum humidity also showed negative significant link with fruiting production, which indicates that these climatic variables have determi-nable effect upon Egyptian cotton fruiting production. Minimum humidity was positively high corre-lated in most quarter periods for flower, boll production and boll retention ratio. This means that an increase of this factor will increase both flower and boll production. Maximum temperature is some-time positively and sometime negatively linked to boll production (Table 6). These erratic correla-tions may be due to the variations in the values of this factor between the quarters of the production stages, as shown from its range and mean values (Table 4) (Sawan et al., 1999).
Burke, Hatfield, and Wanjura (1990) pointed out that the usefulness of the 27.5°C midpoint tem-perature of the TKW of cotton as a baseline temperature for a thermal stress index (TSI) was inves-tigated in field trials on cotton cv. Paymaster 104. This biochemical baseline and measurements of foliage temperature were used to compare the TSI response with the cotton field performance. Foliage temperature was measured with hand-held 4°C field of view IR thermometer while plant bio-mass was measured by destructive harvesting. The biochemical-based TSI and the physically based crop water stress index were highly correlated (R2 = 0.92) for cotton across a range of environmental conditions. Reddy, Hodges, and McKinion (1995) in controlled environmental chambers pima cotton cv. S-6 produced less total biomass at 35.5°C than at 26.9°C and no bolls were produced at the higher temperature 40°C. This confirms the results of this study as maximum temperature showed nega-tive significant relationship with production variables in the fourth quarter period of the production stage. Zhen (1995) found that the most important factors decreasing cotton yields in Huangchuan
Table 7. Significant simple correlation values between the climatic factors and flower, boll production and boll retention ratio for combined data of the two seasons (n = 120)
Source: Sawan et al. (1999).*Significant at 5% probability level.**Significant at 1% probability level.***Significant at 10% probability level.
Climatic factors Flower Boll RatioMax. Temp. (°C), (X1) −0.152*** NS NS
Min. Temp. (°C), (X2) NS NS NS
Max.−Min. (°C), (X3) −0.259** −0.254** NS
Evapor mm d−1, (X4) −0.327** −0.429** −0.562**
06:00 h Temp. (°C), (X5) NS NS NS
18:00 h Temp. (°C), (X6) −0.204* −0.190*** NS
Sunshine h d−1, (X7) −0.227* −0.180*** NS
Max. Hum. %, (X8) NS NS −0.344**.
Min. Hum. %, (X9) 0.303** 0.364** 0.335**
R2 0.406** 0.422** 0.336*
Page 16 of 35
Sawan, Cogent Biology (2017), 3: 1292882http://dx.doi.org/10.1080/23312025.2017.1292882
County, Henan, were low temperatures in spring, high temperatures and pressure during summer, and the sudden fall in temperature at the beginning of autumn. Measures to increase yields included the use of the more suitable high-oil cotton cultivars, which mature early, and choosing sowing dates and spacing so that the best use was made of the light and temperature resources available.
It may appear that the grower would have no control over boll shedding induced by high tempera-ture, but this is not necessarily the case. If he can irrigate, he can exert some control over tempera-ture since transpiring plants have the ability to cool themselves by evaporation. The leaf and canopy temperatures of drought-stressed plants can exceed those of plants with adequate quantity of wa-ter by several degrees when air humidity is low (Ehrler, 1973). The grower can partially overcome the adverse effects of high temperature on net photosynthesis by spacing plants to adequately expose the leaves. Irrigation may also increase photosynthesis by preventing stomata closure during the day. Adequate fertilization is necessary for maximum rates of photosynthesis. Finally, cultivars ap-pear to differ in their heat tolerance (Fisher, 1975). Therefore, the grower can minimize boll abscis-sion where high temperatures occur by selecting a heat-tolerant cultivar, planting date management, applying an adequate fertilizer, planting or thinning for optimal plant spacing, and irrigating as needed to prevent drought stress (Sawan, 2014b).
3.3. Appropriate time scale for aggregating climatic data to predict flowering and boll setting behavior of cotton
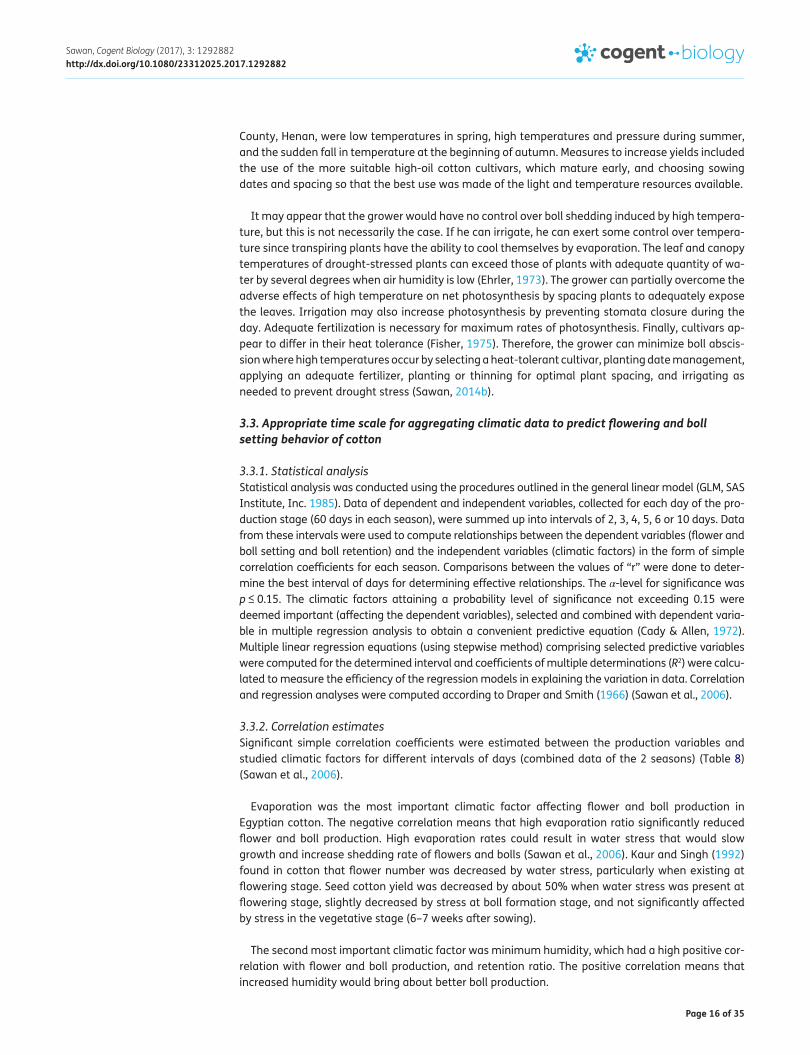
3.3.1. Statistical analysisStatistical analysis was conducted using the procedures outlined in the general linear model (GLM, SAS Institute, Inc. 1985). Data of dependent and independent variables, collected for each day of the pro-duction stage (60 days in each season), were summed up into intervals of 2, 3, 4, 5, 6 or 10 days. Data from these intervals were used to compute relationships between the dependent variables (flower and boll setting and boll retention) and the independent variables (climatic factors) in the form of simple correlation coefficients for each season. Comparisons between the values of “r” were done to deter-mine the best interval of days for determining effective relationships. The α-level for significance was p ≤ 0.15. The climatic factors attaining a probability level of significance not exceeding 0.15 were deemed important (affecting the dependent variables), selected and combined with dependent varia-ble in multiple regression analysis to obtain a convenient predictive equation (Cady & Allen, 1972). Multiple linear regression equations (using stepwise method) comprising selected predictive variables were computed for the determined interval and coefficients of multiple determinations (R2) were calcu-lated to measure the efficiency of the regression models in explaining the variation in data. Correlation and regression analyses were computed according to Draper and Smith (1966) (Sawan et al., 2006).
3.3.2. Correlation estimatesSignificant simple correlation coefficients were estimated between the production variables and studied climatic factors for different intervals of days (combined data of the 2 seasons) (Table 8) (Sawan et al., 2006).
Evaporation was the most important climatic factor affecting flower and boll production in Egyptian cotton. The negative correlation means that high evaporation ratio significantly reduced flower and boll production. High evaporation rates could result in water stress that would slow growth and increase shedding rate of flowers and bolls (Sawan et al., 2006). Kaur and Singh (1992) found in cotton that flower number was decreased by water stress, particularly when existing at flowering stage. Seed cotton yield was decreased by about 50% when water stress was present at flowering stage, slightly decreased by stress at boll formation stage, and not significantly affected by stress in the vegetative stage (6–7 weeks after sowing).
The second most important climatic factor was minimum humidity, which had a high positive cor-relation with flower and boll production, and retention ratio. The positive correlation means that increased humidity would bring about better boll production.

Page 17 of 35
Sawan, Cogent Biology (2017), 3: 1292882http://dx.doi.org/10.1080/23312025.2017.1292882
The third most important climatic factor in our study was sunshine duration, which showed a significant negative relationship with flower and boll production only. The negative relationship be-tween sunshine duration and cotton production may be due to the fact that the species of the genus Gossypium are known to be short day plants (Hearn & Constable, 1984), so, an increase of sunshine duration above that sufficient to attain good plant growth will decrease flower and boll production. Bhatt (1977) found that exposure to daylight over 14 h and high day temperature, individually or in combination, delayed flowering of the Upland cotton cv. J34. Although average sunshine duration in our study was only 11.7 h, yet it could reach 13 h, which, in combination with high maximum tem-peratures (up to 38.8°C), may have adversely affected reproductive growth.
Maximum air temperature, temperature magnitude and surface soil temperature at 18:00 h show significant negative relationships with flower and boll production only. Meanwhile, the least impor-tant factors were surface soil temperature at 06:00 h and minimum air temperature. Our results
Table 8. Significant simple correlation coefficient values between the production variables and the studied climatic factors for the daily and different intervals of days combined over both seasons
Notes: NS = Simple correlation coefficient is not significant at the 15% probability level; n = Number of data pairs used in calculation.Source: Sawan et al. (2006).aWind speed did not show significant effect upon the studied production variables, so is not reported.*Significant at 5% probability level.**Significant at 1% probability level.***Significant at 10% probability level.****Significant at 15% probability level.
Daily and intervals of days
Production variables
Climatic factorsa
Air Temp. (°C) Evap (mm d−1)
Surface soil Temp.(°C) Sunshine duration
(h d−1)
Relative humidity (%)
Max. (X1) Min. (X2)
Max.−Min. (X3)
(X4) 06:00 h (X5)
18:00 h (X6)
(X7) Max. (X8) Min. (X9)
Daily (n = 120)
Flower −0.15*** NS −0.26** −0.33** NS −0.20* −0.23* NS 0.30**
Boll NS NS −0.25** −0.43** NS −0.19*** −0.18*** NS 0.36**
Boll ret. rat. NS NS NS −0.56** NS NS NS NS 0.34**
2 Days (n = 60)
Flower −0.31*** NS −0.32* −0.36** NS −0.24**** −0.36** NS 0.37**
Boll −0.29*** NS −0.30*** −0.46** NS −0.21**** −0.31* NS 0.44**
Boll ret. rat. NS NS NS −0.61** NS NS NS NS 0.40**
3 Days (n = 40)
Flower −0.34* NS −0.34* −0.33* NS −0.28*** −0.39* NS 0.34*
Boll −0.32* NS −0.32* −0.48** NS −0.24**** −0.36* NS 0.45**
Boll ret. rat. NS NS NS −0.63** NS NS NS NS 0.40*
4 Days (n = 30)
Flower −0.31*** NS −0.35*** −0.33*** NS −0.28**** −0.39* NS 0.34***
Boll −0.31*** NS −0.33*** −0.48** NS −0.23**** −0.38* NS 0.45*
Boll ret. rat. NS NS NS −0.64** NS NS NS NS 0.42*
5 Days (n = 24)
Flower −0.35*** NS −0.37*** −0.39*** NS −0.39*** −0.52** NS 0.41*
Boll −0.33**** NS −0.35*** −0.49* NS −0.35*** −0.44* NS 0.47**
Boll ret. rat. NS NS NS −0.66** NS NS NS NS 0.43*
6 Days (n = 20)
Flower −0.37*** NS −0.41*** −0.38*** NS NS −0.54** NS 0.42*
Boll −0.37*** NS −0.40*** −0.49* NS NS −0.46* NS 0.49*
Boll ret. rat. NS NS NS −0.69** NS NS NS NS 0.45*
10 Days (n = 12)
Flower NS NS −0.45*** −0.40**** NS −0.55* −0.65* NS 0.43***
Boll NS NS −0.43*** −0.51*** NS −0.53*** −0.57* NS 0.51***
Boll ret. rat. NS NS NS −0.74** NS NS NS NS 0.55*

Page 18 of 35
Sawan, Cogent Biology (2017), 3: 1292882http://dx.doi.org/10.1080/23312025.2017.1292882
indicate that evaporation was the most effective climatic factor affecting cotton boll production. As the sign of the relationship was negative, this means that an increase in evaporation caused a sig-nificant reduction in boll number (Sawan et al., 2006). Thus, applying specific treatments, such as an additional irrigation or the use of plant growth regulators (PGR) that would decrease the deleterious effect of evaporation after boll formation, could contribute to an increase in cotton boll production and retention, and consequently an increase in cotton yield. In this connection, Meek et al. (1999) in a field experiment in Arkansas found that application of 3 or 6 kg glycine betaine (PGR) ha−1 to cotton plants under mild water stress increased yield.
Comparing results for the different intervals of days with those from daily observation (Table 8) (Sawan et al., 2006), the five-day interval appeared to be the most suitable interval, which actually revealed a more solid and more obvious relationships between climatic factors and production char-acters. This was in fact indicated by the higher R2 values obtained when using the five-day intervals. The five-day interval may be the most suitable interval for diminishing the daily fluctuations be-tween the factors under study to clear these relations comparing with the other intervals. However, it seems that this conception is true provided that the fluctuations in climatic conditions are limited or minimal. Therefore, it would be the most efficient interval used to help circumvent the unfavora-ble effect of climatic factors. This finding gives researchers and producers a chance to deal with condensed rather than daily weather data.
3.3.3. Regression modelsMultiple linear regression equations were estimated using the stepwise multiple regression tech-nique to express the relation between cotton production variables [number of flowers (Y1); bolls per plant (Y2); and boll retention ratio (Y3)] and the studied climatic factors (Table 9) (Sawan et al., 2006).
Evaporation and surface soil temperature at 18:00 h, sunshine duration and minimum humidity accounted for a highly significant amount of variation (p < 0.05) in cotton production variables, with the equation obtained for the five-day interval showing a high degree of certainty. The R2 values for the five-day interval were higher than those obtained from daily data for each of the cotton produc-tion variables. Also, the five-day interval gave more efficient and stable estimates than the other studied intervals (data not shown) (Sawan et al., 2006). The R2 values for these equations clearly indicate the importance of such equations since the climatic factors involved explained about 59–62% of the variation found in the dependent variables.
During the production stage, an accurate weather forecast for the next 10 days would provide an opportunity to avoid any adverse effect for weather factors on cotton production through applying appropriate cultural practices such as adequate irrigation regime or utilization of plant growth
Table 9. The equations obtained for each of the studied cotton production variables for the five-day intervals and daily intervals combined over both seasons
Source: Sawan et al. (2006).aWhere Y1 = number of flowers per plant, Y2 = number of bolls per plant, Y3 = boll retention ratio,
X3 = maximum − minimum temperature (°C), X4=evaporation mm day−1, X6 = surface soil temperature (°C) at 18:00 h., X7 = sunshine duration h day−1, and X9 = minimum relative humidity %.
**All entries significant at 1% level.
Equationa R2 SignificanceFive-day intervals
Y1 = 23.78 − 0.5362X4 − 0.1429X6 − 0.1654X7 + 0.0613X9 0.6237 **
Y2 = 15.89 − 0.4762X4 − 0.1583X6 − 0.1141X7 + 0.0634X9 0.5945 **
Y3 = 72.65 − 0.0833X4 − 0.1647X6 + 0.2278X9 0.6126 **
Daily intervals
Y1 = 19.78 − 0.181X3 − 0.069X4 − 0.164X6 − 0.182X7 + 0.010X9 0.4117 **
Y2 = 14.96 − 0.173X3 − 0.075X4 − 0.176X6 − 0.129X7 + 0.098X9 0.4461 **
Y3 = 52.36 − 3.601X4 − 0.2352X7 + 4.511X9 0.3587 **

Page 19 of 35
Sawan, Cogent Biology (2017), 3: 1292882http://dx.doi.org/10.1080/23312025.2017.1292882
regulators. This proposal would be true if the fluctuations in weather conditions were not extreme. Our recommendation would be the accumulating five-day climatic data, and use this information to select the adequate cultural practices (such as an additional irrigation or utilization of plant growth regulators) that would help circumvent the unfavorable effects of climatic factors. In case of sharp fluctuations in climatic factors, data could be collected daily, and when stability of climatic condi-tions is restored, the five-day accumulation of weather data could be used again (Sawan et al., 2006).
3.4. Response of flower and boll development to climate factors before and after anthesis dayThe effects of specific climatic factors during both pre- and post-anthesis periods on boll production and retention are mostly unknown. However, by determining the relationship of climatic factors with flower and boll production and retention, the overall level of production can be possibly predicted. Thus, an understanding of these relationships may help physiologists to determine control mecha-nisms of production in cotton plants (Sawan et al., 2005). Daily records of the climatic factors (inde-pendent variables), were taken for each day during production stage in any season including two additional periods of 15 days before and after the production stage (Table 10) (Sawan et al., 2005).
In each season, the data of the dependent and independent variables (68 and 62 days) were re-garded as the original file (a file which contains the daily recorded data for any variable during a specific period). Fifteen other files before and another 15 after the production stage were obtained by fixing the dependent variable data, while moving the independent variable data at steps each of 1 day (either before or after production stage) in a matter similar to a sliding role (Sawan et al., 2005). The following is an example (in the first season):
Table 10. Mean, standard deviation, maximum and minimum values of the climatic factors during the flower and boll stage (initial time) and the 15 days prior to flowering or subsequent to boll setting for I and II season at Giza, Egypt
Note: ND = not determined.Source: Sawan et al. (2005).aFlower and boll stage (68 days, from 23 June to 29 August).bFlower and boll stage (62 days, from 29 June to 29 August).cDiurnal temperature range.
Climatic factors First seasona Second seasonb
Mean SD Max. Min. Mean SD Max. Min.Max. Temp. (°C) (X1) 34.1 1.2 44.0 31.0 33.8 1.2 38.8 30.6
Min. Temp. (°C) (X2) 21.5 1.0 24.5 18.6 21.4 0.9 24.3 18.4
Max.−Min. Temp. (°C) (X3)c 12.6 1.1 20.9 9.4 12.4 1.3 17.6 8.5
Evapor (mm d−1) (X4) 10.6 1.6 16.4 7.6 6.0 0.7 9.8 4.1
06:00 h Temp. (°C) (X5) 17.5 1.1 21.5 13.9 17.6 1.2 22.4 13.3
18:00 h Temp. (°C) (X6) 24.2 1.9 32.3 19.6 23.7 1.1 27.4 20.6
Sunshine (h d−1) (X7) 11.7 0.8 12.9 9.9 11.7 0.4 13.0 10.3
Max. Hum. (%) (X8) 85.6 3.3 96.0 62.0 72.9 3.8 84.0 51.0
Min. Hum. (%) (X9) 30.2 5.2 45.0 11.0 39.1 5.0 52.0 23.0
Wind speed (m s−1) (X10) ND ND ND ND 4.6 0.9 7.8 2.2

Page 20 of 35
Sawan, Cogent Biology (2017), 3: 1292882http://dx.doi.org/10.1080/23312025.2017.1292882
File Data of any dependent variable (for each flowers and bolls)
Any independent variable (for each climatic factors)
Production stage In case of original file and files before production stage
In case of original file and files after production stage
Date Days Date Days Date Days
Original file 23 June–29 August 68 23 June–29 August 68 23 June–29 August 68
1st new file 23 June–29 August 68 22 June–28 August 68 24 June–30 August 68
2nd new file 23 June–29 August 68 21 June–27 August 68 25 June–31 August 68
15th new file 23 June–29 August 68 8 June–14 August 68 8 July−13 September 68
Thus, the climate data were organized into records according to the complete production stage (68 days the first year and 62 days the second year) and 15 day, 14 day, 13 day, … and 1 day periods both before and after the production stage. This produced 31 climate periods per year that were analyzed for their relationships with cotton flowering and boll production (Sawan et al., 2005).
3.4.1. Correlation estimates1. Results of the correlation between climatic factors and each of flower and boll production during the 15 day periods before flowering day (Tables 11 and 12) revealed the following (Sawan et al., 2005):
First season
Daily evaporation and sunshine duration showed consistent negative and statistically significant correlations with both flower and boll production for each of the 15 moving window periods before anthesis (Table 11). Evaporation appeared to be the most important climate factor affecting flower and boll production.
Daily maximum and minimum humidity showed consistent positive and statistically significant correlations with both flower and boll production in most of the 15 moving window periods before anthesis (Table 11) (Sawan et al., 2005). Maximum daily temperature showed low but significant negative correlation with flower production during the 2–5, 8, and 10 day periods before anthesis. Minimum daily temperatures generally showed insignificant correlation with both production vari-ables. The diurnal temperature range showed few correlations with flower and boll production. Daily soil surface temperature at 06:00 h showed a significant positive correlation with boll production during the period extending from the 11–15 day period before anthesis, while its effect on flowering was confined only to the 12 and the 15 day periods prior anthesis. Daily soil surface temperature at 18:00 h showed a significant negative correlation with flower production during the 2–10 day peri-ods before anthesis.
Second season
Daily Evaporation, the diurnal temperature range, and sunshine duration were negatively and significantly correlated with both flower and boll production in all the 15 day periods, while maxi-mum daily temperature was negatively and significantly related to flower and boll formation during the 2–5 day periods before anthesis (Table 12) (Sawan et al., 2005).
Minimum daily temperature showed positive and statistically significant correlations with both production variables only during the 9–15 day periods before anthesis, while daily minimum humid-ity showed the same correlation trend in all the 15 moving window periods before anthesis. Daily soil surface temperature at 06:00 h was positively and significantly correlated with flower and boll pro-duction for the 12, 14, and 15 day periods prior to anthesis only. Daily soil surface temperature at

Page 21 of 35
Sawan, Cogent Biology (2017), 3: 1292882http://dx.doi.org/10.1080/23312025.2017.1292882
Table 11. Simple correlation coefficients (r) between climatic factors and number of flower and harvested bolls in initial time (0) and each of the 15-day periods before flowering in the first season (I)
Note: 0 = Initial time.Source: Sawan et al. (2005).aDiurnal temperature range.*Significant at 5% level.**Significant at 1% level.
Climate period
Air Temp. (°C) Evap (mm d−1)
Surface soil Temp. (°C)
Sunshine duration
(h d−1)
Humidity (%)
Max. (X1)
Min. (X2)
Max.−Min. (X3)a
(X4) 06:00 h (X5)
18:00 h (X6)
(X7) Max. (X8)
Min. (X9)
0 Flower −0.07 −0.06 −0.03 −0.56** −0.01 −0.20 −0.25* 0.40** 0.14
Boll −0.03 −0.07 −0.01 −0.53** −0.06 −0.16 −0.14 0.37** 0.10
1 Flower −0.15 −0.08 −0.11 −0.64** −0.01 −0.17 −0.30* 0.39** 0.20
Boll −0.07 −0.08 −0.02 −0.58** −0.06 −0.10 −0.23* 0.36** 0.13
2 Flower −0.26* −0.10 −0.22 −0.69** −0.07 −0.30* −0.35** 0.42** 0.30*
Boll −0.18 −0.08 −0.14 −0.64** −0.05 −0.21 −0.25* 0.40** 0.20
3 Flower −0.28* −0.02 −0.31** −0.72** 0.15 −0.29* −0.37** 0.46** 0.35**
Boll −0.19 −0.02 −0.21 −0.65** 0.11 −0.20 −0.30* 0.37** 0.25*
4 Flower −0.26* −0.03 −0.26* −0.67** 0.08 −0.24* −0.41** 0.46** 0.35**
Boll −0.21 −0.04 −0.21 −0.63** 0.04 −0.18 −0.35** 0.39** 0.29*
5 Flower −0.27* −0.02 −0.27* −0.68** 0.16 −0.29* −0.45** 0.49** 0.38**
Boll −0.22 0.00 −0.24* −0.63** 0.16 −0.21 −0.39** 0.44** 0.32**
6 Flower −0.21 0.05 −0.25* −0.73** 0.16 −0.28* −0.46** 0.47** 0.42**
Boll −0.15 0.08 −0.21 −0.67** 0.19 −0.19 −0.46** 0.43** 0.35**
7 Flower −0.17 −0.01 −0.17 −0.69** 0.10 −0.27* −0.43** 0.46** 0.35**
Boll −0.11 −0.06 −0.15 −0.64** 0.14 −0.19 −0.46** 0.43** 0.32**
8 Flower −0.24* −0.03 −0.24* −0.71** 0.09 −0.30* −0.44** 0.45** 0.45**
Boll −0.14 0.04 −0.17 −0.63** 0.16 −0.17 −0.48** 0.44** 0.39**
9 Flower −0.23 −0.10 −0.19 −0.68** 0.05 −0.33** −0.32** 0.43** 0.44**
Boll −0.14 0.04 −0.17 −0.61** 0.15 −0.21 −0.40** 0.42** 0.41**
10 Flower −0.26* 0.05 −0.30* −0.67** 0.13 −0.29* −0.29* 0.40** 0.48**
Boll −0.14 0.13 −0.22 −0.58** 0.22 −0.17 −0.36** 0.46** 0.41**
11 Flower −0.20 0.10 −0.27* −0.62** 0.21 −0.19 −0.29* 0.42** 0.44**
Boll −0.04 0.22 −0.16 −0.53** 0.27* −0.04 −0.38** 0.45** 0.36**
12 Flower −0.17 0.16 −0.26* −0.62** 0.29* −0.15 −0.40** 0.44** 0.45**
Boll 0.00 0.25* −0.13 −0.51** 0.35** −0.04 −0.45** 0.40** 0.30*
13 Flower −0.13 0.16 −0.22 −0.62** 0.23 −0.12 −0.42** 0.43** 0.45**
Boll 0.00 0.22 −0.11 −0.51** 0.30* −0.03 −0.49** 0.41** 0.33**
14 Flower −0.08 0.18 −0.18 −0.56** 0.21 −0.15 −0.44** 0.41** 0.46**
Boll 0.01 0.21 −0.10 −0.47** 0.26* −0.09 −0.49** 0.42** 0.33**
15 Flower −0.08 0.22 −0.21 −0.51** 0.24* −0.22 −0.42** 0.39** 0.38**
Boll −0.03 0.19 −0.13 −0.45** 0.24* −0.17 −0.44** 0.43** 0.30*

Page 22 of 35
Sawan, Cogent Biology (2017), 3: 1292882http://dx.doi.org/10.1080/23312025.2017.1292882
Table 12. Simple correlation coefficients (r) between climatic factorsa and number of flower and harvested bolls in initial time (0) and each of the 15-day periods before flowering in the second season (II)
Note: 0 = Initial time.Source: Sawan et al. (2005).aWind speed did not show significant effect upon the studied production variables, so it is not reported.bDiurnal temperature range.*Significant at 5% level.**Significant at 1% level.
Climate period
Air Temp. (°C) Evap (mm d−1)
Surface soil Temp. (°C)
Sunshine duration
(h d−1)
Humidity (%)
Max. (X1)
Min. (X2)
Max.−Min. (X3)b
(X4) 06:00 h (X5)
18:00 h (X6)
(X7) Max. (X8)
Min. (X9)
0 Flower −0.42** 0.00 −0.36** −0.61** −0.14 −0.37** −0.37** 0.01 0.45**
Boll −0.42** 0.02 −0.37** −0.59** −0.13 −0.36** −0.36** 0.01 0.46**
1 Flower −0.42** 0.10 −0.42** −0.63** −0.08 −0.29* −0.41** 0.05 0.48**
Boll −0.41** 0.11 −0.42** −0.62** −0.07 −0.28* −0.41** 0.05 0.47**
2 Flower −0.40** 0.08 −0.43** −0.65** −0.09 −0.27* −0.39** 0.02 0.49**
Boll −0.40** 0.08 −0.43** −0.64** −0.08 −0.26* −0.40** 0.03 0.49**
3 Flower −0.38** 0.13 −0.43** −0.61** −0.06 −0.17 −0.38** 0.00 0.45**
Boll −0.37** 0.15 −0.44** −0.61** −0.05 −0.15 −0.38** 0.01 0.46**
4 Flower −0.36** 0.17 −0.41** −0.61** −0.04 −0.18 −0.38** 0.02 0.45**
Boll −0.35** 0.18 −0.41** −0.60** −0.03 −0.16 −0.36** 0.03 0.44**
5 Flower −0.30* 0.13 −0.36** −0.60** −0.07 −0.23 −0.32** −0.05 0.43**
Boll −0.28* 0.15 −0.35** −0.58** −0.05 −0.21 −0.31** −0.05 0.41**
6 Flower −0.24 0.21 −0.38** −0.61** −0.02 −0.12 −0.28* 0.02 0.40**
Boll −0.22 0.24 −0.38** −0.59** 0.00 −0.07 −0.29* 0.02 0.40**
7 Flower −0.19 0.23 −0.29* −0.54** −0.03 −0.05 −0.26* −0.04 0.32**
Boll −0.18 0.23 −0.27* −0.53** −0.02 −0.03 −0.27* −0.04 0.30*
8 Flower −0.15 0.24 −0.25* −0.52** −0.03 −0.07 −0.24* −0.05 0.28*
Boll −0.14 0.22 −0.22 −0.51** −0.03 −0.06 −0.22* −0.05 0.26*
9 Flower −0.16 0.34** −0.32** −0.56** 0.08 −0.02 −0.25* 0.05 0.30*
Boll −0.14 0.34** −0.31** −0.56** 0.09 −0.01 −0.23* 0.07 0.29*
10 Flower −0.16 0.31** −0.30* −0.56** 0.11 −0.06 −0.27* 0.11 0.33**
Boll −0.14 0.28* −0.27* −0.55** 0.09 −0.07 −0.25* 0.09 0.31**
11 Flower −0.16 0.31** −0.27* −0.55** 0.10 −0.02 −0.31** 0.08 0.32**
Boll −0.15 0.29* −0.26* −0.53** 0.10 0.00 −0.29* 0.08 0.29*
12 Flower −0.17 0.44** −0.37** −0.57** 0.26* 0.02 −0.36** 0.17 0.34**
Boll −0.17 0.42** −0.36** −0.55** 0.25* 0.01 −0.34** 0.16 0.32**
13 Flower −0.14 0.40** −0.33** −0.56** 0.21 0.03 −0.28* 0.10 0.34**
Boll −0.15 0.38** −0.34** −0.56** 0.21 0.01 −0.27* 0.09 0.33**
14 Flower −0.19 0.39** −0.38** −0.59** 0.25* 0.04 −0.34** 0.16 0.35**
Boll −0.20 0.39** −0.40** −0.59** 0.26* 0.03 −0.36** 0.17 0.36**
15 Flower −0.24 0.49** −0.45** −0.62** 0.37** 0.16 −0.38** 0.27* 0.42**
Boll −0.24 0.51** −0.48** −0.63** 0.40** 0.15 −0.40** 0.26* 0.43**

Page 23 of 35
Sawan, Cogent Biology (2017), 3: 1292882http://dx.doi.org/10.1080/23312025.2017.1292882
18:00 h showed negative and significant correlations with both production variables only during the first and second day periods before flowering. Daily maximum humidity showed insignificant corre-lation with both flower and boll production except for one day period only (the 15th day). Generally, the results in the two seasons indicated that daily evaporation, sunshine duration and minimum humidity were the most effective and consistent climatic factors, which exhibited significant rela-tionships with the production variables for all the 15 day periods before anthesis in both seasons (Sawan et al., 2005).
The factors in this study which had been found to be associated with boll development are the climatic factors that would influence water loss between plant and atmosphere (low evaporation demand, high humidity, and shorter solar duration). This can lead to direct effects on the fruiting forms themselves and inhibitory effects on mid-afternoon photosynthetic rates even under well-watered conditions. Boyer, Johnson, and Saupe (1980) found that soybean plants with ample water supplies can experience water deficits due to high transpiration rates. Also, Human, Du Toit, Bezuidenhout, and De Bruyn (1990) stated that, when sunflower plants were grown under controlled temperature regimes, water stress during budding, anthesis and seed filling, the CO2 uptake rate per unit leaf area as well as total uptake rate per plant, significantly diminished with stress, while this effect resulted in a significant decrease in yield per plant.
2. The correlation between climatic factors and boll production and boll retention over a period of 15 day periods after flowering (boll setting) day (Tables 13 and 14) (Sawan et al., 2005) revealed the following:
First season
Daily evaporation showed significant negative correlation with number of bolls for all the 15 day periods after flowering (Table 13). Meanwhile its relationship with retention ratio was positive and significant in the 9–15 day periods after flowering. Daily sunshine duration was positively and signifi-cantly correlated with boll retention ratio during the 5–13 day periods after flowering. Daily maxi-mum humidity had a significant positive correlation with the number of bolls during the first 8 day periods after flowering, while daily minimum humidity had the same correlation for only the 11, and 12 day periods after flowering. Daily maximum and minimum temperatures and the diurnal tem-perature range, as well as soil surface temperature at 18:00 did not show significant relationships with both number of bolls and retention ratio. Daily soil surface temperature at 06:00 h had a signifi-cant negative correlation with boll retention ratio during the 3–7 day periods after anthesis.
Second season
Daily evaporation, soil surface temperature at 18:00 h, and sunshine duration had a significant negative correlation with number of bolls in all the 15 day periods after anthesis (Table 14) (Sawan et al., 2005). Daily maximum and minimum temperatures and the diurnal temperature range, and soil surface temperature at 06:00 h had a negative correlation with boll production. Their significant effects were observed during the 1, and 10–15 day periods for maximum temperature, and the 1–5, and 9–12 day periods for the diurnal temperatures range. Meanwhile, the daily minimum tempera-ture and soil surface temperature at 06:00 h had a significant negative correlation only during the 13–15 day periods. Daily minimum humidity had a significant positive correlation with number of bolls during the first 5 day periods, and the 9–15 day periods after anthesis. Daily maximum humid-ity showed no significant relation to number of bolls produced, and further no significant relation was observed between any of the studied climatic factors and boll retention ratio.
The results in the two seasons indicated that evaporation and humidity, followed by sunshine duration had obvious correlation with boll production. From the results obtained, it appeared that the effects of air temperature, and soil surface temperature tended to be masked in the first season, i.e. did not show any significant effects in the first season on the number of bolls per plant. However,
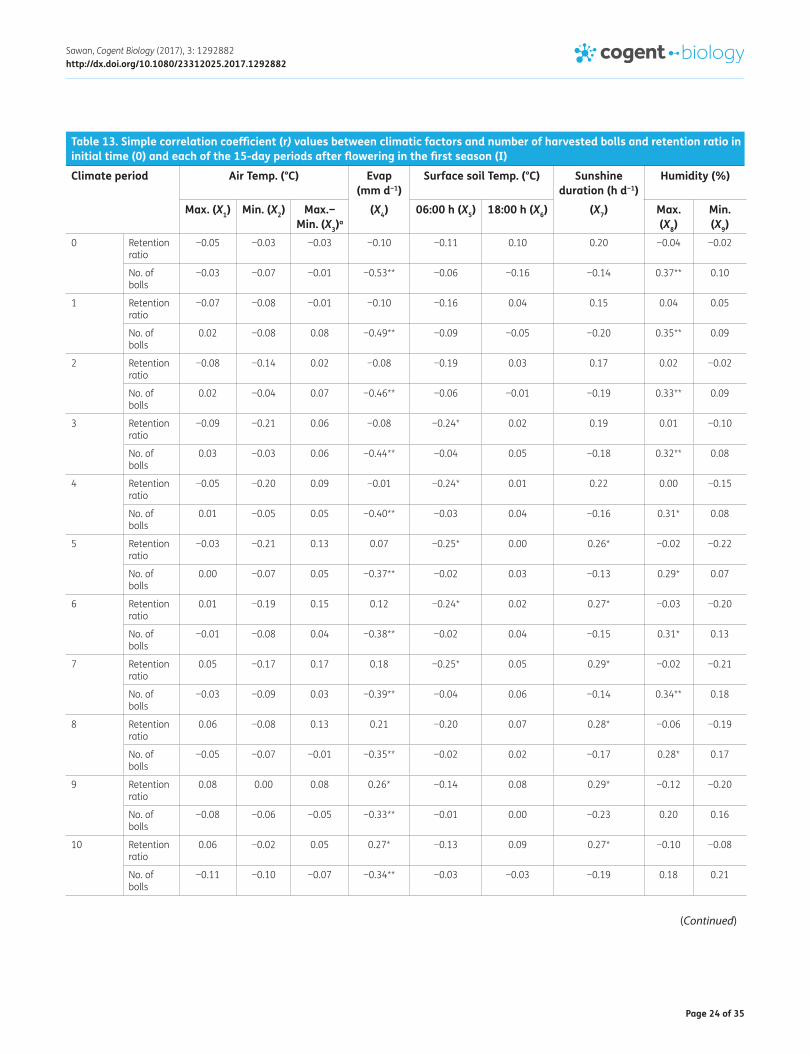
Page 24 of 35
Sawan, Cogent Biology (2017), 3: 1292882http://dx.doi.org/10.1080/23312025.2017.1292882
Table 13. Simple correlation coefficient (r) values between climatic factors and number of harvested bolls and retention ratio in initial time (0) and each of the 15-day periods after flowering in the first season (I)Climate period Air Temp. (°C) Evap
(mm d−1)Surface soil Temp. (°C) Sunshine
duration (h d−1)Humidity (%)
Max. (X1) Min. (X2) Max.−Min. (X3)a
(X4) 06:00 h (X5) 18:00 h (X6) (X7) Max. (X8)
Min. (X9)
0 Retention ratio
−0.05 −0.03 −0.03 −0.10 −0.11 0.10 0.20 −0.04 −0.02
No. of bolls
−0.03 −0.07 −0.01 −0.53** −0.06 −0.16 −0.14 0.37** 0.10
1 Retention ratio
−0.07 −0.08 −0.01 −0.10 −0.16 0.04 0.15 0.04 0.05
No. of bolls
0.02 −0.08 0.08 −0.49** −0.09 −0.05 −0.20 0.35** 0.09
2 Retention ratio
−0.08 −0.14 0.02 −0.08 −0.19 0.03 0.17 0.02 −0.02
No. of bolls
0.02 −0.04 0.07 −0.46** −0.06 −0.01 −0.19 0.33** 0.09
3 Retention ratio
−0.09 −0.21 0.06 −0.08 −0.24* 0.02 0.19 0.01 −0.10
No. of bolls
0.03 −0.03 0.06 −0.44** −0.04 0.05 −0.18 0.32** 0.08
4 Retention ratio
−0.05 −0.20 0.09 −0.01 −0.24* 0.01 0.22 0.00 −0.15
No. of bolls
0.01 −0.05 0.05 −0.40** −0.03 0.04 −0.16 0.31* 0.08
5 Retention ratio
−0.03 −0.21 0.13 0.07 −0.25* 0.00 0.26* −0.02 −0.22
No. of bolls
0.00 −0.07 0.05 −0.37** −0.02 0.03 −0.13 0.29* 0.07
6 Retention ratio
0.01 −0.19 0.15 0.12 −0.24* 0.02 0.27* −0.03 −0.20
No. of bolls
−0.01 −0.08 0.04 −0.38** −0.02 0.04 −0.15 0.31* 0.13
7 Retention ratio
0.05 −0.17 0.17 0.18 −0.25* 0.05 0.29* −0.02 −0.21
No. of bolls
−0.03 −0.09 0.03 −0.39** −0.04 0.06 −0.14 0.34** 0.18
8 Retention ratio
0.06 −0.08 0.13 0.21 −0.20 0.07 0.28* −0.06 −0.19
No. of bolls
−0.05 −0.07 −0.01 −0.35** −0.02 0.02 −0.17 0.28* 0.17
9 Retention ratio
0.08 0.00 0.08 0.26* −0.14 0.08 0.29* −0.12 −0.20
No. of bolls
−0.08 −0.06 −0.05 −0.33** −0.01 0.00 −0.23 0.20 0.16
10 Retention ratio
0.06 −0.02 0.05 0.27* −0.13 0.09 0.27* −0.10 −0.08
No. of bolls
−0.11 −0.10 −0.07 −0.34** −0.03 −0.03 −0.19 0.18 0.21
(Continued)

Page 25 of 35
Sawan, Cogent Biology (2017), 3: 1292882http://dx.doi.org/10.1080/23312025.2017.1292882
these effects were found to be significant in the second season. These seasonal differences in the impacts of the previously mentioned climatic factors on the number of bolls per plant are most likely ascribed to the sensible variation in evaporation values in the two studied seasons where their means were 10.2 mm d−1 and 5.9 mm d−1 in the first and second seasons, respectively (Sawan et al., 2005).
There is an important question here concerning, if there is a way for forecasting when evaporation values would mask the effect of the previous climatic factors. The answer would be possibly achieved through relating humidity values to evaporation values which are naturally liable to some fluctua-tions from one season to another (Sawan et al., 2005). It was found that the ratio between the mean of maximum humidity and the mean of evaporation in the first season was 85.8/10.2 = 8.37, while in the second season this ratio was 12.4. On the other hand, the ratio between the mean minimum humidity and the mean of evaporation in the first season was 30.8/10.2 = 3.02, while in the second season this ratio was 6.75 (Table 13) (Sawan et al., 2005). From these ratios it seems that minimum humidity which is closely related to evaporation is more sensitive than the ratio between maximum humidity and evaporation. It can be seen from the results and formulas that when the ratio between minimum humidity and evaporation is small (3:1), the effects of air temperature, and soil surface temperature were hindered by the effect of evaporation, i.e. the effect of these climatic factors were not significant. However, when this ratio is high (6:1), the effects of these factors were found to be significant. Accordingly, it could be generally stated that the effects of air, and soil surface
Climate period Air Temp. (°C) Evap (mm d−1)
Surface soil Temp. (°C) Sunshine duration (h d−1)
Humidity (%)
Max. (X1) Min. (X2) Max.−Min. (X3)a
(X4) 06:00 h (X5) 18:00 h (X6) (X7) Max. (X8)
Min. (X9)
11 Retention ratio
0.04 −0.04 0.08 0.28* −0.12 0.08 0.26* −0.09 −0.05
No. of bolls
−0.18 −0.18 −0.06 −0.37** −0.10 −0.04 −0.14 0.15 0.28*
12 Retention ratio
0.02 0.01 −0.08 0.32** −0.05 0.05 0.25* −0.08 −0.03
No. of bolls
−0.17 −0.13 −0.08 −0.32** −0.06 −0.07 −0.11 0.16 0.24*
13 Retention ratio
−0.04 0.04 −0.09 0.38** 0.00 0.01 0.27* −0.09 −0.02
No. of bolls
−0.15 −0.09 −0.09 −0.29* −0.03 −0.10 −0.08 0.18 0.20
14 Retention ratio
−0.07 0.04 −0.13 0.34** 0.06 −0.02 0.18 −0.08 −0.01
No. of bolls
−0.15 −0.10 −0.10 −0.28* −0.01 −0.10 −0.15 0.17 0.17
15 Retention ratio
−0.13 0.03 −0.18 0.33** 0.09 −0.04 0.06 −0.07 0.00
No. of bolls
−0.16 −0.10 −0.11 −0.28* 0.00 −0.11 −0.13 0.17 0.15
Table 13. (Continued)
Notes: 0 = Initial time; Retention ratio = (the number of retained bolls obtained from the total number of each daily tagged flowers in all selected plants at harvest/each daily number of tagged flowers in all selected plants) x 100.
Source: Sawan et al. (2005).aDiurnal temperature range.*Levels of significance at 5%.**Levels of significance at 1%.

Page 26 of 35
Sawan, Cogent Biology (2017), 3: 1292882http://dx.doi.org/10.1080/23312025.2017.1292882Ta
ble
14. S
impl
e co
rrel
atio
n co
effici
ent (
r) v
alue
s bet
wee
n cl
imat
ic fa
ctor
sa and
num
ber o
f har
vest
ed b
olls
and
rete
ntio
n ra
tio in
initi
al ti
me
(0) a
nd e
ach
of th
e 15
-da
y pe
riods
aft
er fl
ower
ing
in th
e se
cond
seas
on (I
I)
Not
es: 0
= In
itial
tim
e; R
eten
tion
ratio
= (t
he n
umbe
r of r
etai
ned
bolls
obt
aine
d fro
m th
e to
tal n
umbe
r of e
ach
daily
tagg
ed fl
ower
s in
all
sele
cted
pla
nts
at h
arve
st/e
ach
daily
num
ber o
f tag
ged
flow
ers
in
all s
elec
ted
plan
ts) x
100
.So
urce
: Saw
an e
t al.
(200
5).
a Win
d sp
eed
did
not s
how
sig
nific
ant e
ffect
upo
n th
e st
udie
d pr
oduc
tion
varia
bles
, so
it is
not
repo
rted
.b D
iurn
al te
mpe
ratu
re ra
nge.
*Lev
el o
f sig
nific
ance
at 5
%.
**Le
vel o
f sig
nific
ance
at 1
%.
Clim
ate
perio
dAi
r Tem
p. (°
C)Ev
ap (m
m d
−1)
Surf
ace
soil
Tem
p. (°
C)Su
nshi
ne
dura
tion
(h d
−1)
Hum
idity
(%)
Max
. (X 1)
Min
. (X 2)
Max
.−M
in.
(X3)b
(X4)
06:0
0 h
(X5)
18:0
0 h
(X6)
(X7)
Max
. (X 8)
Min
. (X 9)
0Re
tent
ion
ratio
−0.0
40.
20−0
.31*
−0.1
40.
12−0
.20
0.01
−0.0
40.
17No
. of b
olls
−0.4
2**
0.02
−0.3
7**
−0.5
9**
−0.1
3−0
.36*
*−0
.36*
*0.
010.
46**
1Re
tent
ion
ratio
−0.1
0−0
.03
−0.2
2−0
.21
−0.1
5−0
.05
−0.0
4−0
.02
0.23
No. o
f bol
ls−0
.25*
−0.0
1−0
.36*
*−0
.63*
*−0
.15
−0.3
0*−0
.25*
0.06
0.44
**2
Rete
ntio
n ra
tio−0
.15
−0.0
6−0
.10
−0.1
5−0
.08
−0.2
1−0
.01
−0.0
40.
12No
. of b
olls
−0.1
8−0
.01
−0.3
4**
−0.6
5**
−0.1
1−0
.25*
−0.3
2*0.
130.
43**
3Re
tent
ion
ratio
−0.0
3−0
.01
−0.0
2−0
.21
−0.0
1−0
.17
−0.0
80.
090.
12No
. of b
olls
−0.1
5−0
.06
−0.3
0*−0
.62*
*−0
.05
−0.2
8*−0
.31*
0.14
0.33
**4
Rete
ntio
n ra
tio0.
08−0
.02
0.07
−0.0
9−0
.03
−0.0
9−0
.10
0.05
−0.0
4No
. of b
olls
−0.1
5−0
.05
−0.2
8*−0
.63*
*−0
.06
−0.2
5*−0
.33*
*0.
150.
32*
5Re
tent
ion
ratio
0.23
−0.0
30.
12−0
.06
−0.0
6−0
.01
−0.1
10.
01−0
.16
No. o
f bol
ls−0
.14
−0.0
5−0
.25*
−0.6
2**
−0.0
6−0
.24*
−0.3
5**
0.15
0.31
*6
Rete
ntio
n ra
tio0.
09−0
.08
0.12
−0.0
9−0
.07
−0.0
1−0
.09
0.00
−0.0
5No
. of b
olls
−0.1
5−0
.04
−0.2
2−0
.61*
*−0
.08
−0.2
5*−0
.34*
*0.
130.
227
Rete
ntio
n ra
tio−0
.03
−0.1
20.
12−0
.10
−0.1
1−0
.01
−0.0
4−0
.03
0.02
No. o
f bol
ls−0
.15
−0.0
2−0
.19
−0.6
0**
−0.1
0−0
.29*
−0.3
2*0.
100.
188
Rete
ntio
n ra
tio−0
.02
0.05
0.03
−0.1
0−0
.04
−0.0
3−0
.02
−0.0
10.
01No
. of b
olls
−0.2
0−0
.03
−0.2
3−0
.61*
*−0
.10
−0.2
8*−0
.32*
0.19
0.22
9Re
tent
ion
ratio
−0.0
20.
13−0
.05
−0.1
00.
08−0
.05
−0.0
10.
030.
00No
. of b
olls
−0.2
4−0
.04
−0.2
9*−0
.62*
*−0
.11
−0.3
0*−0
.33*
*0.
130.
27*
10Re
tent
ion
ratio
−0.0
40.
12−0
.08
−0.0
90.
050.
11−0
.02
0.04
0.02
No. o
f bol
ls−0
.27*
−0.0
7−0
.30*
−0.6
0**
−0.1
6−0
.34*
*−0
.34*
*0.
110.
26*
11Re
tent
ion
ratio
−0.0
70.
10−0
.10
−0.0
80.
030.
20−0
.03
0.05
0.04
No. o
f bol
ls−0
.30*
−0.1
2−0
.30*
−0.6
1**
−0.1
8−0
.39*
*−0
.36*
*0.
100.
27*
12Re
tent
ion
ratio
−0.1
10.
09−0
.14
−0.1
10.
040.
13−0
.08
0.11
0.09
No. o
f bol
ls
−0.3
2*−0
.19
−0.2
6*−0
.60*
*−0
.22
−0.4
2**
−0.3
7**
0.09
0.27
*13
Re
tent
ion
ratio
−0.1
40.
09−0
.17
−0.1
80.
06−0
.06
−0.1
40.
160.
12No
. of b
olls
−0.3
3**
−0.2
6*−0
.23
−0.5
9**
−0.2
8*−0
.48*
*−0
.39*
*0.
080.
27*
14Re
tent
ion
ratio
−0.1
1−0
.04
−0.1
0−0
.13
−0.1
5−0
.05
−0.0
90.
010.
12No
. of b
olls
−0.3
4**
−0.3
2*−0
.21
−0.6
1**
−0.3
2*−0
.48*
*−0
.38*
*0.
060.
27*
15Re
tent
ion
ratio
−0.0
8−0
.11
0.02
−0.0
8−0
.22
−0.0
5−0
.02
−0.0
30.
12No
. of b
olls
−0.3
5**
−0.3
7**
−0.1
8−0
.61*
*−0
.38*
*−0
.48*
*−0
.37*
*0.
030.
27*

Page 27 of 35
Sawan, Cogent Biology (2017), 3: 1292882http://dx.doi.org/10.1080/23312025.2017.1292882
temperatures could be masked by evaporation when the ratio between minimum humidity and evaporation is less than 4:1 (Sawan et al., 2005).
Evaporation appeared to be the most important climatic factor (in each of the 15-day periods both prior to and after initiation of individual bolls) affecting number of flowers or harvested bolls in Egyptian cotton. High daily evaporation rates could result in water stress that would slow growth and increase shedding rate of flowers and bolls. The second most important climatic factor in our study was humidity. Effect of maximum humidity varied markedly from the first season to the sec-ond one, where it was significantly correlated with the dependent variables in the first season, while the inverse pattern was true in the second season. This diverse effect may be due to the differences in the values of this factor in the two seasons; where it was on average 87% in the first season, and only 73% in the second season (Table 10) (Sawan et al., 2005). Also, it was found that, when the average value of minimum humidity exceeded the half average value of maximum humidity, the minimum humidity can substitute the maximum humidity on affecting number of flowers or har-vested bolls. In the first season (Table 10) the average value of minimum humidity was less than half of the value of maximum humidity (30.2/85.6 = 0.35), while in the second season it was higher than half of maximum humidity (39.1/72.9 = 0.54).
The third most important climatic factor in our study was sunshine duration, which showed a significant negative relationship with boll production. The r values of (Tables 11–14) (Sawan et al., 2005) indicated that the relationship between the dependent and independent variables preceding flowering (production stage) generally exceeded in value the relationship between them during the entire and late periods of production stage. In fact, understanding the effects of climatic factors on cotton production during the previously mentioned periods would have marked consequences on the overall level of cotton production, which could be predictable depending on those relationships.
3.4.2. Regression modelsAn attempt was carried out to investigate the effect of climatic factors on cotton production via prediction equations including the important climatic factors responsible for the majority of total variability in cotton flower and boll production. Hence, regression models were established using the stepwise multiple regression technique to express the relationship between each of the number of flowers and bolls/plant and boll retention ratio (Y), with the climatic factors, for each of the (a) 5, (b) 10, and (c) 15 day periods either prior to or after initiation of individual bolls (Tables 15 and 16) (Sawan et al., 2005).
Concerning the effect of prior days the results indicated that evaporation, sunshine duration, and the diurnal temperature range were the most effective and consistent climatic factors affecting cot-ton flower and boll production (Table 15). The fourth effective climatic factor in this respect was minimum humidity. On the other hand, for the periods after flower the results obtained from the equations (Table 16) indicated that evaporation was the most effective and consistent climatic fac-tor affecting number of harvested bolls.
Regression models obtained demonstrate of each independent variable under study as an efficient and important factor (Sawan et al., 2005). Meanwhile, they explained a sensible proportion of the variation in flower and boll production, as indicated by their R2, which ranged between 0.14 and 0.62, where most of R2 prior to flower opening were about 0.50 and after flowering all but one are less than 0.50. These results agree with Miller et al. (1996) in their regression study of the relation of yield with rainfall and temperature. They suggested that the other 0.50 of variation related to management practices, which can be the same in this study. Also, the regression models indicated that the rela-tionships between the number of flowers and bolls per plant and the studied climatic factors for the 15 day period before or after flowering (Y3) in each season explained the highly significant magnitude of variation (p < 0.05). The R2 values for the 15 day periods before and after flowering were higher than most of those obtained for each of the 5 and the 10 day periods before or after flowering. This clarifies that the effects of the climatic factors during the 15 day periods before or after flowering are
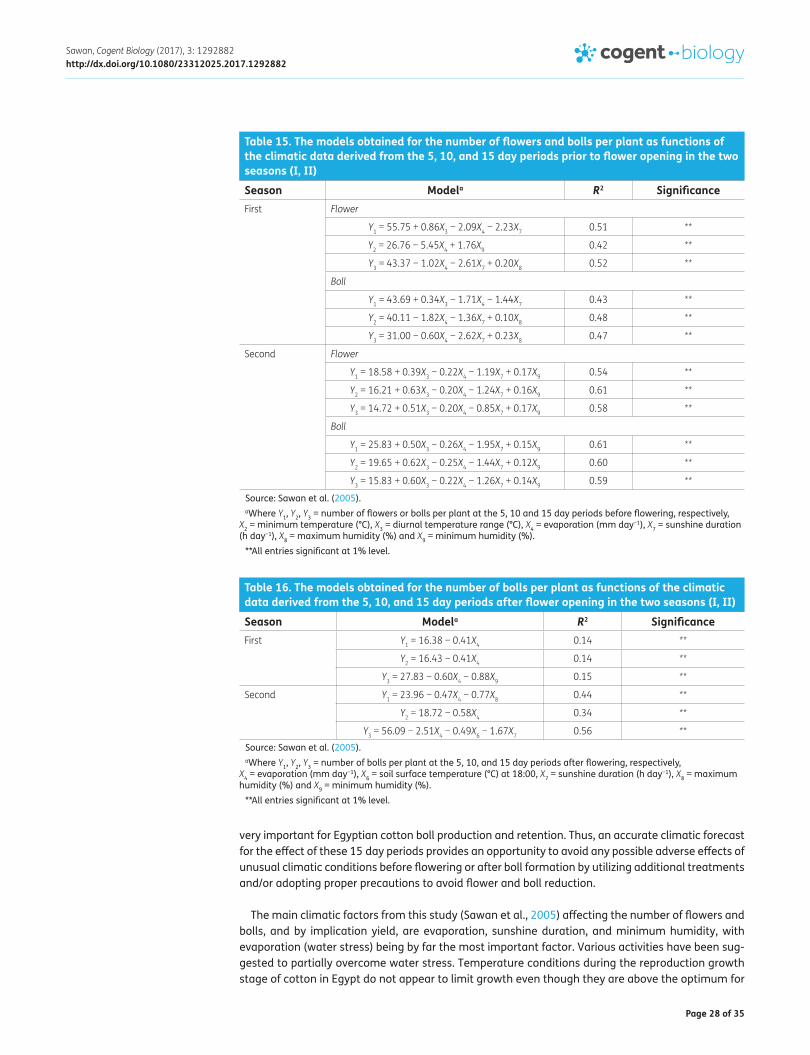
Page 28 of 35
Sawan, Cogent Biology (2017), 3: 1292882http://dx.doi.org/10.1080/23312025.2017.1292882
very important for Egyptian cotton boll production and retention. Thus, an accurate climatic forecast for the effect of these 15 day periods provides an opportunity to avoid any possible adverse effects of unusual climatic conditions before flowering or after boll formation by utilizing additional treatments and/or adopting proper precautions to avoid flower and boll reduction.
The main climatic factors from this study (Sawan et al., 2005) affecting the number of flowers and bolls, and by implication yield, are evaporation, sunshine duration, and minimum humidity, with evaporation (water stress) being by far the most important factor. Various activities have been sug-gested to partially overcome water stress. Temperature conditions during the reproduction growth stage of cotton in Egypt do not appear to limit growth even though they are above the optimum for
Table 15. The models obtained for the number of flowers and bolls per plant as functions of the climatic data derived from the 5, 10, and 15 day periods prior to flower opening in the two seasons (I, II)
Source: Sawan et al. (2005).aWhere Y1, Y2, Y3 = number of flowers or bolls per plant at the 5, 10 and 15 day periods before flowering, respectively,
X2 = minimum temperature (°C), X3 = diurnal temperature range (°C), X4 = evaporation (mm day−1), X7 = sunshine duration (h day−1), X8 = maximum humidity (%) and X9 = minimum humidity (%).
**All entries significant at 1% level.
Season Modela R2 SignificanceFirst Flower
Y1 = 55.75 + 0.86X3 − 2.09X4 − 2.23X7 0.51 **
Y2 = 26.76 − 5.45X4 + 1.76X9 0.42 **
Y3 = 43.37 − 1.02X4 − 2.61X7 + 0.20X8 0.52 **
Boll
Y1 = 43.69 + 0.34X3 − 1.71X4 − 1.44X7 0.43 **
Y2 = 40.11 − 1.82X4 − 1.36X7 + 0.10X8 0.48 **
Y3 = 31.00 − 0.60X4 − 2.62X7 + 0.23X8 0.47 **
Second Flower
Y1 = 18.58 + 0.39X3 − 0.22X4 − 1.19X7 + 0.17X9 0.54 **
Y2 = 16.21 + 0.63X3 − 0.20X4 − 1.24X7 + 0.16X9 0.61 **
Y3 = 14.72 + 0.51X3 − 0.20X4 − 0.85X7 + 0.17X9 0.58 **
Boll
Y1 = 25.83 + 0.50X3 − 0.26X4 − 1.95X7 + 0.15X9 0.61 **
Y2 = 19.65 + 0.62X3 − 0.25X4 − 1.44X7 + 0.12X9 0.60 **
Y3 = 15.83 + 0.60X3 − 0.22X4 − 1.26X7 + 0.14X9 0.59 **
Table 16. The models obtained for the number of bolls per plant as functions of the climatic data derived from the 5, 10, and 15 day periods after flower opening in the two seasons (I, II)
Source: Sawan et al. (2005).aWhere Y1, Y2, Y3 = number of bolls per plant at the 5, 10, and 15 day periods after flowering, respectively,
X4 = evaporation (mm day−1), X6 = soil surface temperature (°C) at 18:00, X7 = sunshine duration (h day−1), X8 = maximum humidity (%) and X9 = minimum humidity (%).
**All entries significant at 1% level.
Season Modela R2 SignificanceFirst Y1 = 16.38 − 0.41X4 0.14 **
Y2 = 16.43 − 0.41X4 0.14 **
Y3 = 27.83 − 0.60X4 − 0.88X9 0.15 **
Second Y1 = 23.96 − 0.47X4 − 0.77X8 0.44 **
Y2 = 18.72 − 0.58X4 0.34 **
Y3 = 56.09 − 2.51X4 − 0.49X6 − 1.67X7 0.56 **
Page 29 of 35
Sawan, Cogent Biology (2017), 3: 1292882http://dx.doi.org/10.1080/23312025.2017.1292882
cotton growth (Sawan, 2013). This is contradictory to the finding of Holaday, Haigler, Srinivas, Martin, and Taylor (1997). A possible reason for that contradiction is that the effects of evaporation rate and humidity were not taken into consideration in the research studies conducted by other researchers in other countries. The matter of fact is that temperature and evaporation are closely related to each other to such an extent that the higher evaporation rate could possible mask the effect of tempera-ture (Sawan, 2014a). Sunshine duration and minimum humidity appeared to have secondary effects, yet they are in fact important players. The importance of sunshine duration has been alluded to by Moseley et al. (1994) and Oosterhuis (1997). Also, Mergeai and Demol (1991) found that cotton yield was assisted by intermediate relative humidity.
3.5. Cotton (Gossypium barbadense) flower and boll production as affected by climatic factors and soil moisture status
3.5.1. Basic variables
A Dependant variables as defined above (Y1) and (Y2) (Sawan et al., 2010)
B Independent variables (Xs)
1 Irrigation on day 1 = 1. Otherwise, enter 0.0 (soil moisture status) (X1)
2 The first and second days after the day of irrigation (soil moisture status) = 1. Otherwise, enter 0.0 (X2)
3 The day prior to the day of irrigation (soil moisture status) to check for possible moisture deficiency on that day = 1. Otherwise, enter 0.0 (X3)
4 Number of days during days 1 (day of flowering)-12 (after flowering) that tem-perature equaled or exceeded 37.5°C (high temperature) (X4)
5 Range of temperature (diurnal temperature) (°C) on day 1 (day of flowering) (X5)
6 Broadest range of temperature (°C) over days 1 (day of flowering)-12 (after flow-ering) (X6)
7 Minimum relative humidity (minRH) (%) during day 1 (day of flowering) (X7)
8 Maximum relative humidity (maxRH) (%) during day 1 (day of flowering) (X8)
9 Minimum relative humidity (minRH) (%) during day 2 (after flowering) (X9)
10 Maximum relative humidity (maxRH) (%) during day 2 (after flowering) (X10)
11 Largest maximum relative humidity (maxRH) (%) on days 3–6 (after flowering) (X11)
12. Lowest minimum relative humidity (minRH) (%) on days 3–6 (after flowering) (X12)
13. Largest maximum relative humidity (maxRH) (%) on days 7–12 (after flowering) (X13)
14 Lowest minimum relative humidity (minRH) (%) on days 7–12 (after flowering) (X14)
15 Lowest minimum relative humidity (minRH) (%) on days 50–52 (after flowering) (X15)
16 Daily light period (hour) (X16)
3.5.2. Statistical analysisSimple correlation coefficients between the initial group of independent variables (climatic factors and soil moisture status) (X’s) and the corresponding dependent variables (Y’s) were computed for each season and the combined data of the two seasons. These correlation coefficients helped deter-mine the significant climatic factors and soil moisture status affecting the cotton production varia-bles. The level for significance was p ≤ 0.15. Those climatic factors and soil moisture status attaining a probability level of significance not exceeding 0.15 were deemed important (affecting the

Page 30 of 35
Sawan, Cogent Biology (2017), 3: 1292882http://dx.doi.org/10.1080/23312025.2017.1292882
dependent variables) (Sawan et al., 2010). Those factors were combined with dependent variables in multiple regression analysis to obtain a predictive model as described by Cady and Allen (1972). Multiple linear regression equations (using the stepwise method) comprising selected predictive variables were computed for the determined interval. Coefficients of multiple determinations (R2) were calculated to measure the efficiency of the regression models in explaining the variation in data. Correlation and regression analysis were computed according to Draper and Smith (1985) us-ing the procedures outlined in the general linear model (GLM) (SAS Institute 1985).
3.5.3. Correlation estimatesSimple correlation coefficients between the independent variables and the dependent variables for flower and boll production in each season and combined data of the two seasons are shown in Tables 17–19 (Sawan et al., 2010). The simple correlation values indicated clearly that relative hu-midity was the most important climatic factor. Relative humidity also had a significant positive rela-tionship with flower and boll production; except for lowest minRH on days 50–52 (after flowering). Flower and boll production were positively and highly correlated with the variables of largest maxRH (X11, X13) and lowest minRH (X14, X15) in the first season, minRH (X7, X9), largest maxRH (X11), and lowest minRH (X12, X14, X15) in the second season, and the combined data of the two seasons. Effect of maxRH varied markedly from the first to the second season. MaxRH was significantly correlated with the dependent variables in the first season, while the inverse pattern was true in the second season. This diverse effect may be best explained by the differences of 87% in the first season, and only 73% in the second season (Table 1). Also, when the average value of minRH exceeded the half average value of maxRH, the minRH can substitute for the maxRH on affecting number of flowers or har-vested bolls. In the first season (Table 1) the average value of minRH was less than half of the value of maxRH (30.2/85.6 = 0.35), while in the second season it was higher than half of maxRH
Table 17. Simple correlation coefficient (r) values between the independent variables and the dependent variables in the first season (I)
Source: Sawan et al. (2010).aSignificant at 1% probability level.bSignificant at 5% probability level.cSignificant at 10% probability level.dSignificant at 15% probability level.
Independent variables (Irrigation and climatic factors)
Dependent variables (First season)Flowers Bolls
(X1) Irrigation on day 1 −0.1282 −0.0925
(X2) Irrigation on day 0 or −1 (1st and 2nd day after irrigation)
−0.1644 −0.1403
(X3) 1 is for the day prior to irrigation −0.0891 −0.0897
(X4) Number of days that temperature equaled or exceeded 37.5°C
0.1258 0.1525
(X5) Range of temperature (°C) on day 1 −0.0270 −0.0205
(X6) Broadest range of temperature (°C) over days 1 −12 0.0550 0.1788d
(X7) MinRH (%) during day 1 0.1492 0.1167
(X8) MaxRH (%) during day 1 0.2087c 0.1531
(X9) MinRH (%) during day 2 0.1079 0.1033
(X10) MaxRH (%) during day 2 0.1127 0.0455
(X11) Largest maxRH (%) on days 3–6 0.3905a 0.2819b
(X12) Lowest minRH (%) on days 3–6 0.0646 0.0444
(X13) Largest maxRH (%) on days 7–12 0.4499a 0.3554b
(X14) Lowest minRH (%) on days 7–12 0.3522a 0.1937d
(X15) Lowest minRH (%) on days 50–52 −0.3440a −0.4222a
(X16) Daily light period (hour) −0.2430b −0.1426

Page 31 of 35
Sawan, Cogent Biology (2017), 3: 1292882http://dx.doi.org/10.1080/23312025.2017.1292882
(39.1/72.9 = 0.54). Sunshine duration (X16) showed a significant negative relation with fruit produc-tion in the first and second seasons and the combined data of the two seasons except for boll pro-duction in the first season, which was not significant. Flower and boll production were negatively correlated in the second season and the combined data of the two seasons with the number of days during days 1–12 that temperature equaled or exceeded 37.5°C (X4), range of temperature (diurnal temperature) on flowering day (X5) and broadest range of temperature over days 1–12 (X6). The soil moisture status showed low and insignificant correlation with flower and boll production. The posi-tive relationship between relative humidity with flower and boll production means that low relative humidity rate reduces significantly cotton flower and boll production. This may be due to greater plant water deficits when relative humidity decreases. Also, the negative relationship between the variables of maximum temperature exceeding 37.5°C (X4), range of diurnal temperature on flower-ing (X5), and sunshine duration (X16) with flower and boll production revealed that the increased values of these factors had a detrimental effect upon Egyptian cotton fruit production. Results ob-tained from the production stage of each season, and the combined data of the two seasons showed marked variability in the relationships of some climatic variables with the dependent variables. This may be best explained by the differences between climatic factors in the two seasons as illustrated by the ranges and means shown in Table 1. For example, maximum temperature exceeding 37.5°C (X4) and minRH did not show significant relations in the first season, while that trend differed in the second season. These results indicated that relative humidity was the most effective and consistent climatic factor affecting boll production. The second most important climatic factor in our study was sunshine duration, which showed a significant negative relationship with boll production.
Table 18. Simple correlation coefficient (r) values between the independent variables and the dependent variables in the second season (II)
Source: Sawan et al. (2010).aSignificant at 1% probability level.bSignificant at 5% probability level.cSignificant at 10% probability level.
Independent variables (Irrigation and climatic factors)
Dependent variables (Second season)Flowers Bolls
(X1) Irrigation on day 1 −0.0536 −0.0467
(X2) Irrigation on day 0 or −1 −0.1116 −0.1208
(X3) 1 is for the day prior to the day of irrigation −0.0929 −0.0927
(X4) Number of days that temperature equaled or exceeded 37.5°C
−0.4192a −0.3981a
(X5) Range of temperature (°C) on day 1 −0.3779a −0.3858a
(X6) Broadest range of temperature (°C) over days 1–12
−0.3849a −0.3841a
(X7) MinRH (%) during day 1 0.4522a 0.4665a
(X8) MaxRH (%) during day 1 0.0083 0.0054
(X9) MinRH (%) during day 2 0.4315a 0.4374a
(X10) MaxRH (%) during day 2 0.0605 0.0532
(X11) Largest maxRH (%) on days 3–6 0.2486c 0.2520b
(X12) Lowest minRH (%) on days 3–6 0.5783a 0.5677a
(X13) Largest maxRH (%) on days 7–12 0.0617 0.0735
(X14) Lowest minRH (%) on days 7–12 0.4887a 0.4691a
(X15) Lowest minRH (%) on days 50–52 −0.6246a −0.6113a
(X16) Daily light period (hour) −0.3677a −0.3609a
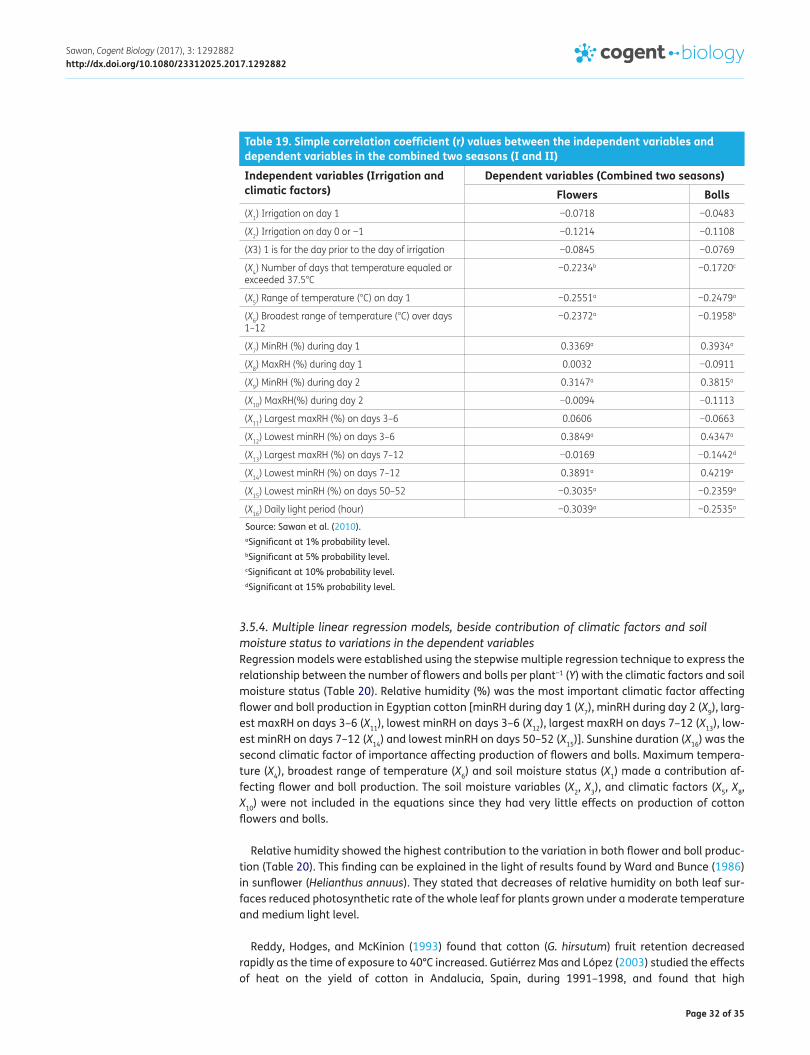
Page 32 of 35
Sawan, Cogent Biology (2017), 3: 1292882http://dx.doi.org/10.1080/23312025.2017.1292882
3.5.4. Multiple linear regression models, beside contribution of climatic factors and soil moisture status to variations in the dependent variablesRegression models were established using the stepwise multiple regression technique to express the relationship between the number of flowers and bolls per plant−1 (Y) with the climatic factors and soil moisture status (Table 20). Relative humidity (%) was the most important climatic factor affecting flower and boll production in Egyptian cotton [minRH during day 1 (X7), minRH during day 2 (X9), larg-est maxRH on days 3–6 (X11), lowest minRH on days 3–6 (X12), largest maxRH on days 7–12 (X13), low-est minRH on days 7–12 (X14) and lowest minRH on days 50–52 (X15)]. Sunshine duration (X16) was the second climatic factor of importance affecting production of flowers and bolls. Maximum tempera-ture (X4), broadest range of temperature (X6) and soil moisture status (X1) made a contribution af-fecting flower and boll production. The soil moisture variables (X2, X3), and climatic factors (X5, X8, X10) were not included in the equations since they had very little effects on production of cotton flowers and bolls.
Relative humidity showed the highest contribution to the variation in both flower and boll produc-tion (Table 20). This finding can be explained in the light of results found by Ward and Bunce (1986) in sunflower (Helianthus annuus). They stated that decreases of relative humidity on both leaf sur-faces reduced photosynthetic rate of the whole leaf for plants grown under a moderate temperature and medium light level.
Reddy, Hodges, and McKinion (1993) found that cotton (G. hirsutum) fruit retention decreased rapidly as the time of exposure to 40°C increased. Gutiérrez Mas and López (2003) studied the effects of heat on the yield of cotton in Andalucia, Spain, during 1991–1998, and found that high
Table 19. Simple correlation coefficient (r) values between the independent variables and dependent variables in the combined two seasons (I and II)
Source: Sawan et al. (2010).aSignificant at 1% probability level.bSignificant at 5% probability level.cSignificant at 10% probability level.dSignificant at 15% probability level.
Independent variables (Irrigation and climatic factors)
Dependent variables (Combined two seasons)Flowers Bolls
(X1) Irrigation on day 1 −0.0718 −0.0483
(X2) Irrigation on day 0 or −1 −0.1214 −0.1108
(X3) 1 is for the day prior to the day of irrigation −0.0845 −0.0769
(X4) Number of days that temperature equaled or exceeded 37.5°C
−0.2234b −0.1720c
(X5) Range of temperature (°C) on day 1 −0.2551a −0.2479a
(X6) Broadest range of temperature (°C) over days 1–12
−0.2372a −0.1958b
(X7) MinRH (%) during day 1 0.3369a 0.3934a
(X8) MaxRH (%) during day 1 0.0032 −0.0911
(X9) MinRH (%) during day 2 0.3147a 0.3815a
(X10) MaxRH(%) during day 2 −0.0094 −0.1113
(X11) Largest maxRH (%) on days 3–6 0.0606 −0.0663
(X12) Lowest minRH (%) on days 3–6 0.3849a 0.4347a
(X13) Largest maxRH (%) on days 7–12 −0.0169 −0.1442d
(X14) Lowest minRH (%) on days 7–12 0.3891a 0.4219a
(X15) Lowest minRH (%) on days 50–52 −0.3035a −0.2359a
(X16) Daily light period (hour) −0.3039a −0.2535a

Page 33 of 35
Sawan, Cogent Biology (2017), 3: 1292882http://dx.doi.org/10.1080/23312025.2017.1292882
temperatures were implicated in the reduction of unit production. There was a significant negative relationship between average production and number of days with temperatures greater than 40°C and the number of days with minimum temperatures greater than 20°C. Wise, Olson, Schrader, and Sharkey (2004) indicated that restrictions to photosynthesis could limit plant growth at high tem-perature in a variety of ways. In addition to increasing photorespiration, high temperatures (35–42°C) can cause direct injury to the photosynthetic apparatus. Both carbon metabolism and thylakoid reactions have been suggested as the primary site of injury at these temperatures.
Regression models obtained explained a sensible proportion of the variation in flower and boll production, as indicated by their R2, which ranged between 0.53 and 0.72. These results agree with Miller et al. (1996) in their regression study of the relation of yield with rainfall and temperature. They suggested that the other R2 0.50 of variation was related to management practices, which co-incide with the findings of this study. Thus, an accurate climatic forecast for the effect of the 5–7 day period during flowering may provide an opportunity to avoid possible adverse effects of unusual climatic conditions before flowering or after boll formation by utilizing additional treatments and/or adopting proper precautions to avoid flower and boll reduction (Sawan, 2013).
4. ConclusionsEvaporation, sunshine duration, relative humidity, surface soil temperature at 18:00 h, and maxi-mum temperature, were the most significant climatic factors affecting flower and boll production of Egyptian cotton. Also, it could be concluded that the fourth quarter period of the production stage is the most appropriate and usable production time to collect data for determining efficient prediction equations for cotton flower and boll production in Egypt, and making valuable recommendations. Further, it could be concluded that during the 15-day periods both prior to and after initiation of in-dividual bolls, evaporation, minimum relative humidity and sunshine duration, were the most signifi-cant climatic factors affecting cotton flower and boll production and retention in Egyptian cotton. The negative correlation between each of evaporation and sunshine duration with flower and boll formation along with the positive correlation between minimum relative humidity value and flower and boll production, indicate that low evaporation rate, short period of sunshine duration and high value of minimum humidity would enhance flower and boll formation. The five-day interval was found to give adequate and sensible relationships between climatic factors and cotton production growth under Egyptian conditions when compared with other intervals and daily observations. It
Table 20. Model obtained for cotton production variables as functions of climatic data and soil moisture status in individual and combined seasons
Notes: (Y1) Number of cotton flowers; (Y2) Number of cotton bolls; (X1) Irrigation on day 1; (X4) Number of that temperature equaled or exceeded 37.5°C; (X6) Broadest range of temperature (°C) over days 1–12; (X7) MinRH (%) during day 1; (X9) MinRH (%) during day 2; (X11) Largest maxRH (%) on days 3–6; (X12) Lowest minRH (%) on days 3–6; (X13) Largest maxRH (%) on days 7–12; (X14) Lowest minRH (%) on days 7–12; (X15) Lowest minRH (%) on days 50–52; (X16) Daily light period (hour).
All entries significant at 1% level.Source: Sawan et al. (2010).
Season Model R2
Season I (n = 68) Y1 = −557.54 + 6.35X6 + 0.65X7 + 1.92X11 + 4.17X13 + 2.88X14 − 1.90X15 − 5.63X16 0.63
Y2 = −453.93 + 6.53X6 + 0.61X7 + 1.80X11 + 2.47X13 + 1.87X14 − 1.85X15 0.53
Season II (n = 62) Y1 = −129.45 + 25.36X1 + 37.02X4 + 1.48X7 + 1.69X9 + 4.46X12 + 2.55X14 − 4.73X15 0.72
Y2 = −130.23 + 24.27X1 + 35.66X4 + 1.42X7 + 1.61X9 + 4.00X12 + 2.18X14 − 4.09X15 0.71
Combined data: I & II (n = 130)
Y1 = −557.36 + 6.82X6 + 1.44X7 + 0.75X9 + 2.04X11 + 2.55X12 + 2.01X13 + 3.27X14 − 2.15X15 0.57
Y2 = −322.17 + 6.41X6 + 1.20X7 + 0.69X9 + 1.81X11 + 2.12X12 + 2.35X14 − 2.16X15 0.53

Page 34 of 35
Sawan, Cogent Biology (2017), 3: 1292882http://dx.doi.org/10.1080/23312025.2017.1292882
may be concluded that the five-day accumulation of climatic data during the production stage, in the absence of sharp fluctuations in these factors, could be satisfactorily used to forecast adverse effects on cotton production and the application of appropriate production practices circumvent possible production shortage.
Finally, the early prediction of possible adverse effects of climatic factors might modify their effect on production of Egyptian cotton. Minimizing deleterious effects through the application of proper management practices, such as, adequate irrigation regime, and utilization of specific plant growth regulators could limit the negative effects of some climatic factors.
FundingThe author received no direct funding for this research.
Competing InterestsThe author declares no competing interest.
Author detailsZakaria M. Sawan1
E-mail: [email protected] Cotton Research Institute, Agricultural Research Center,
Ministry of Agriculture & Land Reclamation, 9 Gamaa Street, 12619 Giza, Egypt.
Citation informationCite this article as: Cotton production and climatic factors: Studying the nature of its relationship by different statistical methods, Zakaria M. Sawan, Cogent Biology (2017), 3: 1292882.
ReferencesBarbour, M. M., & Farquhar, G. D. (2000). Relative humidity and
ABA-induced variation in carbon and oxygen isotope ratios of cotton leaves. Plant, Cell and Environment, 23, 473–485. http://dx.doi.org/10.1046/j.1365-3040.2000.00575.x
Bhatt, J. G. (1977). Growth and flowering of cotton (Gossypium hirsutum L.) as affected by daylength and temperature. The Journal of Agricultural Science, 89, 583–588. http://dx.doi.org/10.1017/S0021859600061360
Boyer, J. S., Johnson, R. R., & Saupe, S. G. (1980). Afternoon water deficits and grain yields in old and new soybean cultivars. Agronomy Journal, 72, 981–986. http://dx.doi.org/10.2134/agronj1980.00021962007200060028x
Burke, J. J., Hatfield, J. L., & Wanjura, D. F. (1990). A thermal stress index for cotton. Agronomy Journal, 82, 526–530. http://dx.doi.org/10.2134/agronj1990.00021962008200030018x
Burke, J. J., Mahan, J. R., & Hatfield, J. L. (1988). Crop-specific thermal kinetic windows in relation to wheat and cotton biomass production. Agronomy Journal, 80, 553–556. http://dx.doi.org/10.2134/agronj1988.00021962008000040001x
Cady, F. B., & Allen, D. M. (1972). Combining experiments to predict future yield data. Agronomy Journal, 64, 211–214. http://dx.doi.org/10.2134/agronj1972.00021962006400020025x
Draper, N. R., & Smith, H. (1966). Applied regression analysis (407 pp). New York, NY: John Wiley & Sons
Ehrler, W. L. (1973). Cotton leaf temperatures as related to soil water depletion and meteorological factors. Agronomy Journal, 65, 404–409. http://dx.doi.org/10.2134/agronj1973.00021962006500030016x
El-Zik, K. M. (1980). The cotton plant - its growth and development (pp. 18–21). Western Cotton Production Conference Summary Proceedings, Fresno, CA.
Fisher, W. D. (1975). Heat induced sterility in Upland cotton (p. 85). Proc 27th Cotton Improvement Conf.
Guinn, G. (1982). Causes of square and boll shedding in cotton (USDA Technical Bulletin 1672). Washington, DC: USDA.
Gutiérrez Mas, J. C., & López, M. (2003). Heat, limitation of yields of cotton in Andalucia. Agricultura, Revista Agropecuaria, 72, 690–692.
Hearn, A. B., & Constable, G. A. (1984). Cotton. In R. Goldsworth & N. M. Fisher (Eds.), The Physiology of Tropical Food Crops (pp. 495–527). New York, NY: John Wiley & Sons.
Hodges, H. F., Reddy, K. R., McKinion, J. M., & Reddy, V. R. (1993). Temperature effects on cotton. (Bulletin Mississippi Agricultural and Forestry Experiment Station No. 990, p. 15).
Holaday, A. S., Haigler, C. H., Srinivas, N. G., Martin, L. K., & Taylor, J. G. (1997, January 6–10). Alterations of leaf photosynthesis and fiber cellulose synthesis by cool night temperatures. In Proceedings Beltwide cotton conferences (pp 1435–1436), New Orleans, LA. Memphis, TN: National Cotton Council.
Human, J. J., Du Toit, D., Bezuidenhout, H. D., & De Bruyn, L. P. (1990). The influence of plant water stress on net photosynthesis and yield of sunflower (Helianthus annuus L.). Journal of Agronomy and Crop Science, 164, 231–241. http://dx.doi.org/10.1111/j.1439-037X.1990.tb00812.x
Kaur, R., & Singh, O. S. (1992). Response of growth stages of cotton varieties to moisture stress. Indian Journal of Plant Physiology, 35, 182–185.
Meek, C. R., Oosterhuis, D. M., & Steger, A. T. (1999, January 3–7). Drought tolerance and foliar sprays of glycine betaine. In Proceedings Beltwide cotton conferences (pp. 559–561), Orlando, FL. Memphis, TN: National Cotton Council.
Mergeai, G., & Demol, J. (1991). Contribution to the study of the effect of various meteorological factors on production and quality of cotton (Gossypium hirsutum L.) fibers. Bulletin des Recherches Agronomiqued de Gembloux, 26, 113–124.
Miller, J. K., Krieg, D. R., & Paterson, R. E. (1996, January 9–12). Relationship between dryland cotton yields and weather parameters on the Southern Hig Plains. In Proceedings Beltwide cotton conferences (pp. 1165–1166), Nashville, TN. Memphis, TN: National Cotton Council.
Moseley, D., Landivar, J. A., & Locke, D. (1994, January 5–8). Evaluation of the effect of methanol on cotton growth and yield under dry-land and irrigated conditions. In Proceedings Beltwide cotton conferences (pp. 1293–1294), San Diego, CA. Memphis, TN: National Cotton Council.
Oosterhuis, D. M. (1997, February 13). Effect of temperature extremes on cotton yields in Arkansas. In D. M. Oosterhuis & J. M. Stewart (Eds.), Proceedings of the Cotton Research Meeting (pp. 94–98), Monticello, AR. Special Report-Agricultural Experiment Station, Division of Agriculture. No. 183: University of Arkansas.
Orgaz, F., Mateos, L., & Fereres, E. (1992). Season length and cultivar determine the optimum evapotranspiration deficit in cotton. Agronomy Journal, 84, 700–706. http://dx.doi.org/10.2134/agronj1992.00021962008400040031x

Page 35 of 35
Sawan, Cogent Biology (2017), 3: 1292882http://dx.doi.org/10.1080/23312025.2017.1292882
© 2017 The Author(s). This open access article is distributed under a Creative Commons Attribution (CC-BY) 4.0 license.You are free to: Share — copy and redistribute the material in any medium or format Adapt — remix, transform, and build upon the material for any purpose, even commercially.The licensor cannot revoke these freedoms as long as you follow the license terms.
Under the following terms:Attribution — You must give appropriate credit, provide a link to the license, and indicate if changes were made. You may do so in any reasonable manner, but not in any way that suggests the licensor endorses you or your use. No additional restrictions You may not apply legal terms or technological measures that legally restrict others from doing anything the license permits.
Reddy, K. R., Hodges, H. F., & McKinion, J. M. (1993). Temperature effects on pima cotton leaf growth. Agronomy Journal, 85, 681–686. http://dx.doi.org/10.2134/agronj1993.00021962008500030030x
Reddy, K. R., Hodges, H. F., & McKinion, J. M. (1995). Carbon dioxide and temperature effects on pima cotton growth. Agriculture Ecosystems & Environment, 54, 17–29.
Reddy, K. R., Robana, R. R., Hodges, H. F., Liu, X. J., & McKinion, J. M. (1998). Interactions of CO2 enrichment and temperature on cotton growth and leaf characteristics. Environmental and Experimental Botany, 39, 117–129. http://dx.doi.org/10.1016/S0098-8472(97)00028-2
SAS Institute Inc. (1985). SAS User’s Guide: Statistics (5th ed., pp. 433–506). Cary, NC: Author.
Sawan, Z. M. (2013). Studying the relationship between climatic factors and cotton production by different applied methods. Journal of Stress Physiology & Biochemistry, 9, 251–278.
Sawan, Z. M. (2014a). Climatic factors: Evaporation, sunshine, relative humidity, soil and air temperature and cotton production. Annual Research & Review in Biology, 4, 2835–2855. http://dx.doi.org/10.9734/ARRB
Sawan, Z. M. (2014b). Nature relation between climatic variables and cotton production. Journal of Stress Physiology & Biochemistry, 9, 251–278.
Sawan, Z. M., Hanna, L. I., & McCuistion, W. L. (1999). Effect of climatic factors during the development periods of flowering and boll formation on the production of Egyptian cotton (Gossypium barbadense L.). Agronomie, 19, 435–443. http://dx.doi.org/10.1051/agro:19990601
Sawan, Z. M., Hanna, L. I., Gad El Karim, G. A. G., & McCuistion, W. L. (2002). Relationships between climatic factors and flower and boll production in Egyptian cotton (Gossypium barbadense). Journal of Arid Environments, 52, 499–516. http://dx.doi.org/10.1006/jare.2002.1012
Sawan, Z. M., Hanna, L. I., & McCuistion, W. L. (2005). Response of flower and boll development to climatic factors before and after anthesis in Egyptian cotton. Climate Research, 29, 167–179. http://dx.doi.org/10.3354/cr029167
Sawan, Z. M., Hanna, L. I., & McCuistion, W. L. (2006). Appropriate time scale for aggregating climatic data to predict flowering and boll setting behaviour of cotton in Egypt. Communication in Biometry and Crop Science, 1, 11–19.
Sawan, Z. M., Hanna, L. I., McCuistion, W. L., & Foote, R. J. (2010). Egyptian cotton (Gossypium barbadense) flower and boll production as affected by climatic factors and soil moisture status. Theoretical and Applied Climatology, 99, 217–227. http://dx.doi.org/10.1007/s00704-009-0138-5
Schrader, S. M., Wise, R. R., Wacholtz, W. F., Ort, D. R., & Sharkey, T. D. (2004). Thylakoid membrane responses to moderately high leaf temperature in Pima cotton. Plant, Cell and Environment, 27, 725–735. http://dx.doi.org/10.1111/pce.2004.27.issue-6
Ward, D. A., & Bunce, J. A. (1986). Responses of net photosynthesis and conductance to independent changes in the humidity environments of the upper and lower surfaces of leaves of sunflower and soybean. Journal of Experimental Botany, 37, 1842–1853. http://dx.doi.org/10.1093/jxb/37.12.1842
Wise, R. R., Olson, A. J., Schrader, S. M., & Sharkey, T. D. (2004). Electron transport is the functional limitation of photosynthesis in field-grown Pima cotton plants at high temperature. Plant, Cell and Environment, 27, 717–724. http://dx.doi.org/10.1111/pce.2004.27.issue-6
Xiao, J.-F., Liu, Z.-G., Yu, X.-G., Zhang, J.-Y., & Duan, A.-W. (2000). Effects of different water application on lint yield and fiber quality of cotton under drip irrigation. Acta Gossypii Sinica, 12, 194–197.
Zhao, D.-L., & Oosterhuis, D. (1997). Physiological response of growth chamber-grown cotton plants to the plant growth regulator PGR-IV under water-deficit stress. Environmental and Experimental Botany, 38, 7–14. http://dx.doi.org/10.1016/S0098-8472(97)00002-6
Zhen, J.-Z. (1995). The causes of low cotton production in Huanghchuan County and measures to increase production. Henan Nongye Kexue, 2, 5–6.
Zhou, Z.-G., Meng, Y.-L., Pei, Shi, Shen, Y.-Q., & Jia, Z.-K. (2000). Study of the relationship between boll weight in wheat-cotton double cropping and meteorological factors at boll-forming stage. Acta Gossypii Sinica, 12, 122–126.