climatic variations in comfortable temperatures: the ... · climatic variations in comfortable...
TRANSCRIPT
Seediscussions,stats,andauthorprofilesforthispublicationat:http://www.researchgate.net/publication/222374860
Climaticvariationsincomfortabletemperatures:ThePakistanprojects
ARTICLEinENERGYANDBUILDINGS·AUGUST1999
ImpactFactor:2.88·DOI:10.1016/S0378-7788(99)00011-0
CITATIONS
94
READS
137
4AUTHORS,INCLUDING:
FergusNicol
OxfordBrookesUniversity
93PUBLICATIONS2,097CITATIONS
SEEPROFILE
IftikharARaja
COMSATSInstituteofInformationTechnol…
167PUBLICATIONS503CITATIONS
SEEPROFILE
Availablefrom:FergusNicol
Retrievedon:30October2015
Ž .Energy and Buildings 30 1999 261–279www.elsevier.comrlocaterenbuild
Climatic variations in comfortable temperatures: the Pakistan projects
J. Fergus Nicol a,), Iftikhar A. Raja a, Arif Allaudin b, Gul Najam Jamy c
a School of Architecture, Oxford Brookes UniÕersity, Oxford OX3 0BP, UKb ENERCON National ConserÕation Centre, G-5r2, Islamabad, Pakistan
c IUCN, Islamia Road, Peshawar, NWFP, Pakistan
Accepted 26 February 1999
Abstract
Two thermal comfort surveys in Pakistan are described. One was longitudinal conducted in summer and winter, the other wastransverse with monthly surveys over a whole year. The surveys were conducted in five cities each representing a particular climaticregion. The use of building controls and clothing is analysed. There is close agreement between the findings of the two surveys despitedifferences in methodology. The surveys show that there is a definite relationship between indoor comfort and outdoor conditions in linewith an adaptive approach to thermal comfort. The current International Standard does not accurately reflect these. Because of the largevariations in indoor temperature in many Pakistani buildings, the surveys also indicate the limits of people’s ability to adapt to indoortemperatures. q 1999 Elsevier Science S.A. All rights reserved.
Keywords: Thermal comfort; Field survey; Longitudinal survey; Transverse survey; Adaptive model; Temperature standards
1. Introduction
Pakistan is a country with very limited energy resourcesand it depends heavily on imported oil. This invites theefficient use of energy and the promotion of energy saving.The building sector consumes a large proportion of thetotal energy and therefore offers the possibility for signifi-cant savings. One means of saving energy is to ensure thatbuildings are well-designed with controls that allow occu-pants to be comfortable for minimum energy expenditure.
Pakistan is a part of the international trend to airconditioning in office environments. The sizing of airconditioning plant depends critically on the difference indesign indoor temperature and the outdoor temperature.Current sizing recommendations for HVAC systems in
w xPakistan are based on ASHRAE standards 1 . The interiordesign temperatures are 268C in the cooling season and
w x218C in the heating season irrespective of local climate 6 .Existing industry practice means that many HVAC sys-tems are designed to provide an indoor temperature as lowas 228C.
) Corresponding author. Tel.: q44-1865-483-226; fax: q44-1865-483-298; e-mail: [email protected]
Analysis of international field studies shows that peopleadapt to the temperatures they experience and are comfort-able over a greater range of temperatures than current
w xstandards suggest 3,5,11,12 . The studies also show thatindoor comfort temperatures vary with the mean tempera-ture outdoors. There is considerable climatic variationacross Pakistan and this should be taken in to account inindoor temperature standards. Because the resulting indoorcomfort temperatures are less prescriptive, there is poten-tial, not only for greater comfort, but also for savings inenergy use and plant costs, if HVAC systems are designedto meet them.
The aim of the research described in this paper was toprovide guidelines for setting comfortable indoor tempera-tures for buildings in Pakistan. To do this, two surveyswere undertaken by a team from Oxford Brookes Univer-sity in co-operation with ENERCON, the energy conserva-tion agency of the Pakistan Government. Longitudinalsurveys were undertaken during 1993–1994 in five cities,using 25 subjects for a week in two seasons—summer and
w xwinter. The results of this survey 18,22 showed that therewere variations in the temperatures which people findcomfortable in different climates and seasons. During1995–1996, following doubts as to the general applicabil-
Ž .ity of results from so small a sample, a second transversesurvey was undertaken using 846 subjects at monthlyintervals over a whole year.
0378-7788r99r$ - see front matter q 1999 Elsevier Science S.A. All rights reserved.Ž .PII: S0378-7788 99 00011-0
( )J.F. Nicol et al.rEnergy and Buildings 30 1999 261–279262
The objectives of the surveys were to:ŽØ determine the temperature found most comfortable or
the temperature found comfortable by the largest num-.ber of people in each climatic zone in each season
Ø relate indoor comfort temperature to outdoor climateØ suggest a method for setting indoor temperature stan-
dards for PakistanØ make recommendations for future workØ suggest a methodology for international work in this
field.This paper describes the two surveys conducted in
Pakistan and compares their results. The use of variouscontrols to modify the indoor thermal conditions is studiedas well as the variation in clothing with season. Thevariation of comfort votes and discomfort with indoortemperature are analysed to obtain the comfort tempera-ture. The comfort temperatures are then related to theindoor and outdoor air temperatures. Conclusions are drawnfor the theory of thermal comfort and for the formulationof indoor temperature standards for Pakistan.
2. Climatic regions of Pakistan
There is a wide range of climatic conditions in Pakistan.The northern and north-western parts can be cool, thePunjab in the centre is extremely hot and semi-arid, theuplands of Baluchistan are arid and cool and the coastalstrip is warm and humid. In cold regions, the temperaturedrops well below zero in the winter. In the desert, themaximum temperature remains above 408C during most ofthe summer period, with a peak often approaching 508C. Anumber of climatic regions have been identified based on
w xvarious criteria. Khan 15 divided the country into eightw x w xzones, Shamshad 28 suggested 11 zones and Raja 26 ,
16 zones. However, based on the homogeneity of theclimatic elements of interest, temperature and precipita-tion, the country may be divided into five major climaticregions.
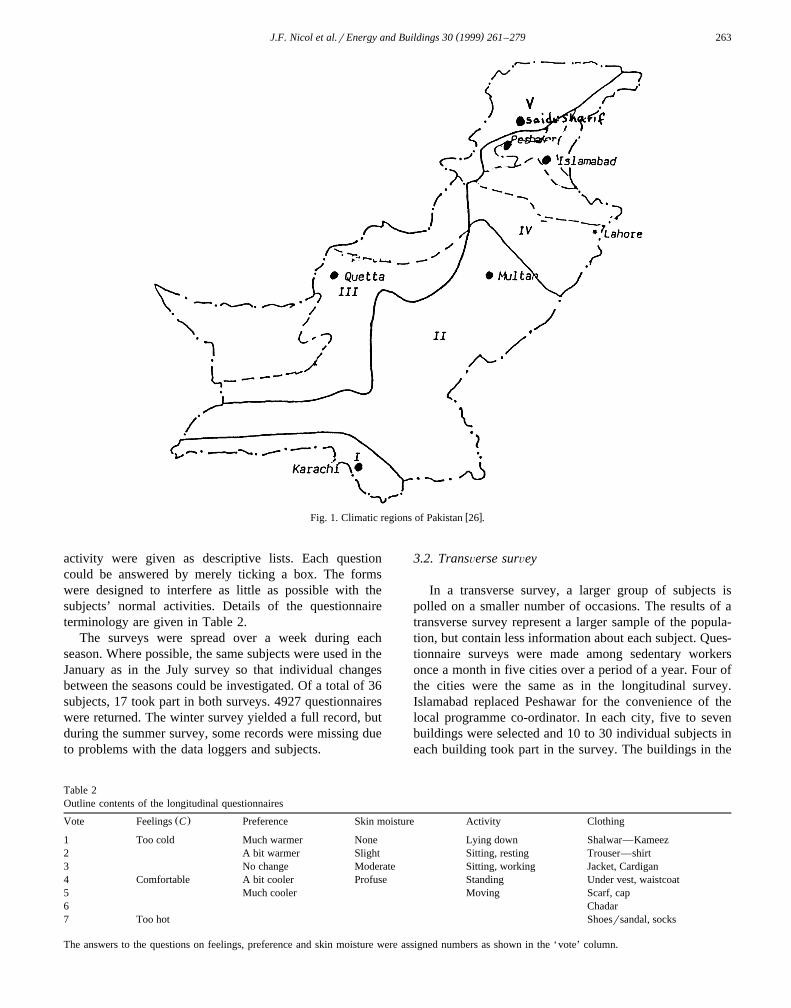
The climatic division of the country is given in Table 1and the boundaries of the various climatic regions are
marked in Fig. 1. Each region has its own cultural andarchitectural traditions reflecting its own particular climate.See Table 4 below for the monthly mean temperatures fora representative city in each region.
3. Thermal comfort surveys
One city in each of the five climatic regions was chosenfor the surveys. In the longitudinal survey, the subjectsrecorded their thermal conditions wherever they were. Thesurvey therefore includes both residential and commercialbuildings. However, the target group for design indoortemperatures in Pakistan is commercial buildings wherebuilders and architects are motivated to follow energyguidelines. It was decided therefore to confine the trans-verse surveys to conditions in workplaces.
3.1. Longitudinal surÕey
In a longitudinal survey, the thermal experience of arelatively small number of subjects is followed over a
w xperiod of time 17 . During the present study, two longitu-dinal surveys were carried out, one during summer, in July1993 and the other during winter, in January 1994. Adescription of the surveys and the results is given in a
w xprevious article in Energy and Buildings 22 and in a fullw xreport 18 .
ŽFive cities Karachi, Multan, Peshawar, Quetta and.Saidu Sharif were selected. Each city represents a particu-
Ž .lar climatic zone see Fig. 1 and Table 1 . Five personswere selected in each city as subjects to take part in thesurvey. They were provided with small data loggers to
Žrecord the basic climatic variables globe temperature, air.temperature, humidity and air speed at 5-min intervals.
They were asked to fill a questionnaire related to thethermal conditions every hour during their waking day.
The questionnaire was administered in Urdu, the lan-guage of Pakistan. The comfort vote was cast on a seven-point semantic differential scale. Other subjective voteswere descriptive: the preference vote on a five-point scale,the skin moisture on a four-point scale. Clothing and
Table 1Climatic regions of Pakistan
Climatic zone Representative Monthly mean outdoorŽ .city temperature range 8C
Zone I: Tropical Coastland Karachi 18.1–31.4Zone II: Subtropical Continental, Multan 12.8–35.5Lowlands AridZone III: Subtropical Continental, Quetta 4.9–27.8Highlands SemiaridrSub-humidZone IV: Subtropical Continental, Lowlands Sub-humid Islamabad, Peshawar 10.1–31.2Zone V: Subtropical Continental, Highlands Humid Saidu Sharif 8.2–28.7Highlands Humid
See also Fig. 1.
( )J.F. Nicol et al.rEnergy and Buildings 30 1999 261–279 263
w xFig. 1. Climatic regions of Pakistan 26 .
activity were given as descriptive lists. Each questioncould be answered by merely ticking a box. The formswere designed to interfere as little as possible with thesubjects’ normal activities. Details of the questionnaireterminology are given in Table 2.
The surveys were spread over a week during eachseason. Where possible, the same subjects were used in theJanuary as in the July survey so that individual changesbetween the seasons could be investigated. Of a total of 36subjects, 17 took part in both surveys. 4927 questionnaireswere returned. The winter survey yielded a full record, butduring the summer survey, some records were missing dueto problems with the data loggers and subjects.
3.2. TransÕerse surÕey
In a transverse survey, a larger group of subjects ispolled on a smaller number of occasions. The results of atransverse survey represent a larger sample of the popula-tion, but contain less information about each subject. Ques-tionnaire surveys were made among sedentary workersonce a month in five cities over a period of a year. Four ofthe cities were the same as in the longitudinal survey.Islamabad replaced Peshawar for the convenience of thelocal programme co-ordinator. In each city, five to sevenbuildings were selected and 10 to 30 individual subjects ineach building took part in the survey. The buildings in the
Table 2Outline contents of the longitudinal questionnaires
Ž .Vote Feelings C Preference Skin moisture Activity Clothing
1 Too cold Much warmer None Lying down Shalwar—Kameez2 A bit warmer Slight Sitting, resting Trouser—shirt3 No change Moderate Sitting, working Jacket, Cardigan4 Comfortable A bit cooler Profuse Standing Under vest, waistcoat5 Much cooler Moving Scarf, cap6 Chadar7 Too hot Shoesrsandal, socks
The answers to the questions on feelings, preference and skin moisture were assigned numbers as shown in the ‘vote’ column.
( )J.F. Nicol et al.rEnergy and Buildings 30 1999 261–279264
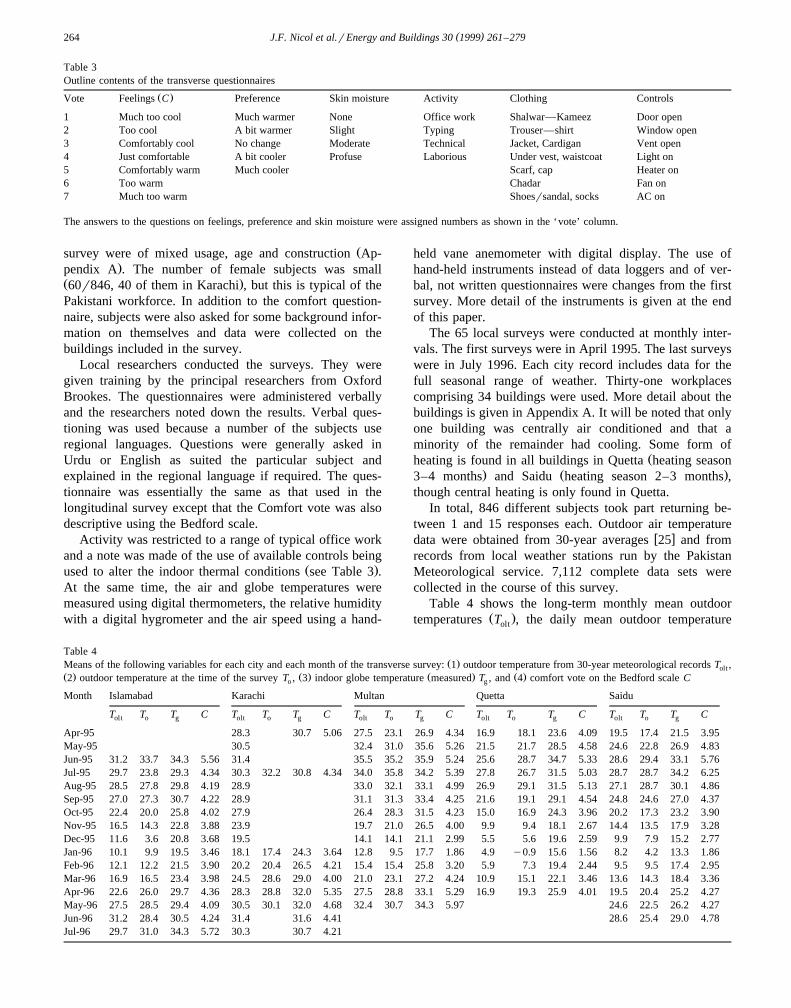
Table 3Outline contents of the transverse questionnaires
Ž .Vote Feelings C Preference Skin moisture Activity Clothing Controls
1 Much too cool Much warmer None Office work Shalwar—Kameez Door open2 Too cool A bit warmer Slight Typing Trouser—shirt Window open3 Comfortably cool No change Moderate Technical Jacket, Cardigan Vent open4 Just comfortable A bit cooler Profuse Laborious Under vest, waistcoat Light on5 Comfortably warm Much cooler Scarf, cap Heater on6 Too warm Chadar Fan on7 Much too warm Shoesrsandal, socks AC on
The answers to the questions on feelings, preference and skin moisture were assigned numbers as shown in the ‘vote’ column.
Žsurvey were of mixed usage, age and construction Ap-.pendix A . The number of female subjects was small
Ž .60r846, 40 of them in Karachi , but this is typical of thePakistani workforce. In addition to the comfort question-naire, subjects were also asked for some background infor-mation on themselves and data were collected on thebuildings included in the survey.
Local researchers conducted the surveys. They weregiven training by the principal researchers from OxfordBrookes. The questionnaires were administered verballyand the researchers noted down the results. Verbal ques-tioning was used because a number of the subjects useregional languages. Questions were generally asked inUrdu or English as suited the particular subject andexplained in the regional language if required. The ques-tionnaire was essentially the same as that used in thelongitudinal survey except that the Comfort vote was alsodescriptive using the Bedford scale.
Activity was restricted to a range of typical office workand a note was made of the use of available controls being
Ž .used to alter the indoor thermal conditions see Table 3 .At the same time, the air and globe temperatures weremeasured using digital thermometers, the relative humiditywith a digital hygrometer and the air speed using a hand-
held vane anemometer with digital display. The use ofhand-held instruments instead of data loggers and of ver-bal, not written questionnaires were changes from the firstsurvey. More detail of the instruments is given at the endof this paper.
The 65 local surveys were conducted at monthly inter-vals. The first surveys were in April 1995. The last surveyswere in July 1996. Each city record includes data for thefull seasonal range of weather. Thirty-one workplacescomprising 34 buildings were used. More detail about thebuildings is given in Appendix A. It will be noted that onlyone building was centrally air conditioned and that aminority of the remainder had cooling. Some form of
Žheating is found in all buildings in Quetta heating season. Ž .3–4 months and Saidu heating season 2–3 months ,
though central heating is only found in Quetta.In total, 846 different subjects took part returning be-
tween 1 and 15 responses each. Outdoor air temperaturew xdata were obtained from 30-year averages 25 and from
records from local weather stations run by the PakistanMeteorological service. 7,112 complete data sets werecollected in the course of this survey.
Table 4 shows the long-term monthly mean outdoorŽ .temperatures T , the daily mean outdoor temperatureolt
Table 4Ž .Means of the following variables for each city and each month of the transverse survey: 1 outdoor temperature from 30-year meteorological records T ,olt
Ž . Ž . Ž . Ž .2 outdoor temperature at the time of the survey T , 3 indoor globe temperature measured T , and 4 comfort vote on the Bedford scale Co g
Month Islamabad Karachi Multan Quetta Saidu
T T T C T T T C T T T C T T T C T T T Colt o g olt o g olt o g olt o g olt o g
Apr-95 28.3 30.7 5.06 27.5 23.1 26.9 4.34 16.9 18.1 23.6 4.09 19.5 17.4 21.5 3.95May-95 30.5 32.4 31.0 35.6 5.26 21.5 21.7 28.5 4.58 24.6 22.8 26.9 4.83Jun-95 31.2 33.7 34.3 5.56 31.4 35.5 35.2 35.9 5.24 25.6 28.7 34.7 5.33 28.6 29.4 33.1 5.76Jul-95 29.7 23.8 29.3 4.34 30.3 32.2 30.8 4.34 34.0 35.8 34.2 5.39 27.8 26.7 31.5 5.03 28.7 28.7 34.2 6.25Aug-95 28.5 27.8 29.8 4.19 28.9 33.0 32.1 33.1 4.99 26.9 29.1 31.5 5.13 27.1 28.7 30.1 4.86Sep-95 27.0 27.3 30.7 4.22 28.9 31.1 31.3 33.4 4.25 21.6 19.1 29.1 4.54 24.8 24.6 27.0 4.37Oct-95 22.4 20.0 25.8 4.02 27.9 26.4 28.3 31.5 4.23 15.0 16.9 24.3 3.96 20.2 17.3 23.2 3.90Nov-95 16.5 14.3 22.8 3.88 23.9 19.7 21.0 26.5 4.00 9.9 9.4 18.1 2.67 14.4 13.5 17.9 3.28Dec-95 11.6 3.6 20.8 3.68 19.5 14.1 14.1 21.1 2.99 5.5 5.6 19.6 2.59 9.9 7.9 15.2 2.77Jan-96 10.1 9.9 19.5 3.46 18.1 17.4 24.3 3.64 12.8 9.5 17.7 1.86 4.9 y0.9 15.6 1.56 8.2 4.2 13.3 1.86Feb-96 12.1 12.2 21.5 3.90 20.2 20.4 26.5 4.21 15.4 15.4 25.8 3.20 5.9 7.3 19.4 2.44 9.5 9.5 17.4 2.95Mar-96 16.9 16.5 23.4 3.98 24.5 28.6 29.0 4.00 21.0 23.1 27.2 4.24 10.9 15.1 22.1 3.46 13.6 14.3 18.4 3.36Apr-96 22.6 26.0 29.7 4.36 28.3 28.8 32.0 5.35 27.5 28.8 33.1 5.29 16.9 19.3 25.9 4.01 19.5 20.4 25.2 4.27May-96 27.5 28.5 29.4 4.09 30.5 30.1 32.0 4.68 32.4 30.7 34.3 5.97 24.6 22.5 26.2 4.27Jun-96 31.2 28.4 30.5 4.24 31.4 31.6 4.41 28.6 25.4 29.0 4.78Jul-96 29.7 31.0 34.3 5.72 30.3 30.7 4.21
( )J.F. Nicol et al.rEnergy and Buildings 30 1999 261–279 265
recorded at a local met station for the day of the surveyŽ . Ž .T , the mean indoor globe temperature measured T ando g
Ž .the mean comfort vote cast C during each monthlytransverse survey. Since the surveys were carried out inworking hours, the indoor temperatures recorded will gen-erally relate to an instantaneous outdoor temperature lyingabove the daily mean.
There is a very high correlation between globe tempera-Ž .ture and air temperature indoors )0.98 . The mean dif-
ference between the two temperatures is about 0.5 K.Because it includes the effect of both radiant and airtemperature, the globe temperature is generally more rep-resentative of the overall effect of temperature on humancomfort. It has therefore been used as the measure of
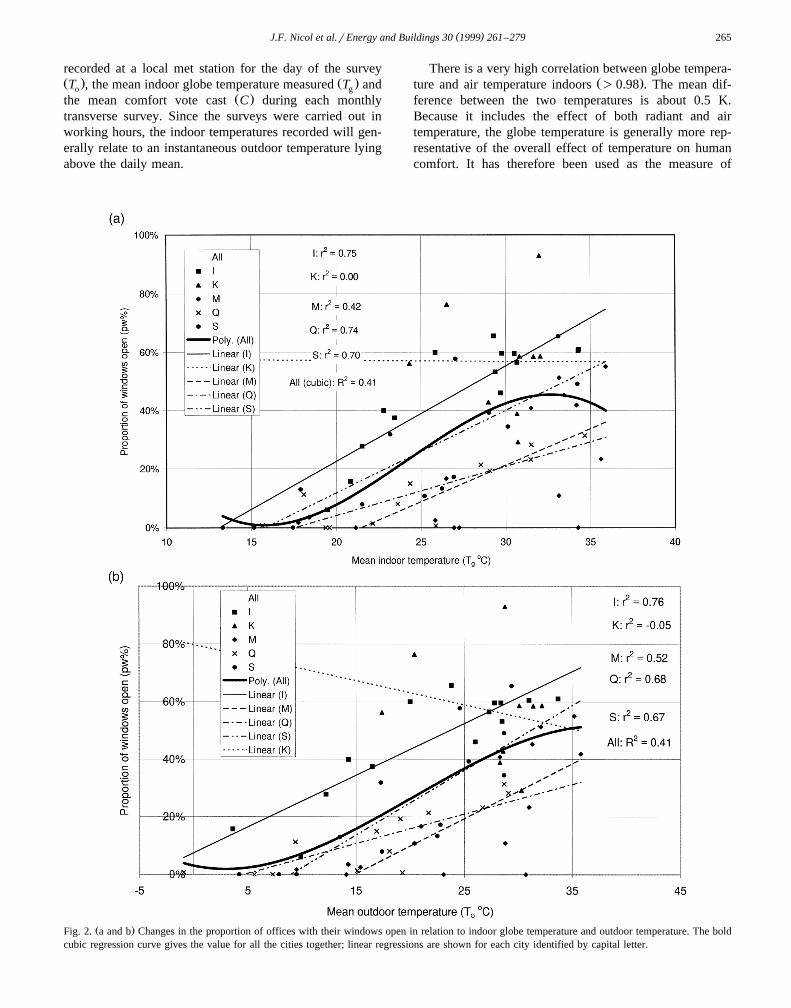
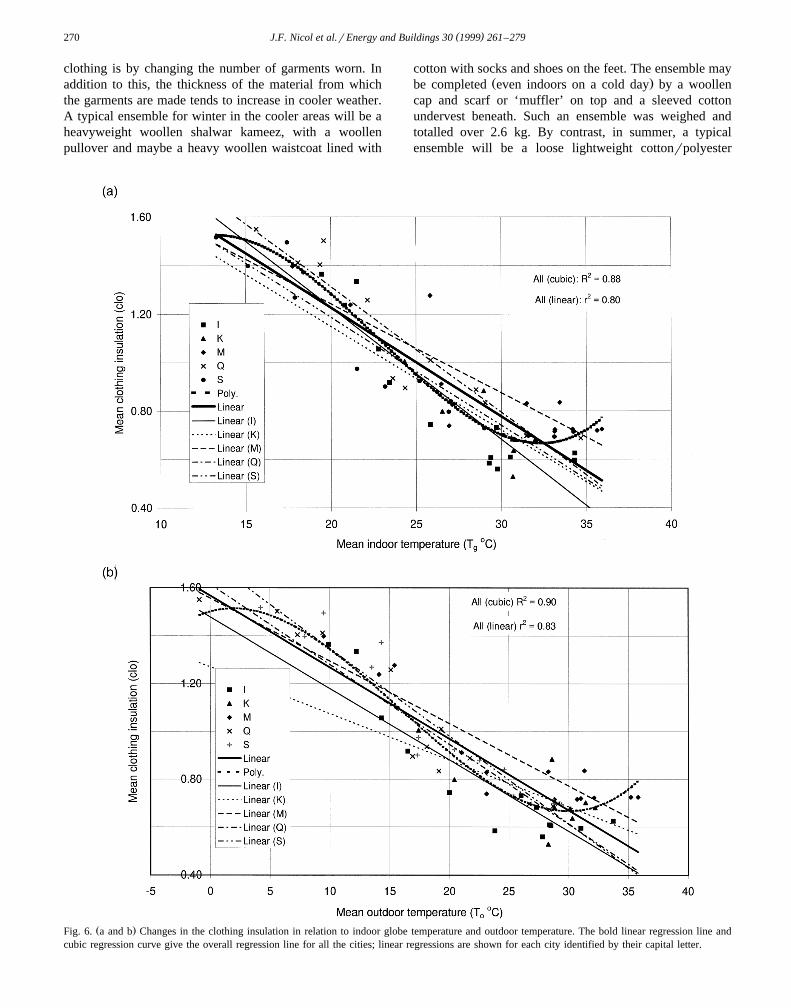
Ž .Fig. 2. a and b Changes in the proportion of offices with their windows open in relation to indoor globe temperature and outdoor temperature. The boldcubic regression curve gives the value for all the cities together; linear regressions are shown for each city identified by capital letter.
( )J.F. Nicol et al.rEnergy and Buildings 30 1999 261–279266
indoor temperature in this study. The globe temperature isclose to the operative temperature.
4. Analysis: use of controls
The availability and appropriate use of controls in abuilding allows occupants to modify the internal environ-
ment. In naturally ventilated buildings, control over indoortemperature and ventilation can be obtained by usingcommonly available controls such as openable windows,ventilators, doors, etc. In more extreme conditions, cool-ers, fans or heaters may be used. In the longitudinalsurveys, the use of controls was not recorded, firstlybecause the concern was simply to relate comfort to
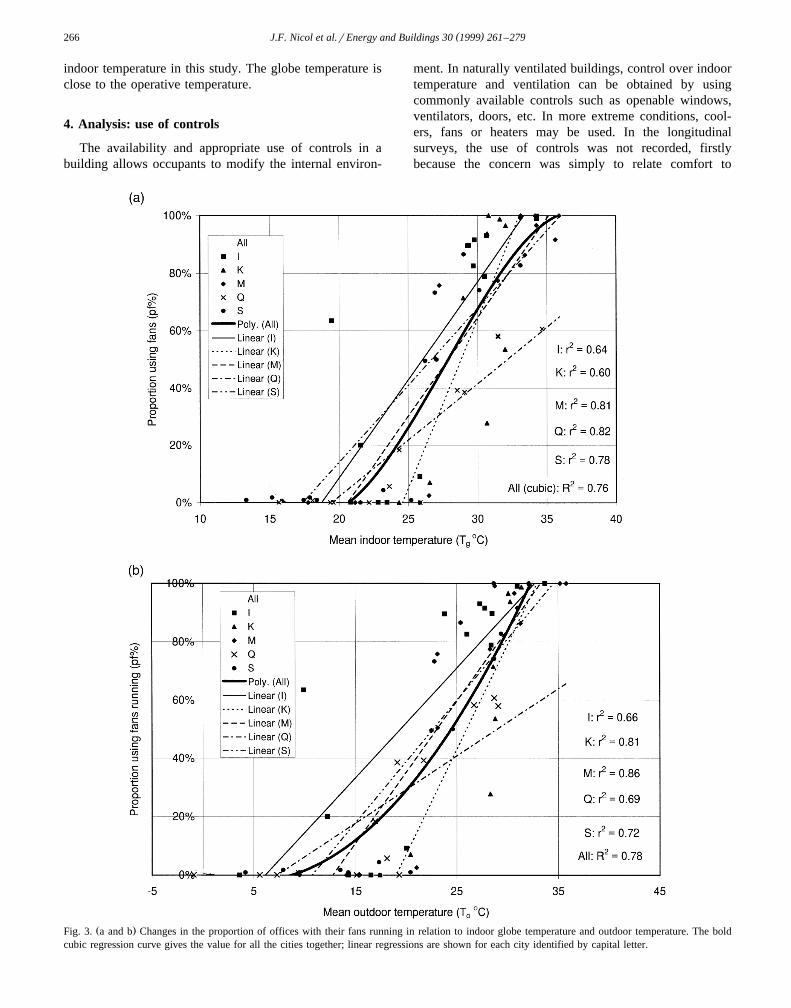
Ž .Fig. 3. a and b Changes in the proportion of offices with their fans running in relation to indoor globe temperature and outdoor temperature. The boldcubic regression curve gives the value for all the cities together; linear regressions are shown for each city identified by capital letter.
( )J.F. Nicol et al.rEnergy and Buildings 30 1999 261–279 267
environmental conditions and also because the subjectswere moving from building to building. The transversesurveys were conducted at workplaces so the changes inthe use of controls give insight into the adaptive behaviourof subjects and were therefore recorded.
The controls whose use was recorded are listed in Table3. Window opening, the use of fans and the use of heaters
have been used for the purposes of analysis. Regressionwas used to predict the mean proportion of subjects usingeach of these controls from the outdoor air temperatureŽ . Ž .T and the indoor globe temperature T in each monthlyo g
survey. The results are given in Figs. 2–4. The square ofŽ 2 .the direct correlation coefficient r between the tempera-
ture and the proportional use of the control is also indi-
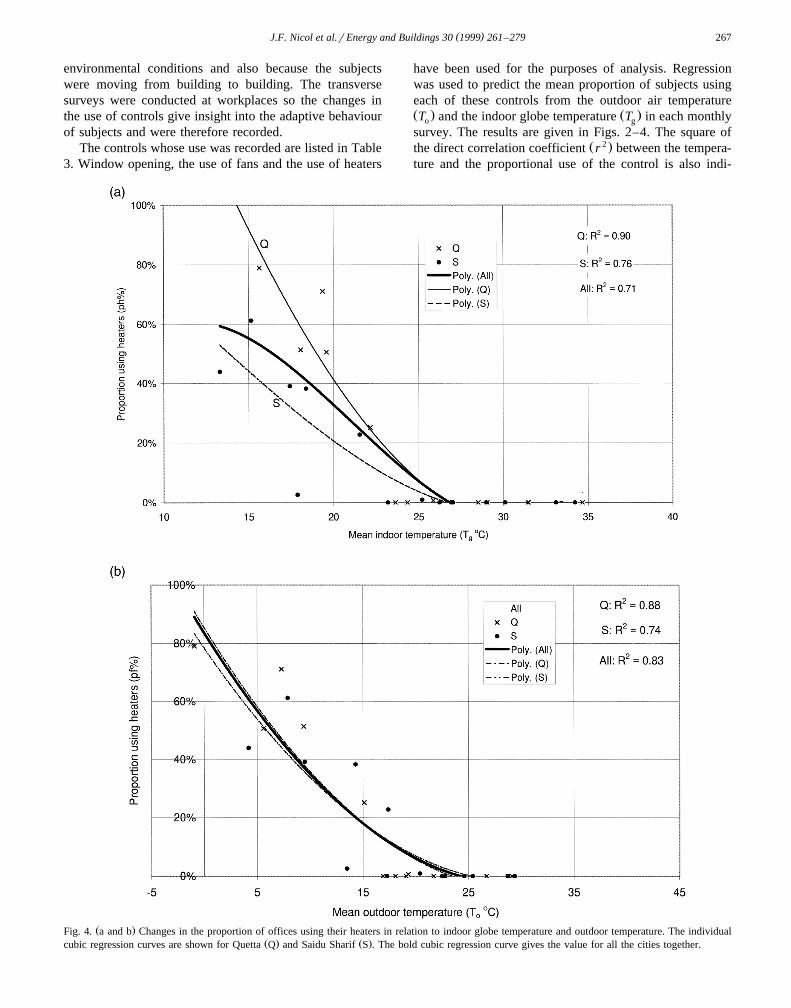
Ž .Fig. 4. a and b Changes in the proportion of offices using their heaters in relation to indoor globe temperature and outdoor temperature. The individualŽ . Ž .cubic regression curves are shown for Quetta Q and Saidu Sharif S . The bold cubic regression curve gives the value for all the cities together.
( )J.F. Nicol et al.rEnergy and Buildings 30 1999 261–279268
cated for each location. In general, the use of fans shows astronger correlation with temperature than window open-ing or the use of heaters. The correlation of all of thesevariables is similar whether with T or T .g o
( )4.1. Windows Fig. 2a and b
Windows are not always available to building occu-pants, in particular, where the building has a deep plan or
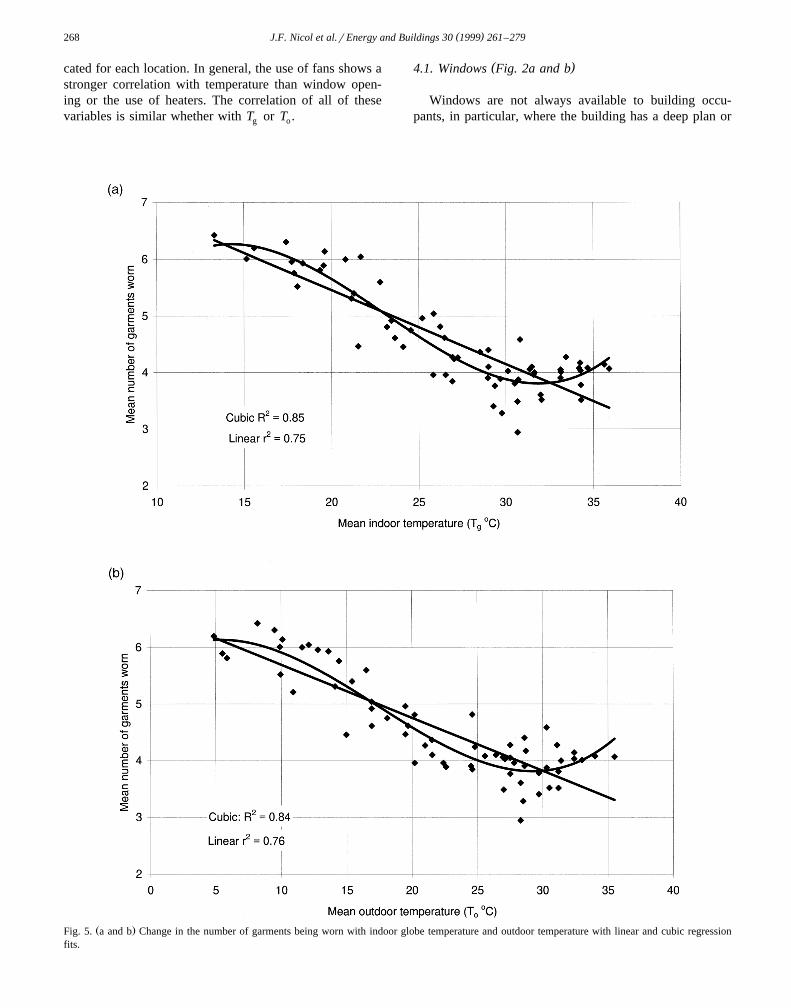
Ž .Fig. 5. a and b Change in the number of garments being worn with indoor globe temperature and outdoor temperature with linear and cubic regressionfits.
( )J.F. Nicol et al.rEnergy and Buildings 30 1999 261–279 269
Table 5Ž .a Clothing insulation: main garments used in Pakistan
Ž . Ž . Ž .Garments Body surface area covered Light clo Medium clo Heavy clo
Shirt for Trousers 51 0.20 0.25 0.30Ž .Shirt for Shalwar Kameez 60 0.24 0.29 0.35
Trousers 45 0.20 0.25 0.28Shalwar 45 0.27 0.33 0.37Cardigan 35 0.19 0.22 0.26Sweater 39 0.25 0.30 0.36Waist coatrvest 28 0.13 0.18 0.22Jacket 50 0.21 0.30 0.38Chadar 67 0.40 0.49 0.55
Ž .ScarfrDopatta around neck – 0.02 0.03 0.05Headwear 5 0.03 0.07 0.10
Ž .b Underwear, Footwear and others
Ž .Garments Body surface area covered Insulation clo
Ž .Vest Bunnian 21 0.13Briefs 12 0.05Panties 12 0.03Bra 5 0.02
Ž .Socks short 14 0.03Ž .Socks long 20 0.07
Shoes 7 0.04Sandals 5 0.03
fixed windows. This causes some differences betweencities in the proportion using windows. The proportion of
Ž .people with open windows p in Karachi does not varyw
systematically with indoor or outdoor temperature. In othercities, there is a marked increase in p as the temperaturew
rises particularly between 20 and 308C. The overall R2 of0.41 for the cubic regression of p on T and T is notw g o
high, but the r 2 for cities other that Karachi, and possiblyMultan is highly significant.
( )4.2. Fans Fig. 3a and b
In Quetta, there is one building with central air condi-tioning and no fans. Otherwise, practically all buildings inthe survey provide ceiling fans. As the indoor and outdoortemperatures increase, there is a marked increase in the
Ž .proportion of people using fans p . When T is belowf g
218C, none of the workplaces have fans running and by248C, p has risen to 20%. When the temperature has risenf
to 328C, p is about 80% and by 358C, practically all havef
fans on. This gives a highly significant overall R2 of 0.76between the p and T and 0.78 between p and T . Forf g f o
individual cities, the correlation is similar.
( )4.3. Heaters Fig. 4a and b
Of the cities surveyed, heaters are only extensively usedin Quetta and Saidu Sharif. These cities also show a strongrelationship between the proportion using heaters and theindoor and outdoor temperature. The figure suggests thatheaters are used at indoor temperatures below about 238CŽ .c.f. fans or outdoor temperatures below 208C. At lower
Ž .temperatures, the proportion using heaters p increasesh
as temperature falls.
4.4. Air conditioners
Apart from the centrally air conditioned building inQuetta, cooling by the use of air conditioners or evapora-tive coolers only occurs in a minority of buildings, andonly when the daily mean outdoor temperature exceedsabout 258C. Even when temperatures exceed 258C, coolingis recorded in less than 20% of the responses in all centresexcept in Karachi where it is about 30%.
5. Analysis: clothing and activity
5.1. Clothing
In both surveys, clothes worn by the subjects wererecorded. Clothing is an important factor in achievingcomfort at different temperatures. One method of varying
Table 6Ž . Ž . Ž .Assumed use of light L medium M and heavyweight H clothing in
each city by month
Jan Feb Mar Apr May Jun Jul Aug Sep Oct Nov Dec
Islamabad H H M M L L L L M M M HKarachi M M M L L L L L L M M MMultan H H M L L L L L M M M MQuetta H H H M M L L L M M H HSaidu H H H M M L L L M M H H
( )J.F. Nicol et al.rEnergy and Buildings 30 1999 261–279270
clothing is by changing the number of garments worn. Inaddition to this, the thickness of the material from whichthe garments are made tends to increase in cooler weather.A typical ensemble for winter in the cooler areas will be aheavyweight woollen shalwar kameez, with a woollenpullover and maybe a heavy woollen waistcoat lined with
cotton with socks and shoes on the feet. The ensemble mayŽ .be completed even indoors on a cold day by a woollen
cap and scarf or ‘muffler’ on top and a sleeved cottonundervest beneath. Such an ensemble was weighed andtotalled over 2.6 kg. By contrast, in summer, a typicalensemble will be a loose lightweight cottonrpolyester
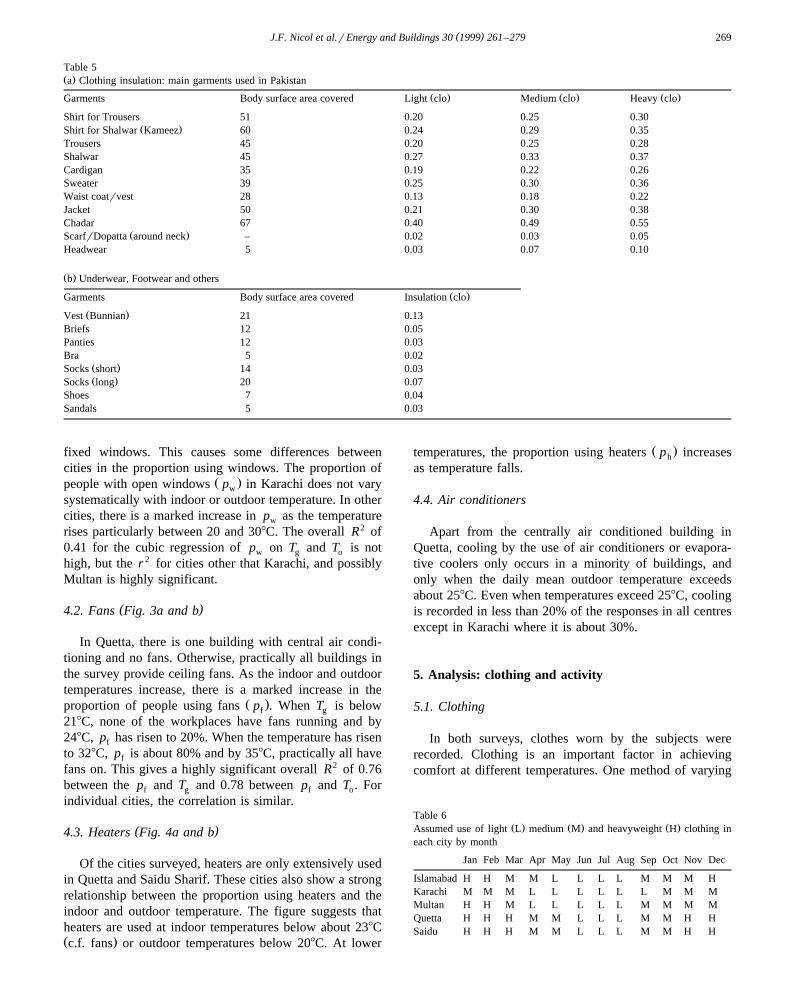
Ž .Fig. 6. a and b Changes in the clothing insulation in relation to indoor globe temperature and outdoor temperature. The bold linear regression line andcubic regression curve give the overall regression line for all the cities; linear regressions are shown for each city identified by their capital letter.
( )J.F. Nicol et al.rEnergy and Buildings 30 1999 261–279 271
shalwar kameez and sandals. In addition, some peoplewear a cotton sleeveless undervest to distribute any accu-mulation of sweat and reduce discomfort. Such an ensem-ble was weighed and totalled under 0.7 kg. The number of
Žgarments being worn was counted for this purpose, a pair.of shoes or socks are counted as one garment and its
variation with indoor temperature and outdoor temperatureare shown in Fig. 5a and b.
It would be useful to know what thermal insulationdifferent types of clothing provide. Unfortunately, informa-tion concerning the insulation of typical Pakistani clothingis not easily available. Tanabe measured the insulation of
w xsome garments used in Pakistan 29 . An attempt has beenmade to estimate the insulation values of various garmentsused in Pakistan using Tanabe’s work and standard values
w xof similar garments 14,16 . The values, altered accordingto the thickness of the material and the percentage of body
w xsurface area covered 20,24 , are listed in Table 5a and b.The results for the longitudinal survey are given in
w xdetail in Nicol et al. 18 . The thickness of the clothing onthat occasion was observed so that the appropriate valuescan be assigned from Table 4. The transverse survey ranover a calendar year. For the purpose of analysis, it hasbeen assumed that there are three thicknesses of clothingas shown in Table 5a and b. The number of items of
Ž .clothing changes with both indoor rs0.653, p-0.001Ž .and outdoor temperature rs0.666, p-0.001 and with
Ž .the comfort vote rs0.538, p-0.001 . Fig. 5a and bshow how the number of garments varies with the monthly
Žmean of temperature note the higher correlations are to be.expected . The number of garments is therefore being used
as an adaptation to low temperatures and thermal discom-fort. It may be assumed that, as a first approximation, thethinnest weight is used when conditions are generally hotŽ .heat discomfort G5%, outdoor temperature )258C , and
Žthe thickest when they are generally cold cold discomfort.G5%, outdoor temperature -158C . The months con-
cerned in each city are shown in Table 6, and are almostidentical for the two criteria. Using the resulting values forthe clothing insulation, Fig. 6a and b show how theclo-value of the garments worn varies with the indoorglobe temperature and outdoor air temperature.
In the interval between 208C and 308C, there is a rapiddecrease in clothing insulation with rising temperature.Outside these temperatures, the rate of change drops off,maybe because the clothing worn has reached the limits ofacceptable clothing in an office situation.
5.2. Metabolic rate
The metabolic rate was derived from the activity de-scriptions which were collected during the survey as sug-gested by ISO 7730. No significant correlation was foundbetween metabolic rate and any of the environmentalvariables. Mean metabolic rates varied slightly from city tocity between 1.11 and 1.25 met. The differences betweencities reflect different work profiles among the subjects.
6. Analysis: comfort
6.1. Discomfort and temperature
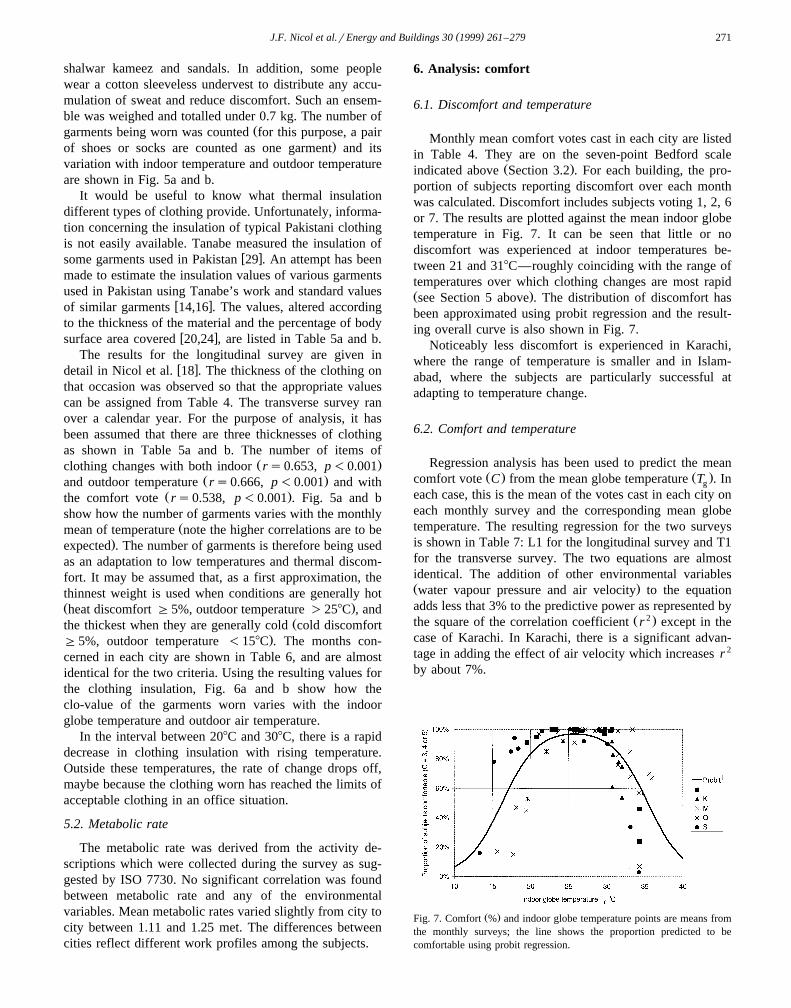
Monthly mean comfort votes cast in each city are listedin Table 4. They are on the seven-point Bedford scale
Ž .indicated above Section 3.2 . For each building, the pro-portion of subjects reporting discomfort over each monthwas calculated. Discomfort includes subjects voting 1, 2, 6or 7. The results are plotted against the mean indoor globetemperature in Fig. 7. It can be seen that little or nodiscomfort was experienced at indoor temperatures be-tween 21 and 318C—roughly coinciding with the range oftemperatures over which clothing changes are most rapidŽ .see Section 5 above . The distribution of discomfort hasbeen approximated using probit regression and the result-ing overall curve is also shown in Fig. 7.
Noticeably less discomfort is experienced in Karachi,where the range of temperature is smaller and in Islam-abad, where the subjects are particularly successful atadapting to temperature change.
6.2. Comfort and temperature
Regression analysis has been used to predict the meanŽ . Ž .comfort vote C from the mean globe temperature T . Ing
each case, this is the mean of the votes cast in each city oneach monthly survey and the corresponding mean globetemperature. The resulting regression for the two surveysis shown in Table 7: L1 for the longitudinal survey and T1for the transverse survey. The two equations are almostidentical. The addition of other environmental variablesŽ .water vapour pressure and air velocity to the equationadds less that 3% to the predictive power as represented by
Ž 2 .the square of the correlation coefficient r except in thecase of Karachi. In Karachi, there is a significant advan-tage in adding the effect of air velocity which increases r 2
by about 7%.
Ž .Fig. 7. Comfort % and indoor globe temperature points are means fromthe monthly surveys; the line shows the proportion predicted to becomfortable using probit regression.
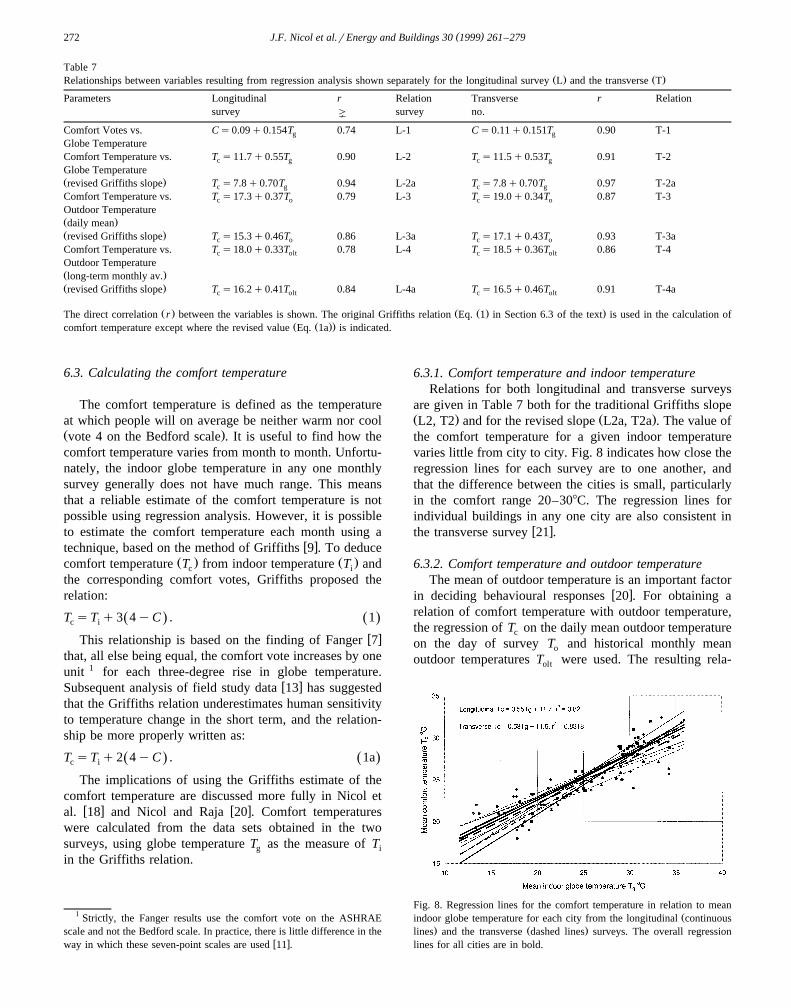
( )J.F. Nicol et al.rEnergy and Buildings 30 1999 261–279272
Table 7Ž . Ž .Relationships between variables resulting from regression analysis shown separately for the longitudinal survey L and the transverse T
Parameters Longitudinal r Relation Transverse r Relationsurvey | survey no.
Comfort Votes vs. Cs0.09q0.154T 0.74 L-1 Cs0.11q0.151T 0.90 T-1g g
Globe TemperatureComfort Temperature vs. T s11.7q0.55T 0.90 L-2 T s11.5q0.53T 0.91 T-2c g c g
Globe TemperatureŽ .revised Griffiths slope T s7.8q0.70T 0.94 L-2a T s7.8q0.70T 0.97 T-2ac g c g
Comfort Temperature vs. T s17.3q0.37T 0.79 L-3 T s19.0q0.34T 0.87 T-3c o c o
Outdoor TemperatureŽ .daily meanŽ .revised Griffiths slope T s15.3q0.46T 0.86 L-3a T s17.1q0.43T 0.93 T-3ac o c o
Comfort Temperature vs. T s18.0q0.33T 0.78 L-4 T s18.5q0.36T 0.86 T-4c olt c olt
Outdoor TemperatureŽ .long-term monthly av.Ž .revised Griffiths slope T s16.2q0.41T 0.84 L-4a T s16.5q0.46T 0.91 T-4ac olt c olt
Ž . Ž Ž . .The direct correlation r between the variables is shown. The original Griffiths relation Eq. 1 in Section 6.3 of the text is used in the calculation ofŽ Ž ..comfort temperature except where the revised value Eq. 1a is indicated.
6.3. Calculating the comfort temperature
The comfort temperature is defined as the temperatureat which people will on average be neither warm nor coolŽ .vote 4 on the Bedford scale . It is useful to find how thecomfort temperature varies from month to month. Unfortu-nately, the indoor globe temperature in any one monthlysurvey generally does not have much range. This meansthat a reliable estimate of the comfort temperature is notpossible using regression analysis. However, it is possibleto estimate the comfort temperature each month using a
w xtechnique, based on the method of Griffiths 9 . To deduceŽ . Ž .comfort temperature T from indoor temperature T andc i
the corresponding comfort votes, Griffiths proposed therelation:
T sT q3 4yC . 1Ž . Ž .c i
w xThis relationship is based on the finding of Fanger 7that, all else being equal, the comfort vote increases by oneunit 1 for each three-degree rise in globe temperature.
w xSubsequent analysis of field study data 13 has suggestedthat the Griffiths relation underestimates human sensitivityto temperature change in the short term, and the relation-ship be more properly written as:
T sT q2 4yC . 1aŽ . Ž .c i
The implications of using the Griffiths estimate of thecomfort temperature are discussed more fully in Nicol et
w x w xal. 18 and Nicol and Raja 20 . Comfort temperatureswere calculated from the data sets obtained in the twosurveys, using globe temperature T as the measure of Tg i
in the Griffiths relation.
1 Strictly, the Fanger results use the comfort vote on the ASHRAEscale and not the Bedford scale. In practice, there is little difference in the
w xway in which these seven-point scales are used 11 .
6.3.1. Comfort temperature and indoor temperatureRelations for both longitudinal and transverse surveys
are given in Table 7 both for the traditional Griffiths slopeŽ . Ž .L2, T2 and for the revised slope L2a, T2a . The value ofthe comfort temperature for a given indoor temperaturevaries little from city to city. Fig. 8 indicates how close theregression lines for each survey are to one another, andthat the difference between the cities is small, particularlyin the comfort range 20–308C. The regression lines forindividual buildings in any one city are also consistent in
w xthe transverse survey 21 .
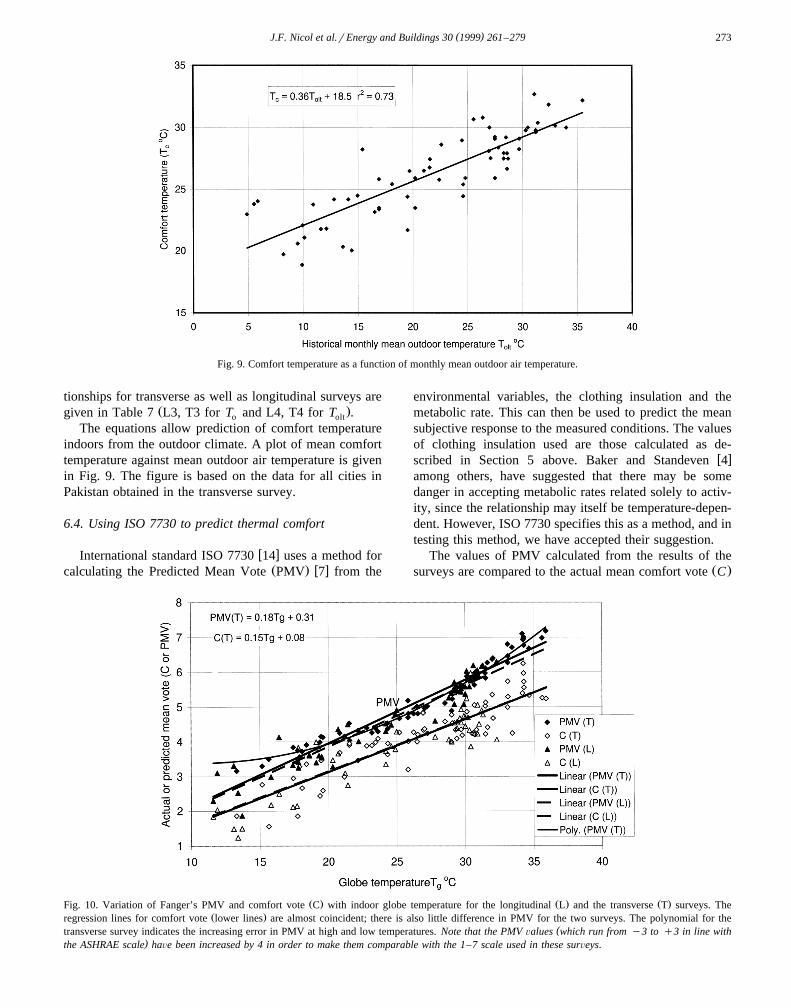
6.3.2. Comfort temperature and outdoor temperatureThe mean of outdoor temperature is an important factor
w xin deciding behavioural responses 20 . For obtaining arelation of comfort temperature with outdoor temperature,the regression of T on the daily mean outdoor temperaturec
on the day of survey T and historical monthly meano
outdoor temperatures T were used. The resulting rela-olt
Fig. 8. Regression lines for the comfort temperature in relation to meanŽindoor globe temperature for each city from the longitudinal continuous
. Ž .lines and the transverse dashed lines surveys. The overall regressionlines for all cities are in bold.
( )J.F. Nicol et al.rEnergy and Buildings 30 1999 261–279 273
Fig. 9. Comfort temperature as a function of monthly mean outdoor air temperature.
tionships for transverse as well as longitudinal surveys areŽ .given in Table 7 L3, T3 for T and L4, T4 for T .o olt
The equations allow prediction of comfort temperatureindoors from the outdoor climate. A plot of mean comforttemperature against mean outdoor air temperature is givenin Fig. 9. The figure is based on the data for all cities inPakistan obtained in the transverse survey.
6.4. Using ISO 7730 to predict thermal comfort
w xInternational standard ISO 7730 14 uses a method forŽ . w xcalculating the Predicted Mean Vote PMV 7 from the
environmental variables, the clothing insulation and themetabolic rate. This can then be used to predict the meansubjective response to the measured conditions. The valuesof clothing insulation used are those calculated as de-
w xscribed in Section 5 above. Baker and Standeven 4among others, have suggested that there may be somedanger in accepting metabolic rates related solely to activ-ity, since the relationship may itself be temperature-depen-dent. However, ISO 7730 specifies this as a method, and intesting this method, we have accepted their suggestion.
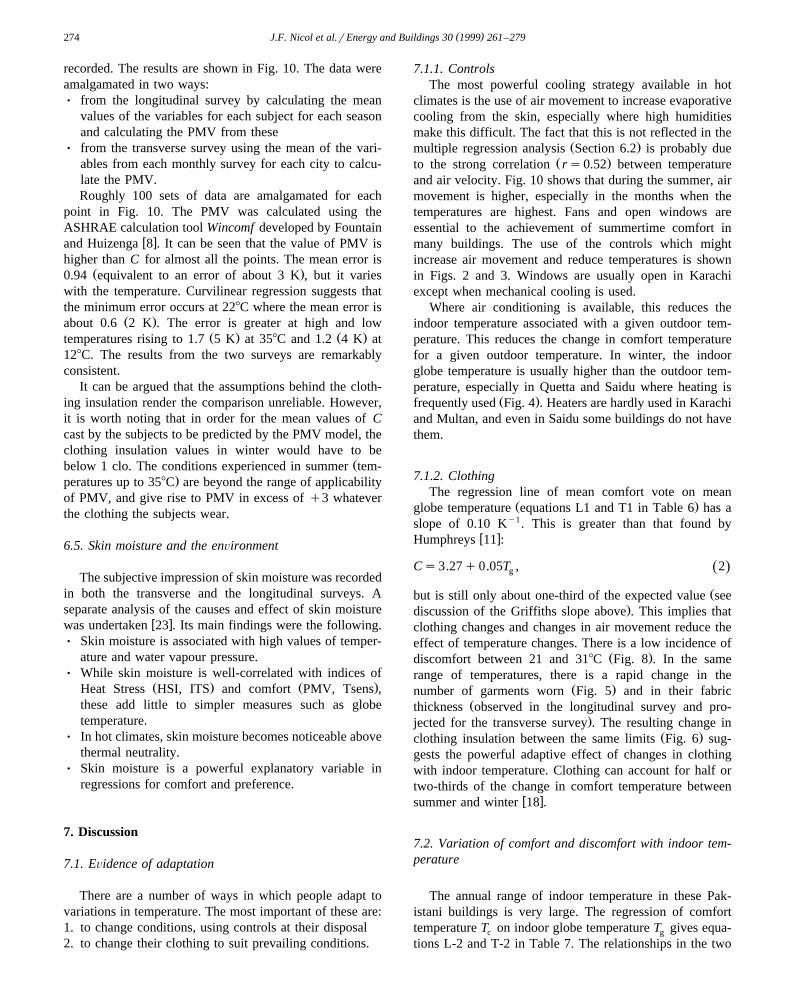
The values of PMV calculated from the results of theŽ .surveys are compared to the actual mean comfort vote C
Ž . Ž . Ž .Fig. 10. Variation of Fanger’s PMV and comfort vote C with indoor globe temperature for the longitudinal L and the transverse T surveys. TheŽ .regression lines for comfort vote lower lines are almost coincident; there is also little difference in PMV for the two surveys. The polynomial for the
(transverse survey indicates the increasing error in PMV at high and low temperatures. Note that the PMV Õalues which run from y3 to q3 in line with)the ASHRAE scale haÕe been increased by 4 in order to make them comparable with the 1–7 scale used in these surÕeys.
( )J.F. Nicol et al.rEnergy and Buildings 30 1999 261–279274
recorded. The results are shown in Fig. 10. The data wereamalgamated in two ways:Ø from the longitudinal survey by calculating the mean
values of the variables for each subject for each seasonand calculating the PMV from these
Ø from the transverse survey using the mean of the vari-ables from each monthly survey for each city to calcu-late the PMV.Roughly 100 sets of data are amalgamated for each
point in Fig. 10. The PMV was calculated using theASHRAE calculation tool Wincomf developed by Fountain
w xand Huizenga 8 . It can be seen that the value of PMV ishigher than C for almost all the points. The mean error is
Ž .0.94 equivalent to an error of about 3 K , but it varieswith the temperature. Curvilinear regression suggests thatthe minimum error occurs at 228C where the mean error is
Ž .about 0.6 2 K . The error is greater at high and lowŽ . Ž .temperatures rising to 1.7 5 K at 358C and 1.2 4 K at
128C. The results from the two surveys are remarkablyconsistent.
It can be argued that the assumptions behind the cloth-ing insulation render the comparison unreliable. However,it is worth noting that in order for the mean values of Ccast by the subjects to be predicted by the PMV model, theclothing insulation values in winter would have to be
Žbelow 1 clo. The conditions experienced in summer tem-.peratures up to 358C are beyond the range of applicability
of PMV, and give rise to PMV in excess of q3 whateverthe clothing the subjects wear.
6.5. Skin moisture and the enÕironment
The subjective impression of skin moisture was recordedin both the transverse and the longitudinal surveys. Aseparate analysis of the causes and effect of skin moisture
w xwas undertaken 23 . Its main findings were the following.Ø Skin moisture is associated with high values of temper-
ature and water vapour pressure.Ø While skin moisture is well-correlated with indices of
Ž . Ž .Heat Stress HSI, ITS and comfort PMV, Tsens ,these add little to simpler measures such as globetemperature.
Ø In hot climates, skin moisture becomes noticeable abovethermal neutrality.
Ø Skin moisture is a powerful explanatory variable inregressions for comfort and preference.
7. Discussion
7.1. EÕidence of adaptation
There are a number of ways in which people adapt tovariations in temperature. The most important of these are:1. to change conditions, using controls at their disposal2. to change their clothing to suit prevailing conditions.
7.1.1. ControlsThe most powerful cooling strategy available in hot
climates is the use of air movement to increase evaporativecooling from the skin, especially where high humiditiesmake this difficult. The fact that this is not reflected in the
Ž .multiple regression analysis Section 6.2 is probably dueŽ .to the strong correlation rs0.52 between temperature
and air velocity. Fig. 10 shows that during the summer, airmovement is higher, especially in the months when thetemperatures are highest. Fans and open windows areessential to the achievement of summertime comfort inmany buildings. The use of the controls which mightincrease air movement and reduce temperatures is shownin Figs. 2 and 3. Windows are usually open in Karachiexcept when mechanical cooling is used.
Where air conditioning is available, this reduces theindoor temperature associated with a given outdoor tem-perature. This reduces the change in comfort temperaturefor a given outdoor temperature. In winter, the indoorglobe temperature is usually higher than the outdoor tem-perature, especially in Quetta and Saidu where heating is
Ž .frequently used Fig. 4 . Heaters are hardly used in Karachiand Multan, and even in Saidu some buildings do not havethem.
7.1.2. ClothingThe regression line of mean comfort vote on mean
Ž .globe temperature equations L1 and T1 in Table 6 has aslope of 0.10 Ky1. This is greater than that found by
w xHumphreys 11 :
Cs3.27q0.05T , 2Ž .g
Žbut is still only about one-third of the expected value see.discussion of the Griffiths slope above . This implies that
clothing changes and changes in air movement reduce theeffect of temperature changes. There is a low incidence of
Ž .discomfort between 21 and 318C Fig. 8 . In the samerange of temperatures, there is a rapid change in the
Ž .number of garments worn Fig. 5 and in their fabricŽthickness observed in the longitudinal survey and pro-
.jected for the transverse survey . The resulting change inŽ .clothing insulation between the same limits Fig. 6 sug-
gests the powerful adaptive effect of changes in clothingwith indoor temperature. Clothing can account for half ortwo-thirds of the change in comfort temperature between
w xsummer and winter 18 .
7.2. Variation of comfort and discomfort with indoor tem-perature
The annual range of indoor temperature in these Pak-istani buildings is very large. The regression of comforttemperature T on indoor globe temperature T gives equa-c g
tions L-2 and T-2 in Table 7. The relationships in the two
( )J.F. Nicol et al.rEnergy and Buildings 30 1999 261–279 275
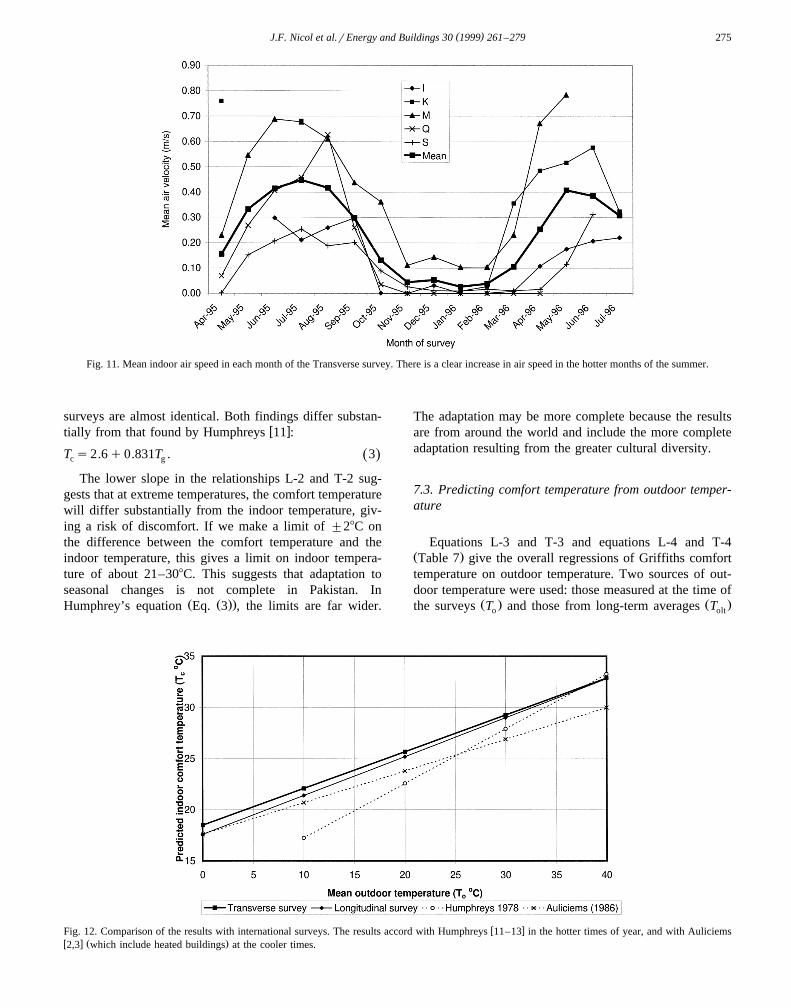
Fig. 11. Mean indoor air speed in each month of the Transverse survey. There is a clear increase in air speed in the hotter months of the summer.
surveys are almost identical. Both findings differ substan-w xtially from that found by Humphreys 11 :
T s2.6q0.831T . 3Ž .c g
The lower slope in the relationships L-2 and T-2 sug-gests that at extreme temperatures, the comfort temperaturewill differ substantially from the indoor temperature, giv-ing a risk of discomfort. If we make a limit of "28C onthe difference between the comfort temperature and theindoor temperature, this gives a limit on indoor tempera-ture of about 21–308C. This suggests that adaptation toseasonal changes is not complete in Pakistan. In
Ž Ž ..Humphrey’s equation Eq. 3 , the limits are far wider.
The adaptation may be more complete because the resultsare from around the world and include the more completeadaptation resulting from the greater cultural diversity.
7.3. Predicting comfort temperature from outdoor temper-ature
Equations L-3 and T-3 and equations L-4 and T-4Ž .Table 7 give the overall regressions of Griffiths comforttemperature on outdoor temperature. Two sources of out-door temperature were used: those measured at the time of
Ž . Ž .the surveys T and those from long-term averages To olt
w xFig. 12. Comparison of the results with international surveys. The results accord with Humphreys 11–13 in the hotter times of year, and with Auliciemsw x Ž .2,3 which include heated buildings at the cooler times.
( )J.F. Nicol et al.rEnergy and Buildings 30 1999 261–279276
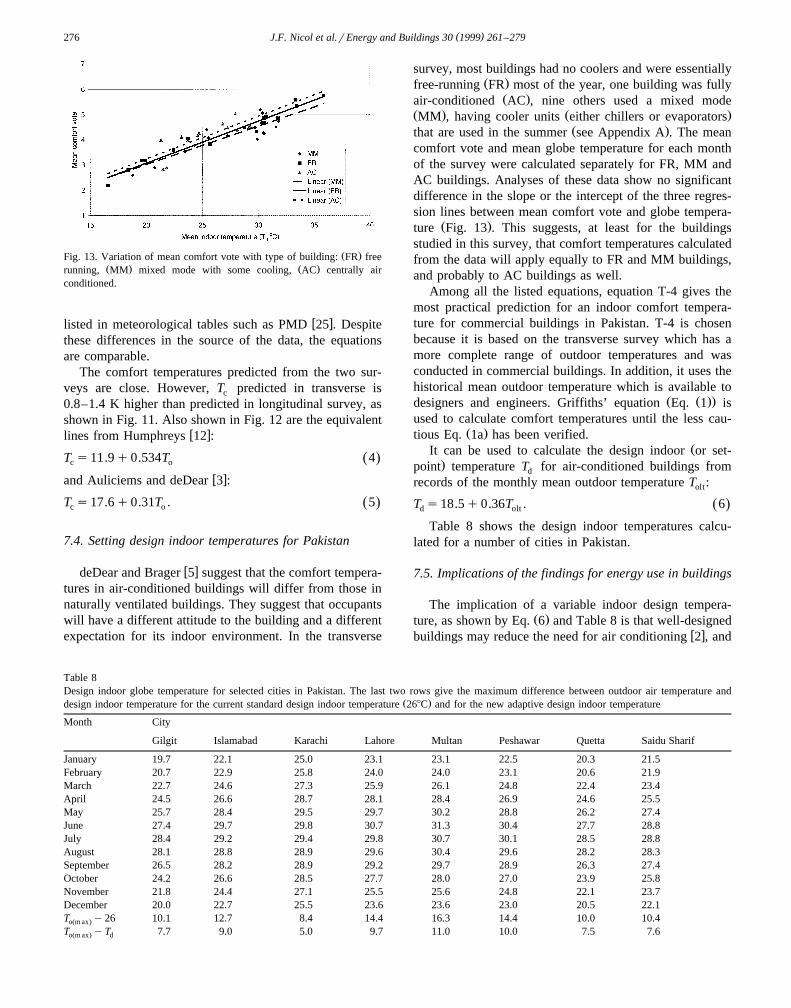
Ž .Fig. 13. Variation of mean comfort vote with type of building: FR freeŽ . Ž .running, MM mixed mode with some cooling, AC centrally air
conditioned.
w xlisted in meteorological tables such as PMD 25 . Despitethese differences in the source of the data, the equationsare comparable.
The comfort temperatures predicted from the two sur-veys are close. However, T predicted in transverse isc
0.8–1.4 K higher than predicted in longitudinal survey, asshown in Fig. 11. Also shown in Fig. 12 are the equivalent
w xlines from Humphreys 12 :
T s11.9q0.534T 4Ž .c o
w xand Auliciems and deDear 3 :
T s17.6q0.31T . 5Ž .c o
7.4. Setting design indoor temperatures for Pakistan
w xdeDear and Brager 5 suggest that the comfort tempera-tures in air-conditioned buildings will differ from those innaturally ventilated buildings. They suggest that occupantswill have a different attitude to the building and a differentexpectation for its indoor environment. In the transverse
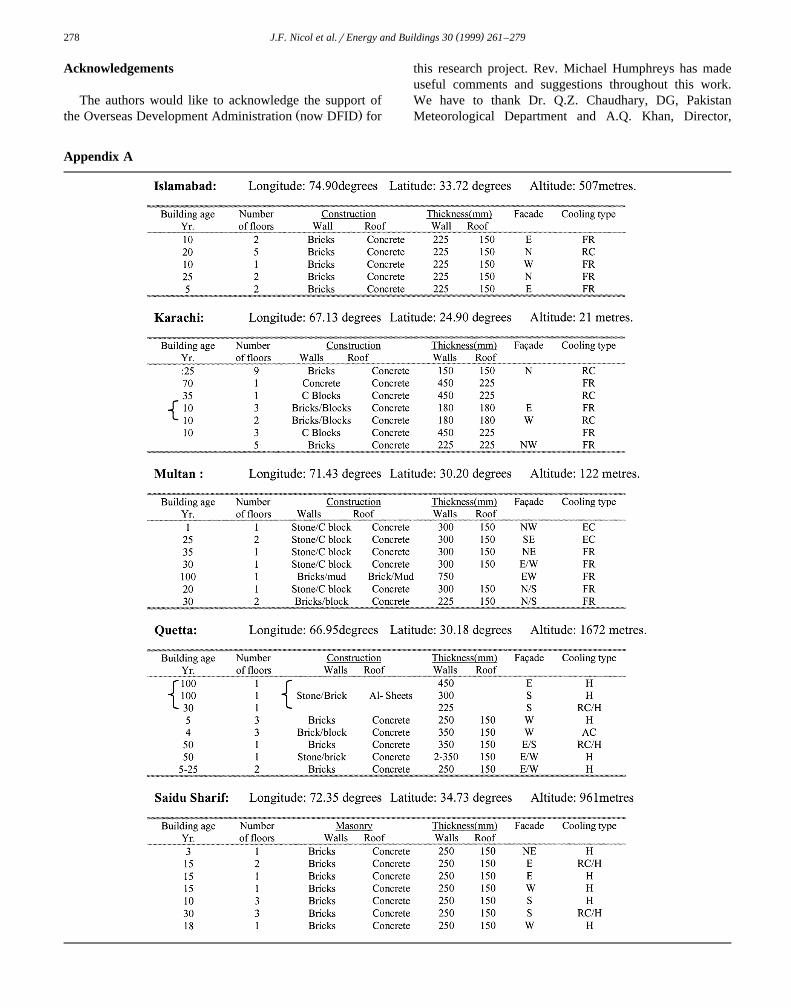
survey, most buildings had no coolers and were essentiallyŽ .free-running FR most of the year, one building was fully
Ž .air-conditioned AC , nine others used a mixed modeŽ . Ž .MM , having cooler units either chillers or evaporators
Ž .that are used in the summer see Appendix A . The meancomfort vote and mean globe temperature for each monthof the survey were calculated separately for FR, MM andAC buildings. Analyses of these data show no significantdifference in the slope or the intercept of the three regres-sion lines between mean comfort vote and globe tempera-
Ž .ture Fig. 13 . This suggests, at least for the buildingsstudied in this survey, that comfort temperatures calculatedfrom the data will apply equally to FR and MM buildings,and probably to AC buildings as well.
Among all the listed equations, equation T-4 gives themost practical prediction for an indoor comfort tempera-ture for commercial buildings in Pakistan. T-4 is chosenbecause it is based on the transverse survey which has amore complete range of outdoor temperatures and wasconducted in commercial buildings. In addition, it uses thehistorical mean outdoor temperature which is available to
Ž Ž ..designers and engineers. Griffiths’ equation Eq. 1 isused to calculate comfort temperatures until the less cau-
Ž .tious Eq. 1a has been verified.ŽIt can be used to calculate the design indoor or set-
.point temperature T for air-conditioned buildings fromd
records of the monthly mean outdoor temperature T :olt
T s18.5q0.36T . 6Ž .d olt
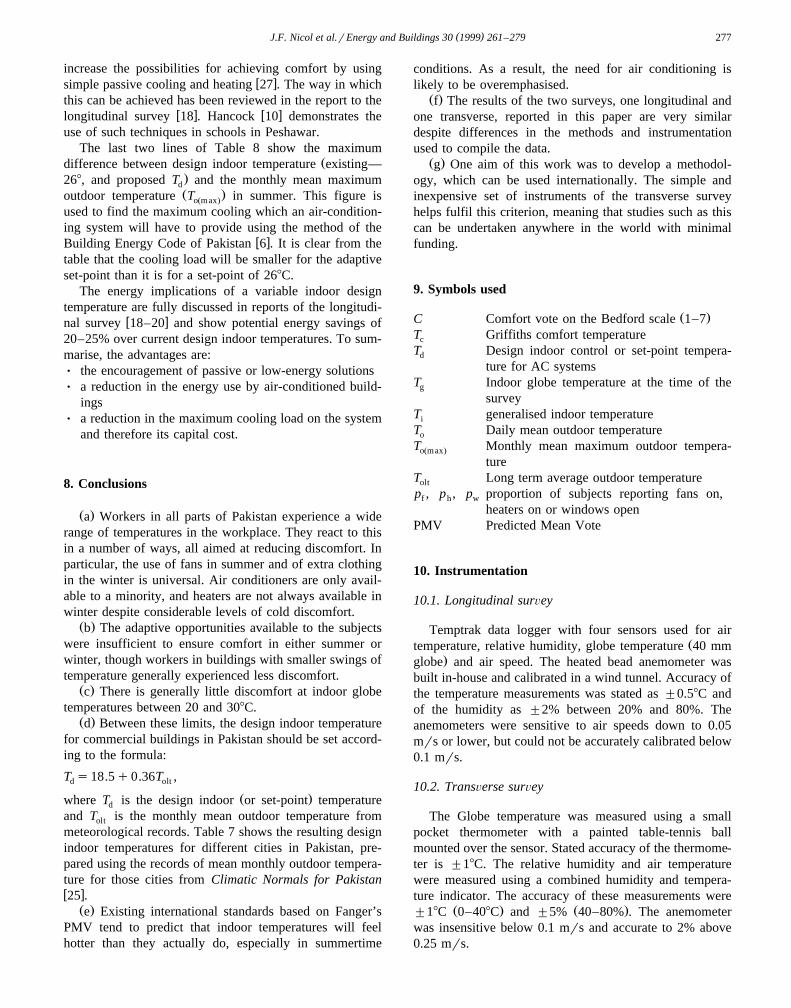
Table 8 shows the design indoor temperatures calcu-lated for a number of cities in Pakistan.
7.5. Implications of the findings for energy use in buildings
The implication of a variable indoor design tempera-Ž .ture, as shown by Eq. 6 and Table 8 is that well-designed
w xbuildings may reduce the need for air conditioning 2 , and
Table 8Design indoor globe temperature for selected cities in Pakistan. The last two rows give the maximum difference between outdoor air temperature and
Ž .design indoor temperature for the current standard design indoor temperature 268C and for the new adaptive design indoor temperature
Month City
Gilgit Islamabad Karachi Lahore Multan Peshawar Quetta Saidu Sharif
January 19.7 22.1 25.0 23.1 23.1 22.5 20.3 21.5February 20.7 22.9 25.8 24.0 24.0 23.1 20.6 21.9March 22.7 24.6 27.3 25.9 26.1 24.8 22.4 23.4April 24.5 26.6 28.7 28.1 28.4 26.9 24.6 25.5May 25.7 28.4 29.5 29.7 30.2 28.8 26.2 27.4June 27.4 29.7 29.8 30.7 31.3 30.4 27.7 28.8July 28.4 29.2 29.4 29.8 30.7 30.1 28.5 28.8August 28.1 28.8 28.9 29.6 30.4 29.6 28.2 28.3September 26.5 28.2 28.9 29.2 29.7 28.9 26.3 27.4October 24.2 26.6 28.5 27.7 28.0 27.0 23.9 25.8November 21.8 24.4 27.1 25.5 25.6 24.8 22.1 23.7December 20.0 22.7 25.5 23.6 23.6 23.0 20.5 22.1T y26 10.1 12.7 8.4 14.4 16.3 14.4 10.0 10.4oŽm ax.T yT 7.7 9.0 5.0 9.7 11.0 10.0 7.5 7.6oŽm ax. d
( )J.F. Nicol et al.rEnergy and Buildings 30 1999 261–279 277
increase the possibilities for achieving comfort by usingw xsimple passive cooling and heating 27 . The way in which
this can be achieved has been reviewed in the report to thew x w xlongitudinal survey 18 . Hancock 10 demonstrates the
use of such techniques in schools in Peshawar.The last two lines of Table 8 show the maximum
Ždifference between design indoor temperature existing—.268, and proposed T and the monthly mean maximumdŽ .outdoor temperature T in summer. This figure isoŽmax.
used to find the maximum cooling which an air-condition-ing system will have to provide using the method of the
w xBuilding Energy Code of Pakistan 6 . It is clear from thetable that the cooling load will be smaller for the adaptiveset-point than it is for a set-point of 268C.
The energy implications of a variable indoor designtemperature are fully discussed in reports of the longitudi-
w xnal survey 18–20 and show potential energy savings of20–25% over current design indoor temperatures. To sum-marise, the advantages are:Ø the encouragement of passive or low-energy solutionsØ a reduction in the energy use by air-conditioned build-
ingsØ a reduction in the maximum cooling load on the system
and therefore its capital cost.
8. Conclusions
Ž .a Workers in all parts of Pakistan experience a widerange of temperatures in the workplace. They react to thisin a number of ways, all aimed at reducing discomfort. Inparticular, the use of fans in summer and of extra clothingin the winter is universal. Air conditioners are only avail-able to a minority, and heaters are not always available inwinter despite considerable levels of cold discomfort.
Ž .b The adaptive opportunities available to the subjectswere insufficient to ensure comfort in either summer orwinter, though workers in buildings with smaller swings oftemperature generally experienced less discomfort.
Ž .c There is generally little discomfort at indoor globetemperatures between 20 and 308C.
Ž .d Between these limits, the design indoor temperaturefor commercial buildings in Pakistan should be set accord-ing to the formula:
T s18.5q0.36T ,d olt
Ž .where T is the design indoor or set-point temperatured
and T is the monthly mean outdoor temperature fromolt
meteorological records. Table 7 shows the resulting designindoor temperatures for different cities in Pakistan, pre-pared using the records of mean monthly outdoor tempera-ture for those cities from Climatic Normals for Pakistanw x25 .
Ž .e Existing international standards based on Fanger’sPMV tend to predict that indoor temperatures will feelhotter than they actually do, especially in summertime
conditions. As a result, the need for air conditioning islikely to be overemphasised.
Ž .f The results of the two surveys, one longitudinal andone transverse, reported in this paper are very similardespite differences in the methods and instrumentationused to compile the data.
Ž .g One aim of this work was to develop a methodol-ogy, which can be used internationally. The simple andinexpensive set of instruments of the transverse surveyhelps fulfil this criterion, meaning that studies such as thiscan be undertaken anywhere in the world with minimalfunding.
9. Symbols used
Ž .C Comfort vote on the Bedford scale 1–7T Griffiths comfort temperaturec
T Design indoor control or set-point tempera-d
ture for AC systemsT Indoor globe temperature at the time of theg
surveyT generalised indoor temperaturei
T Daily mean outdoor temperatureo
T Monthly mean maximum outdoor tempera-oŽmax.ture
T Long term average outdoor temperatureolt
p , p , p proportion of subjects reporting fans on,f h w
heaters on or windows openPMV Predicted Mean Vote
10. Instrumentation
10.1. Longitudinal surÕey
Temptrak data logger with four sensors used for airŽtemperature, relative humidity, globe temperature 40 mm
.globe and air speed. The heated bead anemometer wasbuilt in-house and calibrated in a wind tunnel. Accuracy ofthe temperature measurements was stated as "0.58C andof the humidity as "2% between 20% and 80%. Theanemometers were sensitive to air speeds down to 0.05mrs or lower, but could not be accurately calibrated below0.1 mrs.
10.2. TransÕerse surÕey
The Globe temperature was measured using a smallpocket thermometer with a painted table-tennis ballmounted over the sensor. Stated accuracy of the thermome-ter is "18C. The relative humidity and air temperaturewere measured using a combined humidity and tempera-ture indicator. The accuracy of these measurements were
Ž . Ž ."18C 0–408C and "5% 40–80% . The anemometerwas insensitive below 0.1 mrs and accurate to 2% above0.25 mrs.
( )J.F. Nicol et al.rEnergy and Buildings 30 1999 261–279278
Acknowledgements
The authors would like to acknowledge the support ofŽ .the Overseas Development Administration now DFID for
this research project. Rev. Michael Humphreys has madeuseful comments and suggestions throughout this work.We have to thank Dr. Q.Z. Chaudhary, DG, PakistanMeteorological Department and A.Q. Khan, Director,
Appendix A
( )J.F. Nicol et al.rEnergy and Buildings 30 1999 261–279 279
CDPC, for providing outdoor climatic data. We are grate-ful to the local researchers in Pakistan for their excellentwork over a whole year and we would especially like tothank the 36 subjects in the first survey and the 846subjects in the second survey and to their employers whopermitted them to take part.
References
w x1 ASHRAE, ASHRAE Standard 55-1992, Thermal environment forhuman comfort, ASHRAE, Atlanta, USA, 1992.
w x2 A. Auliciems, Air-conditioning in Australia: III. Thermobile con-Ž . Ž .trols, Arch Science Review 33 2 1990 .
w x3 A. Auliciems, R. deDear, Air conditioning in Australia: I. HumanŽ .thermal factors, Arch Science Review 29 1986 67–75.
w x4 N.V. Baker, M.A. Standeven, A behavioural approach to thermalcomfort assessment in naturally ventilated buildings, ProceedingsCIBSE National Conference, Eastbourne, Chartered Institution ofBuilding Services Engineers, London, 1995, pp. 76–84.
w x5 R. deDear, G. Brager, Developing an adaptive model of thermalŽ .comfort and preference, in: Geshwiler Ed. , Field studies of thermal
Ž .comfort and adaptation, ASHRAE Technical data bulletin 14 1 ,ASHRAE, Atlanta, USA, 1998.
w x6 ENERCON, Building Energy Code of Pakistan and ComplianceHandbook to the Building Energy Code of Pakistan, National En-
Ž .ergy Conservation Centre ENERCON , Government of Pakistan,Islamabad, 1990.
w x7 P.O. Fanger, Thermal Comfort Danish Technical Press, Copen-hagen, 1970.
w x8 M.E. Fountain, C. Huizenga, Wincomf: a windows 3.1 thermalsensation model—users manual, Environmental Analytics, Berkeley,USA, 1996.
w x9 I. Griffiths, Thermal comfort studies in buildings with passive solarfeatures; field studies, report to the Commission of the EuropeanCommunity, ENS35 090 UK, 1990.
w x10 M. Hancock, Passive thermal design strategies for improved thermalcomfort in schools in Pakistan, Proc. CIBSE National conference’98 Bournemouth, Chartered Institution of Building Services Engi-neers, London, 1998, pp. 315–325.
w x11 M.A. Humphreys, Field studies of thermal comfort compared andŽ .applied, Building Services Engineer 44 1976 .
w x12 M.A. Humphreys, Outdoor temperatures and comfort indoors, Build-Ž . Ž .ing Research and Practice 6 2 1978 92–95.
w x13 M.A. Humphreys, Personal communication, in preparation for publi-cation, 1998.
w x14 ISO, International Standard 7730, moderate thermal environ-ments—determination of the PMV and PPD indices and specifica-tion of the conditions for thermal comfort, International StandardsOrganisation, Geneva, Switzerland, 1994.
w x15 F.K. Khan, Environment, People and Economy, Oxford Univ. Press,Oxford, UK, 1991.
w x16 McCullough, Jones, Huck, A comprehensive data base for estimat-Ž . Ž .ing clothing insulation, ASHRAE Trans. 91 24 1985 29–34.
w x17 J.F. Nicol, Thermal Comfort: A Handbook for Field Studies Towardan Adaptive Model, University of East London, 1993.
w x18 J.F. Nicol, G.N. Jamy, O. Sykes, M.A. Humphreys, S.C. Roaf, M.Hancock, A survey of thermal comfort in Pakistan toward newindoor temperature standards, Oxford Brookes University, Oxford,UK, 1994.
w x19 J.F. Nicol, Some like it hot, comfort and energy in Pakistan, Proc.European Conference on Energy Performance and Indoor Climate inBuildings, Lyon, November 1994.
w x20 J.F. Nicol, I.A. Raja, Thermal comfort, time and posture: explo-rations of the nature of adaptive thermal comfort, Oxford BrookesUniversity, Oxford, UK, 1996.
w x21 J.F. Nicol, I.A. Raja, Thermal comfort in Pakistan: II. Towards newindoor temperature, School of Architecture, Oxford Brookes Univer-sity, 1997.
w x22 J.F. Nicol, S.C. Roaf, Pioneering new indoor temperature standards:Ž .the Pakistan Project, Energy and Buildings 23 1996 169–174.
w x23 F. Nicol, M. Humphreys, Some simple physiological indicators infield studies of thermal comfort, Paper to the 39th meeting of theClimatic Physiology Group, Loughborough University, UK, 1998.
w x24 B.W. Olesen, Y. Hasebe, R.J. de Dear, Clothing insulation asymme-Ž . Ž .try and thermal comfort, ASHRAE Trans. 94 1 1988 32–52.
w x25 PMD, Climatic Normals of Pakistan 1961–1990, Pakistan Meteorol-ogy Department, Karachi, 1993.
w x26 I.A. Raja, Solar Energy Resources of Pakistan, Oxford BrookesUniversity, Oxford, UK, 1996.
w x27 S.C. Roaf, Natural ventilation of buildings in India, Contribution tothe international design workshop ‘Sustainability through climati-cally responsive low energy architecture’, School of Planning andArchitecture, New Delhi, 1995.
w x28 K.M. Shamshad, The Meteorology of Pakistan, Royal Book Karachi,Pakistan, 1988.
w x29 S. Tanabe, Importance of clothing for passive cooling effects, Proc.PLEA 1997, pp. 9-14.