costs of integration for wind and solar energygy g: large-scale
TRANSCRIPT
Costs of Integration for Wind and Solar Energy: Large-scale studies and gy gimplications
MIT Wind Integration Workshop
Michael Milligan, Ph.D.
National Renewable Energy Laboratory
Jan 21, 2011Jan 21, 2011
NREL is a national laboratory of the U.S. Department of Energy, Office of Energy Efficiency and Renewable Energy, operated by the Alliance for Sustainable Energy, LLC.

Topics
Large-scale integration studies:Western Wind and Solar Integration StudyWestern Wind and Solar Integration Study Eastern Wind Integration and Transmission Study
What does it take to integrate variable generation (wind and solar)?(wind and solar)?
Wind and solar integration cost issuesWind and solar integration cost issues
National Renewable Energy Laboratory Innovation for Our Energy Future

Large-scale wind integration studies: WWSIS and EWITS
• Managed by NREL – large project teams• Western Wind and Solar Integration Study, inWestern Wind and Solar Integration Study, in
collaboration with WestConnect• Eastern Wind Integration and Transmission g
Study, in collaboration with the Joint Coordinated System Plan and Midwest I d d S OIndependent System Operator
National Renewable Energy Laboratory Innovation for Our Energy Future3
WWSIS www.nrel.gov/wwsis
• Large team, Debbie Lew project manager• NREL, GE Energy, 3Tier, Northern ArizonaNREL, GE Energy, 3Tier, Northern Arizona
University, Exeter, SUNY• Project partner: WestConnectj p• Large stakeholder group• Technical Review Committee
National Renewable Energy Laboratory Innovation for Our Energy Future

Overview
Goal – To understand the costs and
operating impacts due to the variability and uncertainty ofvariability and uncertainty of wind, PV and concentrating solar power (CSP) on the WestConnect grid
UtilitiUtilities– Arizona Public Service– El Paso Electric
NV E– NV Energy– Public Service of New Mexico– Salt River Project
Tri State G&T– Tri-State G&T– Tucson Electric Power– Xcel Energy– WAPA
National Renewable Energy Laboratory Innovation for Our Energy Future5
WAPA
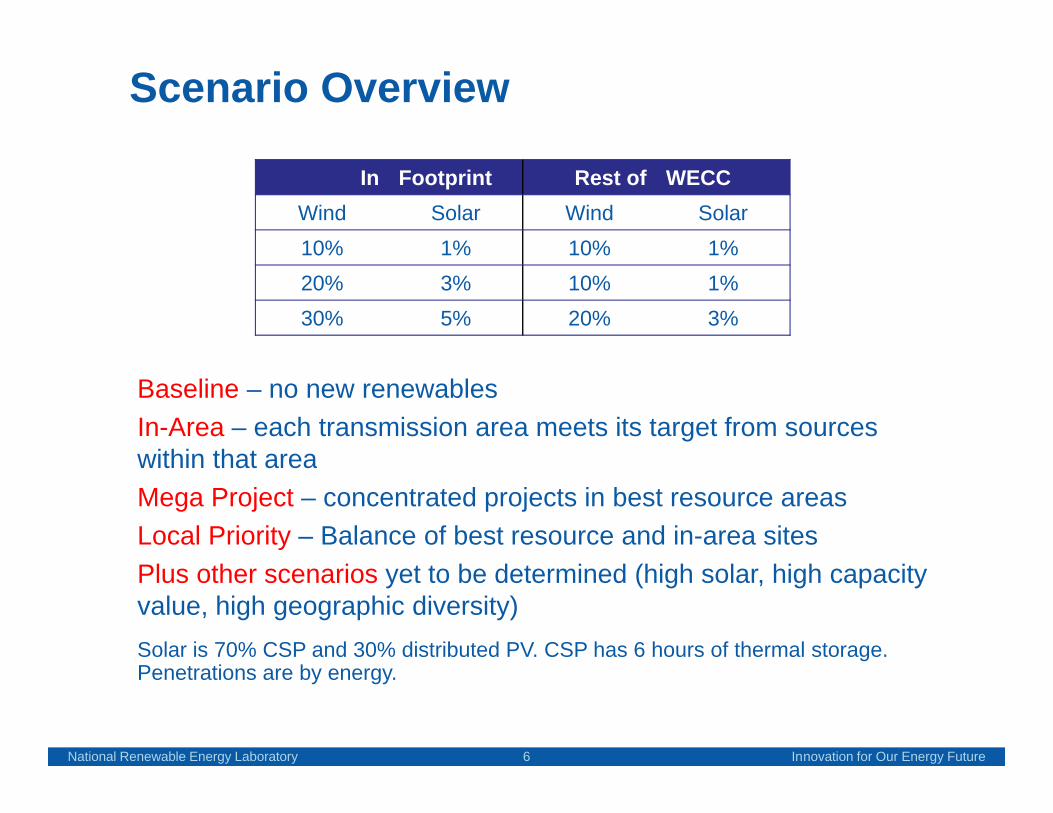
Scenario Overview
In Footprint Rest of WECCWind Solar Wind Solar10% 1% 10% 1%10% 1% 10% 1%20% 3% 10% 1%30% 5% 20% 3%
Baseline – no new renewablesIn-Area – each transmission area meets its target from sources within that areawithin that areaMega Project – concentrated projects in best resource areasLocal Priority – Balance of best resource and in-area sitesPlus other scenarios yet to be determined (high solar, high capacity value, high geographic diversity)Solar is 70% CSP and 30% distributed PV. CSP has 6 hours of thermal storage.
National Renewable Energy Laboratory Innovation for Our Energy Future
Penetrations are by energy.
6

Study Area Monthly Energy from Wind and Solar for 2004 – 2006 (30% In Area Scenario)
Study Area Total Monthly Wind and Solar Energy for 2004 2006Study Area Total Monthly Wind and Solar Energy for 2004 - 2006
8000
10000
12000
Wh)
05
06
4000
6000
Tota
l Ene
rgy
(GW 04
Study Area Percent Monthly Wind and Solar Energy for 2004 - 2006
0
2000
Jan Feb Mar Apr May Jun Jul Aug Sep Oct Nov Dec
Study Area Percent Monthly Wind and Solar Energy for 2004 2006
40%
50%
60%
ergy
55% of energy from wind and
solar
30% is not always
10%
20%
30%
% o
f Loa
d E
ne 30%
National Renewable Energy Laboratory Innovation for Our Energy Future
0%
10%
Jan Feb Mar Apr May Jun Jul Aug Sep Oct Nov DecMonth of Year
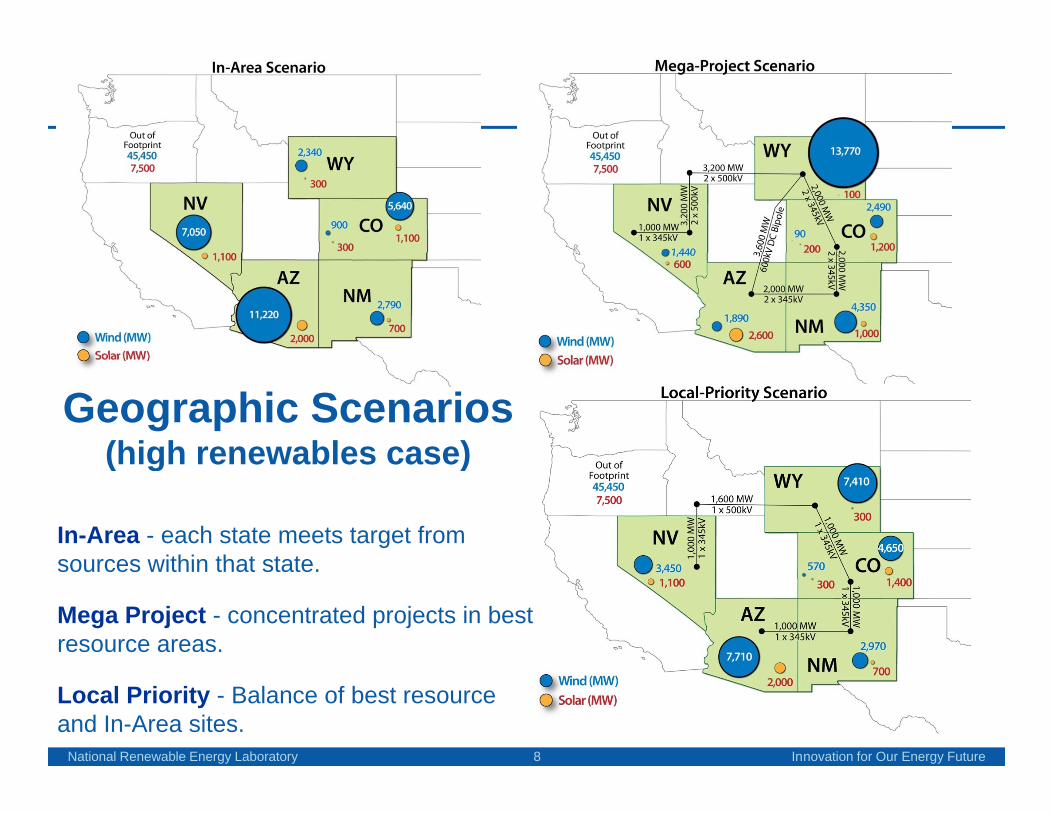
Geographic Scenarios(high renewables case)(high renewables case)
In-Area - each state meets target from sources within that statesources within that state.
Mega Project - concentrated projects in best resource areas.
National Renewable Energy Laboratory Innovation for Our Energy Future8
Local Priority - Balance of best resource and In-Area sites.

Wind data
• 3TIER Group ran weather model to recreate weather for 2004, 2005, 2006
• 10 minute wind power output for 960power output for 960 GW of wind sites in WECC. Po er profiles ere• Power profiles were based on VestasV90 3MW turbine at 100 h i ht100m height.
• Hourly day-ahead power output
National Renewable Energy Laboratory Innovation for Our Energy Future
forecasts.

How does the system operate in the high renewables case?
Mid JulyMid‐July Load
The operator formerly managed to load but now has to manage the net load.
Net Load = Load ‐Wind ‐ Solar
National Renewable Energy Laboratory Innovation for Our Energy Future10
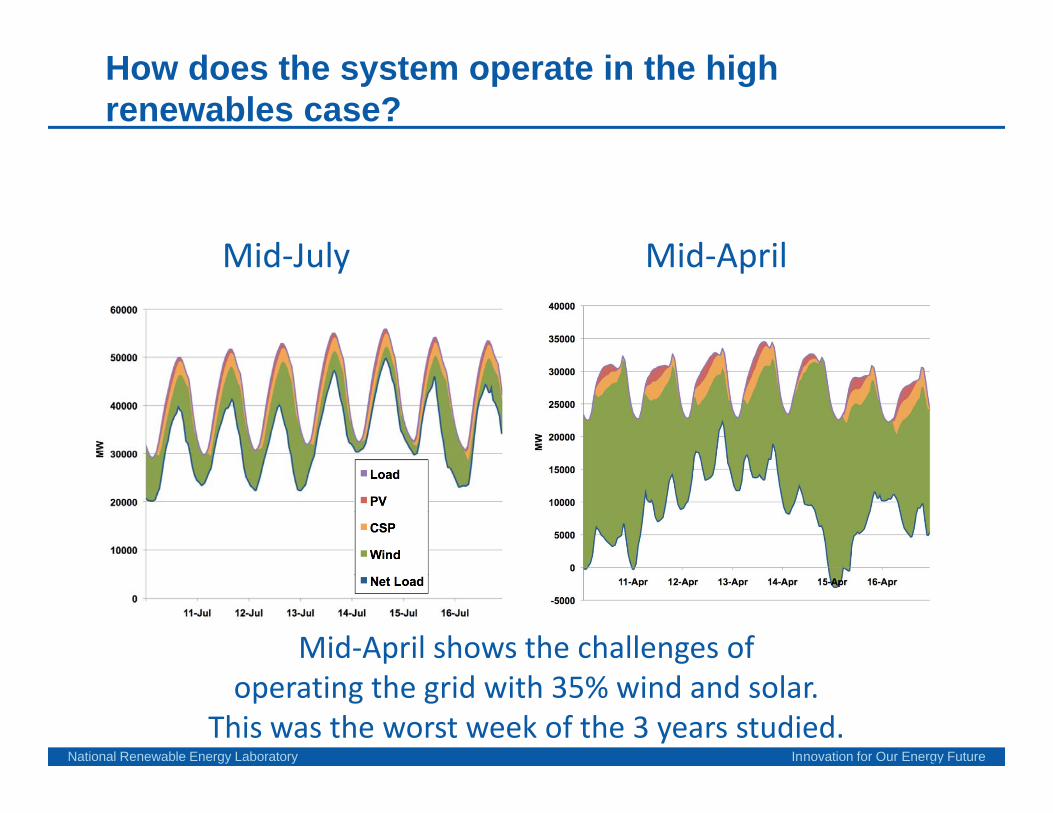
How does the system operate in the high renewables case?
Mid July Mid AprilMid‐July Mid‐April
Mid‐April shows the challenges of
National Renewable Energy Laboratory Innovation for Our Energy Future11
p goperating the grid with 35% wind and solar.
This was the worst week of the 3 years studied.
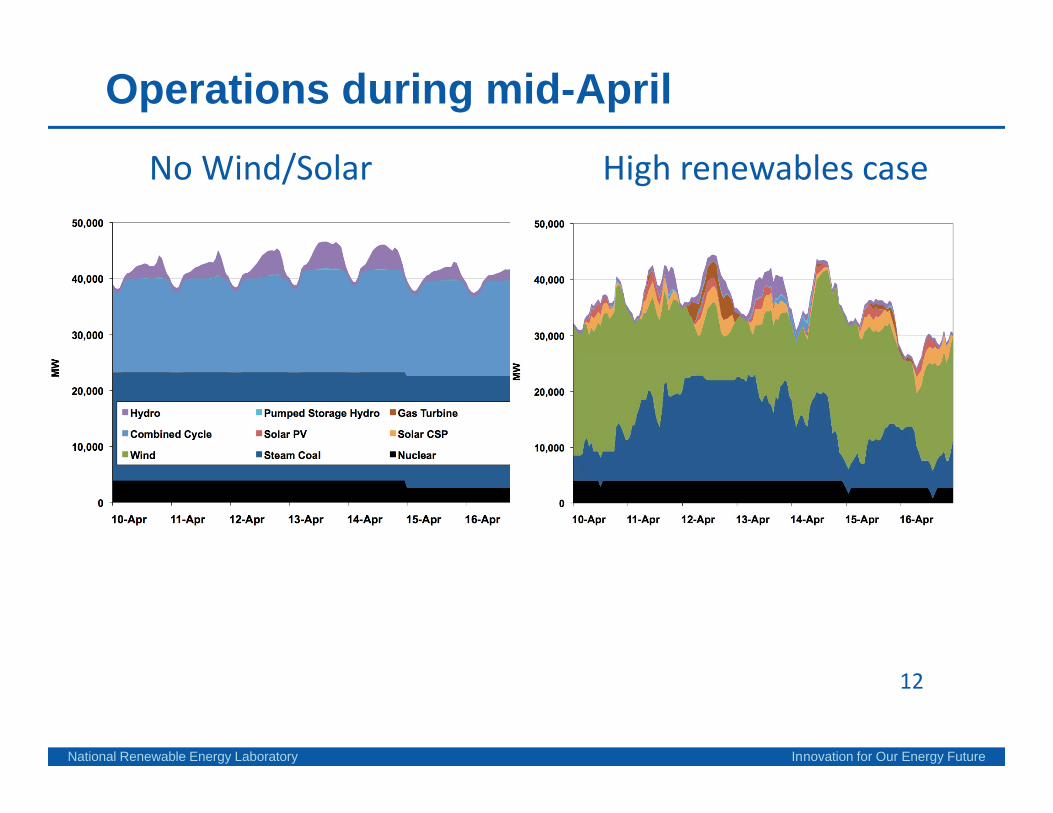
Operations during mid-April
No Wind/Solar High renewables case
National Renewable Energy Laboratory Innovation for Our Energy Future
12
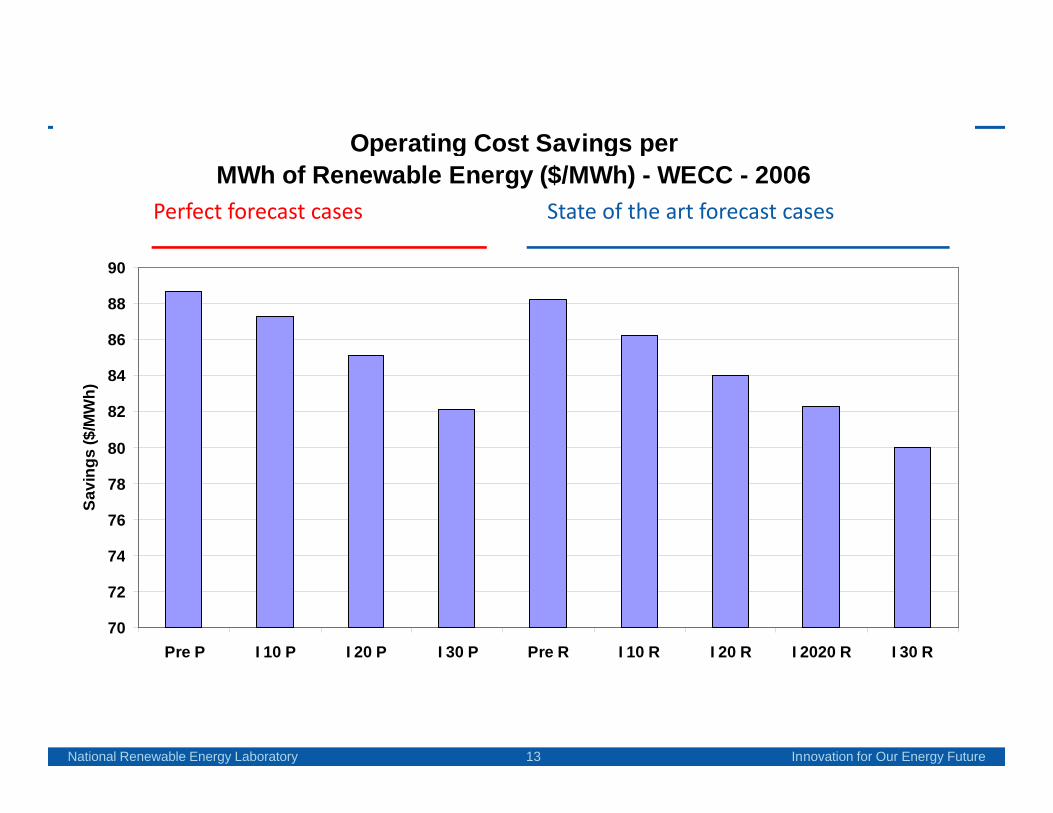
Operating Cost Savings perOperating Cost Savings per MWh of Renewable Energy ($/MWh) - WECC - 2006
Perfect forecast cases State of the art forecast cases
86
88
90
80
82
84
s ($
/MW
h)
74
76
78
Savi
ng
70
72
74
Pre P I 10 P I 20 P I 30 P Pre R I 10 R I 20 R I 2020 R I 30 R
National Renewable Energy Laboratory Innovation for Our Energy Future13

EWITS www.nrel.gov/ewits
• Built on Joint Coordinated System Plan• Large project team, Dave Corbus projectLarge project team, Dave Corbus project
manager• NREL, MISO, EnerNex, AWS True Power,
University of Stuttgart, Riso (stochastic model)• Representation from RTOs/ISOs, utilities
T h i l R i C itt• Technical Review Committee
National Renewable Energy Laboratory Innovation for Our Energy Future

What is Needed to Integrate 20% Wind in the Eastern Interconnection?
• Evaluate the power system operating impacts and transmission associated with increasing windassociated with increasing wind energy to 20% and 30%
• Impacts include operating with the variability andwith the variability and uncertainty of wind
• Build upon prior wind integration studies and related technical work;studies and related technical work;
• Coordinate with current regional power system study work;
P d i f l b dl• Produce meaningful, broadly supported results
• Technical Review Committee
National Renewable Energy Laboratory Innovation for Our Energy Future

EWITS Analysis Provides Detailed Information on
• Wind generation required to produce 20% and 30% of the projected electric energy demand over the U.S. portion of the Eastern Interconnection in 2024
• Transmission concepts for delivering energy economically for each scenarioeconomically for each scenario
• Economic sensitivity simulations of the hourly operation of the power system with windoperation of the power system with wind generation, future market structures and transmission overlay
• The contribution made by wind generation to resource adequacy and planning capacity margin
National Renewable Energy Laboratory Innovation for Our Energy Future

Scenario 1: 20% high capacity factor Scenario 2: Hybrid w/off-shore
Scenario 3: 20% local, aggressive offshore Scenario 4: 30% aggressive
National Renewable Energy Laboratory Innovation for Our Energy Future

National Renewable Energy Laboratory Innovation for Our Energy Future
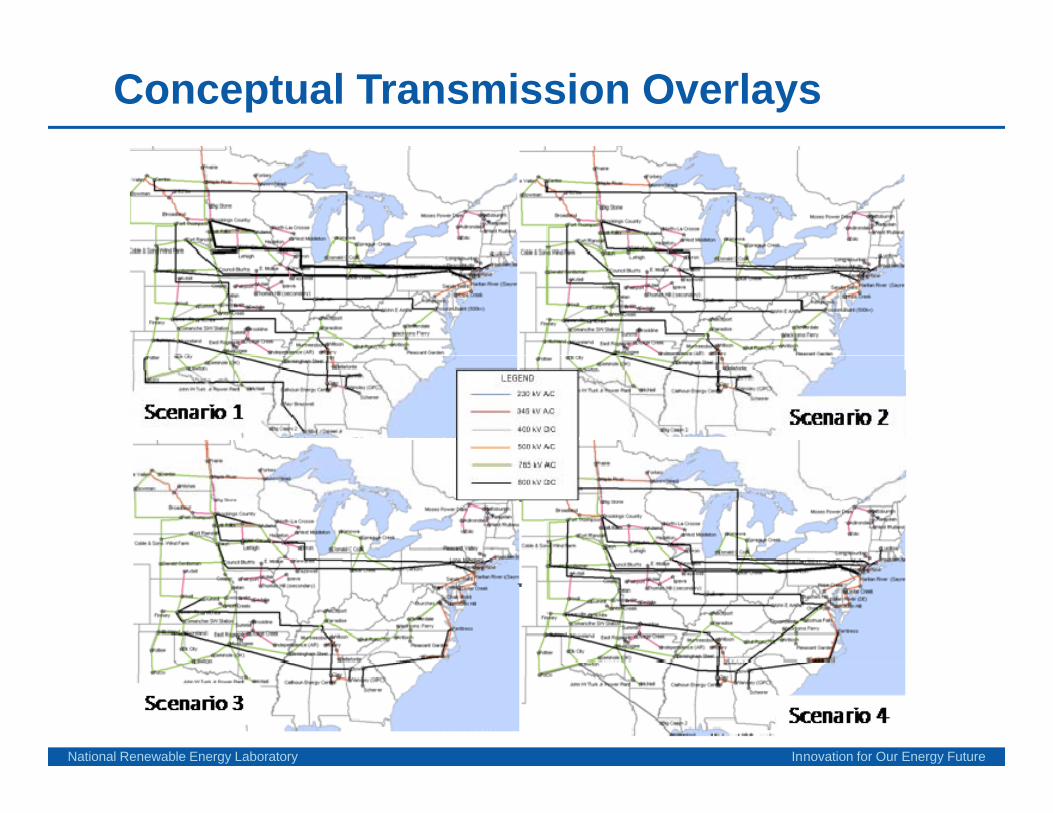
Conceptual Transmission Overlays
National Renewable Energy Laboratory Innovation for Our Energy Future
Transmission - Why are We Always Jumping Through Hoops
National Renewable Energy Laboratory Innovation for Our Energy Future
Key Task – Wind Integration
• ApproachH l i l ti f ti l l i d• Hourly simulation of operational planning and power system operation using PROMOD• Synchronized wind and loadSynchronized wind and load
• Day-ahead unit commitment and scheduling based on load and windscheduling based on load and wind generation forecasts• Real-time operations (hourly• Real-time operations (hourly
simulations)• Operational structures
National Renewable Energy Laboratory Innovation for Our Energy Future
• Operational structures

Assumed operational structure for the Eastern Interconnection in 2024 (white circles represent ( pbalancing authorities)
National Renewable Energy Laboratory Innovation for Our Energy Future

Additional Reserve Requirements by Region and Scenario
7000
6000
7000
uiremen
t
4000
5000
gulation
Req
MW)
Load Only
Reference Case
Scenario 1
2000
3000
e Hou
rly Reg (M
Scenario 1
Scenario 2
Scenario 3
Scenario 4
0
1000
Average
MISO ISO‐NE NYISO PJM SERC SPP TVA
Operating Region
Increased reserve does not imply increased installed or committed capacity over and
National Renewable Energy Laboratory Innovation for Our Energy Future
Increased reserve does not imply increased installed or committed capacity over and above the no-wind case. It implies some generation that would be used for energy in the no-wind case is now used for reserve (or possibly different mix of units in the stack).

Total Annualized Scenario Costs
180,000
200,000
)
140,000
160,000
,
2009
USD
M$)
WindCapital Cost
80 000
100,000
120,000
nario Co
st (2
Wind Capital Cost
New Generation Capital Cost
Transmission Cost
Integration Cost
40,000
60,000
80,000
nualized
Sce
g
Wind Operational Cost
Production cost
‐
20,000
Reference Scenario 1 Scenario 2 Scenario 3 Scenario 4
Ann
National Renewable Energy Laboratory Innovation for Our Energy Future
e e e ce Sce a o Sce a o Sce a o3 Sce a o

EWITS Conclusions
• 20 and 30% wind penetrations are technically feasible with significant expansion of the transmission i f t tinfrastructure.– New transmission will be required for all the future wind
scenarios in the Eastern Interconnection
• Without transmission enhancements, substantial curtailment of wind generation will occurInterconnection ide costs for integrating large amo nts• Interconnection-wide costs for integrating large amounts of wind generation are manageable with large regional operating pools, where benefits of load and wind diversity can be exploited and large numbers of supply resources are efficiently committed and dispatched.
National Renewable Energy Laboratory Innovation for Our Energy Future
EWITS Conclusions
• Transmission helps reduce the impacts of the variability of the wind and….y• Reduces wind integration costs• Reduces need for building conventional generation
I li bilit f th l t i l id• Increases reliability of the electrical grid• Helps make more efficient use of the available generation
resources • Costs for aggressive expansions of the existing grid
are significant, but they make up a relatively small i f th t t l li d t i f thpiece of the total annualized costs in any of the
scenarios studied• Wind generation displaces carbon based fuels
National Renewable Energy Laboratory Innovation for Our Energy Future
• Wind generation displaces carbon-based fuels, directly reducing carbon dioxide (CO2) emissions

What is needed for large-scale integration g gof wind and solar?
National Renewable Energy Laboratory Innovation for Our Energy Future

TechnicalTechnical
National Renewable Energy Laboratory Innovation for Our Energy Future28

Physical Sources of Flexibility
Alternative generation mix with more flexibilityy
– Less base-load (or modified for flexibility)
– Aero derivative/fast-response turbines (GE, Siemens)
– Reciprocating engines (Wartsilla)(Wartsilla)
– Pumped storageWind/solar provide regulationResponsive loadElectric vehiclesForecasting
Courtesy: WindLogics, Inc. St. Paul, MN
National Renewable Energy Laboratory Innovation for Our Energy Future
Forecasting
29
InstitutionalInstitutional
National Renewable Energy Laboratory Innovation for Our Energy Future30

Energy scheduling rules and other institutional factorsinstitutional factors
• Transmission protocols/scheduling inprotocols/scheduling in the Western Interconnection
• Fast energy markets• Ancillary services market
(and possible new AS)(and possible new AS)• Smarter about reserves• Smarter about wind
i
forecasts and how to use/visualize them
www.osei.noaa.gov
National Renewable Energy Laboratory Innovation for Our Energy Future31

Smarter Transmission Usage
National Renewable Energy Laboratory Innovation for Our Energy Future32

Non-spin and Supplemental reserves are 10 to 20 times cheaper than regulation and better match wind ramping characteristicscharacteristics
2002 2003 2004 2005 2006 2007 2008 Annual Average $/MW-hr
California (Reg = up + dn) ( g p )Regulation 26.9 35.5 28.7 35.2 38.5 26.1 33.4
Spin 4.3 6.4 7.9 9.9 8.4 4.5 6.0 Non-Spin 1.8 3.6 4.7 3.2 2.5 2.8 1.3
Replacement 0.90 2.9 2.5 1.9 1.5 2.0 1.4Replacement 0.90 2.9 2.5 1.9 1.5 2.0 1.4ERCOT (Reg = up + dn)
Regulation 16.9 22.6 38.6 25.2 21.4 43.1 Responsive 7.3 8.3 16.6 14.6 12.6 27.2
Non-Spin 3.2 1.9 6.1 4.2 3.0 4.4Non Spin 3.2 1.9 6.1 4.2 3.0 4.4New York
Regulation 18.6 28.3 22.6 39.6 55.7 56.3 59.5 Spin 3.0 4.3 2.4 7.6 8.4 6.8 10.1
Non Spin 1 5 1 0 0 3 1 5 2 3 2 7 3 1Non Spin 1.5 1.0 0.3 1.5 2.3 2.7 3.130 Minute 1.2 1.0 0.3 0.4 0.6 0.9 1.1
New England (Reg +”mileage”) Regulation 54.64 30.22 22.26 12.65 13.75
Spin 0 27 0 41 1 67
National Renewable Energy Laboratory Innovation for Our Energy Future
National Renewable Energy Laboratory Innovation for Our
Spin 0.27 0.41 1.6710 Minute 0.13 0.34 1.21 30 Minute 0.01 0.09 0.06

Larger Balancing Areas (real or virtual)
500
1000
r)
Operating separate balancing areas causes extra ramping compared to combined operations. Blue: up-rampGreen: down-rampYellow: combined ramp
-500
0
Ram
p (M
W/h
-1000
500
ing
(MW
/hr)
Some areas are ramping up nearly 1000 MW/hr while other areas are ramping down nearly 500 MW/hr
-200
0
200
400
Exc
ess
Ram
p
Ramping that could be eliminated by combining operations
53045298529252865280Hour of Year (one day)
-400
200
National Renewable Energy Laboratory Innovation for Our Energy Future34
Kirby, B.; Milligan, M. (2008). Impact of Balancing Area Size, Obligation Sharing, and Energy Markets on Mitigating Ramping Requirements in Systems with Wind Energy. Wind Engineering. Vol. 32(4), 2008; pp. 399‐414;

Inter-BA Scheduling and Communication
800
600
400
200Gen
erat
ion
(MW
)
One Week
0
Win
d
200
-200
0
ast E
rror
(MW
)
-400
Fore
ca
48.248.047.847.647.4
x103
Wind Energy 30-minute forecast error 10-minute forecast error 2-hour persistence forecast error
Milligan and Kirby (2009) Capacity Requirements to Support Inter Balancing Area Wind Delivery 29 pp ; NREL
806080408020800079807960794079207900
-600
National Renewable Energy Laboratory Innovation for Our Energy Future
Milligan and Kirby (2009). Capacity Requirements to Support Inter‐Balancing Area Wind Delivery. 29 pp.; NREL Report No. TP‐550‐46274, and An Examination of Capacity and Ramping Impacts of Wind Energy on Power Systems, Kirby & Milligan, ElecJ Aug./Sept. 2008, Vol. 21, Issue 7, pp 30‐42
35

Better use of existing flexibility
• Tap into maneuverable generation that may be “behind the wall”1 4000%
5000%
oad
Nee
d CA ISO PJM WAPA 42,400 55,600 3,087 MW Peak Load Generation 21,900 47,000 2,911 Fossil (measured)behind the wall
• Provide a mechanism (market, contract, other) that benefits system operator and 2000%
3000%
4000%
Ram
ping
Cap
acity
vs
Lo
PJM
13,100 2,500 700 Hydro 4,600 13,500 0 Nuclear 3,700 600 11 Other 2002 Hourly Data and Generation Capacity
WAPAbenefits system operator and generator/loads
• Fast energy markets help provide needed flexibility2 0%
1000%
Mea
sure
d Fo
ssil
R
CA ISO
provide needed flexibility2 and can often supply load following flexibility at no cost3
0 2000 4000 6000 8000
Hours/Year
Generators and loads should be able to participate in these markets equally
1Kirby & Milligan, 2005 Methodology for Examining Control Area Ramping Capabilities with Implications for Wind http://www.nrel.gov/docs/fy05osti/38153.pdf2Kirby &Milligan, 2008 Facilitating Wind Development: The Importance of Electric Industry Structure.
participate in these markets equally
National Renewable Energy Laboratory Innovation for Our Energy Future36
Kirby & Milligan, 2008 Facilitating Wind Development: The Importance of Electric Industry Structure. http://www.nrel.gov/docs/fy08osti/43251.pdf3Milligan & Kirby 2007, Impact of Balancing Areas Size, Obligation Sharing, and Ramping Capability on Wind Integration . http://www.nrel.gov/docs/fy07osti/41809.pdf

Do Markets Incent Flexibility?
Short-run– Ramp products
3200
Energy Price $10 /MW hE nergy Price $10 /MW hE nergy Price Increases
to $90/MW h becausebase unit can't rampp p
necessary to supplement energy markets?
3000
2800
Pea king -$90/MW h
fast en ough
– Low LMPs and capital cost recovery
2600
Long-run– Do prices induce
long-term
2400
4:00 AM 6:00 AM 8:00 AM 10:00 AM 12:00 P M 2:00 PM 4:00 PM 6:00 PM
Base Load - $10 /MW h
long term development of flexible supply/loads?
National Renewable Energy Laboratory Innovation for Our Energy Future
pp y
37

Integration CostsIntegration Costs
National Renewable Energy Laboratory Innovation for Our Energy Future

Integration cost of wind and solarC it b d? 100 103
10
• Can it be measured?• If so, how is it defined?• What is proper benchmark
it?
100x103
50
0
-50Del
ta M
arke
t Val
ue ($
)
-5
0
5
Over or U
nder-estim
(Flat block value) - (wind value)
unit?• How are cost and value
untangled?What about units in one
0
20
40
et V
alue
($)
-10
mate of W
ind Value ($/MW
h)
0
5
10
Daily flat energy block ($52.33/MWh) Daily flat block difference $/MWh (right) 6-Hour flat energy block ($48.59/MWh) 6_Hour flat energy block difference $/MWh (right)
(Wind: $48.98/MWh)
• What about units in one region that economically respond to needs in another region?
160140120100806040200
-80x103
-60
-40
-20
Del
ta M
arke
-10
-5
0
g• Are there integration costs for
other units?– Do all AGC units follow the
i l?
Milligan, M.; Kirby, B. (2009). Calculating Wind Integration Costs: Separating Wind Energy Value from Integration Cost Impacts. 28 pp.; NREL Report No. TP‐550‐46275. http://www nrel gov/docs/fy09osti/46275 pdfsignal?
– Are there efficiency costs of adding conventional generators?
http://www.nrel.gov/docs/fy09osti/46275.pdf
National Renewable Energy Laboratory Innovation for Our Energy Future
Milligan, M.; Ela, E.; Lew, D.; Corbus, D.; Wan, Y. H. (2010). Advancing Wind Integration Study Methodologies: Implications of Higher Levels of Wind. 50 pp.; NREL Report No. CP‐550‐48944. http://www.nrel.gov/docs/fy10osti/48944.pdf

Not all units can follow AGC2 l it h diff t bilit f f ll i AGC2 coal units show very different ability of following AGC.Unit on the right increases the need for regulation on the system by 31 MWsystem by 31 MW
720
740
STED
T (M
W)
ACTUAL440
450
ESTE
DT
(MW
)
ACTUAL
660
680
700
CTU
AL
AN
D R
EQU
EN
ERAT
OR
OU
TPU
T
AGC SIGNAL410
420
430
CTU
AL
AN
D R
EQU
EEN
ERAT
OR
OU
TPU
T
31 MW
97094A
620
640
0 15 30 45 60
TIME (minutes)
AC
GEN
AGC SIGNAL
97094
390
400
0 15 30 45 60
TIME (minutes)A
CG
E
AGC SIGNAL
National Renewable Energy Laboratory Innovation for Our Energy Future
Milligan, M.; Ela, E.; Lew, D.; Corbus, D.; Wan, Y. H. (2010). Advancing Wind Integration Study Methodologies: Implications of Higher Levels of Wind. 50 pp.; NREL Report No. CP‐550‐48944. http://www.nrel.gov/docs/fy10osti/48944.pdf

Integration cost of wind
• Large nuclear units set the contingency reserve obligation for power pools, resulting in real g gcosts
• When any new generator is added to the generation mix, it potentially impacts all of the units that are above it in the dispatch stackE l h b l d• Example: new cheap baseload– Units formerly run as base load are pushed up the
stack: lower capacity factors higher cyclingstack: lower capacity factors, higher cycling– More cycling higher O&M costs– Lower capacity factor less revenue
National Renewable Energy Laboratory Innovation for Our Energy Future
p y

Integration costs: wind and solar
Solar and wind integration issues are similar– Wind is becoming reasonably well understood
S l– Solar• PV has high potential for short-term variability from cloud
variations, but the impact of large PV plants is largely unknownunknown
• CSP without storage has some thermal inertia and is likely less variable than PV
• CSP with storage is thought to be much less of an integration• CSP with storage is thought to be much less of an integration challenge but still unknown
Variability and uncertaintyC li ffi iCycling efficiencyAre not unique to wind or solar
National Renewable Energy Laboratory Innovation for Our Energy Future

Large BAGeographically Dispersed Wind and Solar
Wind/Solar Forecasting Effectively Integrated Into System Operations
Accommodating Wind and Solar Integration
Wind/Solar Forecasting Effectively Integrated Into System OperationsSub-Hourly Energy Markets
Fast Access to Neighboring MarketsNonSpinning and 30 Minute Reserves for Wind/Solar Event Response
Regional Transmission Planning For Economics and Reliabilityg g yRobust Electrical Grid
More Flexible Transmission ServiceFlexibility in Generation
Responsive LoadOverall
Example Utility Structures10 8 7 10 7 2 7 6 7 7 3 7 Large RTO with spot markets
6 6 6 3 3 2 6 4 7 2 2 4 Smaller ISO6 6 6 3 3 2 6 4 7 2 2 4 Smaller ISO
1 3 2 1 2 1 2 3 2 2 2 2 Interior west & upper Midwest (non-MISO)
7 6 6 2 2 2 5 4 2 5 2 4 Large vertically integrated utility
1 3 2 1 2 1 2 4 2 2 2 2 Smaller Vertically Integrated Local Utilityy g y
8 Unconstrained hydro system3 Heavily fish constrained hydro system
1 1 1 1 1 1 1 1 1 1 1 11 Weightings Factors
National Renewable Energy Laboratory Innovation for Our Energy Future
Adapted from Milligan, M.; Kirby, B.; Gramlich, R.; Goggin, M. (2009). Impact of Electric Industry Structure on High Wind Penetration Potential. 31 pp.; NREL Report No. TP‐550‐46273. http://www.nrel.gov/docs/fy09osti/46273.pdf

Selected NREL Integration Projects
• Wind wind and solar• Scoping EWITS 2, WWSIS 2• Reserves analysis: UCD, MISO• WECC’s Efficient Dispatch Toolkit• Development of variable time-step production
simulation model (includes AGC)Coal cycling (GE WECC)• Coal cycling (GE, WECC)
• Wind Turbine Frequency control (EPRI, GE, others)others)
• Stochastic unit commitment and forecast error characterization
National Renewable Energy Laboratory Innovation for Our Energy Future

Questions?
45