costs and benefits to business of adopting work life ... · a full systematic review was not...
TRANSCRIPT

EMPLOYMENT RELATIONS
Costs and Benefits to Business of Adopting Work Life Balance Working Practices: A Literature Review
JUNE 2014

Costs and Benefits to Business of Adopting Work Life Balance Working Practices:
A Literature Review
Deborah Smeaton
Kath Ray Genevieve Knight
Policy Studies Institute
Published June 2014


Acknowledgements At the Department for Business Innovation and Skills we would like to thank Kate Millward and Sheila Honey for their guidance, support and valuable feedback on the report.
We would also like to thank Vivienne Stiemens at the Policy Studies Institute for her library support.
i

Contents ACKNOWLEDGEMENTS I
CONTENTS II
TABLES AND FIGURES IV
EXECUTIVE SUMMARY VI
1. INTRODUCTION 1
2. BACKGROUND 2
2.1 Workforce changes 2
2.2 Government Policy 4
2.3 Trends 6
3. AIMS AND OBJECTIVES 8
3.1 Research Questions – Benefits 8
3.2 Research Questions – Costs 8
3.3 Additional research questions 9
4. METHODOLOGY 10
4.1 Search strategy and protocol 10
4.2 Key Challenges 14
4.3 Policy vs practice – a problem with indicators 15
4.4 Methodological approaches – advantages and disadvantages 16
5. WLB: EMPLOYER BENEFITS 18
5.1 Business benefits and causal chains 18
5.2 Benefits of Flexible Working 23
5.3 Maternity, Paternity and Parental Leave, Family Leave and other Childcare Support 44
5.4 Indirect Relationships (mediating role of work-life conflict/enrichment, job satisfaction, engagement and other affective factors) 52
6. WLB – EMPLOYER COSTS 64
6.1 Weighing costs against benefits 64
ii

6.2 Types of cost 66
6.3 Implementation costs 72
6.4 Procedural / administrative costs 75
6.5 Costs of accommodating requests 82
7. RIGHT TO REQUEST LEGISLATION – EVIDENCE OF EFFECTS ON EMPLOYERS AND EMPLOYEES 85
7.1 Patterns in the availability and take-up of flexible working 89
7.2 Requests to work flexibly and their outcomes 93
7.3 Implementation issues 102
7.4 Effects of flexible working requests on employers 108
7.5 Impact of the right to request flexibility overview 120
8. SUMMARY OF FINDINGS AND GAPS IN EVIDENCE 123
8.1 Summarising the benefits evidence - flexible working 123
8.2 Summarising the benefits evidence – family-friendly initiatives 125
8.3 Summarising the benefits evidence – the mediating relationships 127
8.4 Benefits: an overview 128
8.5 Summarising the costs evidence 129
8.6 Costs – an overview 131
8.7 Summarising the evidence on the effect of the right to request flexible working legislation on availability and take-up 132
8.8 Evidence gaps 134
9. REFERENCES 137
APPENDIX 1: QUALITY REVIEW 150
APPENDIX 2: RESEARCH EVIDENCE APPRAISAL TEMPLATE 152
APPENDIX 3: SEARCH TERMS 154
iii

Tables and Figures Figure 2.1: Increased rate of female employment ...................................... 3
Figure 2.2: Increased rate of employment among the over 65s ................. 3
Figure 2.3: Increasing use of part time work .............................................. 7
Figure 4.1: Developing the ‘benefits’ conceptual framework .................... 11
Figure 4.2: The ‘costs’ framework ............................................................ 12
Table 4.1: Relevance scoring ................................................................... 13
Figure 5.1: Emergent WLB/business outcomes conceptual schema ....... 20
Table 5.1: Effect of ‘flexible working and leave arrangements’ on business ................................................................................................................. 30
Table 5.2: Reason given for providing staff with flexible working opportunities............................................................................................. 37
Figure 2a: Emergent WLB/Business outcomes conceptual schema – the affective chain .......................................................................................... 52
Figure 6.1: Differentiating cost types ........................................................ 67
Table 6.1: Reasons given by employers for not allowing flexitime ........... 70
Table 6.2: One-off costs to UK businesses associated with regulatory introduction or amendment....................................................................... 73
Table 6.4: 2005 Recurrent costs to UK businesses associated with regulatory introduction or amendment ...................................................... 77
Table 6.5: Unit costs to UK businesses associated with administering some aspects of employment law ............................................................ 78
Table 6.6: Recurrent costs to UK businesses associated with regulatory introduction or amendment....................................................................... 80
Table 7.2: Percentage of workplaces with some take-up of each form of flexible working in the last 12 months, 2000, 2003 and 2007 ................... 91
iv

Table 7.3: Percentage of employees taking up each form of flexible working in the last 12 months, 2003, 2006 and 2011 ............................... 92
Table 7.4: Types of requested change to working patterns ...................... 94
Table 7.5: Made a request to change working hours in the last two years ................................................................................................................. 95
Table 7.6: Reasons for making a request ................................................ 96
v

Executive Summary Aims In May 2011 the UK government launched a consultation on plans to introduce a new system of flexible parental leave and an extension of the right to request flexible working to all employees (BIS, 2011a). The response to this consultation was published in November 20121 and the measures are being taken forward through the implementation of the Children and Families Act 2014. As part of this process, the Labour Market Analysis division (LMA) in the Department for Business, Innovation and Skills (BIS) commissioned PSI to conduct a rapid appraisal of the literature on the costs and benefits to business of adopting work life balance (WLB) working practices.
Methodology A full systematic review was not possible within the timeframe of the project, but the strategy and procedure adopted for the review and appraisal of the evidence was informed by the principles of systematic review methodologies. A search procedure was therefore conducted in a number stages including: development of a conceptual framework; identification of search terms; searching of literature databases and; relevance and quality checking.
The conceptual schema was developed to capture the evidence base on the diverse business benefits, highlight the hypothetically causal links between WLB policies, the work/life interface, affective outcomes (such as job satisfaction, commitment, engagement and effort) and bottom line business gains. The schema was also used to structure the subsequent discussion.
Findings The WLB policies of interest included flexible working opportunities, potentially available to all staff (including: flexi-time, working from home, reduced hours, job sharing and term-time working) and policies specifically directed at families, termed ‘family-friendly’ (including maternity, paternity and parental leave/pay and childcare support provision such as onsite nurseries).
1. Benefits of flexible working policies
Productivity - Most primary, survey based research supports a business benefits hypothesis in relation to productivity. Case study evidence overwhelmingly presents findings in support of a positive association between flexible working
1 Consultation on Modern Workplaces http://www.bis.gov.uk/Consultations/modern-workplaces?cat=closedwithresponse
vi

opportunities and productivity/performance gains but these are context specific and there are concerns about the selection of good practice employers. Econometric studies are somewhat more mixed, but where an index of flexibility is used, i.e. a ‘bundling’ approach, findings are usually positive, suggesting the value of a strategic approach to flexibility by means of a comprehensive provision of both flexible working and family-friendly initiatives.
Absences - The overall balance of evidence relating to impacts on absence rates would suggest that flexible working arrangements can effectively reduce absence. Case study and primary survey research evidence point in the direction of business benefits, with reduced levels of absence associated with the introduction of flexible working practices. The econometric evidence is considerably more mixed, however, although findings suggest that homeworking does lower absence rates.
Recruitment - Overall, there is far less evidence relating to the recruitment benefits that employers may reap when introducing flexible working policies compared with other benefits. Sources of evidence include employer surveys, employee surveys, one case study and one econometric study. The econometric study suggested no significant association between flexible working and recruitment gains, whereas the single case study, by contrast, indicated improved recruitment but is highly context dependent. Evidence from employees suggests that the majority are attracted to jobs by flexible working opportunities and that a lack of flexibility accounts for a considerable amount of under-employment. Evidence from employer surveys also suggests recruitment advantages.
Retention - Findings from primary surveys and case studies point to flexible working as having helped with staff retention, leading in some cases to very significant savings in turnover costs. The econometric evidence suggests that some flexible working arrangements are a benefit to businesses but the findings are not consistent, with one study suggesting that flexible hours were significantly associated with enhanced retention but not homeworking, while another found that improved retention was associated with homeworking, flexi-time and compressed working weeks. Further studies find all flexible arrangements to be business neutral.
Adjudicating between studies which reach very different conclusions is a challenge, with disparate findings reflecting the use of different datasets, in different countries, using incomparable measures often at different points in time. The potential for meta-analysis is therefore circumscribed and was beyond the scope of the study.
2. Benefits of ‘family-friendly’ policies
Family-friendly policies applicable only to parents, at particular points in their lives, are less likely to generate measurable business benefits in comparison to flexible working policies which can potentially be used by all staff throughout their working lives. That is, research on the impact of family-friendly arrangements used by smaller numbers of staff for shorter periods of time are less likely to produce statistically significant findings than research on the impact of flexible working policies.
vii

That said, there are still conclusions that can be drawn from the literature that does exist, even if it is limited in some circumstances to highlighting gaps in the evidence.
Productivity - Broadly speaking, family-friendly policies can benefit businesses, but the literature that exists provides no firm evidence that they have an effect on business performance.
Absences - Case study evidence suggests that a range of family-friendly policies can either reduce absence rates or, if formalised, can better enable employers to prepare for and therefore manage absences. Among the econometric studies evidence is far more mixed, but it generally suggests that family/parental leave polices either significantly reduce rates of absenteeism or are business neutral.
Labour market participation - A wide body of international research highlights the significance of paid maternity and parental leave in promoting the active labour market engagement of mothers. If maternity leave is too short, women will break their employment rather than return to work while their children are very young. Having adequate duration of paid leave combined with the possibility of returning to the same employer is a strong incentive to return to work and has pushed up the labour market participation rates of mothers.
Retention - There is considerable evidence in the UK and the USA highlighting the impact of maternity leave, maternity pay and job protection legislation on labour market participation and job retention among mothers. The proportion of mothers returning to the same employer has increased over time, from 75 per cent to 84 per cent between 1988 and 20102. Onsite childcare does not, however, appear to promote retention, but usage is low and sample size issues arise.
3. Mediating Relationships
The time and energy commitments associated with paid working lives can come into conflict with family demands or other non-work interests or responsibilities. These work and non-work spheres can complement each other and lead to a rewarding and fulfilling life. Alternatively, they can be perceived as in conflict, potentially leading to negative mood, behaviour or health outcomes. The research evidence suggests that both flexible working opportunities and informal family-friendly workplace cultures can mitigate the experience of conflict at the home/work interface, helping to promote an ‘enriched’ life and reduce ‘negative spillover’ between the two.
A large body of evidence demonstrates that effective outcomes at the level of the individual, including job commitment, ‘happiness’, satisfaction, engagement and, in turn, discretionary effort, are all associated with business benefits such as reduced leaving intentions, fewer absences, less tardiness and improvements to performance and productivity. These positive outcomes translate into improved profitability and growth.
2 Figures refer to Great Britain.
viii

4. Costs
Implementation costs - As is the case with much of the costs evidence base, the range and depth of data available is fairly limited. Employer survey evidence indicates that the majority of businesses believe implementing flexible working arrangements are unproblematic and incur very few costs. Implementation costs are therefore, generally, not seen as a barrier to flexibility. A number of administrative burdens measurement exercises have estimated the national level costs associated with introducing new WLB regulations, but these figures are not readily translated into individual business level costs. Several regulatory impact assessments of WLB legislation have also detailed the full range of costs, setting these against estimated benefits and generally concluding that the latter outweigh the former.
Procedural/administrative costs - Most of the evidence available is from administrative burdens measurement exercises and impact assessments. Data is often presented at an aggregate, national level but some unit cost and costs per organisation and per request are presented in relation to requests for flexible working. The costs per request for flexibility (estimated at £88 by BERR (2008) and £62 by BIS (2010a))3 do not appear to be high but whether the cost of requests or appeals are perceived as high or low by businesses will depend on the number of requests received, how tight context-specific profit margins are and whether the costs are perceived as lower than actual or potential benefits.
Survey evidence suggests that the majority of employers do not experience the administration of flexible working as a ‘burden’. Surveys which have asked employers whether the costs and benefits of flexible working and family-friendly policies are balanced, find that most employers agree but around one third indicate that the costs outweigh the benefits.
Costs of accommodating requests - In terms of the various costs incurred, the evidence relating to the costs of accommodating WLB provision is the weakest in terms of the volume of published material. This therefore remains a key gap in the evidence base. In terms of the actual costs, the evidence is primarily descriptive and the costs remain largely unquantified or, when presented as part of an impact assessment, are presented as nationally aggregated costs. One impact assessment, however, has estimated that accommodating a request for flexible working will cost, on average, £241.24 (BIS, 2010a).
A number of studies emphasise that WLB costs are most burdensome for small employers. Holding jobs open for women on maternity leave, for example, was identified as problematic for one fifth of the businesses sampled for the third work life balance survey – rising to 31 per cent of businesses with fewer than 100 staff.
It has also been observed that many of the costs incurred are not readily quantified, such as the time cost of training and overseeing replacement staff or the cost to businesses associated with loss of expertise and productivity. Costs are therefore likely to be underestimated.
3 These estimates are not directly comparable as they are based on disparate methods of calculation.
ix

5. Impact of right to request flexible working
Initial policy interest was in the effects of the legislation on the provision and take-up of flexible working. However a search of the literature established that there were no studies which specifically assessed the impact of the legislation on availability or take-up. This could be as a result of the difficulty of isolating the effects of the legislation from other influences within the labour market. Thus, the remit was widened to review the evidence on take-up and availability in general, and the literature on the broader effects of the legislation on both employers and employees.
Availability
Availability of flexible working has increased since 2003, although there are no studies that specifically assess whether this is related to the introduction of the right to request legislation. The availability of all types of flexible working has increased, with particularly large increases in the availability of career breaks and home/teleworking.
Take-up
Although rising, take-up does not appear to be keeping pace with rising availability. When take-up is measured in terms of the proportion of all workplaces experiencing employees using the different forms of flexible working (via employer surveys), take-up has increased between 2000 and 2007, apart from in part-time working which remained fairly stable and working from home which fell. However, when take-up is measured in terms of the proportion of employees using different forms of flexible working where it is available to them (via employee surveys), take-up seems to fall between 2003 and 20114 for most types of flexibility, except part-time working (which had increased fairly substantially). Despite these falls in the proportions working some of the individual forms of flexible working (where it is available to them), the 4th Work Life Balance employee survey found that the percentage of all employees working flexibly has risen from 51% in 2003 to 60% in 2011.
Levels and types of requests
The proportion of employees making a request to work flexibly was stable at 17 per cent between 2003 and 2006, but rose to 22 per cent by 2011. The most recent figures from the 4th WLB employee survey show that requests for a change in when hours are worked are more common (35 per cent of the total) than requests for reduced/part-time hours (23 per cent of the total).
Women are more likely than men to make a request for flexible working, as are parents compared to non-parents, and mothers compared to fathers.
Requests for flexible working are most common in certain workplaces, including larger workplaces, those in the public sector, those where women predominate,
4 Although care must be taken in interpreting the trend since the 2011 data is not directly comparable with 2003.
x

and in industry sectors such as banking, finance and insurance; public administration, education and health; and distribution, hotels and restaurants.
Outcomes of requests
Generally, acceptance rates are above 75 per cent of all requests made. The most recent data from the 4th WLB employee survey shows 79 per cent of requests accepted. There also appears to be a slight downward trend in the proportion of requests declined in the WLB survey data, from 20 to 13 per cent between 2003 and 2011. This shows that the acceptance rate has remained high, despite an increasing number of requests over time.
The evidence shows that women are more likely to have their requests accepted than men and parents more likely than non-parents. This disparity has persisted over time, and is still evident in the 4th WLB employee survey data from 2011.
Implementation
CBI survey evidence suggests there has been an increase, between 2007 and 2009, in the proportion of workplaces which have extended the right to request to all staff (beyond just those with the statutory right), up from 50 per cent to 62 per cent. The WLB (2007) survey, however, shows that a much larger proportion of employers (92 per cent) say they will consider a request for flexible working from any member of staff. CIPD surveys examining implementation showed that around a half in 2003 and close to two-thirds of workplaces in 2005 were taking steps to publicise the right to request amongst staff.
Decision making processes
Employee surveys indicate that the majority of requests to work flexibly are made informally through face to face discussions rather than in writing, suggesting that the formal statutory procedure is not being widely used in requests for changes to working patterns. The most recent data from the 4th WLB survey (2011) shows that only a quarter of requests were made in writing (letter, form or email).
Disputes and disagreements
Disputes and disagreements around the right to request flexible working are uncommon. Cases brought before an employment tribunal are very rare – less than 0.5 per cent of employers had experienced this in 2007 (Hayward et al, 2007).
Effects on employers
A number of surveys conducted shortly after the implementation of the right to request asked employers about their experiences of, and anticipated problems complying with, the legislation. The findings show that few perceived there to be significant problems, although smaller employers tended to be more concerned and more likely to see costs as an issue.
xi

Surveys asking employers about the impact of the right to request overall on their business have tended to show either a small or a neutral impact. When asked about the effects on specific elements of their business, employers are on balance strongly positive about the effects on employee relations and recruitment and retention, slightly positive on balance about the effects on productivity and absence rates, and neutral on balance about the effects on customer service and labour costs. Employers are more negative about the perceived effect of the proposed extension of the right to all employees, particularly for productivity, customer service and labour costs.
Evidence gaps Despite a large body of material addressing the costs and benefits of WLB, many of the studies are based on case study evidence which cannot be generalised, or on primary survey evidence which elicits managers’ subjective perceptions of performance. Many econometric approaches also rely on managers’ perceptions of their performance relative to that of their competitors. More objectively-based rigorous analysis exploring the impacts of WLB policies on business outcomes would make a positive contribution to the evidence base. Further research might also address the inconsistency of some of the research that is currently available.
Methodologically, three key gaps in the evidence base have been identified:
• Probably because of the difficulties and cost of implementation, there is a scarcity of rigorous studies based on experimental methods either using randomised assignment or, at least, longitudinal designs, which would allow analyses to move beyond associational findings toward evidence of causal relationships.
• Firm-level cost-benefit analyses also represent a significant gap. No detailed, firm level, cost-benefit analyses were encountered which weigh up the relative costs and benefits of various initiatives within a common analytical framework. Some analysis is undertaken within the context of impact assessments, but these are at an aggregate rather than firm level and are based on a very broad set of assumptions.
• More research based on objective outcome measures would add value to the evidence base. While there are many studies looking at productivity impacts, very often the measures used are employers’ perceptions of benefits rather than objective business outcomes. More research into the latter is necessary to improve the validity of the accumulating evidence base.
In terms of topic coverage, the main gaps in knowledge apply to the costs of WLB policies and practices. There is far less evidence relating to costs compared with the benefits literature. More research exploring cost-related issues would therefore be welcome, including implementation and administration costs. Accommodation cost evidence is the weakest in terms of the volume of published material and is therefore a priority in terms of future research needs.
In terms of business benefits there are several gaps in the knowledge base:
xii

• Take-up – there is a need for more research which goes beyond assessing the impact of flexible working policies (i.e. availability), to assess, instead, the impact of take-up, in the absence of which studies may be underestimating potential impacts.
• Recruitment benefits – there is little research exploring the potential recruitment benefits associated with flexible working including the potential to enhance high quality job matches.
• Onsite childcare and retention – notably few studies have looked at the relationship between workplace nurseries and retention rates.
• Further disaggregation – there are few studies relating to any of the outcomes of interest which fully disaggregate and compare findings according to workforce type, industrial sector and size.
The final omission within the literature reviewed relates to evidence on change over time. There is some evidence that the impacts of flexible working on productivity and other outcomes may be diminishing over time, and given the increasing prevalence of such opportunities across all business sectors and sizes, diminishing returns might well be expected, but research into this issue is scarce.
xiii


1. Introduction Businesses have for some time now been changing their traditional working arrangements, first to accommodate the needs and preferences of a highly diverse workforce, and second with a view to receiving some benefit from a work-life balance approach. In May 2011 the UK government launched a consultation on plans to introduce a new system of flexible parental leave and an extension of the right to request flexible work to all employees (BIS, 2011a). The response to this consultation was published in November 20125 and measures are being taken forward through the implementation of the Children and Families Act 2014. As part of this process, the Labour Market Analysis division (LMA) in the Department for Business, Innovation and Skills (BIS) commissioned PSI to conduct a rapid appraisal of the literature on the costs and benefits to business of adopting work life balance working practices. This work was conducted in Autumn 2011 and the findings reported below. The potential benefits to individuals, families or communities were beyond the scope of the study and are not discussed.
The remainder of the report is structured as follows. Chapter 2 provides a discussion of the background context, outlining the demand for work-life balance policies and practices, trends, and government legislation over the past decade. The aims and objectives of the study are set out in Chapter 3 while Chapter 4 presents the methodological approach deployed and discusses some of the challenges faced in meeting these aims in full. Chapter 5 sets out the evidence relating to the benefits to business of work-life balance arrangements (flexible working and maternity/paternity/parental leave) and is divided according to the range of different benefit types: productivity, staff retention, recruitment, absences, wages, building costs and affective outcomes (such as job satisfaction, engagement or commitment). Chapter 6 focuses on the costs to businesses, differentiating the distinct types of cost: implementation, accommodation and administration. Chapter 7 considers the right to request flexible working legislation, investigating evidence of impacts on availability and take-up. Finally, Chapter 8 provides an overview of gaps in the evidence base and points to future research needs.
5 Consultation on Modern Workplaces http://www.bis.gov.uk/Consultations/modern-workplaces?cat=closedwithresponse
1
2. Background In the context of global competition, skills shortages, an increasingly 24/7 society and demographic change, many organisations have been adapting their methods of working, working time regimes and leave arrangements. Facing cost and quality competition, successful organisations depend on the skills, commitment and initiative of their workforce. In an attempt to attract, nurture and retain staff with these qualities, companies are increasingly offering terms and conditions of employment and ways of working which meet the various needs of their workforce, whether related, for example, to caring responsibilities, the pursuit of learning or health difficulties.
2.1 Workforce changes The need to modernise working arrangements is in part driven by demographic trends and a changing labour force. Key features include:
• The labour market participation of women continues to grow, particularly among mothers (BIS, 2010a). The employment rate of working-age men fell from 91 per cent in 1971 to 76 per cent in 2011, while the rate for working age women rose from 53 per cent to 66 per cent over the same period (see Figure 2.1).
• Escalating numbers of dual-earner households give rise to challenges in balancing work and family life. These trends have raised concerns about the increased stress, long working hours (particularly of fathers), decreased psychological well-being, increased sickness absence, marital problems and pressure on family relationships (Bond, 2004).
• The proportion of one-parent families has tripled from 8% in 1971 to 22% in 2011 (ONS, 2011). Single parent families are at heightened risk of poverty. Sustained employment is recognised as a key route out of social exclusion and poverty.
• 5 million adults in England have caring responsibilities for a sick, disabled or elderly person (Health and Social Care Information Centre, 2010). One in six carers gives up or cuts back work to care, with implications for their longer-term financial well-being and implications for employers in terms of the availability of skills (Glendinning, 2009).
• The workforce will increasingly be skewed toward older workers as the population ages and retirement ages are increased (Smeaton et al 2009). The employment rate of over 65s was roughly stable at around 5 per cent from April 1992 until 2001. Since then the employment rate of over 65s has been on an upward trend; increasing by 4.5 percentage points from a trough of 4.6 per cent in February 2001 to a peak of 9.1 per cent in December 2010 (see Figure 2.2).
2

Given these demographic trends, Governments have recognised the need to encourage new working arrangements to accommodate the evolving needs of the employed and those searching for work.
Figure 2.1: Increased rate of female employment
Source: Office for National Statistics, Monthly data, Labour Market Statistics. BIS estimates.
Figure 2.2: Increased rate of employment among the over 65s
Source: Office for National Statistics, Monthly data, Labour Market Statistics. BIS estimates.
50
55
60
65
70
75
80
85
90
95
1971 F
eb
1973 F
eb
1975 F
eb
1977 F
eb
1979 F
eb
1981 F
eb
1983 F
eb
1985 F
eb
1987 F
eb
1989 F
eb
1991 F
eb
1993 F
eb
1995 F
eb
1997 F
eb
1999 F
eb
2001 F
eb
2003 F
eb
2005 F
eb
2007 F
eb
2009 F
eb
2011 F
eb
Wo
rkin
g A
ge
Em
plo
yme
nt R
ate
: Ag
ed
16
-64
(%
)
All
Female
Male
3
2.2 Government Policy A series of work-life balance campaigns and legislative changes have built on employers’ own efforts to provide more diverse, and mutually beneficial working arrangements. The current coalition government remains committed to this agenda. As indicated in the consultation on flexible working and flexible parental leave; (BIS, 2011a) “We want to create a society where work and family complement one another. One where employers have the flexibility and certainty to recruit and retain the skilled labour they need to develop their businesses. And one where employees no longer have to choose between a rewarding career and a fulfilling home life”.
Employment sustainability is also key to meeting the challenge of extended working lives which has become a policy priority in the context of an ageing workforce and increased life expectancy.
A broad range of government initiatives have been introduced over the past 10 years or so, designed to promote and ease the labour market participation of mothers, new parents and, more recently, those with eldercare responsibilities. Schemes introduced include the following (presented chronologically):
• The introduction of unpaid parental leave and time off for dependants. Employees are entitled to 13 weeks’ unpaid Parental Leave in respect of each child up to the child’s 5th birthday. The amount of leave was extended to 18 weeks per parent per child in March 2013. Where the child is disabled, an employee is entitled to take up to 18 weeks’ unpaid Parental Leave up to the child’s 18th birthday. Parental Leave may also be taken where a child is adopted, and can be used in the five years following placement. Employees are also entitled to take a reasonable amount of unpaid time off to deal with emergencies involving dependants – Time Off for Dependants (Employment Relations Act 1999, schedule four; the Maternity and Parental Leave Regulations 19996; Maternity and Parental Leave (Amendment) Regulations 2002).
• The work-life balance campaign, launched in 2000, designed to facilitate the combination of caring and paid working roles.
• The Age Positive Campaign: introduced in 2001 promoting good practice including the provision of flexible working arrangements as people age. The government has been working closely with employers, has produced good practice guides7 and posts examples of exemplary employers on its website8.
• The Employment Act 2002 introduced new employment legislation designed to help working parents. From 6 April 2003 parents with young and disabled
6 The Maternity and Parental Leave Regulations 1999 took effect on 15 December 1999. The regulations introduce a right to parental leave, based on Council Directives 96/34/EC and 97/75/EC, and improved existing maternity leave arrangements. The provisions of the Employment Relations Act 1999 on time off in the event of emergencies involving family and other dependants, which also reflect the Directive, came into force on the same date. 7 http://dwp.gov.uk/docs/good-practice-managing-without-fixed-retirement-age.pdf 8 http://dwp.gov.uk/agepositive/
4

children gained new options for leave – including paid paternity leave and leave for adoptive parents, new arrangements for financial support, and the legal entitlement among parents of children under the age of 6 (under the age of 18 where the child is disabled) to request flexible working or a reduction in working hours9.
• Statutory maternity pay for 39 weeks and up to 52 weeks of maternity leave (Work and Families Act 200610).
• The 2006 Work and Families Act extended the ‘right to request’ flexible working to parents of children aged 6 to 16 (introduced in 2009) and to co-resident carers (introduced 2007). The latter extension is restricted to carers of dependent adults only and does not apply if the older dependants are not living with the carer.
• The Work and Families Act 2006 extended to employed fathers and partners of new mothers a right to up to 26 weeks’ additional paternity leave once the mother or partner has returned to work. Implemented from April 2010, Additional Paternity Leave and Pay (APL&P) enables eligible fathers to take up to 26 weeks’ additional paternity leave (employed fathers may also be entitled to 2 weeks’ ordinary paternity leave). The leave may be paid if taken during the mother or partner’s Statutory Maternity Pay period, Maternity Allowance period or Statutory Adoption Pay period. Leave taken after this period has ended is unpaid.11 The Act was designed to improve maternity leave, allow families more control over childcare choices, encourage a greater caring role among fathers and promote family-friendly working alongside social and economic public benefits12. The Act also sought to ease the burden of administration of leave and pay for employers.
• In May 2011 the government launched a consultation on plans to introduce a new system of flexible parental leave and extend the right to request flexible working to all employees (BIS, 2011a). The Government’s response to this consultation was published in November 201213 and measures are being taken forward through the implementation of the Children and Families Act.
Reflecting this programme of regulatory change, work-life balance and family-friendly policies and practices can be defined and differentiated in terms of the
9 A request that employers have a legal duty to seriously consider. Requests can be refused on a limited number of set grounds. 10 Previous maternity and paternity pay and leave legislation includes: the Employment Rights Act 1996, amended by the Employment Act 2002. Details set out in the Maternity and Parental Leave regulations 1999 and the Maternity and Parental Leave (Amendment) Regulations 2002. 11 The new right applies in respect of babies due (or children placed for adoption) on or after 3 April 2011. 12 As a social good, Work-life Balance (WLB) outcomes can be measured in terms of a reduction in family breakdowns, work-related illness, and improvements to well being, satisfaction, ‘happiness’ and the quality of care for children or older family members. WLB policies are also designed to promote labour market participation rates to the benefit of individuals, to avoid poverty and enhance national economic performance. 13 Consultation on Modern Workplaces http://www.bis.gov.uk/Consultations/modern-workplaces?cat=closedwithresponse
5

three groupings presented in Box 1 – family leave, flexible forms of work and support for dependant care. Those in italics, below, although in principle of interest, are not covered in this report as few studies provided evidence on the relationships between these policies and practices and business outcomes.
2.3 Trends A number of studies over the past 10 years suggest that an increasingly flexible approach to working arrangements is emerging, which will promote social inclusion and a more diverse workforce (Woodland et al, 2004; Hooker et al 2007; Haywood et al, 2007; White et al, 2004; Smeaton and Young, 2007). There is nothing new about part-time hours (see Figure 2.3 for growth in use between 1992 and 2011) or other flexible working arrangements, but what has begun to change over recent years is the dispersal of these working practices among a wider range of occupational groupings. Previously, reduced hours opportunities remained the preserve of a few female dominated occupations. As a consequence, when mothers returned to work after childbirth, their desire for part-time hours channelled them into a narrow range of occupational groups,
Box 1 • Family leave
o Maternity leave o Paternity leave o Adoption leave o Parental leave o Time off for dependants/ emergency leave
• Flexible forms of work – any change to terms and
conditions, including: o Ability to move to part-time working o Job sharing o Term-time working o Working from home o Flexi-time o Annualised hours o Compressed week
• Support for dependant care – childcare or elder care.
o On-site childcare o Provision of financial support for childcare
elsewhere o Career breaks o Access to training on return from maternity leave o Access to a telephone for family reasons o Provision of Keeping In Touch schemes during
maternity leave o Support for carers of adults.
6

resulting in downward occupational mobility for many. The right14 of all parents, regardless of occupational position, to request modified hours is arguably an important development with considerable scope to undermine processes of segregation. There is evidence that fewer mothers now change employers upon returning to work after maternity leave (Smeaton & Marsh 2006; LaValle, 2008) and that the incidence of downward occupational mobility has declined (Smeaton 2006a, Smeaton & Marsh 2006).
Employers now offer a much broader selection of working arrangements and have extended these to more staff and occupational groups. Occupations and industries dominated by men are, however, still lagging behind (Smeaton and Young, 2007, Barnes et al, 2009) and managerial positions are also still often characterised by long hours (Ford and Collinson, 2011), despite having greater discretion and time sovereignty.
Figure 2.3: Increasing use of part time work
Source: Office for National Statistics, Monthly data, Labour Market Statistics. BIS Estimates.
14 Initially introduced under the Employment Act 2002, eligible people had the right to request flexible working arrangements from their employers. The Flexible Working (Procedural Requirements) Regulations 2002, the Flexible Working (Eligibility, Complaints and Remedies) Regulations 2002, the Flexible Working (Eligibility, Complaints and Remedies) (Amendment) Regulations 2006, 2007, 2009 and 2010 and the Work and Families Act 2006 further strengthened this right.
7

3. Aims and objectives The primary aim of this study is to provide a comprehensive picture of the costs and benefits to business from the adoption of work-life balance (WLB) policies and practices. Despite a large and burgeoning body of literature setting out the benefits of WLB practices for employees and considerable research detailing the availability of WLB arrangements (e.g. the work life balance surveys), studies which demonstrate and quantify the various potential costs and benefits to employers are notably less prevalent. To some extent, this gap in the evidence base reflects the methodological challenges associated with designing a robust evaluation of WLB practices and the limitations of existing datasets that have been used to explore impacts on businesses.
The study therefore aims to assemble all the evidence available, review and assess the literature and present a coherent analysis of the range of costs and benefits, disaggregated by type, that businesses face. A key objective is to quantify the range of costs and benefits and to answer the following two key questions.
• What are the benefits to business of providing work life balance policies? • What costs to business are associated with work life balance policies, for how
long are the costs incurred, what is the value of these costs, and do they outweigh the benefits or vice versa?
3.1 Research Questions – Benefits
The more specific questions in relation to benefits are as follows:
• Weighing up the evidence from a wide range of sources, is the ‘business case’ proven i.e. are there measurable benefits to businesses which outweigh costs?
• Do benefits differ according to firm size, staff demographic or industrial sector?
• To what extent does the evidence quantify the benefits, for example: o whether and how much short term absences are prevented; o is there a reduction in staff turnover rates which in turn may be
translated into recruitment and training savings; o whether productivity or profitability is increased and by how much; o in terms of recruitment, whether vacancies are filled more quickly or
whether skills shortages are less widespread within the business.
3.2 Research Questions – Costs
The more specific questions in relation to costs are as follows:
8
• Does the literature differentiate the various types of cost? • Does the literature quantify these costs (e.g. in terms of person time or
financial resources)? • To what extent do costs differ according to firm size, industrial sector or staff
demographic?
3.3 Additional research questions One additional question raised, which does not fall within the cost benefit framework of enquiry is:
• to what extent has the right to request flexible working influenced its provision and take-up.
9

4. Methodology A full systematic review was not possible within the timeframe of the project, but the strategy and procedure adopted for this study informed by the principles of systematic review methodologies (www.campbellcollaboration. org/guidelines, 2008; www.cochrane-handbook.org, 2008; Petticrew and Roberts, 2006).
4.1 Search strategy and protocol The search procedure was conducted in a number stages:
• A conceptual framework was developed • Search terms were identified • Literature databases were searched • Relevance and quality checks were conducted
These stages are described below.
Conceptual framework
The initial conceptual framework set out the parameters for identifying search terms and delineating the scope of issues to be addressed. The framework also provided a structure within which findings were subsequently discussed and analysed.
The primary focus of this study, and hence the conceptual framework, is on cost and benefit outcomes for employers. This is shown in figures 4.1 and 4.2 below, which summarise the ‘benefits’ and ‘costs’ relationships initially identified as being in scope.
Column A of Figure 4.1 sets out the range of work-life balance (WLB) policies and practices in which we are interested. The potential bottom line employer benefits that may be associated with WLB policies are presented in column C. Also of interest, however, are ‘intervening’ individual level effects such as staff morale, satisfaction, health, effort, well being etc, in-so-far as they are demonstrably associated with employer benefits; see column B. So studies demonstrating a link between affective states such as satisfaction and effort, and business impacts, even though they might not refer to WLB practices, but other workplace characteristics also associated with loyalty, commitment etc, would be relevant. Initially, the search included studies focusing on all of the potential links between A, B and C, i.e:
10

A B (of interest when linked with other studies which demonstrate the impact of B on C)
A C (where the linking mechanisms of B are implicit)
B C (which is of interest although may not discuss WLB, focussing instead on other factors which lead to satisfaction, high morale, good health etc)
A B C (studies which explicitly explore the full causal chain)
Figure 4.1: Developing the ‘benefits’ conceptual framework
The initial costs framework is shown in Figure 4.2. The various types of cost potentially associated with WLB practices are highlighted in the middle column in blue, while the other (green) boxes provide examples. Potential costs include:
• One-off implementation costs • Procedural costs • Accommodation costs (e.g. costs associated with more complex roster
scheduling, costs of employing more staff or of employing temporary replacement staff, or direct cost of childcare subsidies or workplace nurseries)
• Unanticipated costs (e.g. of diverting time and resources towards bureaucracy and regulations and away from other business objectives such as innovation, training or growth).
E
Flexible working
Support for carers (childcare and
eldercare)
Family leave(for parents)
LoyaltyMotivation
EffortMorale
Job satisfaction
HealthStress
Ability to return to or remain in employment
AEmployer policies and
practices
RecruitmentRetentionAbsences
Work related sickness
Company reputationProductivity
CEmployer benefits
BIntervening variables (at level of individual)
11

Figure 4.2: The ‘costs’ framework
Search terms
Using the above framework as a starting point, keywords for the main literature search were defined to include:
• Interventions: family-friendly or work-life balance practices; terms which appear in Box 1, section 2.2 above, and
• Population: employers, firms, businesses, organisations or workplaces and • Outcomes 1: a range of terms related to costs and benefits (e.g. absenteeism,
productivity, staff turnover, retention, recruitment, bureaucracy, regulations, business case, administration, burden, costs, benefits).
• Outcomes 2: intervening variables (see figure 4.1 above ) such as motivation, morale, satisfaction, engagement.
Appendix 3 contains the full search profile.
Additional keywords were added as a separate search profile, to address the research question on the impact of the right to request flexible working on availability and uptake. These included:
• Flexible working availability or take-up (this was included to source publications exploring both employees and employers as the units of analysis)
• Flexible working and trends
Appendix 3 contains the full search profile for this aspect of the study as well.
.
Implementation Costs
Procedural Costs
AccommodationCosts
UnanticipatedCosts
Cash costs:
(eg. subsidies)
Staff costs:
(eg. employ more staff to cover: leave, reduced hours or extra bureaucracy
Displacement costs:
(eg. time or money spent on WLB issues diverted away from
innovation, training or growth)
Various costs:
(eg. associated with negative impacts on
commitment, satisfaction or effort if WLB
policies perceived as unfair)
12

Search databases
Searches covered international literature (in English) of different types since 1995 (or earlier for key texts). Databases searched were selected according to literature type and subject coverage and included:
• Web of Science • ASSIA • Econlit • Business Source Complete • Emerald Management Xtra • Zetoc • COPAC • RePEc • Cambridge Journals Online • Ingenta • JSTOR • SAGE Journals Online • SwetsWise • Social Science Citation Index • Government departments (for BIS, need to do ‘BIS’, BERR & DTI) • Institutional repositories in the UK (OpenDOAR) • Web sites of organisations/direct contact: EHRC, Working Families, Family
and Parenting Institute, Fatherhood Institute, Business research centres, CBI, TUC, CIPD, ACAS, BCC, the Work Foundation, NBER, JRF, Nuffield Foundation, Eurofound, Flexibility.co.uk and the ESRC database
Quality assessment
Initially, a first sift relevance screening was undertaken to ensure that the coverage of issues was sufficient, informed by the . The conceptual frameworks above informed these considerations. The relevance check yielded one of three possible results, as outlined in Table 4.1.
Table 4.1: Relevance scoring
Score Relevance
0 The report may discuss WLB issues but does not provide any evidence of impacts (costs or benefits) to employers.
1 The report does not supply new evidence. Rather it provides a synthesis of existing evidence or presents findings from previous research. Useful for further literature searches.
2 The report presents empirical evidence on the impacts of WLB policies and practices in terms of costs and/or benefits for employers (or reports on the right to request and take-up /availability of flexible working). Includes qualitative and case
13

study evidence.
At this stage, the sift excluded publications that were clearly outside scope from further investigation. The abstracts of those publications remaining after this first sift were then checked, and those found not to be relevant at this point were also excluded. All remaining publications were then read fully and assessed for quality.
A framework for quality assessment was developed (see appendix 1). In assessing the quality of publications, the review considered factors such as:
• sample size • sampling frame and approach (random probability) • response rates • analysis (statistical significance) • establishment of causality • soundness of conclusions • whether peer reviewed
Papers of low quality were rejected. Each relevant report with a sufficiently high quality score (above 3) was included in the review.
4.2 Key Challenges In synthesising material such as that gathered here, a number of challenges arise in relation to assumptions in cost benefit analyses, the interpretation of findings and the use of work-life balance (WLB) indicators in some studies. Further challenges result from comparing studies based on different methodological approaches and the low ‘generalisability’ of some methodologies. The first three challenges are discussed in brief below, while methodological limitations are discussed in section 4.3, where the range of advantages and disadvantages associated with the different methodological approaches is set out.
Cost benefit analysis
In reviewing studies which calculate bottom line net impacts, whether firm-level self evaluations or macro-level national calculations, the main challenge is understanding the assumptions on which these estimates are reached. It is not always possible to critically appraise the validity of these calculations. To take one example, Schiebl (1999) suggests that the business case for providing employees with child care can be assessed by comparing the cost of replacing an employee with the cost of providing childcare assistance to retain that employee. Such a calculation is based on the false assumption that all staff with young children will leave a company that does not provide such assistance. A better approach would be to attach a probability that a member of staff will leave in those circumstances, thereby reducing the potential cost of staff replacement to realistic levels.
14

Interpretation of findings
In terms of the study’s remit, which is to present facts and figures which clearly quantify costs and benefits in a form that is meaningful to businesses, interpreting findings is one of the biggest challenges. Translating econometric analysis into bottom-line figures can be fraught with problems.
The model assumptions of various econometric techniques frequently involve transformations to the original data series. Variables may be: differenced to achieve stationarity, logged, combined in an additive or multiplicative manner, raised to powers, or units of measurement may be in the form of scaled relationships. Findings may not, therefore, be readily amenable to quick calculations that can facilitate plain language descriptions. At times in this review, we thus indicate whether relationships are significant and whether positive or negative, rather than providing specific figures.
4.3 Policy vs practice – a problem with indicators A final challenge for interpreting the impact of WLB policies on employer outcomes relates to the use of WLB indicators in some studies.
Many of the econometric studies reviewed quantify the impact of flexible working arrangements which are reported as available, rather than the impact of actual take-up. The assumption is that employees will avail themselves of arrangements that are most suitable to them if they are available. The extent to which this availability translates into take-up is the subject of some debate, however. One study by Visser and Williams (2006), for example, explored access to WLB practices in the public sector and found a distinct gap between policy and practice or, as the authors expressed it, between ‘rhetoric and reality’. Based on a survey of 1000 public sector workers the report found that three quarters of public sector organisations had initiatives and policies in place to address work-life balance for some or all staff – higher than the private sector. Despite this widespread availability, only half of those surveyed felt able to exercise genuine choice and only just over half said they were aware of the WLB options available to them. One obstacle to freely choosing preferred arrangements are the attitudes of line managers; one third of survey respondents described their managers as not committed to supporting WLB needs while others observed that their managers were overtly hostile to non-standard working practices. Staff may also encounter blocked career opportunities by deviating from ‘the norm’. Houston and Waumsley (2003) note, on the basis of a survey of employees (with a sample size of 2000), that 40 per cent of those employed agreed that using family-friendly practices would be damaging for their careers. Widespread unmet demand for improved WLB may therefore prevail despite such practices being available.
Studies which investigate the impact of flexible working by measuring availability, as reported by employers or managers, may therefore underestimate the potential impact where the correlation between availability and take-up is low. Impacts may be better captured by measures of take-up. The reverse scenario also holds. Supervisors and line managers may permit more flexibility than is
15

formally allowed (Eaton, 2001), with employees able to modify their working hours or to take time off unofficially. This ‘informal' flexibility will not be captured by studies which focus on corporate policy as reported by employers or managers.
4.4 Methodological approaches – advantages and disadvantages
Broadly, the evidence base can be classified into four methodological approaches – case studies, econometric secondary data analyses, meta-analyses and primary research using dedicated surveys which elicit manager or employee views of the costs or benefits of WLB policies (e.g. CIPD, BCC and the BIS work life balance surveys).
The literature examining the relationship between bottom-line business benefits and WLB policies and practices is almost exclusively non-experimental in nature. Baltes and Briggs (1999), Yasbek (2004) and Kelly et al (2008), in similar reviews, have also observed the scarcity of longitudinal data and/or quasi-experimental designs to assess change associated with work-family initiatives.
Case Studies
Case study methodologies provide an important source of detailed information relating to the nature of benefits and how causal mechanisms might lead to productivity and other gains. Case study approaches often deploy mixed methods, including depth interviews, focus groups and, sometimes, staff surveys. These studies benefit from the detail of their findings, they often provide longitudinal data tracking change over time and evidence on costs and/or benefits in a form that is meaningful to businesses.
The key limitation of these studies, however, is their small sample sizes and focus on context specific practices and outcomes. Findings therefore tend not to be generalisable.
Other case studies are more campaigning in approach and often selected as examples of good practice. Schiebl (1999) conducted a review of this form of cost benefit analysis evidence and noted how ‘patchy’ the data tends to be, the lack of base line information and the extent to which these studies overemphasise success and downplay any negative effects or problems. Hence there is a need to treat such studies with caution.
Econometric Studies
There is a growing body of econometric evidence on work-life balance issues. Many of the UK-based studies are based on analysis of the Workplace Employment Relations Study15 (WERS). The studies benefit from large sample sizes, the control of a large number of potentially confounding factors which may
15 The WERs data can be found here: http://www.esds.ac.uk/findingData/werTitles.asp
16

explain outcomes (e.g. management practices) and the ability to compare firms with and without particular policies. Two key problems are associated with many of these studies; they are often cross-sectional and therefore causal relationships cannot be established and, in many studies, measures of productivity etc. depend on managers’ perceptions of whether their firm’s performance is above or below average. This approach is subject to inaccurate and subjective assessments and can’t readily be interpreted in terms of bottom-line costs or benefits. There are exceptions, however, with some studies using the panel element of WERS and/or objective performance data.
Yasbek (2004) suggests that the direct costs of implementing work-life balance policies are more easily measured than the benefits and employers consistently underestimate the cost-effectiveness of work-life balance policies. As a result, uncorroborated evidence which relies on the perceptions of employers/managers ‘may not be a very robust measure of the actual balance between costs and benefits’. This is a problem affecting many of the studies examined as part of the review as they rely on manager perceptions of whether benefits outweigh costs or whether WLB initiatives have been associated with benefits to turnover, performance, recruitment or absences.
Meta-analyses
The reviewers conducting this study found only one meta-analysis (Baltes and Briggs, 1999). This is based on a synthesis of 29 studies. The main reservation with this analysis, however, is that the studies reviewed are nearly all from the 1970s and 1980s. Business practices and workforce composition have changed markedly since that period and therefore the extent to which relationships would still hold is unclear.
The potential for further meta-analyses is severely circumscribed, however, by the fact that the much of the literature is based on different aspects of WLB, deploy a wide range of measures and definitions of policy, practice and outcome, are based on incommensurate methodologies and analytical techniques and, finally, are based on a multitude of firm sizes, countries, regions and industrial sectors.
Primary Research
There is a body of primary research based on dedicated surveys. Many have been conducted by organisations such as the BCC, CIPD, Corporate Voices, and CBI, but there are also the BIS work-life balance surveys or employers and employees. Most of these tend to present only frequencies, rather than more sophisticated analysis, and also rely on owner/manager perceptions rather than objective evidence. These studies therefore tend to be ‘weak’ in terms of the appraisal matrix discussed above.
17

5. Work-Life Balance:
Employer Benefits The employer benefits under investigation are classified below as direct and indirect benefits. The latter, as discussed in the methodology chapter, refer to the intervening variables, or the mechanisms, which link WLB provision to bottom line outcomes (see Figure 4.1). The direct benefits explored include productivity, profitability, absences, recruitment, retention and other benefits such as wages and building costs.
The chapter commences with an overview of the range of benefits encountered in the review and develops a conceptual schema which refines Figure 4.1 and reflects the linkages explored in the literature, which lead from WLB policies and practices to improved business performance and profitability. The conceptual framework is used, in part, to organise the findings presented. It should be noted, however, that causal relationships are rarely established in the research literature as the methodological approaches typically adopted preclude the possibility of establishing causal direction. The ‘links’ should therefore to be interpreted as associations.
The chapter subsequently divides WLB polices to separately consider: (i) flexible working arrangements and (ii) ‘family-friendly’ policies and practices which include maternity/paternity/parental leave and pay and childcare provision.
First, the impact of flexible working arrangements on the beneficial outcomes of interest are explored (section 5.2). The flexible working policies include flexi-time, reduced hours, homeworking and other arrangements which can potentially be used by all employees. This is followed by a consideration of the evidence relating to ‘family-friendly’ policies and practices to determine their impact on business outcomes (section 5.3). The policies referred to as ‘family-friendly’ apply more specifically to parents. Finally, in section 5.4, evidence is presented relating to the indirect relationships between (a) WLB (flexible working and family-friendly policies) and individual level affective outcomes (such as job satisfaction or commitment) and (b) affective outcomes and business outcomes such as staff retention/absences etc.
5.1 Business benefits and causal chains The literature provides evidence on a broad and diverse range of direct and indirect benefits associated with WLB policies and practices. These include:
18

• Improved corporate reputation • Improved recruitment leading to higher calibre staff and/or fewer unfilled
vacancies • Improved retention rates • Reduced absenteeism and sick leave • Improved customer service, more flexible or longer operating hours; • Improved productivity or performance • Lower salary requirements • Lower office space and energy costs • Improved job satisfaction, motivation, engagement or commitment/loyalty • Reduced levels of stress • Reduction or mitigation of the effects of practices such as long working hours,
presenteeism or work intensification
The relationships between various WLB practices and outcomes of interest are complex.
While part-time work or working from home may be associated with improvements to productivity or other measures, this relationship may not hold for other types of flexible working such as job sharing or compressed working weeks. Part-time working hours can also be inflexible and therefore quite distinct from other flexible working options. Findings are therefore disaggregated wherever possible to avoid a misleading conflation of different types of work-life balance arrangements.
Despite the potential differences in impact effect, size and direction associated with the various types of WLB, a number of studies have suggested that the biggest impacts are associated with ‘bundles’ of policies. Benefits may therefore be optimised when flexible working, for example, is part and parcel of a wider package of support which signals the value employers place on their staff. According to some studies, workplaces which offer an extensive range of WLB policies are more likely to have above-average performance than those with no such practices (MacLeod and Clarke, 2009; Eaton, 2001, Gray, 2002; Perry-Smith and Blum 2000; Stavrou, 2005).
Complexity also arises in relation to the causal chain linking WLB policies to bottom line business outcomes. The initial conceptual framework (Figure 4.1, set out in section 4.1) evolved as the review progressed to reflect a more complex set of linkages, which are set out in Figure 5.1 and discussed below.
Developing the conceptual schema
Based on the research evidence investigated as part of the review, the conceptual framework (Figure 5.1) serves to visually demonstrate how work-life balance policies and practices can lead to business benefits. The framework also serves to help structure how findings are organised and reported.
Within the updated conceptual schema, employer benefits are differentiated into reduced costs and enhanced profits as they are conceptually distinct and clarify the diverse processes involved.
19

In Figure 5.1 the WLB policies and practices of interest either lead to intermediate outcomes such as more satisfied staff, represented with circles or ovals outlined in blue or can lead directly to some of the outcomes of interest. The green rectangles indicate the measurable business outcomes such as productivity, reduced absences etc. while these, in turn, either enhance bottom line profits or reduce potential costs.
Figure 5.1: Emergent WLB/business outcomes conceptual schema
The reduced costs and enhanced profits routes are elaborated in turn below, although it is acknowledged that ultimately reduced costs are not an end point but instead lead to enhanced profits – the key bottom line outcome of interest.
The reduced costs section, which follows this introduction, looks at some of the estimated costs of: absences, turnover, buildings and energy and salaries. In setting out the scale of these costs, the section highlights the potential scope that WLB policies have, insofar as they are able to reduce these costs, to improve business balance sheets.
The enhanced profits section below sets out theories which explain why WLB policies might be expected to lead to specific benefits in relation to recruitment, and productivity or performance. Intervening factors are discussed, such as
.
WLB policies
and initiatives
Take - up
Reduced work/family conflict Less pressure More control
Improved job satisfaction engagement commitment or effort
Reduced Absenteeism
Improved retention
Potential policy practice gap – importance of culture
Social exchange theory
Improved recruitment - (staff calibre & unfilled vacancies)
Lower building / energy costs Lower
salaries
Enhanced Profits
Reduced costs
Higher individual productivity / performance Service Profit Chain Model
improved service quality ? customer satisfaction ? customer loyalty
20

discretionary effort, reciprocity or greater citizenship behaviour in the context of: work/family conflict frameworks, social exchange theory and the service profit chain model. The section also considers business benchmarking in a competitive labour market as an impetus for WLB policies.
Having established some of the causal mechanisms and explanatory theories, the report then continues with a detailed examination of findings from the literature, looking first at reported impacts of flexible working policies on business outcomes followed by impacts of ‘family-friendly’ policies on business outcomes.
Reduced Costs
Economic theory suggests that firms may introduce WLB policies if they increase profits either by increasing performance or by lowering costs (Budd and Mumford, 2003). Cost savings come from various sources, including lower wages, less absenteeism, lower staff turnover or reduced energy and building costs. The reduction in costs can be quite substantial.
In 2010 an average 7.7 working days a year were lost per employee across the UK (CIPD, 2011a). The data on the cost of absences is quite varied but a recent CIPD (2009) report estimated that the average cost of absence per employee per year is £889 in the public sector, and £600 in the private sector. The average number of days lost per annum as a result of absenteeism has been estimated to lie somewhere between 10 million and 14 million, at a conservative cost of around £750 million (Government Office for Science, 2008). The CBI reports that sickness absence costs the UK economy £13.4bn a year (CBI-AXA, 2007, Annual Absence and Labour Turnover Survey)
The cost of staff turnover is far greater. CIPD estimate that the average turnover cost per employee is £8200, rising to £12,000 for senior managers or directors (CIPD, 2011a). Other studies suggest that turnover can cost between 50 per cent and 200 per cent of an employee’s annual salary (Kelly et al, 2008). The median turnover rate for 2010, reported in CIPD (2011a) is 13.5 per cent – down from 17.3 per cent in 2008. Aggregating the number of turnovers by the cost per turnover from these surveys provides an estimate of £95 million per annum (Government Office for Science, 2008). Costs are incurred by means of advertising, interviewing, re-training and the potential cost of lost productivity while waiting for a replacement and waiting for new staff to get up to speed. So staff turnover can be especially costly for firms that extensively train their workers with ‘firm-specific’ skills.
Evidence relating to cost savings are presented throughout the chapter below. Case studies of IBM and BT in particular (Caldow, 2009; BT, 2007) have highlighted building and energy cost savings for larger corporations running into the millions of pounds or dollars where teleworking and homeworking is encouraged. Several studies have also found a reduction in average entry level salaries associated with firms offering various WLB initiatives. So the costs of WLB policies are, in these examples, partially or fully offset by lower wage costs.
21

Enhanced profits
The enhanced profits route is arrived at partly through reduced costs but also through improvements in the productivity or work quality of employees.
Several routes to enhanced profitability appear in Figure 5.1 and include: reduced negative spillover from home to work leading to greater engagement and effort; and productivity gains from workers as an act of reciprocity in return for access to favoured working arrangements and recruitment benefits. A number of theories have been developed in the literature which investigate and account for these business benefit routes. Several are briefly described below, including discussions of, work-life conflict/enrichment perspectives, social exchange theory, the service profit chain model, deficit models and the role of business benchmarking.
A number of studies focus explicitly on the effects of flexible working and supportive environments on work/family conflict. They find that reduced conflict leads to a workforce which is more satisfied, engaged or committed and, as a result, these members of staff are either motivated to work hard and perform well because they are, in some sense ‘happy’ or ‘driven’ at work or, within a more sociological ‘exchange theory’ framework, they will feel duty bound to work hard as a reciprocal act in exchange for the WLB their employer is facilitating. Either way, there is evidence to suggest that engagement16, satisfaction and other affective outcomes are positively associated with performance and productivity.
One theoretical account, which explicitly models the relationship between working conditions, affective outcomes and bottom line impacts, is the Service Profit Chain Model (Lau, 2000). This approach identifies a series of links that arise when there is continuity of service and happy engaged staff. In this model ‘internal service quality’ is of interest, which means the treatment of staff and the provision of favoured terms and conditions such as WLB schemes. Good staff treatment leads to satisfied employees with organisational commitment and an improved quality of service. In turn, customers and clients come to trust and value that member of staff. These attributes then lead to customer satisfaction, which translates into customer loyalty and repeat business, which in turn feed into bottom line benefits.
In addition to the mechanisms which link WLB practices and productivity by means of increased job satisfaction, organisational commitment, or discretionary effort within an exchange theory model17 an additional consideration is a ‘deficit
16 Employee ‘engagement’ has been defined and operationalised in the literature in a variety of ways but, broadly, engaged employees are fully involved in, and enthusiastic about their work. 17 “High-commitment” or “high-performance” management styles also invoke the exchange framework, promoting greater mutual commitment between employers and employees. WLB policies are interpreted as an indicator of concern for employee’s welfare which might, in turn, encourage greater employee commitment (Evans 2001). White et al. (2003) find that high-commitment or high performance management practices can, however, have negative impacts on
22

model’ – in the absence of work-life balance policies, there may be productivity losses due to long hours, stress, fatigue or home to work spillover (Yasbek, 2004). Work-life conflict has been associated with productivity loss and negative spill over (Comfort, et al, 2003; White et al, 2003). By contrast, as presented in the model above, the presence of WLB policies confers greater control over when and how to meet potentially conflicting responsibilities, can prevent stress and, in turn, lead to positive affective outcomes.
The Figure 5.1 model also indicates a direct link from WLB policies to higher calibre staff or a reduced likelihood of skills shortages. A number of studies have found that WLB opportunities are an important component of a broader package of rewards which includes salary, and which many job applicants are looking for to the extent that they can sway a final decision. With a broader pool from which to select, firms can choose the best candidates thereby optimising staff ability and productivity.
Many businesses also conduct benchmarking within the context of a competitive labour market. WLB policies have become increasingly prevalent, potentially triggering further growth as firms recognise that they may be at a strategic disadvantage if they do not provide arrangements that compare to those provided by their competitors in the labour market (Yasbek, 2004; Dex and Scheibl, 2002)
5.2 Benefits of Flexible Working In this subsection we look specifically at the benefits of flexible working at company level, examining, in turn: productivity/profitability, absences, recruitment, retention, and ‘other’ benefits. The section ends with a consideration of national level benefits.
Under each of the benefit outcomes investigated the literature is reported to a consistent structure. The subsections initially divide the findings methodologically, looking at econometric evidence, case study findings and then primary research. Each subsection concludes with a brief summary of the findings, combining evidence from the different methodological approaches.
Productivity, profitability
The route to higher productivity or performance, as set out in the conceptual schema above, is either by means of greater discretionary effort, higher engagement levels, superior balancing of work and family responsibilities (with associated reductions in stress), or it is due to the recruitment of higher calibre staff. Higher productivity is associated, in turn, with enhanced profitability. Profitability is also improved through the ‘reduced costs’ route by means of fewer absences, lower turnover and building costs etc., each of which are discussed below in subsequent sections.
workers, as they elicit discretionary effort in the form of longer hours or intensified practices. Work-life balance policies may be instrumental in offsetting these adverse effects (Smeaton and Young, 2007).
23

Econometric evidence
There is a growing body of econometric research investigating correlations between firm performance (measured in a number of ways) and flexible working practices.
The evidence base is somewhat mixed, however, and this section therefore divides the findings into those that are positive (differentiating single policy findings from evidence of the positive impact of providing bundles of flexible working arrangements), neutral or negative, prior to summarising the evidence at the end.
Positive impacts
Using WERS (2004)18 data, Riley (2007) explored the impact of working from home on several performance measures: productivity (subjectively assessed), performance (subjectively assessed) and financial performance (objectively measured, based on gross value added profit per employee). Findings were statistically significant in relation to subjective productivity and objective measures of financial performance. Among firms that permit homeworking, the percentage that report above average productivity is 10 per cent higher than firms that do not. In one model, working from home was significantly associated with 15 per cent higher gross value added. The remaining measures were positive but did not achieve statistical significance.
In one meta-analysis of around 29 studies from the 1970s and 1980s, Baltes and Briggs (1999) assessed the effects of flexible and compressed workweek schedules on four work-related criteria: productivity/performance, overall job satisfaction, absenteeism, and satisfaction with work schedule. Flexible work schedules had significantly positive effects on employee productivity and, most notably, employee absenteeism. Self-rated performance was not, however, positively affected by the introduction of a flexitime schedule. Compressed workweek schedules were not found to be related to productivity but were significantly associated with self-rated performance.
Positive impacts – bundling
In terms of flexible working arrangements, the manager questionnaire in the Workplace Employment Relations Study (WERS) asks about the following working arrangements and practices: flexi-time, job sharing, term-time working only, working at or from home during normal hours and ability to change from full- to part-time hours. Analysis of WERS (1998) by Dex et al (2001) found no significant associations in the private sector between labour productivity and availability of any of the flexible working options, but did find an increased likelihood of managers stating that their firm had above average labour productivity associated with an index of the number of WLB policies.
Gray (2002) supports Dex et al’s findings. This work uses the same dataset and finds that combining the full range of flexible and family-friendly policies is
18 Workplace Employment Relations Study (WERS), 2004.
24

associated with clear performance benefits. The probability of above-average performance was calculated and 97 per cent of workplaces with a full suite of family-friendly and flexible working policies were found to be above average compared with only 55 per cent of workplaces with no such policies.
Perry-Smith and Blum (2000) similarly found that organisations with more work–family initiatives, including flexible working, had higher perceived organisational-level performance, compared with organisations with fewer initiatives. Their study used a national sample of 527 American firms.
Konrad and Mangel (2000) analysed data from a survey of 658 American organisations19 to assess the impact of work-life programmes on firm productivity (measured using objective sales per employee). They constructed a WLB index (0-19) from multiple policies and practices and found that WLB programmes20 had a significant association with productivity, but only in businesses with a higher proportion of female employees and in businesses with a higher proportion of professional workers. The model was only able to explain 7 per cent of the variation in productivity, however. Nevertheless, Konrad and Mangel note that among professionals, work-life conflicts tend to arise when employees reach their peak productive years in their 30s and 40s. Therefore, the potential productivity gains from alleviating such tensions are significant.
Clifton and Shepard (2004) examined productivity (net sales/employees) in 188 large Fortune 500 companies in 30 industries in the US economy. Cross-sectional firm-level data on work and family programmes were combined with financial data on companies to estimate production functions. A WLB index was constructed (based on 29 items relating to flexible working, leave and other supportive measures). A ten per cent increase in the WLB index (i.e. approximately an additional 3 initiatives) was found to be associated with a 2-3 per cent increase in productivity.
Stavrou (2005) examined the relationship between flexible working arrangement (FWA) bundles and organisational performance in the EU. Data were collected through the CRANET questionnaire, distributed throughout fourteen of the fifteen EU member states prior to May 2004 (final sample: 2,811). Organisational performance was measured through managers’ perceptions of profitability, productivity and service quality – performance was deemed superior if corporate HR perceived it to be in the top 10 per cent in comparison with other organisations in its field: in other words, superior performers were organizations in the top 10 per cent in productivity, profitability and service quality. Bundle 1 included part-time work, job sharing and flexitime; bundle 2 included home-based work and teleworking. A statistically significant positive relationship with spatial
19 3000 businesses initially sampled, 849 replied, producing a response rate of 28 per cent. The sample was comprised of a wide industrial spread but was skewed toward larger businesses (average size 7,400 staff).
20 Including on-site daycare, emergency childcare, sick days for childcare, extended maternity leave, gradual return to work, paternity/parental/adoption leave, flexitime, part-year working, reduced hours and job-sharing.,
25

flexibility, i.e. homeworking/teleworking was found, but not with the time flexibility bundle (bundle 1). This suggested that homeworking opportunities were associated with enhanced performance. Within the EU, homeworking was the least widespread of the working arrangements explored (reported in just 20 per cent of workplaces).
Whitehouse et al (2007) have also explored the relationship between subjective measures of financial performance and family-friendly practices (FFPs)21 in the private sector, but have extended previous WERS-based studies by exploiting the panel element, over the period 1998-200422, a period when many workplaces increased their provision of family-friendly arrangements. The panel survey includes 938 workplaces. As the authors note, most previous studies have been based on static, cross-sectional measures alone. Their models also include workplace-level indicators of management practice to explore Bloom et al’s (2006) contention that any relationship between FFPs and financial performance is mediated by ‘good management’ practices23. Two models were run, the first looking at the impact of change in family-friendly provision (a scale based on 11 items), the second at change on the flexible working arrangements scale (based on 6 items). A positive relationship between change on both the flexible working and family-friendly scales and relative improvement in financial performance was found. Indicators of good management practice (e.g. multi-skilling, teams, joint committees and quality circles) were not found to be associated with financial performance (apart from multi-skilling) and, notably, inclusion of good management practice measures did not displace the significant positive associations between family-friendly or flexible working arrangements and financial performance.
Neutral impacts
Wood and Menezes (2010) analysed WERS (2004) and found no statistically significant associations between the presence of family policies in the workplace (a single index of leave and flexible working) and manager perceptions of labour productivity, financial performance or quality of work. Family policies were therefore interpreted as business neutral.
Analysis of WERS (1998) by Gray (2002) found no significant association between productivity levels or performance (subjectively measured) and a range of flexible working practices including: working from home, flexi-time, compressed
21 The FFPs examined by Whitehouse et al (2007:8) include both the flexible working arrangements and family-friendly policies which have been differentiated for the purposes of this study, including: ‘leave, working-time flexibility and child care arrangements delivered through statutory entitlements and formal or informal provisions at the workplace’. 22 http://www.esds.ac.uk/findingData/snDescription.asp?sn=5294&key= 23 Whitehouse et al (2007) acknowledge, however, that they are unable to determine whether financial performance gains reflect financially successful enterprises being more likely, and more able, to afford FFPs or are an indication of an increasing number of FFPs leading to financial improvements.
26

working weeks and term-time working, which may all therefore be interpreted as business neutral. Two exceptions were job-sharing and part-time work, which are discussed below.
Other recent studies (Bloom et al, 2006; Bloom et al, 2010) are critical of many papers which describe employer benefits. These previous studies are described as being based on unreliable analytical premises and spurious associations. The critical factor in promoting enhanced performance, contend Bloom et al, are ‘good management practices’ (defined as including target setting, monitoring, use of incentives and shop floor practices). Where good management practices are in place, WLB policies are also often implemented. When the various effects are disentangled, WLB policies are found to be performance neutral. Bloom et al’s critique of previous studies may be over-stated, however, as many of the studies listed above do indeed attempt to control for ‘management practices’ such as high performance management approaches.
Analysing a survey of manufacturers in the US, UK, France and Germany, Bloom and van Reenan (2002) found no significant association between family policies (flexibility for emergency childcare, childcare subsidy, homeworking or jobsharing) and productivity or performance. Re-analysis of the same dataset by Bloom et al (2006) found a positive and significant association between WLB policies and productivity, but once management practice measures were added to the model, the association was no longer significant.
The Stavrou (2005) paper, referred to in the positive bundling section above, found that while homeworking/teleworking arrangements gave rise to performance gains, performance was insignificantly associated with the flexible hours bundle including flexi-time, reduced hours and job sharing.
Negative impacts
Other evidence from WERS suggests that some flexible working arrangements are associated with poorer business performance. A high incidence of job sharing, for example, has been found to be associated with statistically significant reductions in financial performance, product quality and labour productivity (panel 2 Table 5, Budd and Mumford, 2003: 17). Analysis of WERS (1998) by Gray (2002) similarly found that in businesses which offered job sharing, the manager was 49 percent less likely to say their productivity levels were above average compared with mangers in businesses without job sharing opportunities.
Evidence of negative impacts therefore appears to be restricted to job-sharing policies alone, which is one of the less widely available and less used of the flexible working arrangements under consideration.
Interpreting the econometric evidence
In seeking to understand the diversity of econometric findings several key issues should be noted. Firstly, it may be the case that positive or negative associations which aren’t statistically significant may be so because of small sample sizes
27

(some working practices are not widely used or available)24. In these instances neutrality of impact is assumed.
Secondly, evidence based on cross-sectional data can be misleading. If a business has very high rates of absence or performance problems, for example, it may be motivated to introduce flexible working as a solution. This may be an effective policy in driving down absence levels or pushing up performance but, when compared with other businesses, the levels may still be somewhat higher/lower than their competitors. Hence the importance of studies which chart change over time in order to effectively establish the counterfactual.
Thirdly, the modelling process can lead to different findings from the same dataset depending on the techniques used, the outcome measures deployed and the degree of rigour exercised at the model testing stage – the latter is often not reported in published articles. Differences in results may therefore be an artefact of the data analysis methods and techniques adopted. Simply adding or subtracting individual explanatory variables to a model will adjust all other coefficients and, in a model that is not robust, this can lead to findings shifting from statistically significance to insignificance (and vice versa), and can even change the direction of the association.
Fourthly, it should be noted that findings reported are from studies which use different datasets, at different points in time,;some are UK-based, others use data from elsewhere in the world, most are cross-sectional, but one study uses panel data.
Finally, in some studies, omitted variables can distort results. This is the point made by Bloom et al who suggest that many papers report results based on models which fail to include management practices as explanatory variables. Bloom et al suggest that good management practices are positively correlated with a range of flexible working and family-friendly policies, hence the latter can appear to be positively associated with performance outcomes25. When both sets of explanatory factors are included in models, the WLB policies lose their significance. In addition, it is very difficult to control for the wide range of other factors that might influence profitability and financial performance, including the external economic environment, again an omitted variable challenge.
These issues also apply to the variation of some findings presented in the sections below which look at the impact of flexible working on absences, retention and recruitment.
Productivity, profitability: summary of the econometric evidence
In summary, there is scattered econometric evidence that some flexible working practices have a negative impact on performance or productivity, with two studies suggesting that job-sharing is associated with depressed performance. A few
24 Sample size limitations can lead to type II errors where findings fail to reject the null hypothesis (i.e. that there is no relationship). 25 This is a multicollinearity problem.
28

studies find that each of the flexible working arrangements, including homeworking, reduced hours, compressed working weeks and term-time working are performance neutral with two studies finding that bundles of flexible working options are also statistically insignificant. The majority of evidence, however, suggests a significant and positive relationship between various flexible working practices and business performance, most frequently when flexible working and family-friendly policies are combined, allowing employees to access and choose from a portfolio of working arrangements.
While there are some studies which find that the impact of flexible and/or family-friendly policies is displaced by the inclusion of good management practices within models, other studies which similarly control for a range of management and human resource practices do not reach the same conclusion. The volume of evidence therefore leans toward a positive business case position.
Case study evidence
Several case-study based investigations into the productivity impacts of flexible working have also been undertaken which, although not generalisable due to their context specificity, do highlight the scope for business gains in relation to individual performance, productivity and/or service delivery.
An assessment of the impact of their flexible working policies by British Telecom indicates that productivity gains are associated with homeworking. Homeworking call centre staff handle up to 20 per cent more calls than their office-based counterparts and give comparable or better quality responses than office colleagues (BT, 2007).
In June 2000 a WLB challenge fund was launched. It was open to all employers from the private, public and voluntary sectors in England and Scotland. Employers were invited to apply for funds to support the design and implementation of work-life balance projects, all of which would run for 12 months. Successful applicants received advice from specialist consultants to help them develop and implement work-life balance policies and practices. All projects were required to measure financial savings, reductions in absenteeism, staff retention levels and the take-up of work-life balance options by staff. An analysis of the programme by Nelson et al (2004) did not quantify any costs and benefits encountered by scheme participants, but did find that 11 per cent of the businesses reported an improvement in productivity and/or service delivery. Larger proportions cited other benefits, which are reported below in the relevant sub-sections.
Research by Cranfield University School of Management and Working Families, looking at the impact of flexible working arrangements in seven large private corporations, found that the majority of flexible workers, their co-workers and their managers reported that there was either a positive impact or no impact on individual performance. This applied to both the quantity and quality of work produced but the evidence was not quantified (Working Families, 2008).
Case study evidence is further provided by GULC (2010) which reports improved performance and staff turnover at First Tennessee Bank (FTB). FTB introduced a
29

flexible working schedule and part time options in 1992 in response to escalating costs and customer complaints associated with employee turnover. By 1997, 5 years after the policy changes, more than 60 per cent of employees were using these opportunities, to which FTB attributed a customer retention rate of 96 per cent compared with an industry average of 87 per cent.
Primary research - survey based evidence
Research from the British Chambers of Commerce (BCC, 2007), based on an online survey of 408 businesses, found that 58 per cent of employers perceived flexible working arrangements to be associated with an improvement in productivity (46 per cent claiming some improvement, 12 per cent significant improvement, 38 per cent saw no effects and just 4 per cent a decline in productivity).
Similarly, the Third Work-Life Balance Employer survey (Hayward et al, 2007) found employers reported a positive effect on productivity. Employers were asked to state whether the effect of ‘flexible working and leave arrangements’ on a variety of elements of business practice was positive, negative or neutral. The results are presented in Table 5.1. In all cases, the number seeing positive benefits had reduced since 2003, but this was in favour of seeing no effects rather than negative effects. Authors speculate this is because WLB practices are now regarded as ‘the norm’.
Table 5.1: Effect of ‘flexible working and leave arrangements’ on business
Positive effect 2003
Positive effect 2007
No effect 2007
Negative effect 2007
Employee relations 71 58 27 5
Motivation & commitment
69 57 27 5
Recruitment 47 42 40 5
Labour turnover 54 42 38 5
Productivity 49 41 35 10
Absenteeism 48 38 39 9
Source: Work-Life Balance Employer survey (Hayward et al, 2007)
A survey of 1,629 employees and managers in 5 organisations of varying sizes (Corporate Voices, 2009) indicated that 80 per cent of employees and 79 per cent of mangers believed that use of flexible working arrangements was positive or very positive for team productivity and effectiveness.
30

An EU-wide study by Chung et al (2007) set out to explore the main determinants of different working time systems in the workplace and analyse the perceived impact on companies using different arrangements on performance in terms of economic success, employment stability or growth. Based on the perceptions of managers reported in the European Establishment Survey on Working Time 2004–2005, the proportion of companies that considered the economic situation of their establishment to be ‘very good’ was higher for those with high-flexibility (19 per cent) compared with establishments with low flexibility (15 per cent). The differences, however, are noted to be very small (just 4 percentage points) and disappear when ‘very good’ and ‘quite good’ responses are combined (83 per cent and 84 per cent respectively).
Change over time
One of the research questions this study set out to explore was whether the effects of work life balance practices (flexible working and family-friendly policies) change over time and whether there is any evidence on the duration of costs or benefits. No evidence has been found to answer this question, with three exceptions.
Firstly, an econometric meta-analysis by Baltes and Briggs (1999) found that flexible working schedules were associated with productivity gains, but that positive effects decreased over time. It was therefore suggested that flexible work schedules have ‘waning effects over time’ which ‘may be a direct result of employees becoming accustomed to the new schedules and eventually accepting them as the norm’.
Secondly, a CBI survey of 330 senior executives (in businesses of all sizes and sectors) asked employers to assess the impact of flexible working on different aspects of their business (CBI, 2010). Employers described impacts as positive in relation to recruitment and retention (53 per cent positive) and, to a lesser extent, productivity (31 per cent positive) and absence rates (36 per cent). The CBI report shows, however, that the trend over time in relation to recruitment and retention is downwards. The proportion of employers citing positive impacts of flexible working on recruitment and retention has dropped from 65 per cent in 2007, to 63 per cent in 2009 and down to 53 per cent by 2010. It is argued that the prevalence of flexible working opportunities has led to changed expectations among employees who no longer value the benefits of flexible working as highly as before. The same downward trend is not evident, however, in relation to productivity and absences, both of which have fairly stable proportions of around one-third of employers viewing their impacts as positive (with two-thirds suggesting neutrality).
Similarly, the Third Work-Life Balance Employer survey (Hayward et al, 2007) found that the number of employers reporting a positive effect on productivity declined between 2003 and 2007. Authors speculate this is because WLB practices are now regarded as ‘the norm’.
31

Productivity, profitability: summary of research findings
Summarising the findings relating to productivity, most primary, survey-based research supports a business benefits hypothesis, with some support for a business neutral position. Case study evidence overwhelmingly presents findings in support of a positive association between flexible working opportunities and productivity/performance gains but there are concerns about the sampling frames used and the selection of good practice employers. Econometric studies are somewhat more mixed, but where an index of flexibility is used, i.e. a ‘bundling’ approach, findings are usually positive, suggesting the value of a strategic approach to flexibility by means of a comprehensive provision of flexible working and family-friendly initiatives.
There is some evidence that the impacts of flexible working on productivity and other outcomes may be diminishing over time, and given the increasing prevalence of such opportunities across all business sectors and sizes it might be expected to yield diminishing returns, but research into this issue is scarce and remains a key gap in the evidence base.
Absences
As discussed above, in section 5.1, absenteeism is a significant problem for which new solutions are being sought. It has been claimed that “traditional and inflexible work practices require people to be absent from work for longer than they need to be”26. The most common reasons given for absence are colds, stomach aches, back pain and stress – interpreted by managers as attempts to prolong weekends, low morale and childcare problems (Work Foundation, 2002). Insofar as managers are correct in their assessment of the ‘real reasons’ there is plenty of scope for tackling absence, including flexible hours, working from home opportunities and compressed working weeks.
As set out in the conceptual schema above in section 5.1, absences may be reduced through flexible working either because of greater job engagement or commitment on the part of the employee, or because of the employee’s ability to better juggle competing pressures on time from home and work.
A study by Working Families (2005)27 examined the relationship between flexible working initiatives and absence levels finding that:
• The top three causes of absence, in the following order are (i) workplace stress, (ii) managing caring responsibilities and (iii) managing other work-life issues.
26 www.flexibility.co.uk/flexwork/general/absenteeism 27 The quality of the survey on which these findings are based is a concern – questionnaires were distributed to 2,000+ organisations, including Working Families Employer Members. Follow-up emails were sent to publicise the on-line version of the survey on the Working Families website. In total, 52 responses were received, of which 33 responses contained useful data in time for inclusion – a response rate of 2 per cent.
32

• The most used tool in managing absence was line manager involvement. • Flexible working options were the most used incentive, and return to work
interviews for long-term absences the most used disincentive to absence. • Flexible working options were perceived by respondents as the most effective
of all absence management tools. • Flexible working was perceived as having a high impact on reducing absence. • No survey respondents were able to quantify the cost of flexible working
options or place a value on the benefits/savings that had been achieved through them.
Econometric evidence
Analysis of the Workplace Employment Relations Study (WERS) (1998) by Gray (2002) found that the following policies and practices had no effect on absence rates: working from home, job sharing, flexi time, compressed working weeks, part-time and term time working. Dex et al (2001) also analysed WERS (1998) and found no significant associations between absence and flexible working opportunities with two exceptions: both term-time & flexitime were significantly associated with higher levels of absence. A further study of WERS found that the incidence of work related illness absences was reduced by means of part-time-work and flexi-time but exacerbated by compressed working weeks28 (Barnes et al, 2009).
Stavrou’s (2005) study of flexible working bundles (described in the productivity section above), explored the relationships between flexible time arrangements and flexible working location and productivity, absenteeism and turnover. The average number of absence days was found to be 8. Flexible hours opportunities (part-time, flexitime, jobsharing) were not, however, significantly associated with absenteeism, while homeworking/teleworking did significantly decrease the incidence of absence by nearly 3 days.
Working from home and part-time hours were found to be significantly associated with rates of absence in Canadian businesses, according to Dionne and Dostie (2005), based on analysis of the Workplace Employee Survey (1999-2002). Job satisfaction, as an intervening variable, was also found to be associated with rates of absenteeism. Employees who were satisfied with their jobs were 0.825 (i.e. less) likely to be absent than those dissatisfied with their jobs. Employees who worked from home at times had 0.885 times the rate of absence compared with those who never worked from home. The equivalent figure for employees who worked reduced hours was, unexpectedly, 1.3 times the absence rate.
Baltes and Briggs’ (1999) meta-analysis assessed the effects of flexible and compressed workweek schedules on productivity, self-rated performance, job
28 This form of flexibility may therefore carry the kind of risks that have been identified with shorter working hours in France, where reductions have led to a ‘densification’ of work, often coupled with fewer and shorter breaks, an associated intensification of the working day and a tenfold increase in musculoskeletal disorders (TUTB Newsletter No. 19-20, September 2002).
33

satisfaction and absenteeism. Of all the outcomes under consideration, absenteeism was the most affected by the introduction of flexitime. There was no significant association between absences and compressed working week schedules however.
Case study evidence
Nelson’s (2004) evaluation of the WLB challenge fund (described above) found that 21 per cent of scheme participants reported a reduction in absences and sickness levels, but was unable to establish the scale of improvement.
Schiebl (1999) reported findings from a study conducted at the Chubb group of insurance companies who conducted a self-evaluation. The firm claimed to have achieved a reduction in absences from 12,120 days per year to 10,549 days per year following the introduction of flexible working, telecommuting and a paid time-off policy for family illnesses. The policy was introduced in light of findings from exit interviews, conducted in response to very high turnover levels. The interviews revealed that one third of staff leaving the company did so in order to improve their home/life balance. In assessing the impact of the policies, Chubb used focus groups and statistics on staff absence days before and after the initiatives had been introduced.
The introduction by BT of ‘Workstyle’ – a scheme to promote more flexible working practices, including homeworking – was found to be strongly associated with rates of absenteeism. Homeworkers are described as taking 63 per cent less sick leave than their office-based colleagues (BT, 2007: 6)29.
Primary survey data evidence
Although some absences are inevitable, evidence suggests that workplace arrangements can reduce them. For example, the third work life balance survey of employers suggested that 38 per cent of employers believed that work-life balance practices had a positive effect on absenteeism (Hayward et al, 2007). The CBI employment trends survey asked employers to assess the impact of flexible working on different aspects of their business - 36 per cent of businesses described the impact as positive on absence rates while a further 63 per cent described it as business neutral (CBI, 2010).
Absences: summary of research findings
Summarising the findings presented above, the overall balance would suggest that flexible working arrangements can effectively reduce absence rates.
Case study and primary survey research evidence points in the direction of business benefits, with reduced levels of absence associated with the introduction of flexible working practices.
The econometric evidence is a little more mixed. Findings suggest: homeworking is significantly associated with lower absence rates (with just one study
29 Absence rates are not presented
34

suggesting neutrality); flexitime is associated with lower absence rates in two studies (with a further two studies suggesting neutrality); part-time working evidence is the least clear with studies indicating neutral, significantly positive and significantly negative outcomes. There is no evidence to suggest that compressed working weeks are associated with improvements in absenteeism with one study suggesting that shorter, more intensive working weeks may increase sickness absence.
A single case study, of course, cannot be generalised and the primary research survey evidence is not based on objective measures using, instead, managers’ impressions of impacts. The WERS-based econometric studies, by contrast, are based on actual numbers of absences over the previous year.
Recruitment
Analyses of the British Social Attitudes Surveys (1989, 1993) and Working in Britain (2000) survey, conducted by Smeaton (2009), indicate that the proportion of women working as hard as they can “even if it interferes with the rest of my life” fell from 51 per cent in 1993 to 35 per cent by 2000. The equivalent ‘work effort’ among men fell from 60 per cent in 1989 to 53 per cent in 1993 and down to 36 per cent by the year 2000. These declines are fairly dramatic and suggest a significant change in orientations toward work. Combined with decreased levels of satisfaction with work (Smeaton, 2006a), perceptions of less job security (Green, 2001) and an intensification of work (Smeaton and Young, 2007), these pressures may have united to cause a re-evaluation of how work, leisure and family are prioritised. Men and women may increasingly be using a different set of criteria, or different prioritisation of criteria, in the selection of jobs. As indicated in the background chapter, the demographic make-up of the UK workforce has also been evolving, leading to shifting needs in terms of working terms and conditions. Implications arise for employers seeking to attract the right candidates for available jobs. If flexible working opportunities are in increased demand, their provision can be expected to improve the effectiveness of recruitment drives among businesses.
Econometric studies
Chung et al (2007) explored the importance of flexible working in EU organisations in terms of staff recruitment. They found that high flexibility firms performed little differently from average. In terms of skilled staff, among establishments classified as ‘high flexibility’, 36 per cent experienced recruitment problems compared with 31 per cent of low flexibility establishments and an average figure of 35 per cent. In terms of low or unskilled staff the equivalent figures were 11 per cent, 12 per cent and 13 per cent respectively. These findings suggest that flexible working provision is not associated with a business advantage in terms of recruitment of higher or lower skilled staff.
Case study evidence
One case study of a tax services firm employing 800 staff reported in Corporate Voices (2011) found that the introduction of a results-only work environment and
35

extension to paid maternity and paternity leave had a radical effect on staff retention rates. The results only system enabled staff to work flexible hours, work from home and have more control over their hours of work. Since its inception in 2008, the scheme is described as having led to “former employees returning in droves”.
Primary research – survey based evidence
Employee surveys are one source of data on the importance of WLB policies and practices in the decision to take a job. A survey of 1,629 employees and managers in 5 organisations, conducted by Corporate Voices in 2009, found that most (83 percent) of the respondents who had joined their company in the previous two years reported that flexibility was either “very important” (43 percent) or “somewhat important” (40 percent) in their decision to take the job, suggesting that the presence of WLB opportunities are a recruitment advantage. Surveyed managers concurred, with four‐fifths (79 percent) claiming that their ability to recruit talented employees is enhanced by the ability to offer flexible working opportunities, including about two‐fifths (45 percent) who reported it was enhanced “a great deal” or “very much”.
Another source of evidence are studies which explore under-employment or perceived barriers to preferred employment. Many women, for example, are working below their potential (DWP, 2009). The Women and Work Commission (2006) estimated that removing barriers to women working in occupations traditionally undertaken by men, and increasing women’s participation in the labour market could be worth between 15 and 23 billion pounds or 1.3 to 2.0 per cent of GDP. In a survey by the Equal Opportunities Commission (Grant et al, 2005) women claimed their ‘underemployment’ was due to a lack of part time jobs that utilised their skills and experience. Hurrell et al (2007) suggested that around 6.5 million people were not fully using their skills and experience at work and would have made different choices if flexible working had been available.
Smeaton and Young (2007) were commissioned by the EHRC to design and analyse a telephone survey of 900 employers in England during 2006, in order to explore the availability of flexible working opportunities, the rationale for their implementation and perceptions of key obstacles. A range of motivations were cited for the use of flexibility in the workplace, including the promotion of job satisfaction, staff morale, retention and loyalty (Table 5.2). Only 5 per cent of employers associated flexible working with recruitment, however. This is a similar finding to that reported in Harris and Foster (2005). Their study of small service sector businesses was designed in part to assess the extent to which flexible working incentives were used to attract and retain employees. They found that flexible work arrangements were indeed recognised as a means of promoting commitment and staff retention, but were rarely part of 'an explicit, pro-active recruitment strategy' (Harris and Foster, 2005: 9). Despite the majority (two- thirds) of businesses surveyed by Smeaton and Young experiencing recruitment difficulties, they rarely perceived an association between flexible work and recruitment, although they did more often acknowledge the link with retention.
36

Table 5.2: Reason given for providing staff with flexible working opportunities
Per cent:
To work around family life of staff / to benefit employees 37
To improve job satisfaction or morale 19
To retain staff 19
To improve client service - for business reasons 14
To improve staff loyalty 10
Demand from staff 7
To meet customer demand 6
To attract a wider range of staff 5 To give people ‘quiet time’ away from the office 4
To improve productivity 4
Base: All businesses which provide some form of flexible working arrangement
841
Notes: Reason categories are included in the table if mentioned by at least 20 employers.
Source: Smeaton and Young (2007)
An increased ability to recruit can prevent unfilled vacancies, prevent firm based skills shortages and widen the potential talent pool thereby improving the skills base. 42 per cent of employers in the third work life balance survey reported that flexible working had a positive effect on recruitment in their establishment (Hayward et al, 2007). Nearly 40 per cent of employees said the availability of flexibility was important for them when initially deciding to work with their current employer (Hooker et al, 2007). The CBI employer survey conflates recruitment and retention and found that, in 2010, 53 per cent of employers viewed flexible working as having a positive impact on their business (with a further 46 per cent indicating neutrality)(CBI, 2010).
Recruitment: summary of research findings
Overall, there is far less evidence relating to the recruitment benefits that employers may reap when introducing flexible working policies compared with other benefits such as productivity or staff turnover. In terms of econometric studies, this remains a gap in the evidence base.
Summarising the findings, only one econometric study was found, and this suggested no significant association between flexible working and recruitment benefits. The single case study that was found, by contrast, indicated improved recruitment resulting from flexible working, but it is highly context dependent.
37

Evidence from employee surveys suggests that the majority are attracted to jobs by flexible working opportunities and that a lack of flexibility accounts for a considerable amount of under-employment.
Evidence from employer surveys are far more mixed with under half of respondents in one survey indicating that flexibility helps recruitment, a figure that rises to four-fifths in another survey. In a third survey, flexibility has been introduced by employers for a wide variety of reasons, but recruitment barely featured as one of these.
There is a need for more research in this area based on rigorous methods that can assess change over time associated with a change in policy. Existing employer surveys focus on managers’ impressions of recruitment benefits, which may not accurately reflect the power of flexible working opportunities to broaden the potential recruitment pool. More persuasive are employee surveys, which identify the specific working arrangements that individuals seek and prioritise when searching for a job. On the basis of the latter, flexible working arrangements would seem to improve the scope for recruitment.
Retention
Staff retention is a priority for most employers given the potentially high costs associated with turnover. Replacing staff incurs a range of costs including: advertising, interviewing, productivity dips associated with lost firm-specific knowledge, training and, on occasion, relocation costs. Given the high costs, discussed further in section 5.1, it is therefore in the interest of businesses to find cost-effective methods to promote staff retention. According to several studies, flexible working practices are one such approach.
Econometric studies
In terms of flexible working arrangements, Dex et al (2001) analysed the Workplace Employment Relations Study (WERS) (1998) to predict staff turnover (measured as the ratio of the total number of leavers during the last 12 months to employees in employment). They found that none of the flexible working opportunities were associated with labour turnover, apart from term-time working which increased labour turnover.
Analysis of WERS (1998) by Gray (2002) examined the association between staff retention (measured in terms of whether managers perceived their company to be above or below their industry average in relation to voluntary resignations) and various flexible working, family leave and support for dependent care policies. Around half the policies and practices considered were business neutral with no statistically significant positive or negative associations. There was, however, a statistically significant association between voluntary resignations and working from home, flexitime, compressed working weeks, financial help for childcare and the presence of a workplace nursery. Where working from home was available, managers were 22 per cent less likely to say their rate of voluntary resignations were above average compared with managers in businesses without working from home opportunities. The equivalent figures for the other policies were as follows: flexitime (37 per cent less likely), compressed working weeks
38

(38 per cent less likely), financial help for childcare (36 per cent less likely); and workplace nursery (39 per cent less likely).
Stavrou’s (2005) europe-wide study of flexible working bundles (described above), explored the relationships between flexible time arrangements and flexible working location and productivity, absenteeism and turnover. Flexible hours arrangements were significantly associated with annual staff turnover, reducing it by around 5 per cent. The relationship was most pronounced in the private sector. There was no statistically significant association between turnover and homeworking/telework, however.
Baugham et al (2003) find evidence of some family supportive benefits lowering the incidence of turnover rates. Their analysis of a survey of 120 employers (of varying size and sector but excluding micro businesses with fewer than 5 staff) in an upstate New York county explored whether employers who offer “family-friendly” benefits are able to benefit from reduced turnover. Most of the practices investigated, including compressed working weeks, job sharing, flexible scheduling, were not associated with labour turnover, suggesting no adverse consequences were associated flexible working practices.
Qualitative studies
Business case studies also provide evidence of the potential impact of flexible working schedules on staff retention. One example, reported by Corporate Voices (2011b), is Ryan LLC, a tax services firm employing 800 staff in the US and 100 in Canada and UK. The company started losing top talent as their staff searched for better WLB and started having families. As a result, Ryan LLC implemented a shift in the measurement of performance away from hours toward results – leading to change in where and when staff worked. In addition to offering a results-only work environment, Ryan also enhanced other employee benefits including an extension to paid maternity leave (12 weeks), paid paternity leave (2 weeks) and adoption leave (6 weeks) and family leave benefits. Ryan LLC believe that as a direct consequence of these changes, voluntary turnover declined from about 20 percent to 6 percent.
Based on a statewide survey of Illinois independent non-profit organisations (with 20 plus staff), combined with follow-up personal interviews with top administrators in selected user organisations, Hohl (1996) set out to investigate the use and effectiveness of flexible work arrangements. From an original sample of 245, there was a 64 percent response rate (N = 156). Hohl found that with the exception of job-sharing all thirty administrators questioned found that these arrangements, overall, increased employee morale and retention, reduced tardiness and absenteeism, and improved the quality of performance. One respondent claimed that the industry average employment duration was about one year in the care sector, but using flexible working in his organisation had improved duration to fourteen months.
Nelson’s (2004) evaluation of the WLB challenge fund (described above) found that 12 per cent of scheme participants reported a reduction in staff turnover.
39

Case study evidence from GULC (2010), described above, describes how the introduction of flexible and part-time working at First Tennessee Bank (FTB) in response to high staff turnover was associated, according to FTB, with savings of over $3 million in turnover costs.
In 2008, Corporate Voices (2009) studied the relationship between having the amount of flexibility needed at work and leaving intentions. Among those who do not have the flexibility they need at work, 27 per cent planned to leave their employer within the next 2 years. Among those with access to the flexibility they need, half as many, i.e. 15 per cent, planned to leave within two years.
Primary survey research
Several surveys have been conducted which address the relationship between staff turnover and flexible working arrangements. 42 per cent of employers sampled in the third work life balance survey, for example, said flexible working practices had a positive effect on retention (particularly of female staff), thus saving on recruitment, induction and training costs (Hayward et al, 2007). A CBI survey found that 53 per cent of employers report that flexible working practices had a positive effect on recruitment and retention (CBI, 2009). In a BCC survey (BCC, 2007) 60 per cent of managers reported that offering flexible work patterns and leave arrangements was associated with a ‘significant’ or ‘some’ improvement in staff retention levels.
A study by Corporate Voices (2009), based on a survey of 1629 employees in five organisations, examined the relationship between the need for flexibility and the number of years respondents expect to remain with their companies. The expected turnover rate for employees who do not have the flexibility they need at their workplace is almost twice the rate of those who do have the flexibility they need. 15 percent of those who have the flexibility they need plan to leave within 2 years compared with 27 per cent of those who have an unmet need for flexibility.
Of interest to employers wishing to retain mothers following childbirth, Smeaton and Marsh (2006), found that the main motivating factors associated with voluntary resignations and changing employer on returning to work are: to work more flexible hours (47 per cent), to work fewer hours (41 per cent) or to work after childbirth on a part-time basis (43 per cent). Two thirds of mothers changing employer cited one of these three reasons. One third of mothers who changed their employer did so in order to work more closely to home and 16 per cent to work from home. A further fifteen per cent claimed their resignation was prompted by a lack of support from their old employer.
Similar analyses of a later maternity rights survey by La Valle (2008) found that 76 per cent of mothers returned to work between 12 and 18 months after the birth. Provision of five or more family-friendly arrangements and a generous maternity pay package (combination of SMP and OMP) were positively associated with a return to work. Eighty-six per cent of mothers with access to five or more family-friendly arrangements went back to work after childbearing, compared with 64 per cent of those who reported one or two family-friendly arrangements and 42 per cent of those with no such arrangements. In addition, the number of family-friendly arrangements was positively associated with the
40

proportion of mothers going back to work to their pre-birth employer. Ninety-two per cent of returners with access to five or more family-friendly arrangements in their pre-birth job went back to work with their previous employer. In contrast, only 60 per cent of returners with no access to family-friendly arrangements in their pre-birth job returned to their previous job.
Retention during recession
During financial crises, flexible working (such as unpaid breaks, reduced hours or short working weeks) can allow employers to retain skilled staff rather than making redundancies (House of Commons, 2009). Examples of recession driven flexible working include: workers at Futaba, a Burnley car parts factory, were put on a three-day week in April 2011 due to problems in Japan following the March earthquake and tsunami. The move followed that of Toyota, their main customer, which also imposed a 3 day week, along with Nissan and Honda. Toyota employees were still paid in full but expected to work the 'lost' hours once conditions improved30. Following the ‘credit crunch’ in 2008, many other car manufacturers adopted this reduced working week approach, including Bentley.
DWP’s flexible working taskforce report similarly highlighted new schemes such as ‘Flexible Futures’, introduced by KPMG in order to minimise large scale redundancies in the current recession and retain skilled staff. Staff were invited to sign up to a 4 day week or take sabbatical leave of between four and twelve weeks at 30 per cent of pay. 85 per cent of staff signed up for the scheme (DWP, 2009).
A CBI Employment Trends report (CBI, 2009) found that the most popular response to the recession was to increase the use of flexible working. The report found that more than two thirds of employers had increased flexible working (50 per cent) or intended to do so in the near future (30 per cent).
Retention: summary of research findings
In summary, the evidence suggests that flexible working can improve staff retention.
The five case studies cited present evidence that flexible working has helped with staff retention, leading in some cases to very significant savings in turnover costs. Primary survey evidence also found considerable support for the suggestion that flexible working promotes staff retention with survey findings ranging from two-fifths to three-fifths of employers agreeing that turnover is reduced.
The econometric evidence suggests that in terms of staff retention, some flexible working arrangements are a benefit to businesses. The European study found that flexible hours were significantly associated with enhanced retention although homeworking was not significant. The American study (Baugham et al (2003)) was based on a very small sample size of just 120 businesses and the models
30 http://www.thisismoney.co.uk/money/markets/article-1720832/UK-car-makers-put-the-brakes-on-production.html
41

yielded insignificant findings. The two WERS-based studies produced very different findings with one suggesting that improved retention was associated with homeworking, flexi-time and compressed working weeks (Gray, 2002) and the other (Dex, 2001) finding no significant associations between retention and any of the flexible working arrangements analysed. The difference in findings from a common source of data can be explained by the different variables used. Dex used an objective measure of retention – the ratio of the total number of leavers during the last 12 months to employees in employment, while Gray relied on managers’ perceptions of whether their company was above or below their industry average.
Other benefits
Additional benefits that potentially accrue to employers who provide flexible working opportunities include reduced wage costs and buildings/energy cost savings. These are discussed in turn.
Wages
The availability of some benefits, such as flexible working, can be associated with a compensating reduction in salaries. It should be noted, however, that although lower wages have been interpreted as an employer benefit, for the purposes of the current study, which is presented from the perspective of employers, the research literature universally interprets the lower wages associated with using WLB policies as of considerable concern in terms of gender equality (with women using WLB initiatives more often than men) and in terms of longer term-financial welfare.
The results of wage trade-off models by Baugham et al (2003) provide evidence in line with predictions that financial tradeoffs will be associated with implementing a family-friendly benefits package. The analysis was based on a survey of 120 employers (of varying size and sector but excluding micro businesses with fewer than 5 staff) in an upstate New York county. In the most basic economic model of the labour market, employers pay workers in proportion to their individual marginal productivity. Compensation will include cash wages plus benefits (such as health and life insurance, retirement savings and/or family-friendly benefits). The study found that employers offering flexible scheduling paid significantly lower entry-level wages. This result suggests that, in these cases, the employers offering flexibility recoup at least part of any costs associated with these benefits by paying lower wages.
Analysis of WERS (1998) by Heywood et al (2007) found that flexitime was associated with a 22 per cent reduction in salary levels. For all remaining flexible working options, no statistically significant associations with salaries were found, or the findings were unreliable due to small option-specific samples (including working from home, term-time working, compressed working week and part-time opportunities). Budd and Mumford (2003), analysing the same dataset, and the same set of arrangements, found that average workplace wages were significantly lower if job-sharing opportunities were provided, but that all other flexible working options were not associated with wage levels.
42

Glass (2004) also examined the impact of flexible working policies such as flexible scheduling, telecommuting and reduced hours of work on wage growth among a cohort of American mothers in the mid-west. The mothers were followed for 7 years after childbirth. The study found consistent negative effects of using flexibility policies on wage growth after controlling for many productivity-related characteristics (although the effects were found to vary in size depending on the specific policy used). Simulating the wage losses experienced for each work-family policy, Glass found that mothers who ever worked at home in a managerial or professional job faced an average 27 per cent lower wage gain than mothers who did not work at home, making $2.36 less per hour. Mothers employed fewer than 30 hours a week also showed sharply lower wage gains over time. Mothers who ever worked fewer than 30 hours a week with a single employer lost an average 22 per cent of their expected wage gain, i.e. $1.90 less per hour. Comparable losses for using flexitime were 9 per cent ($0.78 per hour). Estimating effects of using each policy over the full 7 years yields more extreme effects, particularly for those working at home and working reduced hours: “Again using managerial and professional women who do not change employers as the reference group, and holding all other variables at their means, continuously working from home 5 or more hours per week would result in an estimated 58 per cent lower wage gain over time, or a loss of $5.03 per hour. Continuously reduced hours of work over this period results in a 49.6 per cent loss, or $4.30 per hour” (Glass, 2004:23).
Building costs reduced
BT introduced flexible working 20 years ago as part of a business strategy and now reports savings of over 725 million euros a year due to reduced ‘office estate’ and 104 million euros a year through reduced ‘accomodation costs’ attributable to the growth in homeworking (BT, 2007: 5). Evidence from Caldow (2009) highlights benefits which have accrued to IBM over many years following the introduction and growth of teleworking:
• Dedicated office space per employee was reduced from a ratio of 1:1 to 4:1. • Return on investment was achieved in the first year: the total cost to transform
10,000 employees into mobile workers was $41.5 million and the resulting saving in real estate costs was $75M by closing floors of buildings and entire buildings when leases came due.
• By 1998, telework was institutionalised and implemented worldwide, growing to 88,000 employees.
• Since 1995, IBM has reduced office space by a total of 78 million square feet. Of that, fifty eight million square feet were sold at a gain of $1.9B.
• Sublease income for leased space not needed exceeds $1B. In the US, continuing annual savings amounts to $100M, and at least that much in Europe.
• By 2009 the ratio of space to employee is now 8:1 with some facilities as high as 15:1.
• Total savings from energy management in 2005 was $22.9 million. • Savings in real estate costs and CO2 emissions far outweigh the cost to
transition an employee to mobile status. Once the infrastructure is in place, marginal costs decrease.
43
National-level benefits
In addition to the positive benefits potentially reaped by employers from the introduction of flexible working practices, some studies have considered the potential gains which could accrue at the national level.
Gornick and Hegewisch (2010) suggest that encouragement of more flexible working arrangements that meet the needs of a wide range of social groups at different points in their lifetime career trajectories could reap significant benefits in terms of national economic performance and individual firm productivity. In the absence of suitable working hours or locations, large numbers of people are either not employed, have retired early, or are working below their potential at a cost that is speculated to run to billions of pounds in the UK. Similar analyses conducted in Germany (Prognos, 2005) suggest that the introduction of a comprehensive set of WLB policies, sustained over 15 years, would increase GDP by 1.3 percent and productivity by 1.6 per cent.
The Government Office for Science (2008) conducted a study to explore a range of correlates, antecedents and consequences associated with well being and mental health. Working conditions were one of the key factors explored and one aim of the project was to identify and analyse possible interventions that could help workers to enhance their wellbeing in the workplace, whilst preserving, or even enhancing, efficiency and productivity (p191). The study concluded that economic benefits are difficult to quantify, but that auditing employee mental health and well being and widening the right to request flexible working may be cost effective due to reductions in the costs of presenteeism (working long but unproductive hours), labour turnover, recruitment and absenteeism. Economic analysis of the costs and benefits of interventions conducted for the study suggested that extension of the right to request to all employees with children at or below the age of 18 might be in the region £165 million per annum – equivalent to a benefit-cost ratio of approximately 2.5. The total economic benefit associated with all individuals of working age being permitted to request flexible working arrangements was estimated to be larger, around £250 million per annum – equivalent to a benefit-cost ratio of approximately 3.531. The authors acknowledged though that both the benefits and employer costs of these initiatives are subject to considerable uncertainty.
5.3 Benefits of Maternity, Paternity and Parental Leave, Family Leave and other Childcare Support
This section follows the same format as section 5.2, but instead of exploring evidence on flexible working practices the focus is on the benefits to business of maternity, paternity and parental leave, family leave or other provisions supportive of families such as workplace nurseries or childcare subsidies. As suggested in Bevan et al, 1999, family-friendly employment can make it easier for
31 Evidence or data upon which the authors drew to perform their cost-benefit analyses were not presented. Foresight should be contacted for further information
44
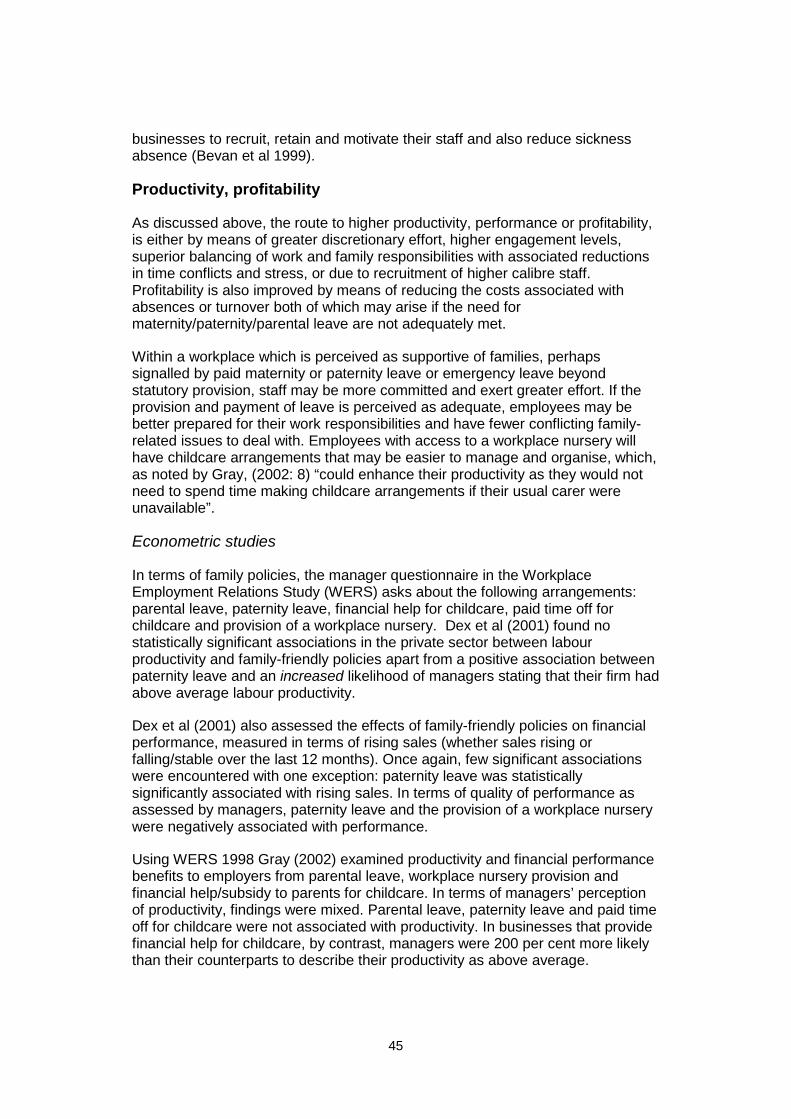
businesses to recruit, retain and motivate their staff and also reduce sickness absence (Bevan et al 1999).
Productivity, profitability
As discussed above, the route to higher productivity, performance or profitability, is either by means of greater discretionary effort, higher engagement levels, superior balancing of work and family responsibilities with associated reductions in time conflicts and stress, or due to recruitment of higher calibre staff. Profitability is also improved by means of reducing the costs associated with absences or turnover both of which may arise if the need for maternity/paternity/parental leave are not adequately met.
Within a workplace which is perceived as supportive of families, perhaps signalled by paid maternity or paternity leave or emergency leave beyond statutory provision, staff may be more committed and exert greater effort. If the provision and payment of leave is perceived as adequate, employees may be better prepared for their work responsibilities and have fewer conflicting family-related issues to deal with. Employees with access to a workplace nursery will have childcare arrangements that may be easier to manage and organise, which, as noted by Gray, (2002: 8) “could enhance their productivity as they would not need to spend time making childcare arrangements if their usual carer were unavailable”.
Econometric studies
In terms of family policies, the manager questionnaire in the Workplace Employment Relations Study (WERS) asks about the following arrangements: parental leave, paternity leave, financial help for childcare, paid time off for childcare and provision of a workplace nursery. Dex et al (2001) found no statistically significant associations in the private sector between labour productivity and family-friendly policies apart from a positive association between paternity leave and an increased likelihood of managers stating that their firm had above average labour productivity.
Dex et al (2001) also assessed the effects of family-friendly policies on financial performance, measured in terms of rising sales (whether sales rising or falling/stable over the last 12 months). Once again, few significant associations were encountered with one exception: paternity leave was statistically significantly associated with rising sales. In terms of quality of performance as assessed by managers, paternity leave and the provision of a workplace nursery were negatively associated with performance.
Using WERS 1998 Gray (2002) examined productivity and financial performance benefits to employers from parental leave, workplace nursery provision and financial help/subsidy to parents for childcare. In terms of managers’ perception of productivity, findings were mixed. Parental leave, paternity leave and paid time off for childcare were not associated with productivity. In businesses that provide financial help for childcare, by contrast, managers were 200 per cent more likely than their counterparts to describe their productivity as above average.
45

Gray (2002) also examined performance in terms of manager assessed profitability compared with industry average. Again, no statistically significant association was found between performance and family leave or support for dependent care policies, indicating that these were neither advantageous nor disadvantageous for businesses. There were two exceptions – in businesses that offered paternity leave and businesses that provided financial help for child care, managers were 93 per cent and 123 per cent respectively, more likely to say their performance was above average.
Using data from the Australian Workplace Industrial Relations Survey, Brandon and Temple (2007) provide evidence on the effects of on-site child care at the workplace and employer-provided family leave on worker absenteeism, turnover, and productivity. The study found that workplaces with on-site child care had higher ratings for worker productivity. Onsite childcare significantly increased the odds of higher than average productivity (managers’ perception) by 1.75 compared with businesses with no such provision. Family leave was business neutral.
Bassanini and Venn (2008) conducted a cross national study of productivity growth in 19 OECD countries between 1979-2003. They estimated the impact of parental leave on productivity using two variables: total weeks of legislated unpaid parental leave and total weeks of legislated paid maternity leave. Longer unpaid parental leave is associated with somewhat higher productivity levels – a one-week increase in the length of available leave is associated with a 0.005 percentage point increase in the level of aggregate productivity. The productivity effect of additional paid maternity leave is larger than for unpaid parental leave at 0.07 percentage points. The authors conclude that “if countries with no paid maternity leave (such as the United States) introduced this measure at the average OECD level (15 weeks), they could increase their MFP [productivity] by about 1.1% in the long-run” (Bassanini and Venn, 2008:10).
Riley et al (2008) analysed the 2004 WERS data to explore the association between paid leave for emergencies and paid time off for childcare and company performance. Statistically significant findings included: manager perceptions of performance (average profits) were positively associated with paid leave for emergencies while manager perceptions of productivity in firms with 50+ staff were negatively associated with paid leave for emergencies. Paid time off for childcare was also negatively associated with productivity.
Non-econometric studies
The review did not encounter primary survey or case study evidence looking at the relationship between family-friendly policies and productivity or profitability outcomes.
Productivity, profitability: summary of research findings
It should be noted that the impact of family-friendly policies, which apply specifically to parents at particular points in their lives, are less likely to lead to measurable business benefits as compared with the potential impacts of flexible working policies that can potentially be used by all staff. Given that family-friendly
46

arrangements are used by smaller numbers of staff for shorter periods of time compared with flexible working policies, statistically significant findings are less likely to emerge. Sample sizes are even smaller in the case of workplace nurseries and financial help for childcare the incidence of which is very low32.
Many of the family-friendly polices under investigation have been found to be insignificantly related to productivity outcomes. Comparing significant findings across the various papers published, little consistency is evident and it is therefore not possible to definitively claim positive business outcomes associated with specific policies. For example, one study found that onsite childcare significantly improved productivity but two further studies found no significant association. Similarly, contradictory findings are evident for paternity leave, parental leave and paid time off for emergencies.
Two studies found negative impacts on subjective measures of business productivity or performance (managers’ perceptions), the first from paid leave for emergencies and paid time off for childcare, the second from workplace nurseries and paternity leave.
This degree of variance in findings reflects the different datasets used (based in UK, Australia and across the OECD) and some of the data analysis limitations discussed above in the summary of section 5.2.1.
Broadly speaking, family-friendly policies can benefit businesses, but the literature that exists provides no firm evidence that they have an effect on business performance.
Absences
Access to a workplace nursery could be expected to lower absenteeism rates by preventing unforeseen childcare problems. Paid time-off at short-notice (emergency leave) encourages employees to formally notify employers of absences which can then be planned for and more readily accommodated than an absence taken without warning. As observed by Gray (2002), paternity or parental leave may reduce absenteeism arising from pressures within the family.
Econometric studies
Brandon and Temple (2006) investigated the Australian Workplace Industrial Relations Survey (1991) to assess the effects of on-site child care at the workplace and employer-provided family leave on worker absenteeism, turnover, and productivity. The study found that workplaces with on-site child care had lower rates of absenteeism. Workplaces that had a family leave policy also had lower rates of absenteeism than workplaces that had no such policy in place. Establishments with onsite childcare were 1.62 times less likely (statistically significant) to report high absence rates. Family leave provision was associated
32 Gray (2002) indicates that 1.5 percent of private sector and 8.8 per cent of public sector organizations provided a workplace nursery among the sample of WERS businesses analysed. In terms of financial help for childcare the equivalent figures were 3 per cent and 6.6 per cent.
47

with a statistically significant reduction (of 0.45) in the odds of reporting high absenteeism. Budd and Mumford (2002), analysing WERS (1998), similarly found that parental leave policies significantly reduced perceived levels of absenteeism.
Gray (2002) analysed WERS (1998) to explore the impact of several family-friendly policies on absence rates in the private sector. The presence of the following were not significantly associated with absence levels: parental leave, financial help with childcare and paternity leave. Managers were, however, a significant 81 per cent less likely to claim their absence rates were above average if there was a workplace nursery compared with managers with no such provision. In workplaces with paid time off for childcare at short notice the equivalent figure was 26 per cent less likely.
Dex et al (2001) also explored the impact of family-friendly policies on absence outcomes using the same dataset as Gray (2002) but extending the analyses to include public sector organisations too. In none of their models did the association between absences and family-friendly practices achieve significance.
Kelly et al (2008) cite one study which investigated whether the use of work-family initiatives have an impact on absenteeism finding that use of on-site child care is unrelated to absenteeism (Goff et al.,1990).
Non-econometric studies
Bevan et al (1999) conducted a study of the business case for family-friendly policies for the DfEE based on 11 private sector business case studies. None of the case study firms investigated had measured or quantified the benefits derived from the provision of family-friendly policies but, as noted by Bevan et al (1999: 77) “anecdotally, each of them was able to highlight where they felt they had benefited in business terms. The key areas included reduced casual sickness absence: most were clear that absence due to sickness of a dependant rather than of the employee had reduced. Employees felt able to be more honest about sickness absence than previously. Reduced days lost also reduced direct costs, and the indirect costs of organising cover and lost or delayed business”. Key family-friendly practices included: childcare schemes, interest free loans for childcare support, discretionary unpaid leave, paid ‘family leave’, enhanced maternity leave and pay, and paid paternity leave
Absences: summary of research findings
In summary, anecdotal case study evidence suggests that a range of family- friendly policies can either reduce absence rates or at least formalise them, and provide forewarning of absence; better enabling employers to re-organise work schedules to prevent disruption.
Among the econometric studies there is evidence to suggest that family/parental leave polices significantly reduce rates of absenteeism (with two studies suggesting neutrality). Evidence also points to the presence of workplace nurseries depressing absence levels (with two studies suggesting significant reductions and two studies neutrality).
48

The findings relating to paid time off for childcare at short notice is less clear with one study suggesting a significant decline in absence rates while two other studies produce insignificant or ‘neutral’ results.
As discussed above, encountering studies with a lot of insignificant results is not unexpected due to the low incidence and usage rates of many of the family-friendly policies of interest and the associated issues of small sample sizes. Overall, however, it would appear that various family-friendly policies can benefit employers in relation to absence control and management.
Labour Market Participation
This sub-section represents a departure from other sections insofar as it does not present the direct benefits of policies to individual businesses, discussing instead the macro level labour market participation impact of family-friendly policies. It is included because measures that increase labour market participation (e.g. of women), thereby expanding the pool from which candidates can be selected, are a benefit to employers seeking to attract staff. Of relevance, therefore, are studies which highlight the relationship between active labour market participation33 and maternity, paternity and parental pay and leave. A number of studies have addressed the macro level impacts of maternity, paternity and parental leave and pay policy and childcare provision.
Ruhm (1998) evaluated the proportion of women active in the labour market in nine European countries during periods when the duration of paid maternity leave was extended. Women’s employment rates both prior to and following childbirth were found to have increased. Ruhm estimated that job guaranteed paid leave of 40 weeks increased labour market participation among 25-35 year olds by 7 to 9 per cent, and increased participation among all working age women by 4.3 per cent.
Zveglich and Rodgers (2003) also found that the introduction of new maternity leave rights in Taiwan had a significantly positive effect on labour market participation among women with a 2.5 per cent increase in employment rates.
Two recent German studies emphasise the importance of parental leave and child-subsidy policy reforms, finding significant increases in the proportion of mothers planning to return to the labour market within 1-2 years of childbirth (Bergman and Riphahn, 2011; Spiess and Wrohlich, 2008). For mothers with youngest child aged 12-24 months, working hours were found to increase by almost 12 per cent on average and their labour force participation rate by more than three percentage points, reducing the relatively long employment interruptions of German mothers (Spiess and Wrohlich, 2008: 583). Fathers also had small increases; 2 per cent on average for working hours and one percentage point in participation rate, for those with youngest child aged 12-24 months. The authors attribute the changes to the removal of disincentives to work under the former system.
33 Active participation includes the employed and those unemployed but searching for work.
49

During the 1980s and 1990s the proportion of women returning to work after childbirth in Britain grew significantly (Hudson et al., 2002). These developments reflected the introduction of maternity rights and family-friendly policies. It is argued that paid leave duration is critical; if maternity leave is too short many women will break their employment rather than return to work while their children are very young (Ruhm, 1998; Smeaton and Marsh, 2006; Gornick and Hegwisch, 2010).
In a review of the evidence relating to various forms of leave and access to measures that grant workers increased flexibility over working hours and location, Gornick and Hegwisch (2010) note that there is now a substantial body of research on the impact of maternity/paternity/parental leave policies on women’s labour market outcomes, including employment rates, and return to work timing. As predicted by economic theory, duration of paid maternity leave has been found to increase women’s labour force participation following childbirth, of benefit to employers seeking to retain valuable members of staff (Del Boca et al. 2007; Smeaton, 2006; Smeaton and Marsh, 2006; Ruhm 1998).
Labour market participation: summary of research findings
A wide body of international research highlights the significance of paid maternity and parental leave in promoting the active labour market engagement of mothers. If maternity leave is too short, women will break their employment rather than return to work while their children are very young. Having adequate duration of paid leave combined with the possibility of returning to the same employer is a strong incentive to return to work.
Retention
This section reviews the evidence on whether parental leave policies can improve businesses’ ability to retain staff after periods of maternity or paternity leave.
Primary Survey Research
A variety of measures extending maternity and paternity rights and increasing benefits have been introduced in the UK over the past 10 years. The Maternity and Paternity Rights and Women Returners series of surveys has been conducted over this period and provides an indication of the impact of these initiatives on parents’ behaviour, and on business, including the business benefits34.
Smeaton and Marsh (2006) use Maternity and Paternity Rights Survey data to show that the proportion of mothers returning to work within 17 months of the birth of their child remained stable between 2002 and 2005 at 80 per cent. The 2007 survey (La Valle, 2008) suggested a slightly lower 76 per cent return to work rate. By the 2009/10 survey, 77 per cent of women had returned to work within 12-18 months of the birth of their child (Chanfreau et al, 2011).
34 Smeaton and Marsh (2006), La Valle et al (2008), Chanfreau et al (2011).
50

The proportion of mothers returning to the same employer has increased over time, however. In 1988, 75 per cent of mothers returned to the same employer (Calendar et al, 1997: 8). By 2005 (Smeaton and Marsh, 2006), 80 per cent of mothers returned to the same employer, increasing to 86 per cent in the 2007 survey (La Valle, 2008) and 84 per cent in 2009/10 (Chanfreau et al, 2011). These surveys suggest that overall, retention rates of mothers who have taken maternity leave have been rising.
In terms of the specifics, Smeaton and Marsh (2006) report that “Mothers in higher-level jobs providing flexible opportunities, often in unionised workplaces, and treated well by their employers, were the most likely to return to work after maternity leave. Chanfreau et al (2011) observe that overall “…work return rates were influenced by both opportunities and constraints. On the one hand, mothers who worked for employers offering more flexibility to combine work and care and mothers who received maternity pay were more likely to go back to work. On the other, lone parents and mothers with no qualifications might have faced more difficulties in re-entering the labour market after childbearing.”
Several papers suggest a positive impact of maternity pay on retention and returns to the labour market. La Valle (2008) found substantial variations in work return rates following childbirth associated with levels of maternity pay. 41 per cent of mothers who did not receive any maternity pay returned to work in 2006, compared with 62 per cent of mothers who received Maternity Allowance (MA) only, and 81 per cent of those receiving Statutory Maternity Pay (SMP) only. Mothers in receipt of Occupational Maternity Pay (OMP) were the most likely to return to work – 87 per cent of those receiving OMP and SMP returning to work. By the time of the 2009/10 survey (Chanfreau et al, 2011) the figures were as follows: 38% of mothers who did not receive maternity pay returned to work; 59% of those who received MA, 80% of those receiving SMP only, and 90% of those receiving OMP and SMP.
La Valle (2008) also suggest that the likelihood of returning to a pre-birth job was associated with more generous payments. 93 per cent of mothers in receipt of OMP returned to their pre-birth employer compared with 62 per cent of mothers who did not receive any maternity pay. More generous employers, in terms maternity pay, may therefore expect to reap the benefits of higher staff retention following childbearing.
In 1993, the US introduced the Family and Medical Leave Act (FMLA) which mandates employers with 50 or more staff to award 12 weeks of unpaid leave. Although some companies do provide maternity pay, this is voluntary. Analysing the introduction of the 12-week job-protected unpaid leave entitlement in the US, Smith et al (2001) and Hofferth and Curtin (2003) found a positive impact on the likelihood that a woman would return to work, whether leave was paid or unpaid, while for Joesch (1997) the likelihood was enhanced by paid leave. Baum (2003) also explored the impact of the maternity leave legislation introduced in 1993 in the USA. Using the National Longitudinal Survey of Youth Baum found significant increases in the retention of mothers. The probability of mothers returning to their pre-birth job increased from 49 per cent pre-1993 to 65 per cent post-1993.
51

Brandon and Temple (2006) investigated the Australian Workplace Industrial Relations Survey 1991 to assess the effects of on-site child care at the workplace and employer-provided family leave. Neither of the two provisions were found to be significantly associated with reported levels of turnover.
In terms of family support policies, analysis of WERS (1998) by Dex et al (2001) found that none of the leave and support policies included were significantly associated with labour turnover with the exceptions of emergency leave, which was associated with increased labour turnover. Dex offers no explanation for these findings.
Non-econometric studies
This study did not review any primary survey or case study evidence looking at the relationship between family-friendly policies and retention.
Retention: summary of research findings
There is considerable evidence in the UK and the USA highlighting the impact of maternity leave, maternity pay and job protection legislation on labour market participation and job retention among mothers. In the UK, the proportion of mothers returning to the same employer has increased between 1988 and 2010, as maternity provision has expanded. There are obvious benefits to employers in terms of retaining staff.
Onsite childcare does not appear to promote retention, but usage is low, raising the possibility that models are less likely to detect significance compared with studies investigating other family-friendly measures. Notably few studies have been encountered looking at the relationship between workplace nurseries and retention rates though, and this would appear to be a gap in the evidence base.
5.4 Indirect Relationships (mediating role of work-life conflict/enrichment, job satisfaction, engagement and other affective factors)
Figure 5.1: Emergent WLB/Business outcomes conceptual schema – the affective chain
52

In this subsection, the links between WLB policies and affective outcomes35 are set out, followed by a discussion of the links between affective outcomes and the business benefits of interest such as productivity and staff retention. The ‘affective’ section of the conceptual framework set out in Figure 5.1 is reproduced in Figure 5.2 above. By focussing on the intervening, individual levels factors the following discussion serves to clarify some of the mechanisms through which WLB policies might be expected to impact upon bottom-line business outcomes.
Given that the aim of the study as a whole is to quantify business benefits, there is less emphasis in this section on quantifying the size of effects on individual outcomes, such as satisfaction, so much as demonstrating their links in principle.
The following links are examined below in turn:
• The link between availability and take-up of WLB opportunities • The link between WLB policies and conflict or enrichment from work to home • The link between WLB policies or work/family conflict/enrichment and
affective outcomes (satisfaction, commitment or engagement) • The link between affective outcomes and bottom-line business outcomes
(productivity/absenteeism/retention)
The availability → WLB arrangements take-up link
At the outset it is worth noting that policies do not always translate into practice and this has significant methodological implications when designing studies and interpreting findings that are based on ‘availability’ measures. A brief discussion of the potential policy/practice gap is therefore warranted.
35 Affective outcomes involve attitudes, motivation and values with implications for job commitment, engagement and satisfaction.
-
.
WLB policies and initiatives
Take - up Reduced work/family conflict Less pressure More control
Improved job satisfaction engagement commitment or effort
Reduced Absenteeism
Improved retention
Social exchange theory
Enhanced Profits
Higher individual productivity / performance
Service Profit Chain Model improved service quality ? customer satisfaction ? customer loyalty
53

A number of studies have emphasised the extent to which WLB policies alone are inadequate and must be accompanied by a family supportive culture that will enable staff to use working arrangements that are formally available. Baral and Barghava (2010) observe that formal WLB policies are less important than the supportiveness of an employee’s supervisor or the organisational culture in relation to work-life balance. A supportive work-family culture entails feeling supported by an employer and feeling that accessing formal supports such as emergency leave, reduced hours etc. will not lead to adverse career consequences. Baral and Bhargava (2010) highlight the theoretical underpinnings of organisational culture as a potentially powerful determinant of organisational outcomes as derived from ‘organisational support theory’, which argues that unwritten rules and expectations are more powerful in influencing attitudes and behaviours than formal and written rules.
Bond (2004), using linear regression with data from employee surveys carried out in four financial sector companies in Scotland, found that the level of perceived availability of flexible working arrangements did not have an impact on work-life conflict. Organisational culture, on the other hand, was significantly associated with reduced work life conflict. She concludes that without a supportive work-life organisational culture, the provision of arrangements alone will not necessarily improve work-life balance outcomes.
Glass (2004) similarly notes that mothers frequently report that use of WLB policies have entailed adverse career consequences or that supervisors have deterred them from using policies, implying they are not suitable for those who are ‘serious about career advancement’. According to Glass, fears about the implications of using a ‘mommy track’ are borne out by data on wage growth following childbirth. Mothers who availed themselves of WLB arrangements experienced reduced earnings growth over a period of 7 years.
The WLB → work family conflict/enrichment link
Some studies investigate the direct association between WLB policies and affective outcomes while other studies break down the relationship further to understand why flexible or family-friendly policies might improve job satisfaction, commitment or effort for example. Several of these studies investigate the work/family interface and explore the extent to which it is the experience of conflict of time or energy or positive mood spillovers between the two that can trigger a range of affective responses in relation to work.
Baral and Barghava (2010) have highlighted a large and growing body of evidence which demonstrates the factors associated with a positive work-family interface and work-family enrichment, sometimes referred to as positive spillover. Work family enrichment describes the extent to which experiences within family and workplace contexts can affect each other positively or negatively. Baral and Barghava (2010) note that “both work-to-family enrichment and family-to-work enrichment have been found to be positively related to individual’s mental health, family functioning and job outcomes such as job satisfaction and organizational commitment”. WLB policies therefore have a key role to play at the work-family interface.
54

Kelly et al (2011) used before and after data with a comparison group within a large US white-collar workplace to explore the effects of the introduction of flexible working (termed schedule control). The sample was comprised of 608 employees: 302 with flexibility and 306 participants from departments which did not yet have access to the flexible working opportunities. They found a significant reduction in work-family conflict, improvement in work-family fit and time-adequacy among those with access to flexible schedules (after controlling for the employee’s starting point on each of these measures). On average, an increase of one standard deviation in flexibility led to a half a standard deviation decrease in work-family conflict and a half a standard deviation increase in work-schedule fit.
Anderson et al (2002) investigated the impact of formal and informal work–family practices on both work-to-family and family-to-work conflict (WFC, FWC) and a broad set of job-related outcomes. Structural equation modelling using data from the 1997 National Study of the Changing Workforce (NSCW) showed that negative career consequences and lack of managerial support were significantly related to work-to-family conflict. These were significant predictors of conflict even when accounting for the effects of work schedule flexibility. Work-to-family conflict was linked to job dissatisfaction, turnover intentions and stress, while family-to-work conflict was linked to stress and absenteeism.
Employees who use some form of flexible working have also been found to be more committed to their employer, have a lower incidence of leaving intentions and report better psychological health. Current flexible working was found to be negatively associated with work-family conflict suggesting that those using flexible working experience reduced work pressure (Houston and Waumsley, 2003).
Secret and Sprang (2008: 37) used a US survey of 374 individuals to explore some hypotheses about the correlations between the work-family stress of employed parents and the family-friendly work environment. They tested and found results for 3 key hypotheses: employed parents who experienced a more family-friendly supervisory support in their workplace culture were 1.85 times less likely to report financial stress; working parents who have more leave time benefits available to them were less likely to have time-based problems, with a one unit increase in leave time allowance leading to a 30 per cent reduction in time based problems; parents who perceived their supervisors to be family-friendly were 2.7 times less likely to experience role strain.36
Hayman (2010) explored data gathered in New Zealand and found a strong relationship between the use of flexible working schedules and ‘role overload’
36 Role strain was a measure of 6 items on how frequently the respondent experienced particular concerns about fulfilling family and work responsibilities during the working week, including wished for more time to do things with family, rushed home from work to attend to family needs, felt emotionally or physically drained when they got home from work, felt they had more to do at home than they could handle, felt they didn’t have enough time for themselves, felt emotionally or physically drained at work due to family pressures.
55

(too much to do in the time available), job satisfaction (with work, the job and how often they felt like quitting), work interference with personal life, personal life interference with work, and work/personal life enhancement. Flexible working had a negative relationship with role overload, a positive relationship with job satisfaction, and negative relationships with the work-life conflict measures, all of which combined to suggest improvements in employee well-being associated with flexible working arrangements.
Summary
In summary, the time and energy commitments associated with paid working lives can come into conflict with family demands or other non-work interests or responsibilities. These work and non-work spheres can complement each other and lead to a rewarding and fulfilling life. Alternatively, they can be perceived as in conflict, potentially leading to negative mood, behaviour or health outcomes (such as stress, role overload, absenteeism, turnover intentions and reduced job satisfaction as discussed further below).
The research evidence suggests that both flexible working opportunities and informal pro-family workplace cultures (characterised by supportive line managers for example), can mitigate the experience of conflict at the home/work interface, helping to promote an ‘enriched’ life.
Having established that WLB policies can reduce work/family conflict, the next section goes on to explore the extent to which affective outcomes are associated either directly with WLB policies or with work/family conflict arising from tensions between family and work responsibilities.
The WLB or work family conflict/enrichment → affective outcomes (satisfaction, commitment or engagement) link
Baral and Bhargava (2010) examined the role of work-family enrichment (a measure derived from a 9 item scale) in the relationship between WLB policies and job outcomes (job satisfaction, affective commitment and organizational citizenship behaviour). The study was based on data collected from 216 managerial employees in four organisations in India (in manufacturing and information technology sectors). WLB policies explored included flexitime, homeworking, parental leave, direct financial assistance for child care and information services such as finding a childcare centre for a new employee. Analysis suggested that supervisor support (4 items on employee/line manager relationship) and work-family culture (9 items on perceived supportiveness) were positively related to job satisfaction and affective commitment, but no significant association was found between WLB policies (measured as an index reflecting the number of such options perceived as available to employees) and any of the job outcome measures or work-to-family enrichment. They raise the possibility that this finding arises as it is the informal aspects of the work environment such as supervisor and co-worker support which explain a greater share of the variance associated with employee outcomes than do formal benefits and policies (as found by Anderson et al.,2002; Behson, 2005; Thompson and Prottas, 2005). Baral and Bhargava also note that their sample of employees was
56
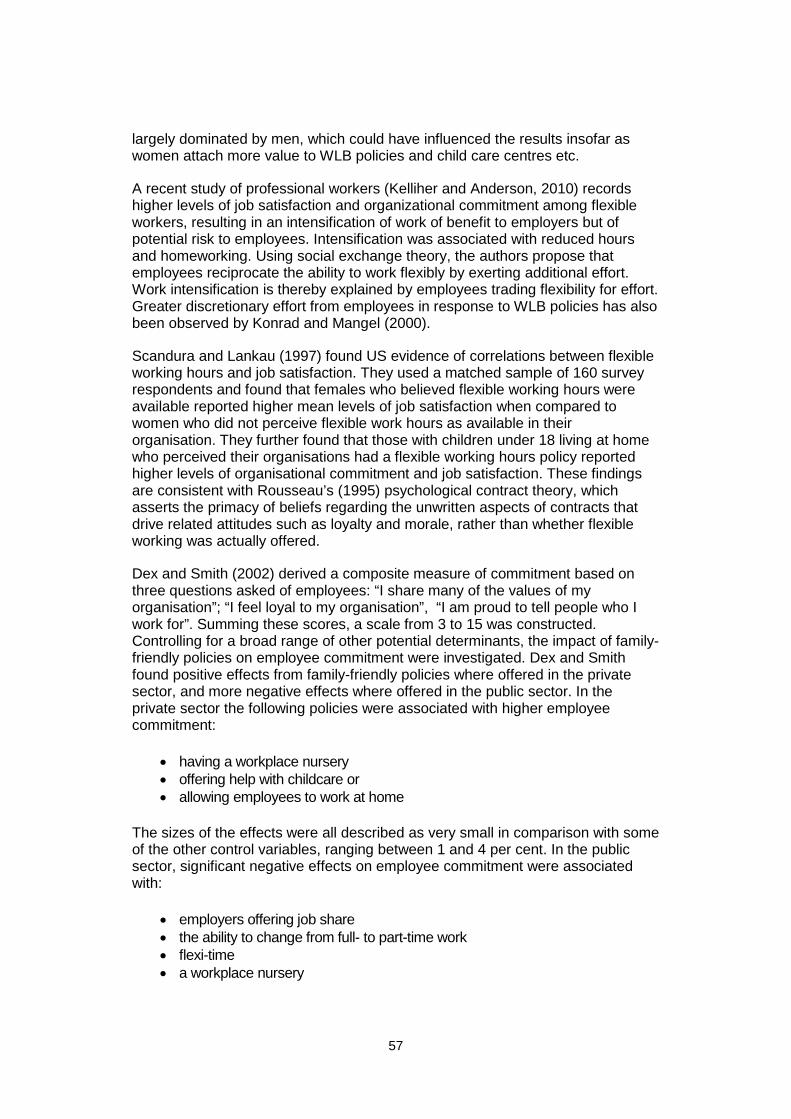
largely dominated by men, which could have influenced the results insofar as women attach more value to WLB policies and child care centres etc.
A recent study of professional workers (Kelliher and Anderson, 2010) records higher levels of job satisfaction and organizational commitment among flexible workers, resulting in an intensification of work of benefit to employers but of potential risk to employees. Intensification was associated with reduced hours and homeworking. Using social exchange theory, the authors propose that employees reciprocate the ability to work flexibly by exerting additional effort. Work intensification is thereby explained by employees trading flexibility for effort. Greater discretionary effort from employees in response to WLB policies has also been observed by Konrad and Mangel (2000).
Scandura and Lankau (1997) found US evidence of correlations between flexible working hours and job satisfaction. They used a matched sample of 160 survey respondents and found that females who believed flexible working hours were available reported higher mean levels of job satisfaction when compared to women who did not perceive flexible work hours as available in their organisation. They further found that those with children under 18 living at home who perceived their organisations had a flexible working hours policy reported higher levels of organisational commitment and job satisfaction. These findings are consistent with Rousseau’s (1995) psychological contract theory, which asserts the primacy of beliefs regarding the unwritten aspects of contracts that drive related attitudes such as loyalty and morale, rather than whether flexible working was actually offered.
Dex and Smith (2002) derived a composite measure of commitment based on three questions asked of employees: “I share many of the values of my organisation”; “I feel loyal to my organisation”, “I am proud to tell people who I work for”. Summing these scores, a scale from 3 to 15 was constructed. Controlling for a broad range of other potential determinants, the impact of family-friendly policies on employee commitment were investigated. Dex and Smith found positive effects from family-friendly policies where offered in the private sector, and more negative effects where offered in the public sector. In the private sector the following policies were associated with higher employee commitment:
• having a workplace nursery • offering help with childcare or • allowing employees to work at home
The sizes of the effects were all described as very small in comparison with some of the other control variables, ranging between 1 and 4 per cent. In the public sector, significant negative effects on employee commitment were associated with:
• employers offering job share • the ability to change from full- to part-time work • flexi-time • a workplace nursery
57

• emergency leave • home work and • a higher number of policies overall.
Dex and Smith were unable to explain the starkly different findings between public and private sector but did acknowledge the possibility that reverse causality could explain the associations, i.e. that organisations with lower employee commitment have introduced family-friendly policies as a solution. Negative impacts in the public sector were also encountered, using WERS, by Guest et al, (2000b). Also noted was the possibility of a policy/practice gap – that despite policy level availability of a range of family-friendly measures, in practice their implementation may be far less widespread, referred to by Dex and Smith as ‘window dressing’ which carries the risk of employee cynicism.
Nelson’s (2004) evaluation of the WLB challenge fund (described above) found that 22 per cent of scheme participants reported an improvement in staff morale and job satisfaction. Kelliher and Anderson (2010), focussing on working from home and reduced hours, found that these forms of flexibility enhanced organisational commitment, job satisfaction and slightly reduced self-reported stress levels. These are clear potential benefits for employers insofar as they feed through to productivity and other harder outcomes.
A review of the literature by Kelly et al (2008) has explored (a) the extent to which work–family initiatives reduce employees’ work–family conflict and (b) the extent to which reduced work–family conflict improve outcomes at the level of the individual and at the organizational level. They observe that while there is a limited amount of research which investigates the relationship between work–family conflict and business outcomes there are numerous studies of the relationship between work–family conflict and both work attitudes/satisfaction and self-reported absenteeism and performance.
Lourel et al (2008) using a dataset of 283 French employees tested a model of the relations between work-to-home and home-to-work interference on perceived stress, and job satisfaction. Structural equation modelling indicated a relationship between negative or positive work-home/home-work interference and job satisfaction, partially mediated through measures of perceived stress.
Eaton (2001) found a positive association between employees feeling able to use available flexible working arrangements37 (measured as an index from 1-7 according to the number of usable flexible working and family leave policies) and organisational commitment.
McNall et al (2010) investigated the relation between the availability of flexitime and compressed working weeks and work-to-family enrichment and the relation between the latter and job satisfaction and turnover intentions. Work to family enrichment was found to mediate the relationship between flexible working
37 Eaton measured and differentiated between formal policies, informal policies and policies which employees felt they were able to use without harming their careers or risking disapproval from their line managers.
58

arrangements and both satisfaction and turnover. Using hierarchical regression techniques flexible working significantly predicted work to family enrichment while work to family (W2F) enrichment was found to be positively related to job satisfaction. Furthermore, W2F enrichment predicts turnover intentions with a negative and significant relationship. In summary, flexible working improves enrichment from work to home which in turn is associated with higher job satisfaction and lower turnover intentions.
Evidence from the third work life balance surveys also supports the connection between WLB opportunities and affective outcomes. With respect to employees, flexible workers were significantly more likely than non-flexible workers to be very satisfied with their current working arrangements (33 per cent compared with 22 per cent respectively) (Hooker et al, 2007). By the fourth work life balance employee survey the gap remained, but was less wide – 40 per cent of full-time flexible workers and 46 per cent of part-time flexible workers were very satisfied compared with 31 per cent of those full-time without flexible working and 37 per cent part-time without flexible working (Tipping et al, 2011).
From the perspective of employers, Hayward et al (2007) report that 58 per cent thought that the provision of work-life balance practices had a positive effect on employee relations and 57 per cent of employers reported positive effects on employee motivation and commitment (Hayward et al, 2007).
Summary
In summary, a wide evidence base points to flexible working, pro-family cultures and work/family enrichment as being associated with a range of positive affective outcomes including: higher levels of job satisfaction, morale and organisational commitment, greater effort and less stress and work strain.
In the next section we set out the final link in the chain, highlighting evidence which demonstrates the relationship between affective outcomes such as job satisfaction and engagement with bottom line business benefits such as productivity, absences or turnover.
59

The affective outcomes or work family conflict/enrichment → business outcomes link
Another strand of literature seeks to demonstrate the link between morale/ satisfaction /engagement and business performance (Sirota, 2005; Maister, 2003; Oakley, 2005; Marketing Innovators, 2005). In these studies employee satisfaction is described as a key antecedent to employee ‘engagement’ which in turn promotes customer loyalty, resulting in greater profitability. In other studies, satisfaction is associated with organisational commitment which enhances productivity through longer employment tenure and a superior body of corporate knowledge or reduces the costs of high employee turnover. Job satisfaction has been shown to be related to turnover intention (Hellman, 1997) while Steel and Ovalle (1984) have demonstrated a strong relationship between turnover intention and turnover behaviour.
Guest et al (2000) explicitly explore a hypothesised model linking HR practices → employee commitment and satisfaction → productivity → sales and financial performance. The initial HR practices are not relevant for our purposes as they preclude WLB policies, but the link between satisfaction/commitment and turnover or performance outcomes is of interest. It should be noted, however, that Guest et al examine WERS (1999) which relies, as discussed above, on manager perceptions of performance. A positive association was found between employee satisfaction/ commitment and comparative productivity. Labour productivity, in turn, was found to be positively associated with comparative financial performance.
Lau (2005) identifies several studies on employee turnover which support a negative relationship between employee satisfaction and turnover, including three meta-analyses (Carsten and Spector, 1987; Hom and Griffeth, 1995; Steel and Ovalle, 1984). Schlesinger and Zornitsky (1991) quantify the turnover rate of dissatisfied employees as three times higher than that of satisfied employees.
Kular et al (2008) review a range of evidence and conclude that a number of benefits such as growth and productivity accrue to businesses when employee satisfaction or engagement is high. A meta-analysis conducted by Harter et al (2002:272) supports this positive association.
Organizational commitment (OC) is also described as a key determinant of performance by Eaton (2001), particularly in workplaces where loyalty and extra effort matter. Higher levels of OC have been found to be more highly correlated than job satisfaction with lower staff turnover and superior performance (Meyer and Allen 1997).
A paper by Atkinson and Hall (2011) explored the influence of flexible working on employee happiness and attitude, based on a case study within an NHS Acute Trust. 43 employee interviews were conducted across a range of directorates within the Trust. Findings indicate that flexible working makes employees “happy” and that there are attitudinal/behavioural links between happiness, discretionary behaviour and a number of performance outcomes (perceived performance and retention). The study investigated flexible working within a context of high
60

performance work systems (HPWS), adopted by the NHS to enhance organizational performance (DoH, 2000). In exploring happiness, the authors aim to contribute to research which delves into the “black box” of HPWS (Purcell et al., 2003) to unpick the mechanisms by which HR practices impact on performance. Discretionary behaviour, beyond basic job requirements, is thought to be at the heart of the black box, and the key to driving higher performance (Appelbaum et al., 2000; Atkinson and Hall, 2011; Purcell et al. 2003). Flexible working was found to promote happiness, give rise to discretionary behaviour and other desirable performance outcomes. The interviewees provided detailed accounts of how and why working flexibly reduced their absences, motivated commitment to the job, i.e. retention, and helped them to work more efficiently.
Job satisfaction has also been found to be significantly associated with rates of absence in Canadian businesses (Dionne and Dostie, 2005). Employees who were satisfied with their jobs were 0.825 (i.e. less) likely to be absent than those dissatisfied with their jobs.
Kelly et al (2008) also present evidence that links job commitment to turnover intentions and work/family conflict to self-reported absenteeism. Kelly et al conclude that work–family conflict is related to job satisfaction, organisational commitment, turnover intentions, tardiness, and absenteeism.
Summary
The final link of the conceptual ‘WLB to business benefits’ chain has presented a body of evidence which demonstrates that affective outcomes at the level of the individual, including job commitment, ‘happiness’, satisfaction, engagement and, in turn, discretionary effort, are all associated with business benefits such as reduced leaving intentions, fewer absences, less tardiness and improvements to performance and productivity. These positive outcomes translate into improved profitability and growth. A key component of this ‘black box’ within which positive attitudes and mood lead to greater efficiency and effort is ‘engagement’. Given the centrality of employee engagement to some schools of thought, this section ends with a discussion of what engagement entails and the business benefits which potentially ensue where it nurtured.
Employee Engagement
Employee Engagement/Commitment is described by Corporate Voices (2011) as closely related to employee satisfaction but more powerful in its effects in terms of generating discretionary effort and concern for quality; “It is what prompts employees to identify with the success of the company, to recommend the company to others as a good place to work and to follow through to make sure problems get identified and solved”. The Corporate Leadership Council (2004) conclude that every 10 per cent improvement in commitment can increase an employee’s level of discretionary effort by 6 percent and performance by two percent; highly committed employees are said to perform at a 20 percent higher level than non committed employees.
Employee engagement is described in a CIPD Factsheet (2007) as a combination of commitment to the organisation and its values plus a willingness
61

to help out colleagues (organisational citizenship). It is said to go beyond job satisfaction, is not simply motivation and cannot be ‘required’ as part of the employment contract. CIPD further suggest that engagement is linked to business performance and that it can be promoted by means of employers delivering on their commitments and generating a positive psychological contract between employer and employee.
Macleod and Clark (2009) provide several case studies highlighting the link between employee engagement, job satisfaction, organisational commitment and performance. For example, Gallup (2006) examined 23,910 business units and found that those with engagement scores in the bottom quartile averaged 31 – 51 per cent more employee turnover, 51 per cent more inventory shrinkage and 62 per cent more accidents. By contrast, those with engagement scores in the top quartile averaged 12 per cent higher customer advocacy, 18 per cent higher productivity and 12 per cent higher profitability.
Gallup submitted evidence to the Macleod review on the basis of a three stage analytical process suggesting that in 2008 the cost of disengagement to the economy was between £59.4 billion and £64.7 billion. Four additional studies provide evidence of the bottom-line benefits associated with high levels of staff engagement: Tower Perrins-ISR (2006) surveyed the financial performance and engagement levels of over 664,000 employees in 50 multi-sectoral companies around the world over 12 months. They found a 52 per cent gap in improvements to operating income. Companies with high levels of employee engagement improved to the tune of 19.2 per cent compared with a 32.7 per cent decline in companies with low levels of employee engagement. Engaged employees in the UK take an average of 2.69 sick days per year compared with 6.19 among the disengaged (Gallup, 2003). Barber et al (1999) calculated, on the basis of a study of 65,000 employees, that increasing staff commitment by one per cent could lead to a nine per cent increase in sales while Tamkin et al, (2008), estimated that a 10 per cent increase in investment in a range of good workplace practices which promote engagement would increase profits by £1,500 per employee per year.
The Corporate Leadership Council reported that organisations with a high proportion of engaged staff grew profits as much as three times faster than their competitors; can reduce staff turnover by 87 per cent and improve performance by 20 per cent.
Based on a survey of employees, Truss et al (2006) found that women and managers are more likely than men and non-managers to be engaged with their work. In addition, employees who are satisfied with their work-life balance and those on flexible contracts are more engaged with their work than those who are dissatisfied or not working flexibly. It found that those on flexible contracts tend to be more emotionally engaged, more satisfied with their work, more likely to speak positively about their organisation and less likely to quit than their non-flexible counterparts.
62

Summary
The evidence on ‘engagement’ indicates that achieving high levels of engagement/commitment among a workforce is likely to generate strong and measurable business benefits and that flexible working or other work life balance policies and practices are likely, as part of a portfolio of good employment practices, to engender committed and engaged employees.
63

6. Work-Life Balance –
Employer Costs The potential benefits of WLB policies to employers are set against a broad range of potential costs associated with implementing and accommodating flexible working or family-friendly leave and support policies. In terms of the overall balance of costs and benefits for employers, the literature remains unclear. Studies variously suggest that: the costs of WLB practices exceed firm level benefits, are performance neutral, or the benefits outweigh costs. It should be noted that the evidence base relating to business benefits far outweighs the volume of material investigating costs. As a consequence, this chapter groups all WLB policies together rather than devoting separate subsections to flexible working and family-friendly policy costs, although these costs are differentiated where the evidence permits.
This chapter starts with a general commentary on the costs associated with WLB policies, initially discussing evidence relating to perceptions of the relative weight of costs and benefits and the extent to which the balance is likely to vary between businesses of different type and size and likely to vary over time (section 6.1). The section then continues with an overview of the types of costs encountered (section 6.2). Sections 6.3 to 6.5 then set out findings from the literature review quantifying the costs relating to:
• Implementation – costs associated with the introduction of new policies • Procedural Administrative – costs associated with handling or processing
requests • Accommodation – costs associated with covering absence or reorganising
work to cover changes in working patterns.
6.1 Weighing costs against benefits Data and studies setting out the actual costs associated with implementing and managing specific WLB policies and practices are not prevalent. Businesses either do not collect information and data in an appropriate form or are unwilling to share what is perceived as business sensitive information. Concerted and repeated efforts by Bevan (2001) and Nelson (2004) to gather data on costs, for example, failed to produce relevant evidence that could be used. Edwards et al (2003) similarly observed that firms find it hard to produce concrete estimates of the costs associated with employment legislation as they tend not to engage in the necessary detailed accounting.
64

General perceptions have been elicited by means of surveys, however, and national level cost-benefit analyses have been conducted for impact assessments.
The 3rd Work-life Balance Employer Survey invited managers to comment on whether the introduction of WLB measures were cost effective (and to reach a judgement on the relative costs and benefits) (Hayward et al, 2007). Businesses surveyed were explicitly asked about the relative costs and benefits associated with new WLB regulations (Employment Act 2002): 28 per cent indicated that the new regulations did increase their costs and 34 per cent felt that the benefits did not outweigh the costs. Around half (55 per cent) felt that the costs and benefits balanced each other out. Just nine percent of businesses suggested that, overall, the benefits outweighed the costs.
On the basis of a state-wide survey of Illinois independent not-for-profit businesses38, combined with personal interviews with top administrators, Hohl (1996) concluded that the cost of implementing and administering most flexible working arrangements were negligible, even among those organisations using three or more arrangement types. Perceptions were that the overall balance was in favour of the benefits which were said to outweigh the costs. Two administrators were quoted by Hohl (1996) as stating their expenses had reduced because staff turnover declined, with one HR manager proclaiming, "I think we actually saved money because we have staff that are happy. They work harder and are not as sick as much, we aren't losing them or having to retrain. You can lose the most money in turnovers." Five of the thirty companies investigated in greater depth incurred additional costs, primarily associated with payroll methods and telecommuting options (due to hardware, software, and interface hook-up), but even in these cases administrators felt the benefits outweighed their costs.
As noted by Evans (2001), calculating the overall balance between benefits and costs is complex, and will depend upon the characteristics of the business and the job. Large firms are often able to re-organise work more easily than small ones and relative costs and benefits are likely to vary with the economic cycle. For example, during recessionary conditions, the costs of day care centres may be viewed as prohibitively expensive. Costs will also differ in different contexts in terms of: (a) workforce composition (the percentage of women for example); (b) business strategy (for example, low vs high value-added approach); (c) size (due to administrative and HR systems, the presence or otherwise of slack in workforce capacity and economies of scale which advantage larger enterprises). Gray (2002) also observes that calculating relative costs and benefits are further complicated by the fact that costs are policy specific. For example, employing part-time workers or job-sharers may enable a firm to draw on a wide range of talent at a much lower cost than employing the equivalent number of full-time workers. By contrast, providing a workplace nursery or financial help with childcare is likely to carry significant costs for smaller firms in particular.
38 A randomly selected initial sample of 245 organisations with 20 or more staff yielded 156 responses (64 per cent response rate)
65

6.2 Types of cost The range of potential costs facing businesses are broad, diverse, differ according to the characteristics of businesses and the specific measures under consideration. Costs may vary with the vicissitudes of the business cycle and are unlikely to be uniform across all business sectors and sizes. For some, the introduction of WLB practices may be profitable while for others, with a different employee base, or business strategy it may not (Konrad and Mangel, 2000; Gray and Tudball, 2003). Costs can be both short term and long term and different types of cost may escalate or diminish over time.
Costs to employers can be broken down into implementation, procedural and accommodation costs. Unanticipated costs may also emerge. A costs framework is set out in Figure 6.1 which lists, in blue, the various types of cost potentially associated with WLB practices, while the green boxes provide examples. Potential costs include:
• One-off implementation costs which include resources devoted to familiarisation with new regulations and to updating payroll systems or bureaucratic materials such as staff handbooks to reflect regime and entitlement change.
• Procedural administrative costs include: informing staff about the existence of rights and benefits; advising staff on how to claim them; making decisions about who is eligible for benefits; dealing with requests and appeals.
• Accommodation costs may be associated with: o more complex roster scheduling; employing more staff or
temporary replacement staff for those on maternity/paternity/parental leave or career breaks/sabbaticals.
o direct costs, such as parental leave payments, nursery provision or subsidies, equipment for telecommuters or to facilitate work at home.
o cost of employing more staff if part-time and job-share opportunities are provided.
o costs of extra work-space can be caused by an increase in the total number of people working in an enterprise; eg. a larger number of part-time staff, space for breast-feeding facilities or a day-care centre (Evans, 2001).
o retraining or refresher courses for staff members upon re-entry into the workforce.
• Unanticipated costs which may include: o in terms of diverting time and resources toward bureaucracy and
regulations and away from other business objectives such as innovation, training or growth.
o potential cost of lost productivity if skilled staff are absent or reduce their hours.
o homeworking may lead to unexpected costs if employees are not involved in social interaction, or feel isolated, morale and productivity may be adversely effected (Gray, 2002; Baruch, 2000; Felstead et al, 2002).
66

Figure 6.1: Differentiating cost types
Barriers to implementation
Further evidence relating to potential costs is derived from studies which ask employers what they perceive as the main barriers to implementing flexible working arrangements or the key difficulties they encounter when honouring leave entitlements. Dex and Schiebl (2002), for example, conducted case studies of flexible working in ten small- and medium-sized businesses. When interviewed, employers voiced a number of concerns relating to flexible working arrangements. The main fears were classified into four groups:
• additional work and red-tape from changes in the law; • loss of clients if employees were on extended leave or not at their desks
during sufficiently long, reliable and regular hours; • employee productivity or service continuity falling if hours were reduced or if
staff worked from home; • management finding it difficult to manage or administer the flexibility.
Based on a manufacturing organisation membership survey39 conducted in 2011, EEF (2011) indicate the proportion of employers citing the following factors as placing a limit on their ability to offer various forms of flexible working:
• Set up of production 60 per cent • Inability to cover for employees (often specialist roles) 45 per cent • Can only agree to a certain number of requests 36 per cent
39 Sample size not reported
.
Implementation Costs
Procedural Costs
AccommodationCosts
UnanticipatedCosts
Cash costs:
(eg. subsidies)
Staff costs:
(eg. employ more staff to cover:
leave, reduced hours or extra bureaucracy)
Displacement costs:
(eg. time or money spent on WLB issues diverted away from
innovation, training or growth)
Other costs:
(eg. associated with negative impacts on
commitment, satisfaction or effort if WLB
policies perceived as unfair)
67

• Cost of implementation 20 per cent • Management resistance 18 per cent
Other concerns which have been raised (DWP, 2009) are the implications of some types of flexible working on the business, such as the impact of home working on security and client/corporate confidentiality. There may also be issues of data protection, data management and data access around the use of remote IT systems.
One study from the Netherlands explored the significance of employers’ opinions of the importance of financial factors in decision-making on family-friendly provision (Remery et al, 2003)40. Under consideration were the importance of facility costs, possible government subsidies/payments, degree of expected use and keeping in step with other organisations i.e. benchmarking. The study found that employers who gave a higher ranking to the role of these financial factors in decisions about family-friendly facilities, had a lower incidence of provision of family-friendly policies. 54 per cent of firms in Remery et al’s study agreed that administrative burden was a cost of flexible working arrangements, 51 per cent cited operational problems, 43 per cent were concerned with ‘time consumption’, 41 per cent with management problems, 42 per cent with employee abuse, 31 per cent with costs and 12 per cent with health and safety compromises.
Other studies have explored the specific problems associated with part-time work, replacing staff on leave and flexi-time. These are discussed in turn below.
Part-time work problems
The management costs and challenges associated with some flexible working arrangements have been explored in detail by Edwards and Robinson (2004) who conducted a case study of part-time nurses in an NHS setting. Line mangers responsible for implementing the flexible working policies reported a significant number of problems. Managers objected that part-timers were engaged in jobs normally worked on a full-time basis and that these jobs were neither designed for, nor suited to, part-time hours:
Line managers find it difficult to fit them into systems designed for 24-hour full-time working. Further, part-time nurses work fewer additional hours for their employing trust than full-timers, reducing managers’ ability to deal with staff shortages through their preferred strategy of using staff on overtime. Maintaining competence in higher-skill jobs requires substantial, continuous training for part-timers, however few hours they work. Managerial and administrative overheads are also increased. All these factors generate additional labour costs and detract
40 Based on a survey of 871 organisations in profit and non-profit sectors. The initial sample was 3,100 companies with more than nine employees sampled through a trade register of the Chamber of Commerce. The total response rate was almost 28 per cent, “comparable to the response rate generally found in corporate surveys. Comparing the sample with national data shows no significant differences with respect to distribution of sub-sector and size” (Remery et al, 2003: 5)
68

from the advantages of enhanced retention and recruitment” (Edwards and Robinson, 2004: 179).
Dick also raises concerns that part-time working does not always deliver potential benefits and that, instead, it actually confers considerable costs to both individuals and organisations. Dick conducted research in three metropolitan UK police forces and found significant shortfalls in the reconciliation of the needs of part-time employees and those of employers. Interviews and focus groups were conducted with part-time police officers, their managers and colleagues. A number of difficulties and challenges emerged, in particular, perceptions of inequity were evident from the workgroups in which the part-timers were located. Dick noted that workgroups also experienced an increase in their workloads due to the time lost by the presence of a reduced-hours worker. This led to difficulties in achieving their team targets and quality of service delivery41. On the positive side, however, the data gathered by Dick suggested longer term benefits including: retaining staff that would otherwise have left and the facilitation of recruitment due to an improved organisational image.
Replacement of staff on leave problems
In terms of leave, one key problem to emerge from the 3rd Work-life Balance Employer Survey is the challenge posed by having to keep jobs open while staff are away on maternity leave, reported by 20 per cent of businesses (Hayward et al, 2007). Small private sector workplaces with between five and 24 employees were particularly likely to experience problems keeping jobs open.
A major constraint on flexibility for SMEs with highly skilled employees (architects, scientists), encountered by Dex and Schiebl (2002) was the low substitutability between employees. Case study managers observed that they would not be able to temporarily recruit a skilled architect or scientist who could provide cover for three-month periods if one of the workforce went on parental or maternity leave. The extent to which the cost and disruption of dealing with employees being absent from the workplace is exacerbated if they have specialist skills was similarly observed in reports by the DTI (2000) and Forth et al. (1997). Where employees perform similar jobs they can more readily be substituted with one another.
A study of 19 small employers (with workforces between 5 and 50) across England by Cragg Ross Dawson (2004) encountered a unanimous view that maternity was a major problem for small employers and that maternity legislation was so ‘biased’ in favour of employees that it had become increasingly burdensome. Some employers interviewed even acknowledged that they were discouraged from employing women of childbearing age. The key challenge identified was managing maternity leave of up to one year, uncertain of whether and when the staff member will return. The key costs borne were the time and
41 Tipping et al (2011: 23) found that around one third of employees in the 4th work life balance survey felt that people who work flexible create more work for others. Over half, however, suggest that colleagues working flexibly cause no problems.
69

cost associated with finding and training replacements or the costs and challenges of managing without a replacement. Some employers also raised problems associated with absenteeism on returning from maternity leave and negotiating flexible hours.
Potential difficulties can be offset with adequate notice of leave start dates, duration and return - with adequate notification, employers can plan for absences, arrange coverage and replacements (BERR 2008). Eurofound (2007) found that only 11 per cent of businesses in a 21 country survey, encountered difficulties from workers taking parental leave.
Flexitime problems
Smeaton and Young (2007) conducted a survey of employers in 200642 and found that over one-third of employers (39 per cent) did not offer flexitime to any of their employees. Employers with no flexitime provision were asked specifically why they did not provide such opportunities given their popularity among staff as a means of achieving some flexibility without forfeiting earnings. Six key reasons can be identified; these are listed in Table 6.1.
Table 6.1: Reasons given by employers for not allowing flexitime
Per cent:
Need staff on site at known hours 42
Incompatible with business operations 25
Incompatible with shift system 25
Incompatible with customer needs 9
Business too small to accommodate 8
Incompatible with team working 6
Base: All businesses which do not provide flexitime. 311
Notes: Reason categories are included in the table if mentioned by at least 20 employers.
Source: Smeaton and Young, 2007.
Nearly half the employers (42 per cent) suggested that they needed to rely on their staff to be at work at specific times. Frontline customer service industries were particularly likely to impose tight time restrictions on workplace arrival and departure. Employers who were particularly likely to require a rigid hours system were located in retail, wholesale and hospitality, in transport, storage and communication and in education, health and other public services. Small establishments were also more likely than large to cite the need for staff on site at known times as a reason for avoiding flexitime – 43 per cent of workplaces employing 5-49 staff, compared with 24 per cent of workplaces employing over 200 staff.
42 900 HR directors throughout England were interviewed by telephone.
70

A further two reasons cited widely were that flexitime hours would be incompatible with business operations (25 per cent of employers) or would compromise a shift system in place (25 per cent of employers). Employers in the manufacturing and construction sector were most likely to suggest that business operation requirements prevented the use of flexitime systems (40 per cent). Employers open 24 hours a day were most likely to state that shift systems precluded the use of flexitime schemes (52 per cent).
Less commonly, customer needs were said to prevent a workable flexitime system, mentioned by 9 per cent of employers. Small workplaces with too few staff to cover opening hours or machine running times for example also represented an obstacle to flexitime – eight per cent of surveyed employers stated that their workplace was too small to accommodate this degree of flexibility. Team working is often advocated as a means of introducing flexibility – specifically functional flexibility whereby employees become skilled and experienced performing a wider range of tasks and roles. However, in this study six per cent of employers cite team working as an obstacle to flexibility of hours. In these cases, it is possible that to work effectively, the team must all work exactly the same hours, starting and ending in unison, e.g. in a team-based production line process.
Dex and Schiebl (2002) also reported that scientific and engineering companies examined for their study found that there were limits imposed on flexibility by job structure, technology and work pressures.
Summary
Survey evidence which elicits managers’ perceptions of the balance between the costs and benefits of WLB policies finds little support for the view that benefits outstrip costs. Findings from a nationally representative sample of businesses in the UK suggest instead that, on the whole, costs and benefits are evenly balanced with around one third suggesting that costs outweigh benefits. An American study of the voluntary sector indicates that benefits outstrip costs. A few impact assessments which have addressed WLB regulatory change conclude that the estimated benefits exceed the estimated costs. The evidence is therefore fairly mixed and far from plentiful, pointing to a need for further research to better understand the costs associated with WLB and how these are balanced against the potential benefits.
Commentaries on the cost benefit issue highlight the difficulties of generalising findings, emphasising that the relative costs and benefits to businesses associated with introducing WLB initiatives will be context specific, depending on the demographic make-up of the workforce and the size and industry of the business. Economic cycles are also likely to affect the relative costs and benefits of particular measures.
Calculations are further complicated by the need to take account of a number of cost types, including one off implementation costs, ongoing administrative costs and the costs of accommodating various measures.
71

Survey and case study evidence has highlighted a number of specific challenges associated with WLB policies, in particular; part time hours in the nursing and police sectors due to the culture of their working practices; the difficulty of finding suitable cover while staff are on maternity or parental leave, most notably where highly specialised skills are involved and, finally, the perceived incompatibility of flexi-time with operational requirements in many business contexts. Evidence also suggests that small businesses experience a variety of WLB policies as more burdensome than large.
Data and studies setting out the actual costs associated with implementing and managing specific WLB policies and practices are not prevalent.
In the following sections we present the few findings which do attempt to quantify the costs but it is clear that further research is needed to develop and expand this evidence base. The discussion focuses, in turn, on implementation costs, procedural/administration costs and accommodation costs. Other types of indirect cost, such as staff morale, finding skilled replacement staff, potential loss of productivity etc are not explored further below as no evidence quantifying these costs have been encountered.
6.3 Implementation costs There are several components to implementation costs associated with the introduction of new policies and practices. These include management or human resource department time involved with familiarisation, setting up new systems, updating contracts or staff handbooks and communicating changes to employees. The findings are divided below according to methodological approach.
Survey findings
Research from the British Chambers of Commerce (BCC, 2007), based on an online survey of 408 businesses, found that very few employers perceived flexible working arrangements to be associated with problematic costs of implementation. Just ten per cent of employers indicated that flexible working arrangements were associated with ‘substantial’ or ‘moderate’ implementation costs, the remaining 90 per cent suggested minimal or zero costs were incurred.
Following the implementation of the 2003 Right to Request flexible working legislation, CIPD (2003) conducted a survey43 to ascertain emergent issues. A large majority of employers reported that they generally have little difficulty with the new right – 76 per cent claimed that the impact of the legislation on their organisation has been negligible and 90 per cent report no significant problems complying with the new requirements. Furthermore, 72 per cent of employers reported that they were prepared to accept requests from all staff. The most common reasons for turning down statutory flexible working requests were
43 A total of 4,914 survey questionnaires were sent out to a representative cross-section of organisations of all sizes and all industry sectors across the public, private and voluntary sectors. 510 organisations responded, representing a response rate of ten per cent. Follow-up calls were made to a small sample of respondents for detailed feedback.
72

reported as: an inability to reorganise work among existing staff and the detrimental effect on the ability to meet customer demand. Cost was rarely the reason given for the refusal of a statutory request.
Administrative burdens measurement exercises
The British Chambers of Commerce (BCC, 2010) 2010 Burdens Barometer indicated that the cumulative cost to business of new regulation since 1998 has risen to £88.3 billion44. This figure covers all new regulation, not just that relating to work life balance policies. In terms of flexible working applications, however, the cost trends declined between 2005 and 2008 (ORC International, 2008).
The BCC Burdens barometer (BCC, 2010) attempts to quantify the costs to business of specific legislation. Costs are aggregated across all businesses. The figures presented in Table 6.2 below refer to one-off implementation costs associated with each of the listed changes to or introduction of regulations related to flexible working and maternity and paternity pay and leave legislation.
The 2002 Flexible Working regulations have been estimated to have cost £34million across the business population while the 2002 Employment Act costs £115 million and the 2005 Work and Families Act cost £21 million.
Implementation costs to businesses associated with the 2001 maternity and parental leave regulations are estimated to have reached £5 million; the 2002 Employment Act estimated at £115 million, and the Work and Families (increase of maximum amount) order 2009 estimated at 2 million.
Table 6.2: One-off costs to UK businesses associated with regulatory introduction or amendment
Regulatory Change Cost: £ millions
Flexible Working (procedural requirements) regulations 2002 34
Employment Act 2002 115
Maternity and parental leave (amendment) regulations 2001 5
Work and Families Act: choice and flexibility 2005 21
Work and Families (increase of max amount) order 2009 2
Source: BCC, 2010
44 This includes all new regulations, not just WLB policies.
73

Impact assessments
Over the last decade there have been a number of changes to the WLB policies. For each of these changes, impact assessments have produced to assess the potential costs and benefits of the proposed changes. The most recent include:
• Extension of the right to request flexible working to all employees
• Introduction of Additional Paternity Leave
• Introduction of Flexible Parental Leave.
Extension of the right to request flexible working
The impact assessment for the extension of the right to request flexible working (BIS, 2011c) assumed limited one-off implementation costs for business since most firms are already familiar with how to process a request for flexible working. It was also argued that the cost of communicating the change in eligibility to employees would be very little as it was assumed that firms already had a method of communication in place that would only need updating. Allowances were made for the small number of firms which did not have experience of flexible working. The cost was primarily in management time and totalled £17.1m.
Additional Paternity Leave
The impact of the Additional Paternity Leave and Pay regulations45 on businesses has been estimated at between £2.34 million and £15.8 million (BIS, 2010b). This includes costs to employers of staff time spent on setting up administration systems of APL&P at £1.7 to £5 million. The one-off implementation costs per organisation are not presented although per request administration costs are provided, these are discussed in the next section.
Flexible Parental Leave.
The one-off costs of administration of Shared Parental Leave also included changes to payroll and HR systems (BIS, 2011d). For the larger firms it was assumed the necessary adjustments would involve half a day of an HR manager’s time and one day of a wages clerk’s time. As the estimate of the numbers of men who take up their entitlement was low (in terms of the proportion of the male working population) it was assumed that many small employers will not adjust their systems immediately once the legislation is passed. Rather, they would amend their HR practices gradually as cases appear, on a ‘needs basis’ . In total the one-off costs for employers of Shared Parental leave were estimated as being between £3 million and £14 million.
45 These regulations entitle fathers to additional paternity leave of six months and additional statutory paternity pay once a mother returns to work, implemented in 2011
74

Summary
As is the case with much of the costs evidence base, the range and depth of data available is fairly limited, but in terms of implementation costs, the majority of evidence relates to flexible working. There is a need for more evidence relating to the implementation costs of a wide variety of family-friendly policies.
Employer survey evidence indicates that the majority of businesses believe implementing flexible working arrangements is unproblematic and incurs very few costs. Implementation costs are therefore, generally, not seen as a barrier to flexibility.
A number of administrative burdens measurement exercises and regulatory impact assessments have estimated the national level costs associated with introducing new WLB regulations, both flexible working and family-friendly, but these figures are not readily translated into individual business level costs.
6.4 Procedural / administrative costs Procedural costs associated with processing requests for leave entitlements or flexible working arrangements are largely bureaucratic. Requests from employees to either take time off or change their working arrangements will need to be read and considered. Under the current legislation on the right to request flexible working, for example, a written request from the employee must be submitted, meetings may be organised and decisions prepared. Time taken will vary depending upon the nature of the request, the way the request is then handled and whether there are any complications. Working schedules and the operation of teams may need to be assessed and re-arranged.
Flexible working and family-friendly administrative costs are looked at together in this section, reflecting the approach taken in the sources of data used. In some instances the flexible working and family-friendly components of costs cannot be disentangled, notably where evidence is presented on the costs of particular regulations, such as the Employment Act 2002, which include provisions for both elements of WLB. Elsewhere the costs are differentiated. Sources of evidence for this section are primarily impact assessments conducted by BIS and administrative burdens measurement exercises conducted by the DTI, BERR and the BCC.
The section commences with a detailed breakdown of the administrative process associated with one regulation – the right to request flexible working, as an exemplar of how the measurement of costs are broken down. The following description of the process involved clarifies the various elements that contribute to an overall estimate of the administrative costs to business in terms of time to meet staff, consider requests, respond in writing to initial applications and possibly also deal with appeals. The various stages include46:
46 http://www.flexibility.co.uk/flexwork/general/aprilchanges.htm
75

• Each employee (possibly during working hours) must make an application to work flexibly, stipulating their ‘case’ , specifying the type of flexible work they desire and how it would not have an adverse impact on the business of the employer.
• Within 28 days, the employer must arrange a meeting with the applicant to consider the application. The employee may be accompanied by a colleague form the workplace (perhaps with some loss of productivity)
• Within 14 days, the employer must make a decision about whether to grant the application to work flexibly.
• If the application is granted, arrangements must be put it into practice. If not, an appeal process may be pursued. The refusal must be based on valid business grounds, must be phrased in plain English and includes relevant and accurate facts.
• If the employee is dissatisfied with the employer's decision, he/she may appeal. Initially this is an internal affair. The appeal should be in writing, setting out the reasons why the applicant thinks the decision is wrong.
• Within another 14 days the employer must arrange an appeal meeting. The employee may be accompanied by a colleague form the workplace.
• A decision must be made within 14 days.
• In the event of a refusal, if the employee does not accept the decision, he/she may appeal through: an employer's own grievance procedure, Acas or an Employment Tribunal.
The following sections go on to look at the various studies which have attempted to assess the WLB policy implementation costs whether it be through surveys, burdens measurement exercises or through impact assessments.
Survey evidence
Research from the British Chambers of Commerce (BCC, 2007), based on an online survey of 408 businesses, found that very few employers (10 per cent) perceived flexible working arrangements to be associated with substantial or moderate implementation costs. Nevertheless, one fifth (21 per cent) of employers did indicate that flexibility was associated with an administrative burden. This burden was not, however, quantified in terms of HR staff days or other resources. Instead it was presented as a barrier to implementing flexible working arrangements
Administrative burdens measurement exercises
An administrative burdens measurement exercise (ABME) was conducted by the DTI (2006) following recommendations from the Better Regulation Task Force’s report, ‘Regulation: Less is More’ as part of the Chancellor of the Exchequer’s
76

Better Regulation Action Plan (BRAP). The aim of the ABME was to estimate the administrative costs incurred by the private sector (including all businesses, charities and voluntary organisations) as a result of all regulations imposed by central government. The calculated costs are presented in Table 6.4 which shows total administrative costs for 2005 (a snapshot of May 2005) and indicates, for each regulation, the scale of associated analysis and paperwork in terms of the number of information obligations (IO) and/or data requirements (DR). The estimates of administrative costs were described as ‘indicative and are not statistically representative’ as the Standard Cost Model (SCM) used adopted a ‘pragmatic approach’ to estimation of the administrative costs on business arising from regulation.
Table 6.4: 2005 Recurrent costs to UK businesses associated with regulatory introduction or amendment
Total admin costs £ million
Number of IO/DRs
Flexible Working (Procedural Requirements) Regulations 2002
188.5 5
Employment Act 2002
39.6 12
Statutory Paternity Pay and Statutory Adoption Pay (Administration) Regulations 2002
13.7 10
Maternity and parental leave etc regulations 1999
7.7 4
Part time workers (prevention of less favourable treatment) regulations 2000
0.1 1
Paternity and adoption leave regulations 2002
0 2
Source: Extracts from DTI 2006, Table 16
Note: the SCM relies on deriving estimates of the standard cost of meeting each of the IO/DRs within a regulation for a ‘normally efficient business’. It relies on the input of a limited number of experts and/or businesses. It does not therefore produce a statistically representative measurement of costs. The SCM provides an estimate of administrative costs of which administrative burdens are a part. The costs of some activities that business would carry out regardless of regulatory requirements (business as usual costs) may be included.
BERR (2008) conducted an assessment of the costs associated with employment law obligations which had been identified as imposing the greatest administrative burdens on businesses, including – “providing employees with a written statement of their employment particulars; rules on working time; dealing with flexible working requests; administering the National Minimum Wage; aspects of parental leave and pay; and calculating redundancy payments” (BERR, 2008: 2). Table 6.5 below, based on data presented in the BERR report,
77

focuses on requests to work flexibly and the postponement of parental leave. The Unit Costs shown are the per administrative event costs and include time for familiarisation, gathering information about the application and meetings to discuss application.
The estimated cost of responding to flexible working requests in 2008 was £88 per request. Appeals are not very frequent but are more expensive to deal with, estimated at £330 per appeal in 2008. Withdrawing a request to work flexibly was estimated at £72 per incident. In terms of the three parental leave and pay related administrative tasks, postponing parental leave was estimated, in 2008, at £120, declining a request for statutory paternity/ adoption pay at £35 and informing temporary staff covering for maternity or paternity leave that their employment will end, at £25.
One key source of costs to employers identified in the study was the use of external agencies for information, advice and guidance on employment law. Their use was regarded as an important ‘safety net’ to ensure full compliance in the face of uncertainty and, for small businesses, imperative in the face of considerable time restraints preventing achievement of expertise in the law. Eighty nine per cent of respondents made use of external sources of expertise. The report notes, however, that many businesses dealt with flexible working applications on their own. When external assistance was sought for any of the regulations covered, the most common sources of information were solicitors (37 per cent), followed by accountants (20 per cent), employment consultants (19 per cent), Acas (17 per cent) and trade associations (15 per cent).
A downward shift in the administrative burden over time, between 2005 and 2008, is evident for each of the administrative activities, reflecting, in part reductions in the initial familiarisation time. Reductions were also associated, in some instances, with a decline in the use of supportive external services.
The incidence of some of the employment law related tasks was very low. While 43 per cent of employers responded to a request for flexible work, just 3 per cent, or fewer, employers had undertaken any of the other tasks listed in Table 6.5.
Table 6.5: Unit costs to UK businesses associated with administering some aspects of employment law
Unit costs £ pounds
Information Obligation 2005 2008
Responded to a request for flexible work 748 88
Had an employee appeal a refusal for flexible working (where refusal upheld)
948 330
Withdrawn an employee’s application for 128 72
78

Unit costs £ pounds
Information Obligation 2005 2008
flexible work due to poor behaviour
Postponed a period of parental leave 400 120
Declined a request for statutory paternity/ adoption pay
767 35
Informed temporary staff - employed for short-term cover on maternity grounds – when their employment would end
2,116 25
Source: BERR (2008), Tables 4.2.3 and 4.2.7
The BERR (2008) report also estimated the time taken for dealing with regulatory burdens. For dealing with an initial request to work flexibly was estimated to take on average, 68 minutes. This time period included familiarisation with the application and regulation; gathering information about the application and its feasibility; meeting to discuss the application; preparation of the final agreement/refusal and, finally, reporting the outcome. The average time taken to uphold a refusal, where an employee had appealed, was estimated to be longer at 334 minutes (taken up by familiarisation and meetings). The average time taken to withdraw an application for flexible working was estimated to be 195 minutes (taken up by familiarisation, meetings and reporting).
The time it took staff to deal with the parental leave and pay issues were reported as: 105 minutes to postpone paternity leave and 57 minutes to decline a request for paternity/adoption pay. Time taken to inform temporary staff that their employment would end was not reported.
The BCC Burdens barometer (BCC 2010) quantifies the recurring costs to business of specific legislation. Costs are aggregated across all businesses and presented as both annual costs and as cumulative figures, adding costs each year between the year the regulation was introduced up to July 2010. The figures presented in Table 6.6 below refer to these recurring and cumulative administrative or accommodation costs. The highest costs are associated with the 2002 Flexible Working regulations with recurring costs of £290 million and the 2001 Employment Act with recurring costs of £219 million. Lower recurring costs are associated with the Work and Families (increase of max amount) order 2009 - £94 million and the 2005 Work and Families Act - £53 million. The lowest recurring costs, at £5million are associated with the Maternity and parental leave (amendment) regulations 2001.
79

Table 6.6: Recurrent costs to UK businesses associated with regulatory introduction or amendment
Regulatory Change Recurring annual costs £ millions
Total cost up to July 2010 £ millions
Maternity and parental leave (amendment) regulations 2001
5 105
Employment Act 2002 219 1740
Flexible Working (procedural requirements) regulations 2002
290 2176
Work and Families Act: choice and flexibility 2005 53 193
Work and Families (increase of max amount) order 2009
94 73
Source: BCC (2010)
Impact assessments
Evidence from the most recent impact assessments is discussed, relating to the extension of the right to request flexible working to all employees, Additional Paternity Leave and Pay, and Shared Parental Leave.
Right to request flexible working
An impact assessment covering the extension of the right to request flexible working to all employees was reported in BIS (2011c). Additional procedural costs were estimated at £29.9 million (2010 prices) and the cost of adjustments to working patterns at £23.5 million. The total average annual cost to businesses was calculated at £54 million. These costs are outweighed by the estimated benefits to businesses at a value of an average annual £82.1 million (attributable to higher productivity, lower turnover, reduced absenteeism and savings from the new code of practice).
BIS (2011c) suggest that a formal request for flexible working will take 2 hours of employee time and 3 hours of management time. If the process is informal these times will be reduced, respectively, to 30 minutes and one and a half hours. It is assumed that with the proposed removal of the prescribed procedure, 90 per cent of requests will be informal and hence that each request will cost an average of approximately £55. The average cost of an appeal is estimated to be £123.
Additional Paternity Leave
80

The impact of Additional Paternity Leave and Pay on businesses have been estimated at between £2 million and £15 million (BIS, 2010b). This includes costs to employers of staff time spent on administration of APL&P at £0.14-£0.5 million. These figures are based on the assumption that four to eight per cent of eligible fathers will take up the benefit. In calculating administrative compliance costs, the impact assessment included changes to the P11, P14 and P35, recovery of Additional Statutory Paternity Pay (ASPP), advance funding of ASPP, P30BC and P32 form completion, employee application for ASPP, completion of the ASPP2 record sheet and changes to compliance and audit checks. The annual costs per organisation associated with these activities (excluding one-off costs) have been estimated for businesses of different size as follows:
Micro: £1.71 Small: £10.60 Medium: £55.69 Large: £1,052.41
Flexible Parental Leave
Recurring costs for Flexible Parental Leave were assumed to be the cost of administering fathers’ take-up of the new leave and pay. For larger employers it was assumed that handling each case involves an hour of a personnel manager’s time and two hours of a wages clerk’s time. In small firms it was assumed that this takes half a day of a manager’s time. The recurring costs for employers of administering requests for SPL was been estimated at between £1 million and £5 million (not including costs of absence) (BIS, 2011d).
Summary
In terms of administrative costs, most of the evidence available is from administrative burdens measurement exercises and impact assessments. As with the implementation costs, data is generally presented at an aggregate, national level but some unit cost and costs per organisation and per request are presented. Data relating to both flexible working and family-friendly regulations is available. Use of appeals by employees can push up costs but their incidence is uncommon.
Unit costs associated with requests for flexibility (estimated at £88 by Berr (2008) and £62 by BIS (2010a)47 do not appear to be high but whether the cost of requests or appeals are perceived as high or low will depend on the number of requests received, how tight profit margins are within a specific business context and whether the costs are perceived as lower than actual or potential benefits.
Survey evidence suggests that the majority of employers do not experience the administration of flexible working as a ‘burden’ although one fifth did. This
47 These estimates are not directly comparable as they are based on disparate methods of calculation - and may therefore be perceived as surprisingly close.
81

‘burden’ was not, however, quantified. No similar survey evidence exists in terms of the administration of various family-friendly policies, suggesting the need for further research.
6.5 Costs of accommodating requests The main cost employers face in accommodating requests to take maternity, paternity or parental leave is that of replacement staff salaries on a temporary basis, recruitment of additional staff to offset reductions in hours worked or lost productivity during an absence which is not covered. Flexible working requests may incur costs associated with re-organising work schedules, provision of equipment or adjustments to IT systems (e.g. to permit flexible rostering or home working). Evidence quantifying the various potential costs associated with accommodating the WLB policies of interest is scarce and remains a gap in the costs evidence base. Presented below are limited findings relating to the costs of; absence management, childcare allowance costs (based on case study evidence), additional paternity leave, the Employment Act (2002) and the cost of accommodating requests to work flexibly (based on impact assessment evidence).
Case studies
One study which explored the costs of managing absence (Bevan, 2003) noted that generally, unplanned absences caused more problems than planned absences. Case studies were conducted with nine private sector organisations in 2001. Among these, managing absence was not a major issue of concern. In response to planned absences employers tended to respond in the following manner with different cost implications:
• Reallocation of work within a team or department; • Moving someone else within the company, perhaps as a development
opportunity on a temporary basis; • Employing a temporary worker; • Employing a replacement on a fixed-term contract.
Employers found it more difficult to manage absences among particular occupational groups such as strategic or operational staff and for these groups lost productivity costs became a risk.
The case study organisations were unable or unwilling to estimate the financial costs of absence which were, instead, merely described. Costs referred to included:
• Direct financial costs – overtime payments for cover or the costs of hiring temporary cover.
• Indirect costs – time taken for a replacement to learn the new role and become productive; diminished services and product quality; loss of business and reputation arising from absence.
82

• Indirect cost in management time – monitoring, consulting HR, dealing with the individual involved, developing strategies, arranging for cover, training and providing support to staff providing cover.
One case study in a school provided the following estimates of costs associated with managing and responding to absences:
• The Assistant Head’s salary in 2001 was around £40,120 (including NI and pension). Approximately one quarter of her time is devoted to the management of absence, therefore the cost associated with this activity is calculated as approximately £10,000 per annum.
• The cost per day of a replacement supply teacher is £142. The school has an annual budget of £20,000 for supply teachers, which is always spent.
Some family-friendly practices such as nursery provision, pay or leave beyond statutory requirements or child care allowances/subsidies all incur accommodation costs. Few publications provide evidence on such accommodation costs, but one study by Bevan et al (1999) investigated three firms, one of which provided an indication of costs associated with their Childcare Allowance policy:
• £210 per head per month • £12,600 per head over five years • £277,200 total cost for 22 members of staff for five years.
A number of studies emphasise that WLB costs are most burdensome for small employers. The third work life balance survey, for example, fund that one fifth of businesses found it difficult to hold open jobs while women were away on maternity leave, a figure that increased to 31 per cent of organisations with fewer then 100 staff (Hayward et al, 2007). It has also been observed that many of the costs incurred are not readily quantified, such as the time cost of training and overseeing replacement staff or the cost to businesses associated with loss of expertise and productivity (Cragg Ross Dawson, 2004). The latter study of 19 small employers (with workforces between 5 and 50) identified the biggest WLB challenge they faced was managing maternity leave and coping with the costs of finding and training replacements.
Impact Assessments
Three impact assessments are considered, relating to: requests to work flexibly for all employees, the Additional Paternity Leave and Pay regulations (implemented in 2011) and Shared Parental Leave.
BIS (2011c) have estimated that the cost of accommodating a request to work flexibly is, on average, £241.24. This figure is based on the assumption that a change to part-time working will incur one week of HR time while a change to other flexible working practices will incur one day of HR time. It is further assumed that around one quarter of changes are to work part time. Accommodation costs include: HR staff re-organising work schedules, adjusting
83

IT systems (e.g. to permit flexible rostering) or recruitment of additional staff to cover for an employee reducing their working hours.
As indicated above, the impact of Additional Paternity Leave and Pay regulations on businesses have been estimated at between £2 million and £15 million (BIS, 2010b). This includes costs to employers of covering absence at £0.5 to £10.3 million. These figures are based on the assumption that four to eight per cent of eligible fathers will take up the benefit. It is further assumed that while some employers will hire temporary replacement workers, others will re-organise staff internally.
For Flexible Parental Leave, the Employers also face an additional direct cost due to having to cover the absence of those fathers who take up these new rights. In calculating these costs, it was assumed that some employers reorganise existing employees to cover the absence while others hire temporary agency workers. The action taken by business varied with the length of leave taken and the size of the business. This additional cost depended on the number of weeks taken as leave and the take-up rate. The costs were estimated to be between 3% and 15% of labour costs and totalled £2.6m to £32m (BIS, 2011d).
Summary
In terms of the various costs incurred, the evidence relating to the costs of accommodating WLB provision is the weakest in terms of the volume of published material. This therefore remains a key gap in the evidence base.
One publication reviewed, based on nine case studies, highlighted the problems associated with managing absences associated with, among other types, maternity, paternity and parental and emergency leave. Absence management was largely perceived as unproblematic with two exceptions – where cover was needed for key operational staff and where absences were unexpected and therefore unplanned in advance.
Holding jobs open for women on maternity leave was, however, identified as problematic for one fifth of the businesses sampled for the third work life balance survey – rising to 31 per cent of businesses with fewer than 100 staff. Temporarily replacing staff on maternity leave was also perceived as a significant burden in a study of pregnancy in small firms.
In terms of the actual costs, the evidence is primarily from government impact assessments. Accommodating a request for flexible working has been estimated as costing, on average, £241.24. For accommodating Additional Paternity leave and Shared Parental Leave the main costs are in covering absences calculated at between 3% and 15% of labour costs depending on length of absence and size of firm.
84

7. Right to request
legislation – evidence of
effects on employers and
employees The Employment Act 2002 (implemented in April 2003) gave parents of children under 6, or parents of disabled children under 18, the right to request to work a flexible working pattern. Eligible employees are able to request a change to the hours they work, a change to the times when they are required to work or to work from home. This covers working patterns such as:
• annualised hours • compressed hours • flexitime • home-working • job-sharing • self-rostering • shift working • staggered hours • term-time working.
Employers have a duty to consider requests seriously and can refuse only where one of a limited number of business reasons apply. If a change is agreed, it is permanent and the employee has no right to revert back to their former working arrangement.
Subsequently, the Work and Families Act 2006 (WFA) introduced a package of measures, including extending the provision for workers to request flexible working patterns to employees with caring responsibilities other than for young children. This came into effect on 6th April 2007. In April 2009, the Right was again extended, this time to parents of children up to the age of 17 (remaining at 18 if the child is disabled). Finally, in May 2011, the Government consulted on a set of proposals, which included extending the right to request flexible working to all employees who have 26 weeks' service with their employer.
This chapter considers the existing evidence on the effects of the right to request legislation. The initial policy interest was in the effects of the legislation on the provision and take-up of flexible working. However a search of the literature established that there were no studies which specifically assessed the impact of the legislation on availability or take-up. Thus, the remit was widened to review evidence on take-up and availability in general, and the
85

literature on the broader effects of the legislation on both employers and employees (although wider benefits to society are excluded from the remit).
The chapter begins by examining the published data on trends in the availability and take-up of flexible working over the period, as well as in the nature and type of requests made. It then moves on to look at evidence on the implementation of the legislation, including a review of the evidence from employment tribunals. Thirdly, it considers the evidence on the perceived effects of the legislation on employers; and finally it provides a brief overview of the literature on the effects of the right to request on gender equality.
The literature used in the chapter mainly comprises primary research based on dedicated surveys of work-life balance or flexible working. As noted above, no experimental or econometric studies assessing the effects of the legislation were found. These survey-based sources are listed below, along with an assessment of their quality. Survey sources were supplemented where appropriate with publications that synthesised existing research evidence.
Survey sources include primary data from both employers and employees.
For employee data, the main sources48 are the Government-sponsored Work-Life Balance (WLB) and Flexible Working (FW) surveys, undertaken in 2003, 2006 and 2011 (WLB), and 2003/04 and 2005 (FW), respectively. Each of these sources is robust with large, representative samples, good descriptions of methods and detailed reporting of findings, including by sub-group. A CIPD-sponsored (2004) employee survey is also available, which has a similarly large, representative sample, but provides far less reporting detail49.
Data quality for employer surveys is more variable. The most robust source is the WLB employer surveys, undertaken in 2002/03 and 2007, with large representative samples of employers. The CBI Employment Trends surveys, which are published each year, provide longer-term trend data but the quality is lower than the government surveys as the sample size is smaller and the sample frame and response rates are not given. A broad cross-section of employers are included although it is not representative. The CIPD surveys are mostly of similar quality to the CBI, although the Labour Market Outlook series are solely membership surveys and hence less representative (see Table 7.1 below). The BCC and EEF surveys are both of their respective memberships. The BCC survey has a large sample size but there is no detail on its representativeness, and the EEF report provides very little detail of the survey methodology and so should be considered lower quality.
48 Labour Force survey data is outside the scope of this review since it is restricted to published analysis of flexible working data. 49 This is referred to in the text as the ‘CIPD (2004) employee survey’ to distinguish it from their employer surveys which are lower quality data sources.
86

Table 7.1 Data sources
Name of survey Sample Data collection Coverage Work Life Balance employer surveys:
Availability and take-up of flexible working, perceived effects of legislation on employers
no 2 (Woodland et al, 2003) Representative sample employers
Data collected Dec 02-Apr 03, immediately prior to the introduction of the initial right to request legislation
no 3 (Hayward et al, 2007) Representative sample employers
Data collected Mar-Aug 07, 4 years after the legislation
Work Life Balance employee surveys:
Availability and take-up of flexible working, flexible working requests; perceived effects of legislation on employees
no 2 (Stevens et al, 2004) Representative sample employees
Data collected Jan-Feb 03, immediately prior to the introduction of the legislation
no 3 (Hooker et al, 2007) Representative sample employees
Data collected Feb-Mar 06, 3 years after the legislation
no 4 (Tipping et al, 2011) Representative sample employees
Data collected in early 2011, almost 8 years after the initial legislation and almost 2 years after the extension to parents of children up to age 18
Flexible Working Surveys:
Awareness of legislation, flexible working requests
no 1 (Palmer, 2004) Representative sample employees
Data collected in Sep 03-Feb 04, 6 months to 1 year after the introduction of the legislation
no 2 (Holt and Grainger, 2005)
Representative sample employees
Data collected Jan 05, 2 years after the legislation
CBI Employment Trends (2004, 05, 06a, 07, 08, 09, 10, 11)
Cross-section of employers, not representative
From 2004-2011 Availability of flexible working, flexible working requests, perceived effects of legislation on employers
CIPD surveys: 2003 Cross-section of
employers, not representative
impact and implementation of right to request
2004 Representative sample employees
Data collected in Aug-Sep 04, 18 months after the introduction of the legislation
flexible working and paternity leave
2005 Cross-section of employers, not
impact and implementation of flexible working
87

Name of survey Sample Data collection Coverage representative
2006 Labour Market Outlook
CIPD member survey employer perceptions of the extension to carers
2011b Labour Market Outlook
CIPD membership, You Gov panel, plus open survey
employer attitudes to legislation
BCC Workforce survey 2009
BCC member survey acceptance rates
EEF 2011 Flexibility in Manufacturing workplaces
EEF member survey Reports on two surveys undertaken in 2007 and 2009 respectively.
availability of flexible working and request acceptance rates
88

7.1 Patterns in the availability and take-up of flexible working 2003-to date
This section of the chapter describes the evidence on the availability and take-up of flexible working from 2003 to date; trends and patterns in the level and type of requests made and the outcomes of requests.
Availability
Employer surveys show an increase in workplaces where at least one form of flexible working is available. For example, the WLB surveys show an increase from 88 per cent in 2003 to 95 per cent in 2007. The CBI Employment Trends series show similar figures, rising from 84 per cent in 2003 to 95 per cent in 2007. These surveys also provide a longer time series, which reveals that 90 per cent of workplaces had at least one form of flexible working available in 2001, rising to 96 per cent in 2011. The trend data shows a gradual upward trend over time, although availability appeared to drop between 2001 and 2003 (from 90 to 84 per cent).50
The CBI series also shows a gradual upward trend in workplaces offering three or more forms of flexible working, from 60 per cent in 2002 to 70 per cent in 2011. However there appeared to be a drop in availability in 2005 and 2006 (35 per cent and 46 per cent respectively), followed by a fairly steep rise in 2007 (to 60 per cent) and another steep rise in 2010 (from 60 to 72 per cent).
Figure 7.1 shows broadly upward trends in the proportion of employers offering each of the different types of flexible working arrangements between 2002 and 2011. Of the various types of flexible working, part-time work is the most widely available, with over 90 per cent of workplaces offering this in 2011 (CBI, 2011). Flexitime, career breaks, job share and working at home/telework were all available to around half of all workplaces in 2011. Term-time only, annualised hours and compressed hours were available at about a quarter of all workplaces.
Figure 7.1 also shows that availability of all forms of flexible working has increased over a 10 year period (2001 to 2011), by at least 10 percentage points (in the proportion of workplaces offering). The largest increases are seen in career breaks and working at home/teleworking, which have risen by 29 and 44 percentage points respectively. Commentary in later CBI surveys suggests that both of these options were introduced by businesses as responses to the recession since they are cost cutting. Career breaks saw large increases in availability in 2006/2007 and again in 2010; working at home/teleworking saw large increases in 2007 and again in 2009. The science, high technology and IT sector and professional services dominate in offering telework (available in 89 per cent and 79 per cent of workplaces in these sectors, respectively), but it is also available in other sectors, for example in 41 per cent of manufacturing workplaces (CBI, 2010).
Flexitime, which is generally seen as being more desirable to employees, and which shows the highest level of take-up (see CIPD, 2004) and of unmet demand51 (see Hooker et al, 2007) also rose fairly steeply in availability from 30 per cent in 2002 to 52 per cent in 2011.
50 The 2003 survey, undertaken in May, just after the legislation was implemented, appeared to be a low point in terms of the availability of flexible working. 51 Unmet employee demand is defined as where an employee does not have access to a particular arrangement, but would like the opportunity to work in that way.
89

Figure 7.1: Percentage of employers offering various types of flexible working arrangement: 2002-2011
Sources: CBI Employment Trends Survey, 2002 – 2011
While the data above shows that the vast majority of workplaces offer at least one form of flexible working, this is not necessarily available to all employees. For example, of workplaces offering part-time hours in 2007, only 62 per cent offered this to all employees. The equivalent figures were 70 per cent for job share, 65 per cent for flexitime, 68 per cent for compressed hours, 83 per cent for reduced hours for a limited period and 24 per cent for working from home on regular basis (Hayward et al, 2007). This data is not available in the 2nd WLB employer survey to give an indication of change over time. However, employee surveys suggest an increase in employee coverage over time. According to the WLB employee surveys, at least one type of flexible working was available for 85 per cent of employees in 2003 and 90 per cent in 2006; two or more types were available to 68 per cent in 2003 and 77 per cent in 2006 (Stevens et al, 2004; Hooker et al, 2007).
Take-up
Employer surveys also show an increase in the take-up of flexible working practices since 2003, although the scale of this increase varies widely for the different forms of flexibility. Table 7.2 suggests that:
• Part-time working is the most widely used form of flexible working arrangement, which has remained broadly stable in take-up since 2000.
• Job sharing and flexitime showed large increases in take-up from relatively low levels between 2000 and 2003, but take-up rates appeared to have flattened out between 2003 and 2007.
0
10
20
30
40
50
60
70
80
90
100
PT Flexi Term-time Job-share Homeworking Compressed
02
03
04
05
06
07
08
09
10
11
90

• Take-up of compressed hours and working reduced hours for a limited period has shown a steady and continuous growth from 2000 to 2007.
• Working from home on a regular basis shows a decline in take-up between 2000 and 2003, followed by a flattening out. (Hayward et al, 2007)
Table 7.2: Percentage of workplaces with some take-up of each form of flexible working in the last 12 months, 2000, 2003 and 2007
2000 2003 2007
Working part-time 76 74 79
Reduced hours for limited period
5 15 22
Flexitime 12 24 25
Job share 6 14 15
Compressed hours 3 7 11
Working from home 22 15 15
Base: All workplaces. Take-up relates to both the practice being provided and at least some employees having used the practice in the past 12 months (in employers with 5 or more employees).
Source Hayward et al, 2007
The Work-life Balance Employee surveys (table 7.3), in contrast to this pattern, suggest falls in take-up of individual forms of flexible working between 2000 and 2007, although care must be taken in interpreting the trend since the 2011 data is not directly comparable with 2003 and 200652. Despite these apparent falls in the proportions of those working in many individual forms of flexible working, the 4th Work Life Balance employee survey found that the percentage of all employees working flexibly has risen from 51% in 2003 to 60% in 2011.
52 In 2011 the base is all those who said that a particular flexible working practice was available at their workplace, rather than those for whom a particular working practice was personally available. The percentages might be expected to be lower in 2011 due to this.
91

Table 7.3: Percentage of employees taking up each form of flexible working in the last 12 months, 2003, 2006 and 2011
2003 2006 2011
Working part-time 28 38 40
Reduced hours for limited period
20 18 14
Flexitime 55 49 49
Job share 15 12 9
Term-time only 46 36 29
Compressed week 36 24 26
Annualised hours 32 27 30
Working from home 54 44 44
Base: All those who have the practice available to them53
Source: Stevens et al, 2004; Hooker et al, 2007; Tipping et al, 2011
Summary
A range of data sources show that the availability of flexible working has increased since 2003, although there are no studies that specifically assess whether this is related to the introduction of the right to request legislation. The availability of all types of flexible working has increased, with particularly large increases in the availability of career breaks and home/teleworking. The 2009 CBI survey suggested that this may be due to the effects of the recession54. General availability at a workplace does not indicate that it is necessarily available to all employees; however the proportion of employees able to take advantage of flexible working has also increased over the time period.
The data on trends in employee take-up of flexible working is inconsistent, but seems to show, overall, that take-up is rising, but not necessarily keeping pace with rising availability. When looking at the proportion of workplaces which have some employees using each of the forms of flexible working, these proportions have risen for all forms between 2000 to 2007, except for part-time working which has remained fairly stable and working from home which has fallen. However, if measured as a proportion of employees taking up the various forms of flexible working when it is made available to them, take-up appears to have fallen (in particular between 2003 and 2006) for most types, except part-time working. Some caution should be applied to this because of changes in survey methodology over the years, but if
53 In 2003 and 2006, employees who said that a particular work arrangement would be available to them if they needed it were asked: ‘Do you currently work, or have you worked, in any of these ways in the last 12 months and with your current employer. In 2011, the questions was asked of all those who have the practice available in their workplace. 54 The report found that employers have taken, plan to take, or are considering, the use of flexible working to reduce labour costs while saving jobs and retaining skilled employees. It was the most popular change to work organisation and working patterns – more than two thirds of employers had already increased flexible working (45%), intended to (13%), or were considering it (11%).
92

these are true falls, it would seem that the large increases in the availability of home working picked up in the CBI surveys are not reflected in increased levels of take-up in 2006/7 or 2011. Thus availability and take-up when measured at a firm level shows an increase - more firms have experience of employees using the different types of flexible working. However, the proportions of individual employees using flexible working may only have increased for part-time working.
Only one study was found which assessed the relationship between trends in take-up and the right to request legislation. Manning and Petrongolo (2008) examined take-up of four types of flexible working among women with and without children under six years of age, using LFS data, from 2000 to 2004, to examine any possible impact of the right to request legislation. Little impact on take-up was found, but the latest data available to them was 2003-4, arguably too soon to discern impact.
7.2 Requests to work flexibly and their outcomes
Level of requests
As indicated earlier, the available literature does not make the distinction between requests arising as a direct result of the legislation and those which would have taken place irrespective of the right to request flexible working. The following sections therefore relate to all requests and not just those arising from the legislations.
The data on the number of requests made by employees to work flexibly is quite limited and there are problems with comparing figures across surveys due to respondents being given different timeframes for their responses.
The WLB employee surveys show that the proportion making requests to work flexibly within the previous two years remained static, at 17 per cent, in both 2003 and 2006 (i.e. just prior to and approximately three years after the legislation was implemented). The 2nd Flexible (FW) survey reports a slightly lower figure of 14 per cent making a request within the previous two years in 2005, while a 2004 employee survey (CIPD, 2004) cites a higher figure of 23 per cent, although this is for the proportion of employees who have ever made a request (not time limited). The most recent WLB employee survey data from 2011 shows that there has subsequently been an increase in the proportion of employees making a request, to 22 per cent in 2011. It is possible that this is influenced by the extension of the legislation to parents of children up to age 17 in 2009, although this link is not made in the report (Tipping, 2011).
Employer data tend to show an increase in the proportion of workplaces receiving requests over time, although the data cannot always be reliably compared. For example, the WLB employer surveys report a large increase in the number of employers who have received requests to work flexibly in the last 12 months, from 17 per cent in 2003 to 40 per cent in 2007, although the figures are not directly comparable as the question was worded differently in each case.55
The CBI Employment Trends surveys also provide (unpublished) figures for the proportion of workplaces receiving requests in 2003, 2009 and 2010 (the question was not asked in other years). This appears to show a sharp upward trend over the period:
55 In 2003, employers were asked about requests to work flexibly in general, while in 2007 employers were questioned about requests for six specific flexible working practices.
93

• In May 2003, one month after the right to request was introduced, 45 per cent of all workplaces had received at least one request from an employee;
• In Aug-Sep 2009, five months after the extension of the Right to all parents of children aged under 17, 63 per cent had received at least one request from parents and 30 per cent had received at least one request from carers;
• In Jul-Aug 2010, 77 per cent had received a request from parents and 28 per cent from carers.
However comparisons across these surveys are unreliable, because in addition to the switch from asking about requests from any employees to asking about requests from ‘parents’ and ‘carers’ separately, respondents are not given a timeframe for their response, hence the figures may be cumulative, i.e. the proportions of those who have ever received a request, which would be expected to rise year on year.
A British Chambers of Commerce survey from 2009 (BCC, 2009) reports that 35 per cent of workplaces received a request in the last 12 months, which suggests a fall from the WLB Employer survey figure of 40 per cent in 2007. However this could be because the BCC survey has a much greater proportion of small businesses (80 per cent of the total respondents have under 50 employees) which would be likely to result in a lower figure.
Types of request
Table 7.4 shows the proportions of employees opting for the various types of flexible working among all those making a request. Data from both the Flexible Working (FW) and WLB surveys are shown. Comparisons between these two survey sources are difficult as the categories given differ slightly. However both sources seem to show a decline in the share of requests for part-time working, as a proportion of all requests, over time. The FW data show a decline from almost two fifths to a quarter between 2003 and 2005, while the WLB data show a decline from almost three in ten to just fewer than a quarter between 2006 and 2011. The WLB data also shows a corresponding increase in the share of requests to change the timing of work hours (rather than the overall amount), from around a quarter in 2006 to just over a third in 2011. The share of flexitime requests has remained stable, at around a quarter in the FW surveys and around 10-15 per cent in the WLB surveys.
Table 7.4: Types of requested change to working patterns
2003 (FW1)
2005 (FW2)
2003 (WLB2)
2006 (WLB3)
2011 (WLB4)
Reduce hours/work part-time 38 25 29 30 23
Change when they worked (compressed hours, change shifts, etc.)
- - 23 25 35
Increase hours - - 9 12 9
Flexitime 25 23 13 11 14
Some type of leave - - 8 9 5
unspecified - - - 13 13
Reduced hours for limited period 13 16 - -
Working from home 10 * - 3 7
94

2003 (FW1)
2005 (FW2)
2003 (WLB2)
2006 (WLB3)
2011 (WLB4)
Compressed hours 8 7 - -
Base: All employees who made a request - form of flexible working not included in survey * sample size too small Sources: Palmer, 2004; Stevens et al 2004; Holt and Grainger, 2005; Hooker et al, 2007; Tipping et al, 2011.
Who makes requests?
Table 7.5, drawn from the WLB and FW employee surveys, shows that women are more likely to make a request for flexible working than men, and that the gender balance has remained the same over time. For example, the WLB employee surveys show that in 2003, 21 per cent of women and 14 per cent of men had made a request for flexible working in the last 2 years, while in 2006 the figures were almost identical. A similar balance between men and women making requests was seen in the 2005 FW survey and in the CIPD (2004) employee survey (29 per cent of women and 19 per cent of men had ever made a request). The most recent WLB survey in 2011 shows that while the overall proportion of employees making a request had increased, the balance between men and women making requests stayed approximately the same: 28 per cent of women had made a request compared to 17 per cent of men. This suggests that the increase from 2006 has been among both men and women.
Table 7.5: Made a request to change working hours in the last two years
2005 (FW2)
2003 (WLB2)
2006 (WLB3)
2011 (WLB4)
Gender
Women 19 21 22 28
Men 10 14 14 17
Family status
Parents - - - 27
- parents of children under 6 - - 24 -
- parents of children 6 yrs and older - - 19 -
Non-parents - - 17 19
Gender and family status
Men with children under 6 12 - 11 -
Women with children under 6 36 - 38 -
Men with children under 16 11 - 13 -
Women with children under 16 28 - 24 -
95

2005 (FW2)
2003 (WLB2)
2006 (WLB3)
2011 (WLB4)
Men without dependent children 9 15 14 -
Women without dependent children 12 15 20 -
Base: All employees who made a request - breakdown not provided in survey report
Sources: Stevens et al 2004; Holt and Grainger, 2005; Hooker et al, 2007; Tipping et al, 2011.
Data from the 2nd FW survey and the 3rd WLB survey show the breakdown of requests by gender and presence of dependent children. Overall, this shows that women with children are much more likely to make requests than men with children, and that this gender disparity is greater in the case of children under the age of 6. Whilst the difference is smaller than between men and women with children, even without dependent children, women are more likely to make requests than men.
It is difficult to examine trends over time in this as the same breakdowns are not available for all the datasets. The WLB surveys appeared to show a small increase among childless women between 2003 and 2006. The more recent 2011 data does not break down the figures by the combination of gender and parental status but does reveal that take-up amongst non-parents has increased slightly between 2006 and 2011. This suggests that the increase in take-up over this period has been primarily among parents, both mothers and fathers. It is possible that this is related to the extension of the legislation to parents of children under the age of 17 in 2009, although this is not explored in the survey. Unfortunately the 2011 data does not provide a breakdown for parents with children of different ages to check whether the increase has been primarily among parents of older children.
Data from the Flexible Working Surveys shows that childcare is by far the most common reason for making a request to work flexibly, although its significance appears to have diminished slightly between 2003 and 2005, from over two fifths of the total number of requests to around a third (see Table 7.6). Requests for other purposes each made up less than 15 per cent of the total. Similar proportions are reported in the 2004 CIPD employee survey. In this survey, requests for the purposes of childcare made up a smaller share (29 per cent of the total), although this was still the single most important reason cited, while spending more time with family (15 per cent of the total) and achieving a better work-life balance (17 per cent of the total) also figured significantly. Overall, three fifths (61 per cent) of requests were for reasons related to home and family.
Table 7.6: Reasons for making a request
2003 2005
Childcare - 43 35
To make life easier - 13 8
To spend more time with family - 11 9
To have more free time - 11 10
96

2003 2005
To fit with travel arrangements - 7 *
Other caring responsibilities - 7 *
For health reasons - 6 6
education or learning - - 10
Base: All requests made * sample size too small for reliable estimate
Sources: Palmer, 2004; Holt and Grainger, 2005.
Requests by type of workplace
The 4th WLB employee survey examined the likelihood of making a request by industry sector. Those working in the construction (11 per cent) and manufacturing industries (15 per cent) were least likely to have made a request to change their working arrangements. It was more likely among those working in public administration, education and health (26 per cent), distribution, retail, hotels and restaurants (23 per cent), transport, storage and communication (24 per cent) and banking, insurance, professional and support services (19 per cent).
The 4th WLB employee survey did not explore the pattern of requests by occupation in detail. However, data is available from the 2nd Flexible Working surrvey. This found that requests were most common among:
• Administrative and secretarial occupations (19 per cent working in this occupational group had made a request);
• Sales and customer service occupations (19 per cent made a request); and • Associate professional and technical occupations (16 per cent made a request);
and were least common among:
• Managers and senior officials (10 per cent made a request); and • Skilled trades (10 per cent made a request).
These patterns changed little between the 1st and 2nd Flexible Working surveys (2003-2005), although the proportion of employee requests increased in banking, finance and insurance (from 11 per cent of the workforce in 2003 to 20 per cent in 2005).
The CIPD 2004 employee survey shows similar patterns too, with higher numbers of requests among employees in
• administrative/secretarial occupations, • retail/customer service occupations, • professional occupations and • associate professional and technical occupations.
97

They were lowest among employees in
• operative/elementary occupations and • skilled trades.
The 2nd Flexible Working Survey reports that the proportion of requests made by employees in small firms and large firms was similar (at 13 and 14 per cent of the workforce respectively). However the 2004 CIPD employee survey reports higher numbers of employee requests in larger firms (for example 24 per cent of employees in businesses of less than 25 employees made a request, compared to 35 per cent of those in establishments with 250-499 employees and 28 per cent of those in establishments with 500+ employees) (CIPD, 2004).
CBI data from 2003 also showed that larger workforces experienced more requests for flexible working (for example 28 per cent of firms with 0-49 employees had received a request for flexible working, compared to 35 per cent of those with 50-199 employees, 53 per cent of those with 200-499 employees, 65 per cent of those with 500 to 4999 employees and 83 per cent of those with over 5000 employees) (reported in CBI, 2004).
Finally, the 3rd and 4th Work Life Balance employee surveys (Hooker et al, 2007; Tipping et al, 2011) showed that requests were greater in public sector workplaces compared to private sector and in workforces where women predominated or equalled the number of men, as compared to those where men predominated.
The outcome of requests
Surveys of employees show the rate of acceptance of requests for flexible working to run at over three quarters of all requests made. The WLB surveys report slightly lower figures (around 70-79 per cent) than the FW surveys (81-86 per cent) (see table 7.7). A 2004 CIPD employee survey reports a similar figure to the FW surveys, of 87% of employees’ requests accepted in 2004. Leaving aside this variation and considering trends over time for each data source separately suggests that rates of refusal have decreased over time. The WLB data shows that 20 per cent of requests were declined in 2003, 17 per cent in 2006 and 13 per cent in 2011. While the number of requests accepted did not rise very significantly over the same period, this was because there were more requests awaiting an outcome in the later data. This data is important because it shows that the acceptance rate has remained high, despite an increasing number of requests over time.
Table 7.7: Acceptance rates for employee flexible working requests, 2003, 2006, 2011
Total agreements Declined Awaiting outcome
Fully* Partially / compromise
reached*
2003 (FW1) 86 11 3 2005 (FW2) 69 12 11 8 2003 (WLB2) 77 20 2006 (WLB3) 60 10 17 5 2011 (WLB4) 61 18 13 8
Base: All employees who made a request * In 2011, these two categories were changed to agreement with and without negotiation/ compromise/appeal, respectively.
Sources: Palmer, 2004; Stevens et al 2004; Holt and Grainger, 2005; Hooker et al, 2007; Tipping et al, 2011.
98

Employer data on acceptance of flexible working requests is harder to compare across sources since different measures are used. The principal difficulty with employer data is that the unit of response to the survey is a workplace, while the unit of analysis for acceptance rates is individuals. Employer surveys approach this problem in a number of ways. The Work-Life Balance employer surveys report on the proportion of employers who have accepted all requests, as do the EEF surveys of manufacturing employers (EEF, 2011). The BCC Workforce survey (2009), instead, cites the number of employers who have accepted ‘the majority’ of requests. In contrast, the CBI Employment Trends surveys ask employers what percentage of requests they accept and then reports an average figure across workplaces. The latter produces a figure closer to a true ‘acceptance rate’, although it does not take account of the large variation across different workplaces.
The 3rd WLB employer survey (2007) reports a very high figure of 90 per cent of employers accepting all requests received for flexible working in the last 12 months, and just 9 per cent turning down a request. Using the same measure (proportion of employers accepting all requests), but a different sampling frame (just manufacturing employers), two surveys by the EEF (reported in EEF, 2011) report much lower rates: 41 per cent of firms accepting all requests in 2007, dropping to 29 per cent in 2009.56 However this data does not shed any light on what proportion of requests were accepted by the firms that did not accept all requests. A BCC survey (2009) reported another high figure of 84 per cent of employers who accepted ‘the majority’ of flexible working requests made. However in this case, respondents were only asked how they had responded to ‘the majority’ of requests, without any specification of what constituted ‘the majority’.
As noted, the CBI data uses a different measure, reporting the average acceptance rate across employers. Its latest figures (CBI, 2010) report that for parents57, 92 per cent of requests were accepted by employers and 8 per cent declined, and for carers, 94 per cent of requests were accepted and 6 per cent were declined. Trend data show limited change in these rates over time (see Table 7.8).58 Since 2005, the rate has remained at over 90 per cent every year for parents, and since the Right was introduced for carers in 2007, it has remained at over 93 per cent each year for that group.
Table 7.8: Acceptance rates of flexible working requests for parents and carers, 2004 -2010
Requests from parents Requests from carers Total
agreements Declined Discussed* Total
agreements Declined
2004 77 8 16 2005 90 10 2006 94 6 2007 94 6 93 7 2008 95 5 96 4 2009 93 7 94 7 2010 92 8 94 6
56 These figures seem particularly low in comparison with other data sources, for reasons that are not clear. However this data should be treated with caution since there is very little information available about the sample on which the figures are based. The survey was conducted in 2010 with 666 respondents from organisations of all sizes and sectors, across the UK. 57 This appears to be all parents rather than only those with a legal entitlement (ie with children aged under 6 until 2009 and subsequently with children aged under 17). 58 There appears to be a large increase in the proportion of requests agreed to from 2004 to 2005, but this seems to be because the response categories changed: in 2004, requests that were ‘discussed’ were in a separate category, whereas in subsequent years the categorisation was changed to ‘discussed and compromise agreement reached’ and included within the total number of agreements.
99

Base: The figures are an average rate across all employers * In later years, this category was removed and agreements where a negotiated compromise was reached were included within the number of total agreements.
Sources: CBI, 2004-2010.
The CBI acceptance rates are considerably higher than those reported in employee surveys, which is likely due to differences in the way the acceptance rate is derived (average across all workplaces rather than average across all employees). The disparity could be interpreted as suggesting that there are a small number of workplaces declining a rather large proportion of requests.
Variation in acceptance rates
The available evidence from employee surveys shows that acceptance rates are higher for women and for parents than for men and non-parents respectively (see Table 7.9). Looking at the proportion of requests that are declined, there is a 10 percentage point difference between the figures for men and women (in favour of women) in the 3rd WLB survey in 2006, and an 8 percentage point difference in the 4th survey in 2011.
Table 7.9: Acceptance rates of requests for flexible working by gender and parental status
2005 (FW2) 2006 (WLB3) 2011 (WLB4) Accepted
fully** declined Accepted
fully** declined Accepted
fully** declined
Men 62 14 53 23 60 18 Women 72 10 66 13 62 10 Parents 73 10 - - 62 11 Non-parents 63 13 58 17 60 15 Parents with a child under 6
- - 60 *
Parents with a child age 6+
- - 71 18
All requests 69 11 68 17 61 13 Base: All employees who made a request * sample size too small for reliable estimate ** in FW2 and WLB3 this meant without partial agreement or compromise; in WLB4 it meant without negotiation, compromise or appeal
Sources: Holt and Grainger, 2005; Hooker et al, 2007; Tipping et al, 2011.
Requests are also more commonly declined for non-parents than for parents, although the disparity is not as great as that for gender. The evidence available, albeit limited, seems to suggest that this is not a result of requests being more commonly accepted for those with legal eligibility to make a request, since the 3rd WLB survey shows that parents of children under 6 were less likely to have their requests accepted than parents of children aged 6 and over. The 2nd Flexible Working survey (figures not shown in table) also showed similar rates of full acceptance of requests for those with a child under 6 (75 per cent accepted), those with a child aged 6-11 (73 per cent accepted) and those with a child aged 12-16 (72 per cent accepted). The only statistically significant difference was between parents and non-parents. The most recent data from the 4th WLB survey does not provide a breakdown by age of child.
The CBI’s Employment Trends survey in 2009 also addressed this question, comparing acceptance rates for ‘parents’, ‘carers’ and ‘those without legal eligibility’ just after the extension of the Right to parents of children up to the age of 16 had been introduced. This showed that acceptance rates for parents and carers were 93 and 94 per cent, respectively,
100

while for those without legal eligibility the rate was slightly lower at 87 per cent. (See previous section for note on how these rates are calculated.)
The WLB surveys found no statistically significant differences in the success rates depending on the different kinds of work arrangements requested.
CBI data from 2004-8 shows request acceptance rates by organisation size, which shows consistently higher acceptance rates for small firms, e.g. in 2007, the rate was 100 per cent for those with less than 50 employees, compared to 94 per cent overall. However employee surveys (2nd Flexible Working survey, 2004 CIPD employee survey) found no difference in acceptance rates by size of firm.
CBI data from 2004 and 2005 show that requests were least likely to be successful in the distribution, hotels and restaurants sector, energy and water, and retail. They were most likely to be successful in banking, finance and insurance and other services in 2004, and in professional services and transport and communications in 2005. (There is no data by sector post-2005). Report commentary (CBI, 2005) states that higher refusals in retail and distribution, hotels and restaurants may reflect the difficulty of accommodating more flexible working in sectors which need more staff at fixed times during the day or who have extremely busy periods during certain times of the year.
Summary
No data could be found about requests arising directly from the legislation. All the data refers to requests in general. Trend data on the proportion of employees making a request to work flexibly is fairly limited and some of the data unreliable. The best available evidence is the WLB employee surveys, which show request levels static at 17 per cent of employees having made a request between 2003 and 2006, but rising to 22 per cent in 2011. There is no employee data available for the intervening period to see when the increase occurred. A number of employer data sources exist, but unfortunately the data cannot be reliably compared to identify trends, due to differences in question wording, timeframe for responses and the nature of the samples.
Data from the various surveys show that requests for reduced hours or part-time working have generally made up the largest proportion of the total requests for flexible working, although the share of part-time requests appears to be declining. The most recent figures from the 4th WLB employee survey show that requests for a change in when hours are worked is more common (35 per cent of the total) than requests for reduced/part-time hours (23 per cent of the total).
Women are more likely than men to make a request for flexible working, as are parents compared to non-parents, and mothers compared to fathers. The gender balance has changed little over time and neither has the balance in terms of parental status. This suggests that the increase in requests seen between 2006 and 2011 has been primarily among mothers and fathers. It is possible that this increase is linked to the extension of the right to request flexible working to parents of children aged under 17 in 2009. A breakdown by the age of children is not available for the 2011 data to check if the increase is primarily among those with older children. Recent data is not available on the reasons for making requests, but earlier data show that childcare is by far the most common reason. A 2004 employee survey commissioned by CIPD showed that overall, three fifths of requests were for reasons related to home and family, including childcare, spending more time with family, and achieving a better work-life balance.
Finally, requests for flexible working are most common in certain workplaces, including larger workplaces, those in the public sector, those where women predominate, and in
101

industry sectors such as public administration, education and health (26 per cent), distribution, retail, hotels and restaurants (23 per cent), transport, storage and communication (24 per cent) and banking, insurance, professional and support services (19 per cent).
Data from employee surveys are the most reliable source for assessing the proportion of employee requests to work flexibly which are successful. There are variations across data sources, but generally acceptance rates are shown to be above 75 per cent of all requests made. The most recent data from the 4th WLB survey shows 79 per cent of requests accepted either outright or after negotiation. There also appears to be a slight downward trend in the proportion of requests declined in the WLB survey data, from 20 to 13 per cent between 2003 and 2011. This is important because it shows that the acceptance rate has remained high, despite an increasing number of requests over time. Data from employers on the rate of acceptance of requests is less reliable due to differences in measurement and data samples, although generally acceptance rates seem high and, again, stable over time.
The evidence shows that women are more likely to have their requests accepted than men and parents more likely than non-parents. This disparity has persisted over time, and is still evident in the 4th WLB survey data from 2011. It is difficult to reliably assess whether acceptance rates are higher for those with legal eligibility because of different age-of-child breakdowns in the various surveys. Data is inconsistent over whether requests are more likely to be accepted in organisations of differing sizes, while CBI data (2004/5) demonstrates that there is variation by industrial sector.
7.3 Implementation issues This section of the chapter describes the evidence on implementing the right to request flexible working, including evidence on workforce coverage, promoting the right to request and awareness among employees; decision-making processes including how requests are made and agreed; and how disputes and disagreements are dealt with.
Workforce coverage, promotion of the right to request and employee awareness
Workforce coverage
It is difficult to reliably assess the evidence on the proportion of workplaces which have extended the right to request flexible working to other groups of staff outside of the legal framework. The evidence found is highly inconsistent, which appears to be due to differences in question wording on different surveys.
The 3rd WLB survey of employers (2007) showed that the vast majority (92 per cent of those interviewed) said that they would consider a request to change a working pattern from any employee. Those who would not consider such a request from the whole workforce tended to specify particular job roles from whom a request would not be considered.
CBI Employment Trends data show a slight upward trend from 50 per cent to 62 per cent of workplaces offering the right to request flexible working to all staff between 2007 and 2009. The CBI also reported that larger firms were slightly more likely than smaller firms to offer the right to request to groups of staff outside the legal minimum (CBI, 2007).
The CBI figures are much lower than those reported in the WLB survey, which may reflect differences in what was being measured: in the WLB survey this was employers who would ‘consider a request from any employee’ and in the CBI surveys this was ‘extending the right to request’ to all staff. This may not necessarily mean the same thing to employers.
102

Promotion
A CIPD survey59 undertaken shortly after the introduction of the right to request (2003) showed that 55 per cent of employers had taken steps to raise awareness of the new Right among their employees. This had a high correlation with having a formal policy on flexible working and with having a policy that was more generous than the legislative requirement.
A later CIPD survey (2005)60 showed that the most common measures taken to encourage take-up included publicising its availability (found among 64 per cent of employers surveyed), ensuring training opportunities were available to flexible workers (62 per cent of employers), and asking about flexible working in staff surveys (49 per cent of employers). Support offered to line managers in implementing requests for flexible working included HR advice/coaching (provided by 86 per cent of employers surveyed), information about legal requirements (in 79 per cent of employers) and written advice/guidance (in 66 per cent). Only 14 per cent had provided training courses.
Awareness
Awareness of the legislative right to request flexible working amongst employees has risen substantially over time, with three quarters of all employees aware of the Right in 2011. The Work Life Balance employee surveys report a rise in awareness from 41 per cent of employees in early 2003, to 56 per cent in 2006, to 75 per cent in 2011. While there are slight differences in the question wording in 201161, which means the results are not directly comparable, this still indicates a significant increase in awareness over time.
The 4th Work Life Balance survey (2011) reports that awareness was highest amongst:
• women (79 per cent of women employees surveyed were aware compared to 72 per cent of men)
• parents (79 per cent of parents surveyed were aware compared to 73 per cent of non-parents)
• public sector workers (83 per cent of whom were aware compared to 72 per cent of private sector workers)
• those in workplaces of 250 or more employees (89 per cent of whom were aware) and • employees with managerial or supervisory duties (83 per cent of whom were aware
compared to 71 per cent of those without such duties).
Awareness of the right to request flexible working was particularly low amongst:
• employees aged 16 to 24 (58 per cent of whom were aware) • workers in routine and manual occupations (64 per cent of whom were aware).
59 This survey was conducted by the CIPD and Lovells in September 2003. A total of 4,914 survey questionnaires were sent out to a representative cross-section of organisations of all sizes (ranging from those with fewer than 25 people in their workforce to those with more than 25,000) and all industry sectors across the public, private and voluntary sectors. In all, 510 organisations responded within the returns deadline. 60 This survey was carried out in October/November 2004. The questionnaire was sent to HR professionals in the private, public and voluntary sectors. In total, 585 responses were received. 61 In 2003 and 2006, respondents were asked if they were aware of ‘the right to request flexible working for parents of children under the age of six or disabled children under 18’, while in 2011 they were asked about their ‘awareness of the right to request flexible working’ generally.
103

Decision-making processes
The Flexible Working (Procedural Requirements) Regulations 2002 sets out a procedure for making requests which must be followed by the employer and employee in order to ensure that a proper application is made and that it is considered seriously (Walsh, 2008). The procedure requires the employee to make a request explaining why they wish to make a change to their working arrangements, which the employer must respond to by organising a meeting to discuss the request within 28 days. The employee must then receive a written notification of the decision within 14 days of the meeting. There are also set procedures for appealing decisions.
In the Government’s Response to the Consultation on Modern Workplaces (BIS, 2012), there is a proposal to replace the statutory process for considering requests with a new duty on employers to consider requests in a reasonable manner. A statutory Code of Practice would be created to demonstrate what a ‘reasonable’ manner might be. This would allow employers more freedom in deciding how to deal with requests.
How requests are made
Despite the procedure set out in legislation, the majority of requests to work flexibly are still made informally through a face to face discussion. The most recent data from 2011 show that 85 per cent of those making a request in the last two years had a face to face discussion, 16 per cent made the request by letter or form, 9 per cent by email and 4 per cent by phone (Tipping et al, 2011). Percentages do not add up to 100 because respondents could select more than one response. Hence some of those making their request through a face to face discussion may have also used letter, form, email or phone in addition. Similarly, in receiving a response to their request, the majority of employees (76 per cent of those making a request) received this face to face, 21 per cent received the response in a letter or a form, 11 per cent by email and 5 per cent by telephone. (Again, more than one response can apply.) This picture does not appear to have changed substantially since 2003 (just before the legislation was implemented), when the 2nd WLB survey reported that 27 per cent of employees making requests did so in writing and 75 per cent through face to face discussion (Stevens et al, 2004). This suggests that the formal statutory procedure enshrined in the legislation is not being widely used in the day to day practice of employees making requests to change their working patterns.
Formal and informal agreements to flexible working requests
The CBI Employment Trends surveys report the proportions of requests that were agreed ‘formally’, ‘informally’ or a ‘compromise reached’ over time62 (see Table 7.10).63 The data show that for both parents and carers, there has been a shift from informal to formal agreements over time, although this has happened less so for carers, who are much more likely to make informal agreements than parents. Data on workplace size (not in the table) also shows that the shift to formal agreements for carers has occurred almost exclusively within larger workplaces. It is not clear why there are more informal and fewer formal agreements for carers, but it is possible to speculate that it may reflect a greater need among carers of adults for short-term flexibility solutions. The table also shows the rates of compromise agreements to be broadly stable over time for parents, but increasing for carers, which seems to be at the expense of informal acceptances. Without knowing how the terms are defined it is difficult to interpret this, but it may suggest that with a shift towards more
62 There is no definition given of these terms in the survey, it is left to respondents to define. This makes it a little difficult to interpret since ‘reaching a compromise’ is not mutually exclusive with either a formal or an informal agreement. 63 As with the data on acceptance rates cited earlier, the figures are an average across employers.
104

formal procedures for reaching agreements, there are inevitably a greater number of compromises, since informal agreements by their nature may have already incorporated some element of compromise.
Table 7.10: Average formal and informal agreements rates to requests for flexible working across all employers
year % of requests agreed from parents % of requests agreed from carers formal informal Compromise
reached* formal informal Compromise
reached 2004 53 24 16 2005 55 20 15 2006 62 20 12 2007 66 19 10 52 32 10 2008 65 17 13 62 22 11 2009 71 10 12 55 20 19 2010 68 8 15 55 20 18
Base: The figures are an average acceptance rate across all employers 64 *In 2004, wording was ‘discussed’ rather than ‘compromise agreement’ reached
Sources: CBI, 2004-2010
While employer stakeholder organisations such as the CBI have argued against the need for a statutory procedure for the right to request, and in favour of a code of practice instead, there is little evidence available on the benefits or burdens of the different types of decision-making process. The Walsh review (2008) of how to extend the right to request to parents of older children reported (on the basis of stakeholder evidence) that most businesses, particularly small businesses, preferred an informal approach to agreeing flexible working requests. It is not clear exactly what was meant by ‘informal’ in this regard, though the discussion in the review suggests that it encompasses informal discussion and agreement without a permanent change to contract.
The CBI’s (2006b) case studies of ‘good practice’ in flexibility also point to the benefits of ‘informal’ negotiations around flexible working, and employees taking responsibility in considering how their needs can be successfully accommodated by the business. However the case studies suggest that there is no reason why such discussion cannot be part of a statutory process. Indeed, some case studies point to the benefits of a statutory procedure for the consistent and fair handling of requests, alongside informal negotiation to work out the details. Relevant case studies are summarised below:
• HMG Paints describes a ‘team-up’ approach to flexible working requests, whereby an employee first discusses their needs with their line manager, who together work out the best solution for the team. The line manager then puts the request before the managerial team. Managers look at the needs of the team first, then at the effects on the company as a whole. This approach is said to be effective.
• Associated British Ports report that they get very few formal statutory requests for flexible working but a large number of informal requests which are usually accommodated, especially for women returning from maternity leave.
• Scottish and Newcastle Ltd report that the right to request flexible working works best when employees are required to consider how their proposed hours will work effectively within their team; when the line manager is involved; and when both sides are willing to
64 The CBI Employment Trends surveys ask employers what percentage of requests they accept and then reports an average figure across workplaces. The latter produces a figure closer to a true ‘acceptance rate’, although it does not take account of the highly varying number of requests across different workplaces.
105

compromise. It is also considered important to have a fair and consistent procedure for handling requests.
• GSK reports that prior to the legislation, requests for flexible working were handled on an informal, case by case basis, with input from HR only if there was a need to change contractual terms and conditions. Since the legislation, they have shifted to using a ‘formal and more detailed’ process for handling and managing requests, although this still encompasses employees and managers working out negotiated solutions together with facilitation by HR. This is said to work effectively.
There is little evidence available on whether formal or informal procedures are preferable for employees. Data from the second WLB employer survey (just prior to the legislation in 2003) showed that take-up of flexible working was significantly higher where formal policies existed, and managerial discretion was reported to be lower where policies were formalised. In the third survey (2007), data showed that where there was no written policy, decisions were usually made on an ad hoc basis and line managers were more likely to have discretion over decisions. The second Flexible Working survey showed that full acceptance of employee requests was more likely if the request was made orally rather than in writing (73 per cent of oral requests were fully accepted, compared to 68 per cent of written requests), and if the line manager was a woman rather than a man (72 per cent of those where the line manager was a woman were fully accepted, compared to 67 per cent of those where the line manager was a man).
An EHRC review of the impact of the right to request legislation on gender equality (Hegewisch, 2009) cites evidence that where agreements to change working patterns are made informally, this can leave employees vulnerable if line management changes.
Disputes and disagreements
Tribunal proceedings
In the UK, an employee can take a flexible working case to a tribunal if the employer:
• has not complied with the statutory procedure; • has not specified one of the permitted business grounds for refusal; • has based the rejection on incorrect facts; or • has not provided a ‘sufficient explanation’ of the statutory business grounds that have
been used.
Employers’ business grounds themselves cannot be challenged.
If the claim is upheld, the employer may be required to reconsider the request and/or to pay compensation of up to 8 week’s pay (capped at £260 per week).
Tribunal proceedings related to the right to request flexible working appear to be uncommon. A CIPD survey in 2003 showed that 1 per cent of employers who had turned down requests reported that tribunal proceedings had been brought by employees (CIPD, 2003). In the 3rd WLB employer survey (Hayward et al, 2007), 5 workplaces in the sample (less than 0.5 per cent) had had a case taken to tribunal.
In the five years after the implementation of the Right, Acas registered 1,500 claims that had flexible working as the primary or secondary issue, constituting 0.2 per cent of all claims during that period (Hegewisch, 2009).
106

BIS (2011c) reported that flexible working accounted for less than 0.1 per cent of all Employment Tribunal claims since the right to request flexible working was introduced in early 2003. There were only small increase in claims following the extensions of the right to request to carers of adults in April 2007 and to parents of children up to age 17 in April 2009 (BERR, 2009; BIS, 2010c). The number of claims in the flexible working jurisdiction were as follows:
• in the year to March 2007 there were a total of 235 ET claims • in the year to March 2008 there were 271 ET claims • in the year to March 2009 there were 266 ET claims • in the year to March 2010 there were 350 ET claims
Despite this low volume of claims, Hegewisch (2009) reports that the number of claims to tribunals or lower level labour courts in the UK regarding flexible working is higher than in Germany and the Netherlands, which may be because there are less well developed workplace mechanisms for dispute resolution in the UK. In the UK, Acas has been given a role in mediating disputes, yet they report that cases only reach them once the employment relationship has broken down which limits the potential for their involvement at an early stage to facilitate the introduction of alternative working patterns (Hegewisch, 2009).
Where flexible working cases have been brought before employment tribunals, courts have successfully challenged employers in some cases, usually where they have not seriously considered the feasibility of a request or where the procedure has not been followed. However, successful challenges are limited because courts do not have a right to challenge an employer’s business reasons. In workplaces where there is little incidence of part-time work, employers have argued that it is too difficult for them to fill part-time vacancies, for example (Hegewisch, 2009).
The majority of cases brought to employment tribunal are those where flexible working is a secondary element in a sex discrimination case (of cases brought in the first two years following the Right, over half of all cases, and two thirds of those brought by women, were of this nature) (Hegewisch, 2009). This is because women are able to rely on case law which establishes that withholding alternative working arrangements to mothers with caring responsibilities may constitute indirect sex discrimination. In discrimination cases, courts have the right to question business reasons (weighing the reasonable needs of the business against the discrimination of the claimant); damages can be higher; employees are protected from day one of employment; and employers are expected to bear some of the costs in relation to a request.
Such cases are more likely to succeed than sole flexible working cases. For example, sex discrimination has been successfully claimed in cases where women have been seeking to reduce their hours to part-time following maternity leave. It is more difficult for men to bring such cases, since it is difficult to claim that it discriminates against them as a group. During the first two years after the right to request legislation, men brought a quarter of all claims relating to flexible working, but only one in seven of those were brought in conjunction with a sex discrimination claim. This leads to a concern that the operation of the right to request may be inadvertently deepening gender segregation. Since men are less able to use the courts to enforce their rights, employers may prioritise requests from women (Hegewisch, 2009).
Summary
Workforce coverage of the right to request flexible working is difficult to assess because of different measures used across data sources. CBI data show a slight upward trend between
107

2007 and 2009 in the proportion of workplaces which have extended the right to request to all staff, from 50 per cent to 62 per cent. The WLB (2007) survey, however, shows that a much larger proportion of employers (92 per cent) say they will consider a request for flexible working from any member of staff. This may reflect a difference between informal consideration of requests on the one hand, and formally extending the Right (in company policy documents, for example) on the other. CIPD surveys examining implementation showed that around a half in 2003, and close to two thirds of workplaces in 2005 were taking steps to publicise the right to request amongst staff. A large majority were also providing HR support to line managers for implementing the Right. Awareness of the Right has risen significantly, to three quarters of all employees in 2011. Women and parents are more aware than men and non-parents, as are those in the public sector, larger workplaces and with managerial responsibilities.
There is a limited amount of evidence on the way that decisions around flexible working are currently made. Employee surveys shows that the majority of requests are made informally through face to face discussions rather than in writing, suggesting that the formal statutory procedure is not being widely used in requests for changes to working patterns. The most recent data from the 4th WLB survey (2011) shows that only a quarter of requests were made in writing (letter, form or email). CBI trend data on the nature of agreements to work flexibly show a shift from informal to formal agreements over time, especially for parents rather than carers. Case study evidence (accumulated by the CBI) point to the benefits of ‘informal’ negotiations around flexible working, but show no reason why such discussion cannot be part of a statutory process. There is limited evidence of the effects for employees, although one review suggested that where agreements are made informally the employee may be vulnerable if line management changes.
The evidence that is available suggests that disputes and disagreements around the right to request flexible working are uncommon. However it appears that while the proportion of total requests accepted has not changed with the rising number of requests (between 2006 and 2011), there is now a higher proportion subject to some form of negotiation or appeal (from 13 per cent of all agreements in 2006 to 23 per cent of all agreements in 2011). Cases brought before an employment tribunal are very rare – less than 0.5 per cent of employers had experienced this in 2007 (Hayward et al, 2007). There was a slight upward trend in cases brought for flexible working issues following the extensions of the legislation in 2007 and 2009, but the increase was not substantial. The majority of flexible working cases brought to a tribunal are those where flexible working is a secondary element in a sex discrimination case. Such cases are more likely to be successful because an employer’s business reasons for refusal can be examined. Men are less able to claim on the grounds of indirect sex discrimination than women, however, leading to a concern that the operation of the law may be inadvertently deepening gender segregation because employers are favouring requests made by women.
7.4 Effects of flexible working requests on employers Previous chapters of the report have addressed in detail the benefits and costs to businesses of work-life balance and flexible working practices in general. This sub-section of the chapter focuses on the available evidence about the effects of the right to request legislation, more specifically, on employers. The chapter begins by looking at the problems employers have reported in complying with the legislation and the reasons given for declining requests. It then looks at evidence on employers’ perception of both the general impact of the right to request and its specific impact on different aspects of a business. Finally, it considers employers’ perceptions of the impact of the proposed extension of the right to request to all employees.
108

Effects on employers
Problems complying with the legislation
A few data sources have asked employers directly about what their experiences have been of complying with the right to request legislation. These are mostly employer surveys undertaken in the first few years after the introduction of the Right in 2003. More recent data on these issues is not available.
A CIPD survey (2003) conducted shortly after the legislation was enacted, asked employers about experienced and anticipated problems complying. The most commonly reported problems were:
• exploring and/or discussing alternative work arrangements (cited by 40 per cent of those who reported problems)
• managing employee expectations (cited by 35 per cent) • disruption to business (cited by 24 per cent)
A relatively small number of respondents cited cost as a problem (13 per cent of those who reported problems), although smaller organisations (with fewer than 25 staff) were more likely to perceive costs to be a problem than others. Write-in responses to the survey included difficulties with managers not considering requests seriously, and ensuring a consistent response from line managers across an organisation. Qualitative interviews accompanying the survey suggested that employers also experienced problems with employees making requests without thinking about the organisation’s needs.
To put this in context, however, in the same survey 90 per cent of respondents disagreed that they had ‘significant difficulties complying with the legislation’, including 31 per cent who ‘strongly disagreed’ with the statement, while only 7 per cent ‘agreed’ or ‘agreed strongly’.
A CBI survey conducted two months into the new regime (cited in CBI 2004) reinforced these findings, showing that few firms foresaw major problems with the new right at that point, although smaller employers were slightly more worried that the new right would have a significant impact on their organisation than their colleagues in larger firms.
In a later CIPD survey (2005), respondents (who were HR professionals) were asked about problems encountered by line managers in dealing with requests for flexible working. The most frequently reported concern was demonstrating fairness between different employees. Other commonly reported problems were communicating with the team, difficulty controlling workflow and needing to recruit new staff to maintain output.
Reasons for refusal
The right to request legislation requires that employers have a duty to consider requests for flexible working seriously and can refuse only where one of the following business reasons apply:
• the burden of additional costs • detrimental effect on ability to meet customer demand • inability to re-organise work among existing staff • inability to recruit additional staff • detrimental impact on quality • detrimental impact on performance • insufficiency of work during the periods the employee proposes to work
109

• planned structural changes
There is data from a small number of survey sources examining which of these reasons have been given most commonly by employers, which sheds some light on the potential effects of requests for flexible working on employers.
The 2003 CIPD employer survey cited above reported that the most common grounds used by employers were the inability to reorganise work (27 per cent of workplaces who had refused a request had done so on these grounds), the inability to meet customer demand (23 per cent) and detrimental impact on performance (21 per cent).
Data from employees provides a similar picture. The 2004 CIPD employee survey reported that the most common reasons given to employees for declining requests were having too few staff to cover (32 per cent of those who had been refused had been given this as a reason), inconvenience to the employer (22 per cent cited this) and workloads or pressure of work (20 per cent cited this) (CIPD, 2004).
The 2007 Work Life Balance Employer survey found that the reasons employers gave for turning down requests to work flexibly tended to be associated with demands on the business; the most commonly cited factors being the disruption that the change would cause and the difficulty of reorganising work among existing staff (mentioned in 43 per cent and 26 per cent respectively of requests turned down). Other factors cited included the cost to the business and the concern that to accept the request would risk damaging the quality or performance of the business (nine per cent and twelve per cent respectively of requests turned down).
Employer perceptions of the impact of the legislation
The 2003 CIPD survey already cited also asked employers about the impact of the new right on their organisation. Findings were that over three quarters (76 per cent) of respondents ‘agreed’ or ‘strongly agreed’ that the impact of the new right to request flexible working on their organisation was negligible (CIPD, 2003). Only 22 per cent ‘disagreed’ or strongly ‘disagreed’.
From 2004-6, the CBI Employment Trends surveys asked employers whether the new right to request was having a positive or negative effect on their business.65 The majority of employers over this period perceived it to have a neutral impact on their business and only relatively small numbers (fewer than a quarter) perceived it to have a negative impact (CBI, 2004, 2005, 2006a). However the findings show that there was a slight polarisation of views over the period. The proportion of employers perceiving the Right to have had a positive effect increased slightly from 25 per cent in 2004 to 31 per cent in 2006, while the proportion perceiving it to have a negative effect went up more sharply from 11 to 24 per cent. The proportion perceiving it to have no impact decreased from 62 per cent to 43 per cent.
In the 3rd WLB employer survey (Hayward et al, 2007), employers were asked about the effects of the new regulations arising from the 2002 Employment Act on their business. This Act included the introduction of the right to request flexible working for parents of children under 6 (or parents of disabled children under 18), but also included extensions to maternity leave and pay, and the introduction of paternity and adoption leave and pay, which, arguably, are likely to have a greater impact on employers. The findings were that 67 per cent of employers felt the legislation made no difference to them, 12 per cent saw it as
65 Later surveys asked about impacts on specific aspects of the business instead – this data is presented below.
110

having a positive effect and 18 per cent a negative effect. Larger workplaces (100 + employees) were more likely to perceive a positive effect, as were public sector and unionised workplaces.
In the 2006 CIPD Labour Market Outlook survey (a member survey of 1000 organisations), employers were asked their views about the 2006 Work and Families Act (WFA), which was due to be implemented the following April, and which included extending the right to request flexible working to carers, as well as extensions to maternity pay and the potential introduction of additional paternity leave. Nearly three fifths of employers (59 per cent) felt that the WFA ‘tipped the balance in favour of employees’ (26 per cent to a large extent and 33 per cent to a small extent), while a third (37 per cent) felt that it ‘struck the right balance’ (CIPD, 2006). When asked about specific elements of the Act, employers were most concerned about paternity leave and least concerned about the right to request extension. Two fifths (40 per cent) said the extension of the right to request would cause some difficulties, although only 4 per cent said it would cause them ‘significant difficulties’, while 35 per cent said the effect would be neutral and 12 per cent said it would be beneficial. (This compares to 57 per cent of employers who said the maternity pay provisions would cause them some difficulties and 64 per cent who said this of the additional paternity leave provisions.) Smaller employers were more likely to anticipate difficulties arising from the WFA and less likely to perceive benefits.
In the 2011 CIPD Labour Market Outlook survey, employers were asked their views about a range of pieces of legislation. Around three fifths viewed the right to request flexible working legislation as ‘necessary’ (65 per cent of those in the public sector, 58 per cent of those in the private sector and 62 per cent of those in the voluntary sector) (CIPD, 2011b)66. On the other hand, only around a quarter of employers thought that the legislation was well-drafted (25 per cent of those in the public sector, 23 per cent of those in the private sector and 31 per cent of those in the voluntary sector). However, while small, the proportions who think the legislation is well-drafted are higher than for any of the other pieces of legislation included in the survey.
Perceived effects on specific business elements
Surveys have also asked employers about their perceptions of the effect of the right to request legislation on specific elements of their business. The 2003 CIPD survey cited earlier reported that over two thirds (68 per cent) of employers agreed that the new right to request flexible working had a positive effect on ‘staff attitudes and morale’, including 19 per cent who ‘strongly agreed’ (CIPD, 2003). Around a third (35 per cent) ‘disagreed’ or ‘strongly disagreed’. Views were more mixed on the ‘business benefits’: around a third (32 per cent) ‘agreed’ or ‘strongly agreed’ that there were ‘business benefits’ to the new right to request, whilst another third (34 per cent) ‘disagreed’ or strongly ‘disagreed’. Public sector workplaces were more likely (than those in the private and voluntary sectors) to agree that the new right had a positive effect on attitudes and morale and had business benefits.
The 2011 CIPD Labour Market Outlook survey (a member survey) reported that two fifths (40 per cent) of employers felt that the right to request legislation is supporting them to meet their strategic HR or business goals, although this was substantially lower in the private sector (33 per cent) than in the public sector (51 per cent) or the voluntary sector (50 per cent) (CIPD, 2011).
From 2006 to 2011, the CBI Employment Trends surveys asked respondents about the impact of the right to request on various aspects of their business. For each business area,
66 Percentages on this question were based on 307 public sector respondents, 600 private sector respondents and 149 voluntary organisations.
111

respondents were asked whether the legislation had a positive, negative or neutral impact. This data is presented in Table 7.11. These findings show that for all measures, employers are becoming more likely to think the effect is positive, at the expense of those thinking the effect neutral. The proportions seeing the effect as negative has stayed about the same.
Looking at the various different measures, employers are most positive about the effect on employee relations and recruitment and retention. In 2011, three quarters of employers thought the effect on employee relations was positive and three fifths thought this was so for recruitment and retention. A negligible proportion of employers thought the legislation had a negative impact on these two measures. For employee absence rates, the proportions who thought the legislation had a negative impact were again negligible, but in this case most employers thought the effect was neutral (59 per cent of employers) and 38 per cent thought it was positive. For productivity, customer service and labour costs, which are arguably more ‘bottom line’ business benefits, the largest proportion of employers saw the effect as neutral in each case. However, more employers thought they had a positive than negative effect. Thirty seven per cent of employers saw the effect on productivity as positive (compared to 11 per cent who saw it as negative); around a quarter saw the effect on labour costs as positive (compared to around a fifth who saw it as negative) and around a fifth saw the effect on customer service as positive (compared to 15 per cent who saw it as negative).
The most recent CBI surveys (CBI, 2010, 2011) also asked employers about their perceptions of the likely impact of the proposed extension of the right to request to all employees. This data is shown in Table 7.12. This table shows that compared to their views on the impact of the current right, employers tended to be more negative about the impact of the extension. For all measures, there are fewer employers who saw the likely impact of the extension as positive, compared to those who perceive the impact of the current right as positive. This is most marked for the impact on employee relations, recruitment and retention and productivity, where far fewer employers thought the impact of the extension would be positive compared to the impact of the current right. For the perceived impact on recruitment and retention, employers on balance became more neutral, whereas for the impact on employee relations and productivity, employees on balance became more negative. However, to put this in context, the majority of employers still thought the likely impact of the extension for all measures would be neutral rather than negative.
.
112
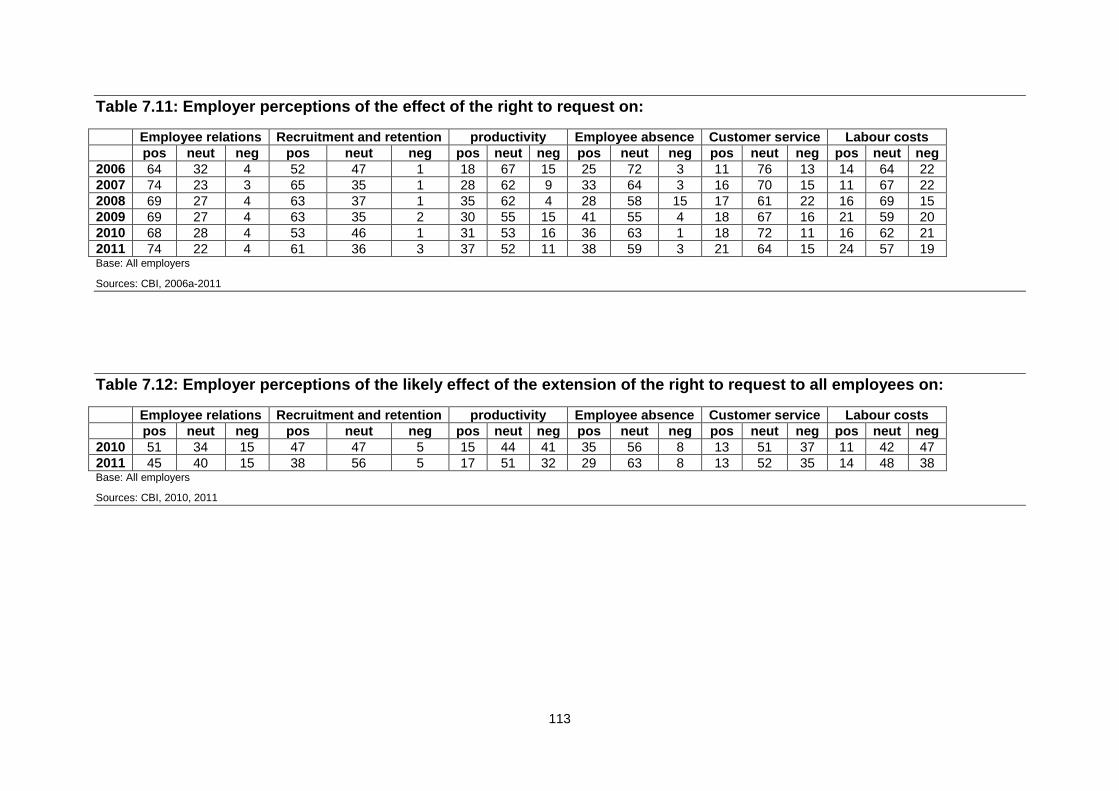
Table 7.11: Employer perceptions of the effect of the right to request on:
Employee relations Recruitment and retention productivity Employee absence Customer service Labour costs pos neut neg pos neut neg pos neut neg pos neut neg pos neut neg pos neut neg
2006 64 32 4 52 47 1 18 67 15 25 72 3 11 76 13 14 64 22 2007 74 23 3 65 35 1 28 62 9 33 64 3 16 70 15 11 67 22 2008 69 27 4 63 37 1 35 62 4 28 58 15 17 61 22 16 69 15 2009 69 27 4 63 35 2 30 55 15 41 55 4 18 67 16 21 59 20 2010 68 28 4 53 46 1 31 53 16 36 63 1 18 72 11 16 62 21 2011 74 22 4 61 36 3 37 52 11 38 59 3 21 64 15 24 57 19 Base: All employers
Sources: CBI, 2006a-2011
Table 7.12: Employer perceptions of the likely effect of the extension of the right to request to all employees on:
Employee relations Recruitment and retention productivity Employee absence Customer service Labour costs pos neut neg pos neut neg pos neut neg pos neut neg pos neut neg pos neut neg
2010 51 34 15 47 47 5 15 44 41 35 56 8 13 51 37 11 42 47 2011 45 40 15 38 56 5 17 51 32 29 63 8 13 52 35 14 48 38 Base: All employers
Sources: CBI, 2010, 2011
113

The Walsh review of extending the right to request to older children also reported the views of stakeholders at that time about extending the Right to all employees (Walsh, 2008). A range of views were reported including employers (particularly SMEs) who said that such an extension would lead to more requests overall so that they would have to turn some down, resulting in the ‘burden’ of having to decide how to prioritise requests. Other stakeholders (generally larger employers, plus the CIPD and TUC) argued that it is preferable to extend the Right to all employees because a) restricted entitlement can be divisive and cause resentment among other colleagues, and b) an ‘open to all’ approach is the best way to deliver the business benefits of flexibility.
Summary
A number of surveys conducted shortly after the implementation of the right to request asked employers about experienced and anticipated problems complying with the legislation. The findings show that few perceived there to be significant problems, although smaller employers tended to be more concerned and more likely to see costs as an issue. The most common concerns reported included finding workable solutions to flexible working requests, managing employee expectations and demonstrating fairness across employees. Surveys examining the reasons employers have given for declining requests suggest that the most common reasons are related to an inability to organise the work amongst existing staff and an inability to meet customer demand.
Surveys asking employers about the impact of the right to request overall on their business have tended to show either a small or a neutral impact. When asked about the effects on specific elements of their business, employers are on balance strongly positive about the effects on employee relations and recruitment and retention, slightly positive on balance about the effects on productivity and absence rates, and neutral on balance about the effects on customer service and labour costs. Employers are more negative about the perceived effect of the proposed extension of the Right to all employees, particularly for productivity, customer service and labour costs.
7.4 Impact of the right to request on gender equality
One of the key themes in the literature on the right to request flexible working has been its implications for gender equality. This material is briefly assessed here. Assessments of the effects of the Right on gender equality have focused on:
• gender disparities in the uptake of requests for flexible working • effects on the gender pay gap • access to flexible working in senior positions
Gender parity in the uptake of flexibility
The right to request flexible working legislation in Great Britain allows for a wider range of flexibility, compared to similar legislation in other countries, including reduced hours, flexitime, compressed working weeks, annualised hours, job-sharing and working from home. This contrasts with the narrow focus on part-
114

time working in most other countries with similar legislation (Hegewisch, 2009). Unlike part-time work, options such as flexitime and compressed weeks do not affect earnings and are thus potentially more attractive to higher earners, many of whom are men. The legislation thus has the potential to widen men’s uptake of flexible working.
However, the data presented earlier (Section 7.2) on the gender balance in take-up of flexible working show that women are more likely than men to make a request for flexible working, as are parents compared to non-parents, and mothers compared to fathers. This gender balance has changed little over time, despite the increase in the total level of requests between 2006 and 2011. The balance in terms of parental status has also remained unchanged. Men make requests at about three fifths of the rate that women do, while non-parents make requests at about 70 per cent of the rate of parents. Parenthood has little impact on men’s propensity to request flexible working whereas it has a large impact on women’s propensity (Hooker et al, 2007).67 Earlier data (Holt and Grainger, 2005) also show that when men do make requests, they are more likely than women to request options such as flexitime (in 2005, 28 per cent of men making requests and 19 per cent of women making requests requested this), which have less impact on their pay, while women are more likely than men to request part-time work (in 2005, 30 per cent of women making requests and 18 per cent of men making requests requested this type of work pattern). More recent data is not available on the breakdown by gender for different types of request, to check whether this has changed over time.
Analysis of the 2004 CIPD employee survey sheds some light on the gender disparity in making requests. It shows that the main reason for requesting flexible working arrangements among all employees (male and female) is related to family/home life: 61 per cent of those making requests cited either childcare, achieving a better balance between work and home life or spending more time with family as their main reason for making a request (CIPD, 2004). There is little variation here by gender – 64 per cent of women and 57 per cent of men gave one of these three reasons as their main reason. However, within this broader category there is some gender variation; women were much more likely to cite childcare (38 per cent of women compared to 17 per cent of men making a request), while men were more likely to cite improving their work-home balance (22 per cent of men compared to 14 per cent of women making a request) or spending more time with their family (18 per cent of men compared to 12 per cent of women making a request). One interpretation of these figures is that while women are making requests in order to undertake the primary care for children (which is more likely to require part-time or reduced hours), men are more likely to be making requests in order to undertake additional caring responsibilities (which may be more compatible with changing the arrangement of hours – e.g. flexitime - rather than a reduction in hours overall).
67 The absence of a combined breakdown by gender and parental status in the most recent WLB4 survey data means that it is not possible to check whether this situation has changed over time.
115

The 2006 WLB employee survey did not ask respondents why they made a request but did ask why they worked flexibly. Seventy percent indicated it was for personal reasons including having more free time, more time with family, study or health reasons, reduces travel time and costs, costs of childcare. Thirty per cent said they worked flexibly for business reasons including demands of employer and job, nature of job and type of work.
While men are less likely to make flexible working requests, the evidence shows that they are also less likely to have their requests accepted. This disparity has persisted over time, and is still evident in the 4th WLB survey data from 2011, where only 10 per cent of women have their requests declined compared with 18 per cent of men. This could be because men request flexibility for different reasons (e.g. non childcare related) or because they are more likely to work in workplaces where flexible work is uncommon (particularly in manual work) (Hegewisch, 2009). A CIPD (2004) survey of employees showed that having no access to flexible working practices was most likely among operatives/elementary occupations (where 30 per cent of employees stated that they had no access) and skilled trades (where 25 per cent had no access), compared to 19 per cent of all workers. Skilled trades have a much higher proportion of men among the workforce than women. Hooker et al (2007) suggest that the higher refusal rates for men could be because men are more likely to be in full-time, non-flexible jobs, which also see the highest rates of refusal. (These are not mutually exclusive explanations.)
The gender disparity in requests for flexible working is part of the reason for the Government’s planned extension of the right to request to all employees. Its Consultation on Modern Workplaces states that the existing legislation may have inadvertently reinforced the association of flexible working with mothers, by restricting the right to request to parents and carers, and that making flexible working a mainstream practice will remove this interpretation and encourage more fathers to use it, thus potentially enabling a greater sharing of childcare responsibilities (BIS, 2011a).
Gender pay gap
The legislation on the right to request flexible working has the potential to challenge the gender pay gap, since the gap is at least partly explained by occupational segregation in the labour market, which is exacerbated by the lack of flexibility in senior positions (given that women continue to provide the majority of unpaid care within the family). The limited availability of flexible working in senior positions means that women returning to work following maternity may have to switch to lower paid jobs if they want to reduce their hours, thus resulting in downward occupational mobility. Thus there are many women in the labour market working ‘below their potential’ (DWP, 2009; Holmes et al, 2007). The right to request flexible working has the potential to challenge this, by breaking down the barriers to the availability of higher-level jobs on a part-time basis, thus enabling higher paid women to continue in their jobs following childbirth. This should have implications for the gender pay gap, since much of this gap is explained by women working part-time in lower-paid occupations (Manning and Petrongolo, 2008; TUC, 2008).
116

A study by the TUC (2008) looking at the gender pay gap over time shows a slight improvement between 1997 and 2007, with the full-time gender pay gap (i.e. the gap between women’s and men’s full-time pay) falling from 20.7 per cent to 17.2 per cent, and the part-time gender pay gap (i.e. the gap between women’s part-time and men’s full-time pay) falling from 41.9 per cent to 35.6 per cent.68 However, the part-time gender pay gap in 2007 was still almost double the full-time gender pay gap, suggesting that the disparity in pay between part-time and full-time positions is changing little, while the gender segregation between such jobs is changing somewhat. These findings are consistent with the expected impact of the right to request legislation. The legislation has the potential to enable more highly paid women to keep their jobs with the onset of family responsibilities (by requesting flexible working arrangements) which should result in positive improvements in the full-time gender pay gap. The legislation would not be expected to have an impact on the gap between full-time and part-time pay overall, thus the part-time gender pay gap (i.e. the gap between women’s part-time and men’s full-time pay) would not be expected to change.
Some confirmation of this explanation for changes in the full-time gender pay gap is provided by the Maternity and Paternity Rights surveys (Smeaton and Marsh, 2006; Chanfreau et al, 2011). This data shows that there has been a decreasing proportion of women who return to work after maternity leave changing their employer. Changing employer after childbirth has been previously shown to be the main route by which downward occupational mobility occurs for women (Smeaton and Marsh, 2006). In the 2005 survey (Smeaton and Marsh, 2006), it is reported that the proportion of women returning to work who leave their pre-birth employer fell from 41 per cent of all those returning in 2002 to 20 per cent in 2005. The main reasons given by those women who changed employer in 2005 were in order to work fewer or more flexible hours. Downward occupational mobility for those who left their employer was most likely to occur for managers and associate professionals (around two thirds and half of whom, respectively, experienced this) as compared to professionals and administrative/ secretarial employees (around a fifth and almost a third of whom, respectively, experienced this).69 In later surveys, the proportion of women returners who left their employer fell to 14 per cent in the 2007 survey (for mothers who took maternity leave in 2006) and stood at 16 per cent in 2009/10 (for mothers who took maternity leave in 2008) (Chanfreau et al, 2011).
These findings suggest that the main reduction in the proportions of returning mothers leaving their pre-birth employer happened between 2002 and 2007, which could be consistent with this change being related to the introduction of the right to request flexible working. Indeed Smeaton and Marsh (2006) suggest this as one of the reasons for the reduction that they report between 2002 and 2005. The decrease in the proportion of mothers leaving their employer between 2002 and 2007 is consistent with data presented earlier (Section 7.1) which showed that take-up of part-time working also increased between 2003 and 2006, from 28 per cent of all employees (who have this option available to them) in 2003, to 38
68 This is calculated from the Annual Survey of Hours and Earnings, based on mean hourly pay. 69 The report notes that this analysis should be treated as indicative only as the raw numbers are small.
117

per cent in 2006 (it then remained stable at 40 per cent in 2011). The level of requests for flexible working, on the other hand, remained stable between 2003 and 2006 (at 17 per cent of all employees) but then rose slightly between 2006 and 2011 to 22 per cent, which was mainly due to an increase in employees asking for a change to when they worked rather than the number of hours worked (Stevens et al, 2004; Hooker et al, 2007; Tipping et al, 2011).
In conclusion, it is difficult to make any firm claims about the relationship between the introduction of the right to request flexible working legislation and reductions in women’s downward occupational mobility following childbirth, and no studies have been found that attempt to assess this systematically. However it can be said that a reduction in the proportion of returning mothers leaving their employer has occurred in the period since the Right came in. The full-time gender pay gap has also decreased (albeit measured over a somewhat longer period, since 1997). It is possible that the legislation is one among a number of factors affecting this change.
Flexible working in senior positions
The availability of flexible working in senior positions has been said to be essential for improving the gender pay gap by reducing the number of women working ‘below their potential’ due to the lack of quality part-time or flexible work. However evidence shows that flexible working is less likely to be available, and to be taken up, by those in managerial positions.
In terms of availability, the CBI’s Employment Trends 2007 survey reported that although 91 per cent of workplaces offered part-time working to at least some staff, only just over half (52 per cent) offered it to staff at supervisory level or above (CBI, 2007). The 3rd Work-Life Balance employer survey (Hayward et al, 2007) also showed that managerial employees were the group most likely to have restrictions placed upon them in relation to using flexible working time arrangements. For example, 24 per cent of workplaces that placed restrictions said they would restrict part-time working for managers, compared to 3 per cent who said they would restrict it for non-managers. The equivalent figures for job share were 21 per cent for managers and 7 per cent for non-managers. The one form of flexible working that was more likely to be restricted for non-managerial than for managerial employees was working from home; 6 per cent of those with restrictions said that this would be restricted for managers, while 16 per cent said it would be restricted for non-managers. Hegewisch (2009) notes that the types of flexible working arrangement more likely to be available to managers and professionals (such as flexitime, teleworking and compressed hours) are generally those which do not decrease the total number of hours worked.
Data also show a consistently lower rate of requests for flexible working among managers. Notwithstanding slight variations in the occupational categories used, both the Flexible Working and WLB employee surveys show the highest level of requests among service and sales occupations and administrative and secretarial occupations, and the lowest level of requests among managers and professionals (or managers and senior officials), operative and unskilled occupations and skilled trades. In 2011, the level of requests among managers and professionals was 22 per cent (compared to 26 per cent among ‘intermediate
118

occupations’ and 22 per cent among ‘routine and manual’ occupations) (Tipping et al, 2011). The level of requests among managers and professionals appears to have increased from the 16 per cent reported in the 3rd WLB survey undertaken in 2006 (Hooker et al, 2007).
Shedding light on the reasons for a lack of uptake of flexible working among managers, the 2004 CIPD employee survey reported that managers, senior officials and professionals were more likely than other groups of staff to cite a lack of flexibility in the type of work they do as a reason for not making a request, while other groups with low request rates, such as operatives and those in elementary occupations, were more likely to say that this was because their employer does not allow flexible working (CIPD, 2004).
The CBI Employment Trends survey in 2008 (CBI, 2008) broke down the levels of flexible working take-up across different managerial grades, showing that 21 per cent of operational staff, 11 per cent of supervisors, 13 per cent of middle managers and 15 per cent of senior managers worked flexibly. This suggests that barriers to working flexibly are notable among more middle level managerial and supervisory staff, as well as among senior managers. This is supported by qualitative studies which reveal extremely limited flexibility for supervisory staff in the hospitality industries where full-time hours and set shift patterns are almost always required (Tomlinson, 2006). This poses barriers to career progression for women with children in these industries and thus also has implications for gender equality in pay.
Summary
There is a persistent gender disparity in the level of requests for flexible working, which remains in the most recent (2011) data, which shows that men make requests at about three fifths the rate of women. Parents are also more likely than non-parents to make requests, but this is primarily due to an increased level of requests among mothers rather than fathers. Recent data does not explore this, but earlier data (from 2005) shows that men are less likely than women to request part-time work and more likely to request flexitime or other types of work that do not involve a reduction in hours (and thus pay). Findings on the reasons for requests suggest that this may be because women are making requests to undertake the primary care of children, while men are more likely to make requests to undertake additional care. A greater share of men’s requests is also for non-childcare reasons.
Over the period from 1997 to 2007 the gender pay gap for full-time jobs has fallen slightly from 21 to 17 per cent. The gap between women’s part-time and men’s full-time pay has also narrowed slightly from 42 per cent to 36 per cent. This is consistent with the change being related to the right to request legislation, which would be expected to impact on gender disparities in full-time pay (by allowing women to stay in better paid full-time jobs) but not to impact on the overall disparity between full and part-time pay. Findings from the Maternity and Paternity Rights surveys provide further evidence of changes in gender equality measures, showing that the proportion of returning women leaving their employer following childbirth has fallen substantially. This is important because this has been identified as one of the main routes for women’s downward occupational
119
mobility. This change mainly occurred between 2002 and 2007 and then flattened out. It is impossible to say from the evidence available whether this change is related to the right to request legislation, but it is at least consistent with this thesis.
The availability of flexible working in senior positions is relevant to assessments of gender equality because it can reduce the number of women working ‘below their potential’ due to the lack of quality part-time or flexible work. The evidence shows that flexible working time options are more likely to be restricted for managers than for other groups of staff, particularly part-time, job share and compressed hours options. Working at home is less likely to be restricted for managers than for other groups of staff. This reflects the fact that managers are more likely to be ineligible for flexible working options that reduce their overall number of hours. Survey data also show that managers and professionals are also one of the least likely groups to make a request for flexible working, alongside workers in routine and manual occupations. However the level of requests among managers and professionals has risen between 2006 and 2011, from 16 per cent to 22 per cent, as part of the general rise in level of requests seen over this period. Some survey data on the reasons for employees not taking up flexible working show that managers and professionals are more likely to say that this is because the job is not compatible with flexible working rather than that it is not available to them, which is more frequently cited by other groups with low levels of requests such as elementary occupations.
7.5 Impact of the right to request flexibility overview The original research question sought to examine the impact of the right to request flexible working legislation on the availability and take-up of flexible working, by examining the existing literature that had been published on this subject. The review found no studies that assessed the impact of the legislation in this way. Instead the review question was widened to examine the evidence on take-up and availability in general, and the existing literature on the broader effects of the legislation on employers and employees. The review uncovered evidence on:
• trends in the availability and take-up of flexible working, the number of requests made to work flexibly and the outcome of the requests
• implementation issues including workforce coverage, employee awareness, the way requests are made and how agreements are reached
• perceived effects of the legislation on employers, including problems encountered, and perceived impact on different business aspects
• one review that examined the effects of the legislation on gender equality; this drew on data about gender disparities in take-up of flexible working requests, the gender pay gap and women’s downward occupational mobility following childbirth and the lack of flexibility for women in senior positions
120

The review found that there has been a substantial increase in the availability of all forms of flexible working in the period since 2003, although take-up does not seem to have kept pace with this. While there has been an increase in the proportion of workplaces that have seen some take-up of flexible working as a proportion of all eligible employees (between 2003 and 2007), take-up of most individual forms of flexible working has declined between 2003 and 2011, although some caution should be applied to this finding because of changes in survey methodology. The level of requests stayed stable between 2003 and 2006 and then rose slightly in 2011. It is possible that this increase is related to the widening of the eligibility for the right to request in 2009 (to parents of all children up to the age of 17). However the nature of the published data makes it difficult to investigate this further. The rate of requests among parents compared to non-parents has remained the same over time, while the absence of a breakdown by age of child in the most recent data prevent a comparison of whether the balance of requests has shifted from parents of younger towards parents of older children.
Given that data on how requests are made shows that around three quarters are made informally (i.e. not in writing), and this has remained stable over time, it seems that usage of the formal right to request constitutes only a very small part of overall request-making at any given time in any case, raising doubts over whether any increase in the level of requests is an effect of the legislation itself. The legislation may of course have helped to raise the profile of flexible working generally, which has resulted in an increase in the rate of requests. Certainly awareness of the Right has increased fairly dramatically over time, which would be consistent with this. Acceptance rates of requests for flexible working are high, at over 75 per cent, and have remained high with the increase in requests seen in the latest data.
The acceptance of requests is consistently higher for women and for parents compared to men and non-parents. It is not clear whether this disparity in favour of parents has any relationship to the legislation. This explanation was considered in the analysis of the 3rd WLB and 2nd Flexible Working surveys (2006 and 2005 respectively), when the right was available only to parents of a child under 6. These analyses did not show a significant difference in acceptance rates for those parents with legal eligibility compared to those without.
As noted, use of the formal procedure for making a request, which is set out in statute, seems low, given that the vast majority say that they do not make their request in writing. CBI data suggests that there has been a shift away from informal towards formal agreements to flexible working requests over time, albeit less so for carers than for parents. More robust data is not available from the WLB surveys to confirm this finding. There is limited evidence available on whether using the formal right, as compared to an informal agreement, has advantages or disadvantages for employers and employees. Case study evidence suggests that ‘informal’ negotiations around flexible working, to consider how the employees’ needs can be successfully accommodated by the business, are likely to be most successful. Otherwise there is an absence of detailed evidence about the pros and cons of using the legal right.
121

Data on employer perceptions show that there have been very few problems in implementing the legislation and that employers broadly see the overall effects of the Right as positive or neutral on various aspects of their business. They are notably less positive about the anticipated effects of the proposed extension of the Right to all employees, although overall still more employers are positive than negative.
Over the time that the right to request has been on the statute books, the evidence shows that the proportion of women returning to work from maternity leave who leave their employer (which is a good indicator of downward occupational mobility) has reduced. There has also been a slight narrowing of the gender pay gap over a comparable period. This is consistent with the expected direction of any effects of the legislation, although it is not possible to say from the evidence available what role the legislation has played in this.
Evidence gaps
• Figures on the take-up/usage of the actual legislative right to request (as opposed to any other means of making a request), including who uses it (personal characteristics) and what the outcomes are (compared to other types of request-making).
• Direct perception data from employers and employees about the role the legislation plays in their behaviour (making requests, deciding on requests)
• Evidence on the pros and cons of using the legislative process for making requests
• Tracking of employment outcomes for those who have had requests accepted and declined
122

8. Summary of findings
and gaps in evidence Reflecting the structure of the report, this summary chapter divides the business impact evidence according to the benefits and then the costs. This division is also a reflection of the literature, which also tends to focus on one or the other of the cost-benefit divide. There are very few studies which undertake cost-benefit analyses, weighing the relative costs and benefits of particular policies within a common analytical framework. The few exceptions, presented in section 6.1, are survey-based assessments which draw on employers’ perceptions of the relative balance but do not attempt to quantify the overall gains (or losses). The absence of detailed, firm-level, cost-benefit analyses are one of the main gaps in evidence identified during the literature review.
Following the review of the benefits and costs evidence, the chapter continues with a summary of sources of evidence on the impact of the right to request flexible working legislation on availability and take-up. The chapter ends with a final summary of the gaps in evidence, pointing toward a future programme of research.
8.1 Summarising the benefits evidence – flexible working Generally speaking, the case study evidence tends to support a positive business gains position in relation to all the outcomes of interest. These studies are useful in highlighting the potential scale and scope for flexibility to benefit businesses, but questions remain as to how far the findings can be generalised to other business contexts. Primary survey and econometric evidence, based on larger samples of businesses, is typically more mixed.
Productivity
Most primary, survey-based research supports a productivity benefits hypothesis. Case study evidence overwhelmingly presents findings in support of a positive association between flexible working opportunities and productivity/performance gains, but there are concerns about the sampling frames used and the selection of good practice employers. Econometric studies are somewhat more mixed, but where an index of flexibility is used i.e. a ‘bundling’ approach, findings are usually positive, suggesting the value of a strategic approach to flexibility by means of a comprehensive provision of both flexible working and family-friendly initiatives.
123
Absences
The overall balance of evidence relating to impacts on absence rates would suggest that flexible working arrangements can effectively reduce absence. Case study and primary survey research evidence point in the direction of business benefits, with reduced levels of absence associated with the introduction of flexible working practices.
The econometric evidence is a little more mixed but, overall, findings suggest that homeworking lowers absence rates. Findings relating to flexitime are divided and indicate either positive or neutral benefits. Part-time working evidence is the least clear with studies indicating neutrality, significantly positive and significantly negative outcomes. There is no evidence to suggest that compressed working weeks are associated with improvements in absenteeism with one study suggesting that shorter, more intensive working weeks may increase sickness absence.
The mixed messages associated with part-time working warrant further research in order to explore potential interaction effects. Opportunities to work from home, which appear to depress absenteeism, are most widespread among men, the well educated and those working in higher grade professional and managerial occupations (Felstead et al, 2000, 2002, Philpott, 2006). By contrast, part-time hours are concentrated among women, older workers and younger workers entering the labour market. Part-time working can be found across the occupational spectrum but is often associated with lower pro rata pay. The impact of reduced hours on absences is therefore likely to be influenced by a number of other factors such as occupational group. Further research is therefore needed in order to better understand the diversity of findings.
Recruitment
Overall, there is far less evidence relating to the recruitment benefits70 that employers may reap when introducing flexible working policies compared with other benefits such as productivity or staff turnover. In terms of econometric studies, this in particular remains a gap in the evidence base.
Summarising the findings, a variety of sources of evidence have been identified, including employer surveys, employee surveys, one case study and one econometric study.
The econometric study suggested no significant association between flexible working and recruitment gains, the single case study, by contrast, indicated improved recruitment but is highly context dependent. Evidence from employees suggests that the majority are attracted to jobs by flexible working opportunities and that a lack of flexibility accounts for a considerable amount of under-employment. Evidence from employer surveys also suggests recruitment advantages, somewhat under half in one survey agreed that flexibility helps recruitment, a figure that rises to four-fifths in another survey.
70 For example, if flexible working opportunities are in increased demand, their provision can be expected to improve the effectiveness of recruitment drives among businesses.
124

The evidence base in this area would benefit from further research based on rigorous methods that are able to assess change over time, associated with a change in policy. The employer surveys are based on managers’ impressions which may not accurately reflect the power of flexible working opportunities to broaden the potential recruitment pool. More persuasive are employee surveys which identify the specific working arrangements which individuals seek and prioritise when searching for a job. On the basis of the latter, flexible working arrangements would seem to improve the scope for recruitment.
Retention
The evidence suggests that flexible working can improve staff retention. Findings from five case studies point to flexible working as having helped with staff retention, leading in some cases to very significant savings in turnover costs. Primary survey evidence also found considerable support for the suggestion that flexible working promotes staff retention with survey findings ranging from two-fifths to three-fifths of employers agreeing that turnover is reduced.
The econometric evidence suggests that some flexible working arrangements are a benefit to businesses. A European study found that flexible hours were significantly associated with enhanced retention although homeworking was not significant. Two British WERS-based71 studies produced very different findings with one suggesting that improved retention was associated with homeworking, flexi-time and compressed working weeks. The other, by contrast, found no significant associations between retention and any of the flexible working arrangements. The difference in findings from a common source of data can be explained by the different measures used. The first relied on managers’ perceptions of whether their company was above or below their industry average, while the second used an objective measure of retention – the ratio of the total number of leavers during the last 12 months to employees in employment.
Overall, there is a need for further research based on large samples to better understand and account for the diversity of econometric findings, ideally using panel evidence that can measure change associated with the introduction of flexible working policies.
8.2 Summarising the benefits evidence – maternity, paternity and parental leave, family leave and other childcare support
It should be noted that the impact of family-friendly policies, which apply specifically to parents at particular points in their lives, are less likely to lead to measurable business benefits compared with the potential impacts of flexible working policies which could be used by all staff throughout their working lives. Family-friendly arrangements are used by smaller numbers of staff for relatively short periods of time, so sample sizes are such that statistically significant impacts are less likely to emerge. Sample sizes are further reduced in relation to
71 Workplace Employment Relations Study.
125

workplace nurseries and financial help for childcare the incidence of which is very low.
Productivity
All the evidence gathered on productivity was based on econometric methods. Many of the family-friendly polices under investigation were found to be insignificantly related to productivity outcomes, and there was little consistency in the statistically significant findings that were found. It isn’t possible, therefore, to definitively claim that positive business outcomes are associated with specific policies. For example, one study found that onsite childcare significantly improved productivity but two further studies found no significant association. Similarly inconsistent findings are evident for paternity leave, parental leave and paid time off for emergencies.
Two studies found negative impacts on subjective measures of business productivity or performance (managers’ perceptions), the first in relation to paid leave for emergencies and paid time off for childcare, the second in relation to workplace nurseries and paternity leave.
This degree of variance in findings reflects the different datasets used (based in UK, Australia and across the OECD), different modelling approaches, different measures used and, in some cases, sample size limitations leading to non-robust findings.
Broadly speaking, family-friendly policies may benefit businesses but the evidence encountered to date fails to provide sufficient evidence to definitively support this argument; indeed the literature to date appears more likely to suggest that there is no effect on business performance.
Absences
Anecdotal, case study evidence suggests that a range of family-friendly policies can either reduce absence rates or, if formalised, better enable employers to prepare for, and therefore manage, absences.
Among the econometric studies there is evidence to suggest that family/parental leave polices significantly reduce rates of absenteeism, with others suggesting neutrality. Evidence also points to the presence of workplace nurseries depressing absence levels (with two studies suggesting significant reductions and two studies neutrality).
The findings relating to paid time off for childcare at short notice is less clear with one study suggesting a significant decline in absence rates while two other studies produce insignificant or ‘neutral’ results.
As discussed above, encountering studies with a lot of insignificant results is not unexpected due to the low incidence and usage rates of many of the family-friendly policies of interest. Sample size issues therefore arise.
126

Overall, however, it would appear that various family-friendly policies can benefit employers in relation to absence control and management.
Labour market participation
A wide body of international research highlights the significance of paid maternity and parental leave in promoting the active labour market engagement of mothers. If maternity leave is too short, women will break their employment rather than return to work while their children are very young. Having adequate duration of paid leave combined with the possibility of returning to the same employer is a strong incentive to return to work and has pushed up the labour market participation rates of mothers.
Retention
There is considerable evidence in the UK and the USA highlighting the impact of maternity leave, maternity pay and job protection legislation on labour market participation and job retention among mothers. The proportion of mothers returning to the same employer (based on GB figures) has increased between 1988 and 2010, from 75 per cent to 84 per cent. The benefits to employers in terms of retaining staff are therefore considerable. Overall, retention rates of mothers who have taken maternity leave are high.
Onsite childcare does not appear to promote retention, but usage is low, raising the possibility that models are less likely to detect significance compared with studies investigating other family-friendly measures. Notably few studies have been encountered looking at the relationship between workplace nurseries and retention rates though, and this would appear to be a gap in the evidence base.
8.3 Summarising the benefits evidence – the mediating relationships
In order to understand how and why WLB policies might lead to positive business outcomes, a conceptual scheme, reflecting the diverse body of research literature, has been presented. This demonstrates the series of links from WLB policies to improved experiences at the work/family interface in terms of positive or negative spillover effects, leading in turn to positive affective outcomes in relation to commitment, satisfaction, engagement and, finally, to work effort, productivity and other bottom line outcomes such as absenteeism, turnover and performance. The affective characteristics are the intervening variables which mediate between WLB policies and bottom line business outcomes. In this section the literature on the intervening elements of the chain is summarised.
The WLB to work family conflict/enrichment link
The time and energy commitments associated with paid working lives can come into conflict with family demands or other non-work interests or responsibilities. These work and non-work spheres can complement each other and lead to a rewarding and fulfilling life. Alternatively, they can be perceived as in conflict, potentially leading to negative mood, behaviour or health outcomes. The
127

research evidence suggests that both flexible working opportunities and informal family-friendly workplace cultures can mitigate the experience of conflict at the home/work interface, helping to promote an ‘enriched’ life.
The WLB or work family conflict/enrichment to affective outcomes link
Our search points to a wide evidence base suggesting that flexible working, family-friendly cultures and work/family enrichment is associated with a range of positive affective outcomes including: higher levels of job satisfaction, morale and organisational commitment, greater effort and less stress and work strain.
The affective outcomes or work family conflict/enrichment to business outcomes link
The final link of the conceptual ‘WLB to business benefits’ chain is based on a large body of evidence which demonstrates that affective outcomes at the level of the individual, including job commitment, ‘happiness’, satisfaction, engagement and, in turn, discretionary effort, are all associated with business benefits such as reduced leaving intentions, fewer absences, less tardiness and improvements to performance and productivity. These positive outcomes translate into improved profitability and growth. A key component of this ‘black box’ within which positive attitudes and mood lead to greater efficiency and effort is ‘engagement’. The evidence on ‘engagement’ indicates that achieving high levels of engagement/commitment among a workforce is likely to generate strong and measurable business benefits and that flexible working or other work life balance policies and practices are likely, as part of a portfolio of good employment practices, to engender committed and engaged employees.
8.4 Benefits: an overview Having summarised the findings in relation to the business benefits, this section now explores whether the evidence has generated clear cut answers to the two additional research questions which were set out in chapter 3.
Question1: Weighing up the evidence from a wide range of sources, is the ‘business case’ proven i.e. are there measurable benefits to businesses which outweigh costs?
The current evidence base does not provide a clear cut answer to this question because, apart from government impact assessments which have gauged the marginal impacts of modifications to Right to Request Flexible Working legislation, Additional Paternity Leave and Pay regulations and the 2002 Employment Act, no research has been encountered that has undertaken detailed cost benefit analyses at the level of the firm. There is a large and growing body of evidence which demonstrates a wide range of benefits that accrue to employers who adopt various WLB measures. On the whole, the measures would appear to have the strongest impact when used together as part of a strategic commitment to promoting WLB through a variety of means. When examined separately, the links between all the different flexible working and
128

family-friendly policies and each of the outcomes investigated (productivity, absences, retention and recruitment) are less clear cut. Several surveys have asked employers whether they believe their WLB policies outweigh the costs and this evidence base points toward either business gains or, more often, neutrality. In the absence of comprehensive and objective cost data at the level of individual businesses, there is insufficient evidence definitively to prove the ‘business case’ for WLB policies.
Question 2: Do benefits differ according to firm size, staff demographic or industrial sector?
A number of studies have highlighted the extent to which different business contexts are likely to influence the scale of costs and benefits associated with work life balance policies but too few studies have disaggregated their findings by industrial sector or firm size to enable firm conclusions to be reached. Many of the WERS-based studies have restricted their analyses to the private sector only, and a few have differentiated findings by size, but these are too few to generate any conclusions. One American study found that bundles of WLB policies were significantly associated with productivity but only in businesses with a higher proportion of female employees and in businesses with a higher proportion of professional workers. The third work life balance survey found that flexible working was associated with improved retention among female staff. More research that disaggregates findings is needed to develop this evidence base further.
8.5 Summarising the costs evidence
Weighing costs against benefits
Survey evidence that elicits managers’ perceptions of the balance between the costs and benefits of WLB policies finds little support for the view that costs outstrip benefits. Findings from one nationally representative sample of businesses in the UK suggest instead that, on the whole, costs and benefits are evenly balanced, while an American study of the voluntary sector indicates that benefits outstrip costs. Several impact assessments have also been reviewed, relating to extensions of the right to request flexible working, Additional Paternity Leave and Pay and leave entitlements set out in the Employment Act (2002). These assessments break down the various cost and benefit components and conclude, in each study, that the benefits outweigh the costs. The calculations are based on a broad range of assumptions and tend to rely on employer surveys to gauge benefits. Little more cost benefit analysis evidence was encountered and this is a significant gap in the WLB literature.
Commentaries on the cost benefit issue highlight the difficulties of generalising findings, emphasising that the relative costs and benefits to businesses associated with introducing WLB initiatives will be context specific, depending on the demographic make-up of the workforce and the size and industry of the business. Economic cycles are also likely to affect the relative costs and benefits of particular measures. Calculations are further complicated by the need to take
129

account of a number of cost types, including one off implementation costs, ongoing administrative costs and the costs of accommodating various measures.
Survey and case study evidence has highlighted a number of specific challenges associated with WLB policies, in particular; part time hours in the nursing and police sectors due to the culture of their working practices; the difficulty of finding suitable cover while staff are on maternity or parental leave, most notably where highly specialised skills are involved, the perceived incompatibility of flexi-time with operational requirements in many business contexts and, finally, the particular problems faced by small businesses who experience a range of work life balance measures as more burdensome.
Implementation costs
As is the case with much of the costs evidence base, the range and depth of data available is fairly limited. Employer survey evidence indicates that the majority of businesses believe implementing flexible working arrangements is unproblematic and incurs very few costs. Implementation costs are therefore, generally, not seen as a barrier to flexibility.
A number of administrative burdens measurement exercises and regulatory impact assessments have estimated the national level costs associated with introducing new WLB regulations, both flexible working and family-friendly, but these figures are not readily translated into individual business level costs.
Procedural / administrative costs
In terms of administrative costs, most of the evidence available is from administrative burdens measurement exercises and impact assessments. Data is often presented at an aggregated, national level but some unit cost and costs per organisation and per request are presented in relation to requests for flexible working. Data relating to both flexible working and family-friendly regulations is available.
The costs per request for flexibility (estimated at £88 by BERR (2008) and £62 by BIS (2010a)72) do not appear to be high, but whether the cost of requests or appeals are perceived as high or low will depend on the number of requests received, how tight profit margins are within specific business contexts and whether the costs are perceived as lower than actual or potential benefits.
Survey evidence suggests that the majority of employers do not experience the administration of flexible working as a ‘burden’ although one-fifth did. This ‘burden’ was not quantified, however. No similar evidence exists in terms of the administration of various family-friendly policies, suggesting the need for further research.
72 These estimates are not directly comparable as they are based on disparate methods of calculation.
130

Costs of accommodating requests
In terms of the various costs incurred, the evidence relating to the costs of accommodating WLB provision is the weakest in terms of the volume of published material. This therefore remains a key gap in the evidence base.
One publication, based on nine case studies, highlighted the problems associated with managing absences associated with maternity, paternity, parental and emergency leave. Absence management was largely perceived as unproblematic with two exceptions – where cover was needed for key operational staff and where absences were unexpected and therefore unplanned. Holding jobs open for women on maternity leave was, however, identified as problematic for one-fifth of the businesses sampled for the third work life balance survey – rising to 31 per cent of businesses with fewer than 100 staff.
Three recent impact assessments consider the cost of accommodating requests. These relate to: requests to work flexibly for all employees, the Additional Paternity Leave and Pay regulations (implemented in 2011) and Flexible Parental Leave. BIS (2010a) have estimated that the cost of accommodating a request to work flexibly is, on average, £241.24. The impact of Additional Paternity Leave and Pay regulations on businesses have been estimated at between £2 million and £15 million (BIS, 2010b). This includes costs to employers of covering absence at £0.5 to £10.3 million.
For Flexible Parental Leave, employers will also face an additional direct cost due to having to cover the absence of those fathers who take up these new rights. This additional cost depended on the number of weeks taken as leave and the take-up rate. The costs were estimated to be between 3% and 15% of labour costs and totalled £3m to £32m.
Small businesses are most likely to experience WLB policies as problematic, particularly lengthy maternity leave.
8.6 Costs: an overview Having summarised the findings in relation to the business costs, we return now to the initial research questions, as set out in chapter 3, to determine whether the evidence has generated clear cut answers to each.
Question 1: Does the literature differentiate the various types of cost
Different types of cost are differentiated in the literature but the depth of detail is not great, apart from the government impact assessments. Indeed a firm conclusion would be that there is a significant gap in the evidence base relating to the costs of WLB policies.
Question 2: Does the literature quantify these costs
Most evidence would suggest that while employers may have a general perception of the type of costs incurred and whether the costs outweigh the benefits, detailed records are not maintained which would allow a thorough
131

evaluation of cost/benefit ratios. Several studies which were designed specifically to gather evidence of, and quantify, the costs of work life balance policies failed to do so due either to a dearth of information or a lack of co-operation. The main source of data on costs are therefore estimates derived from impact assessments or the odd piece of cost evidence from single case studies.
Question 3: To what extent do costs differ according to firm size, industrial sector or staff demographic?
This question cannot be answered in full because the studies encountered do not disaggregate their findings by industrial sector or staff demographic. Most evidence is based on nationally aggregated estimates of costs, which do not cover all the WLB policies of interest and do not differentiate their findings by business type.
Several studies have, however, focused on firm size, highlighting the extent to which WLB policies are considerably more burdensome and costly for small businesses which are less able to manage staff absences, often have little time to deal with personnel issues, and cannot benefit from economies of scale or dedicated HR departments.
8.7 Summarising the evidence on the effect of the right to request flexible working legislation on employers and employees
A search of the literature established that there were no studies which specifically assessed the impact of the right to request legislation on availability or take-up. The evidence on take-up and availability in general, and the literature on the broader effects of the legislation on both employers and employees is summarised below.
Availability
Availability of flexible working has increased since 2003, although there are no studies that specifically assess whether this is related to the introduction of the right to request legislation. The availability of all types of flexible working has increased, with particularly large increases in the availability of career breaks and home/teleworking.
Take-up
Although rising, take-up does not appear to be keeping pace with rising availability. The proportion of employers offering each of the different types of flexible working has increased between 2002 and 2011. When take-up is measured in terms of the proportion of all workplaces experiencing employees using the different forms of flexible working, it has increased between 2000 and 2007, apart from in part-time working which remained fairly stable and working from home which fell. When take-up is measured in terms of the proportion of employees using different forms of flexible working where it is available to them, take-up appears to have fallen between 2003 and 2011 for most types of
132

flexibility, except part-time working, though changes in survey methodology mean some caution should be applied to this finding.
Levels and types of requests
The proportion of employees making a request to work flexibly was stable at 17 per cent between 2003 and 2006, but rose to 22 per cent by 2011. There is no employee data available for the intervening period to see when the increase occurred.
The most recent figures from the 4th WLB employee survey show that requests for a change in when hours are worked is more common (35 per cent of all requests made) than requests for reduced/part-time hours (23 per cent of all requests).
Women are more likely than men to make a request for flexible working, as are parents compared to non-parents, and mothers compared to fathers. Finally, requests for flexible working are most common in certain workplaces, including larger workplaces, those in the public sector, those where women predominate, and in industry sectors such as public administration, education and health (where 26 per cent had made a request in the previous 2 years), distribution, retail, hotels and restaurants (23 per cent), transport, storage and communication (24 per cent) and banking, insurance, professional and support services (19 per cent).
Outcomes of requests
Data from employee surveys are the most reliable source for assessing the proportion of employee requests to work flexibly which are successful. There are variations across data sources, but generally acceptance rates are shown to be above 75 per cent of all requests made. The most recent data from the 4th WLB survey shows 79 per cent of requests accepted. There also appears to be a slight downward trend in the proportion of requests declined in the WLB survey data, from 20 to 13 per cent between 2003 and 2011. This is important because it shows that the acceptance rate has remained high, despite an increasing number of requests over time.
The evidence shows that women are more likely to have their requests accepted than men and parents more likely than non-parents. This disparity has persisted over time, and is still evident in the 4th WLB survey data from 2011.
Implementation
CBI survey evidence suggests there has been an increase, between 2007 and 2009, in the proportion of workplaces which have extended the right to request to all staff, up from 50 per cent to 62 per cent. The WLB (2007) survey, however, shows that a much larger proportion of employers (92 per cent) say they will consider a request for flexible working from any member of staff. This may reflect a difference between informal consideration of requests on the one hand, and formally extending the Right (in company policy documents, for example) on the other. CIPD surveys examining implementation showed that around a half in
133
2003 and close to two-thirds of workplaces in 2005 were taking steps to publicise the right to request amongst staff.
Decision making processes
Employee surveys indicate that the majority of requests to work flexibly are made informally through face to face discussions rather than in writing, suggesting that the formal statutory procedure is not being widely used in requests for changes to working patterns. The most recent data from the 4th WLB survey (2011) shows that only a quarter of requests were made in writing (letter, form or email).
Disputes and disagreements
Flexible working cases brought before an employment tribunal are very rare – less than 0.5 per cent of employers had experienced this in 2007 (Hayward et al, 2007). There was a slight upward trend in cases brought for flexible working issues following the extensions of the legislation in 2007 and 2009, but the increase was not substantial.
Effects on employers
A number of surveys conducted shortly after the implementation of the right to request flexible working asked employers about experienced and anticipated problems complying with the legislation. The findings show that few perceived there to be significant problems, although smaller employers tended to be more concerned and more likely to see costs as an issue. The most common concerns reported included finding workable solutions to flexible working requests, managing employee expectations and demonstrating fairness across employees.
Surveys asking employers about the impact of the right to request flexibility overall on their business have tended to show either a small or a neutral impact. When asked about the effects on specific elements of their business, employers are on balance strongly positive about the effects on employee relations and recruitment and retention, slightly positive on balance about the effects on productivity and absence rates, and neutral on balance about the effects on customer service and labour costs. Employers are more negative about the perceived effect of the proposed extension of the right to request flexibility to all employees, particularly for productivity, customer service and labour costs.
8.8 Evidence gaps Pulling together the findings specifically in relation to gaps in evidence, there is a clear need for further research to fill gaps not only in substantive findings but also in terms of methodological approach. These gaps are summarised below.
Methodological
Panel designs needed: A distinct gap in the evidence base relates to the scarcity of rigorous studies based on experimental methods either using randomised assignment or, at least, longitudinal designs, which would allow
134

analyses to move beyond associational findings toward evidence of causal relationships.
Cost-benefit analyses: The absence of detailed, firm level, cost benefit analyses are also one of the main gaps in evidence identified during the literature review. Even in studies which were specifically designed to access this information, the range and depth of data gathered was very limited. Challenges include the absence of detailed records of various cost data at the business level, although awareness and monitoring of productivity, absence and turnover rates are likely to be more widespread. Business confidentiality was also raised as an issue for research in this area. Some analyses have been undertaken within the context of impact assessments but these, inevitably, are at an aggregate rather than firm level and are based on a very broad set of assumptions.
Substantive – Benefits
Focus on take-up: There is a need for more research on the benefits of WLB polices that goes beyond assessing impact resulting from the availability of such policies/practices; to instead looking at the impact of actual take-up. The absence of such studies means we may be underestimating real impact.
Need for objective outcome measures: While there are many studies looking at productivity impacts, very often the measures used are employers’ perceptions of benefits rather than objective business outcomes. More research into the latter would improve the validity of the accumulating evidence base.
Impact of part-time hours on absences: Given the inconsistency of findings relating to the impact on business outcomes of part-time hours in particular (most notably in relation to absences), further research is recommended to better understand how these relationships might differ according to gender, age, occupational group, industry and other factors.
Recruitment benefits: There is also a paucity of research exploring the potential recruitment benefits associated with flexible working.
Onsite childcare and retention: Notably few studies have been encountered looking at the relationship between workplace nurseries and retention rates, and this would warrant further investigation.
Further disaggregation requirements: There are few studies relating to any of the outcomes of interest which fully disaggregate and compare findings according to workforce type, industrial sector and across different size bands.
Substantive – Costs
More costs research needed: There is far less evidence relating to costs compared with the benefits literature. More research exploring cost related issues would therefore be welcome, including implementation and administration costs. Accommodation cost evidence is the weakest in terms of the volume of published material and is therefore a priority in terms of future research needs.
135

Administering family-friendly policies: Survey evidence suggests that the majority of employers do not experience the administration of flexible working as a ‘burden’. No similar evidence exists in terms of the administration of various other family-friendly policies, suggesting the need for further research into the costs of a wide range of family-friendly initiatives.
Change over time
There is some evidence that the impacts of flexible working on productivity and other outcomes may be diminishing over time, and given the increasing prevalence of such opportunities across all business sectors and sizes, diminishing returns might well be expected, but research into this issue is scarce and is among the many gaps in the evidence base.
136

9. References Anderson, S, Coffey, B and Byerly, R. (2002). ‘Formal organizational initiatives and informal workplace practices: links to work–family conflict and job-related outcomes’, Journal of Management, 28, pp. 787–810.
Atkinson, C. and Hall, L (2011) Flexible working and happiness in the NHS. Employee Relations, Vol. 33 No. 2, pp. 88-105
Baltes, B. and Briggs (1999). "Flexible and compressed workweek schedules: a meta-analysis of their effects on work-related criteria." Journal of Applied Psychology 84(4): 496-513
Barber, L, Hayday S and S Bevan (1999), From People to Profits, IES Report 355.
Barnes, H. Smeaton, D. and Taylor, R. (2009) An Ageing Workforce: The Employer's Perspective. Institute for Employment Studies Research Report No. 468. London: IES.
Barrah JL, Schultz KS, Baltes B, Stolz HE. (2004) Men’s and women’s elder-care-based work–family conflict: Antecedents and work-related outcome. Fathering; 2:305–330.
Baruch, Y. (2000). Teleworking: benefits and pitfalls as perceived by professionals and managers. New Technology, Work and Employment, 15(1), 34-49.
Bassanini, Andrea and Danielle Venn. 2008. “The Impact of Labour Market Policies on Productivity in OECD Countries.” International Productivity Monitor 17 (Fall): 3-13.
Baral, R and Bhargava, S. (2010) Work-family enrichment as a mediator between organizational interventions for work-life balance and job outcomes. Journal of Managerial Psychology, V 25, N 3-4, pp274-300
Baughman, R., D. DiNardi, et al. (2003). "Productivity and wage effects of "family-friendly" fringe benefits." International Journal of Manpower 24(3): 247-259.
Baum, C. (2003) The effects of maternity leave legislation on mothers' labor supply after childbirth. Southern Economic Journal - April, 2003
Behson, S.J. (2005), “The relative contribution of formal and informal organizational work-family support”, Journal of Vocational Behaviour, Vol. 66, pp. 487-500.
137

Bergemann, A. And Riphahn, R. T. (2011) Female labour supply and parental leave benefits - the causal effect of paying higher transfers for a shorter period of time. Applied Economics Letters, V 18, N 1, pp17-20
BERR (2008) Employment Law Admin Burdens Survey 2008. BERR
BERR (2009) Extending the right to request flexible working to parents of older children: Government response to consultation on implementing the recommendations of Imelda Walsh’s independent review BERR
Bevan, S. (2003) Attendance Management. London: The Work Foundation
Bevan, S., Dench, S., Tamkin, P. and Cummings, J. (1999) Family-friendly Employment: the business case. Research Report RR136, Department for Education and Employment.
BIS (2010a) Work and Families Act 2006 Evaluation Report. BIS Employment Relations.
BIS (2010b) Additional Paternity Leave and Pay Final Impact Assessment.
BIS (2010c) Impact assessment: extending the right to request flexible working to parents of children aged 17 BIS
BIS (2011a) Consultation on Modern Workplaces. BIS, May 2011
BIS (2011b) 2009 Compendium of Impact Assessments. BIS employment relations research series No. 118.
BIS (2011c), Extending the right to Request Flexible Working to All: Impact Assessment, May 2011. https://www.gov.uk/government/uploads/system/uploads/attachment_data/file/31554/11-744-extending-right-to-request-flexible-working-impact.pdf
BIS (2011d), Flexible Parental Leave: Impact Assessment, May 2011. https://www.gov.uk/government/uploads/system/uploads/attachment_data/file/31552/11-743-flexible-parental-leave-impact-assessment.pdf
BIS (2012) Modern Workplaces Consultation - Government Response on Flexible Working. BIS November 2012.
Bloom, N. and Van Reenan, J. (2002) Management Practices, Work Life Balance and Productivity: A Review of Some Recent Evidence. Oxford review of Economic Policy, Vol 22, No. 4.
Bloom, N., Kretschmer and Van Reenan, J. (2010) Family Friendly Workplace Practices: A Valuable Firm Resource? Strategic Management Journal
Bloom, N., Kretschmer, T and Van Reenan, J. (2006) Work life balance management practices and productivity, LSE, CEP.
138

Bond, S. (2004) Organisational Culture and Work-Life Conflict in the UK. International Journal of Sociology and Social Policy Vol 24, No. 12
Brandon, P. D. and Temple, J. B. (2007) Family provisions at the workplace and their relationship to absenteeism, retention, and productivity of workers: Timely evidence from prior data. Australian Journal of Social Issues, V 42, N 4, pp 447-460
British Chambers of Commerce (2007) Work and Life: How Business is striking the right balance. London: BCC
British Chambers of Commerce (2009) The Workforce Survey, April 2009. London: BCC
British Chambers of Commerce (2010) Burdens Barometer 2010. http://www.britishchambers.org.uk/zones/policy/press-releases_1/cost-of-red-tape-on-british-business-rises-to-88-3-billion.html
BT (2007) Flexible Working. Can your company compete without it? London: British Telecom
Budd, J. and Mumford, K. (2003) Family-Friendly Work Practices in Britain: Availability and Effective Coverage
Caldow, J. (2009) Working Outside the Box: A Study of the Growing Momentum in Telework. Institute for Electronic Government, IBM Corporation.
Cannon DF. Better understanding the impact of work interferences on organizational commitment (1998). Marriage & Family Review ;28(1–2):153–166.
Carsten, J.M. and Spector, P.E. (1987), ``Unemployment, job satisfaction, and employee turnover: a meta-analytic test of the Muchinsky model'', Journal of Applied Psychology, Vol. 72, pp. 374-81
Casper, LM.; Bianchi, SM. (2002) Continuity and change in the American family: Anchoring the future. Thousand Oaks, CA: Sage Publications.
CBI (2004) Employment Trends Survey 2004: Measuring flexibility in the labour market London: CBI
CBI (2005) Employment Trends Survey 2005: People driving performance London: CBI
CBI (2006a) Employment Trends Survey 2006: People at the heart of competitiveness London: CBI
CBI (2006b) The best of both worlds: A guide to flexible working London: CBI
CBI (2007) Fit for Business; Employment Trends Survey 2007 London: CBI
CBI (2008) Pulling through: Employment Trends survey 2008 London: CBI
139

CBI (2009) Easing Up: CBI/Harvey Nash employment trends survey 2009. London: CBI
CBI (2010) Gearing up for growth: CBI/Harvey Nash employment trends survey 2010. London: CBI
CBI (2011) Navigating choppy waters: CBI/Harvey Nash employment trends survey 2010. London: CBI
Chanfreau, J., Gowland,S., Lancaster, Z., Poole, E., Tipping, S. and Toomse, M. (2011) Maternity and Paternity Rights Survey and Women Returners Survey 2009/10. DWP Research report No. 777
Chartered Institute of Personnel and Development (CIPD)/Lovell. 2003. A parent’s right to ask: A review of flexible working arrangements. London: CIPD.
Chartered Institute of Personnel and Development (CIPD)/Hammonds. 2004. Flexible working and paternity leave: The full rate for fatherhood. London: CIPD.
Chartered Institute of Personnel and Development (CIPD). 2005. Flexible working: Impact and implementation- An employer survey. London: CIPD.
Chartered Institute of Personnel and Development (CIPD)/KPMG. 2006. Labour Market Outlook, Quarterly Survey Report, Autumn 2006. London: CIPD.
Chartered Institute of Personnel and Development (CIPD) (2007) Employee engagement. Factsheet, CIPD.
Chartered Institute of Personnel and Development (CIPD) (2009) Absence Management – Annual Survey Report 2009, CIPD July 2009
Chartered Institute of Personnel and Development (CIPD) (2011a) A barometer of HR trends and prospects 2011. London: CIPD
Chartered Institute of Personnel and Development (CIPD)/KPMG. (2011b). Labour Market Outlook, Summer 2011. London: CIPD.
Chung, Heejung, Marcel Kerkhofs, and Peter Etser. 2007. Working time flexibility in European companies. Establishment Survey on working time 2004-2005. Dublin: European Foundation for the Improvement of Living and Working Conditions.
Clifton, T. and Shepard, E. (2004) Work and family programs and productivity: Estimates applying a production function Model. International Journal of Manpower Vol. 25 No. 8, 2004 pp. 714-728
Comfort, Derrick, Karen Johnson, and David Wallace. 2003. Part-time work and family friendly practices in Canadian workplaces. The Evolving Workplace Series. Statistics Canada.
140

Corporate Voices (2009) Innovative workplace flexibility options for hourly workers. Corporate Voices for Working Families.
Corporate Voices (2011a) Business Impacts of Flexibility: An Imperative for Expansion. Washington: Corporate Voices Corporate Voices (2011b) Workplace Flexibility: Ensuring Success for the 21st Century A National Challenge for Business. Washington: Corporate Voices Corporate Leadership Council, Corporate Executive Board (2004) ’Driving Performance and Retention through Employee Engagement: a quantitative analysis of effective engagement strategies’
Corporate Leadership Council /Corporate Executive Board (2008). ‘Improving Employee Performance in the Economic Downturn’
Council of Economic Advisers (2010) Work-Life Balance and the Economics of Workplace Flexibility. Executive Office of the President Council of Economic Advisers.
Cragg Ross Dawson (2004) Pregnancy at work: research to explore experiences of employers in small firms. London: ACAS
Cranfield School of Management and Working Families (2008) Flexible working and performance. Summary of Research. Working Families Dalton, D.R. and Mesch D.J. (1990) the impact on flexible scheduling on employee attendance and turnover. Administrative Science Quarterly, Vol.35, pp.270 – 387 De Cieri H, Holmes B, Abbott J, Pettit T. (2005) Achievements and challenges for work/life balance strategies in Australian organizations. International Journal of Human Resource Management 16(1):90–103.
Del Boca, Daniela, Silvia Pasqua, Chiara Pronzato, and Cécile Wetzels. 2007. “An empirical analysis of the effects of social policies on fertility, labour market participation and hourly wages of European women.” In Daniela Del Boca and Cécile Wetzels (eds), Social Policies, Labour Markets and Motherhood, pp. 269-270. Cambridge, UK: Cambridge University Press.
Department of Health (2000), Working Lives: Programmes for Change, NHS Executive, Leeds
Department for Business Innovation and Skills (2010) Work and Families Act 2006: Evaluation report. BIS Employment Relations Series.
Department for Business Innovation and Skills (2010) Impact Assessment: Extending the right to request flexible working to parents of children aged 17.
DTI (2000) Work and Parents: Competitiveness and Choice. London: DTI Green Paper.
141

DTI (2005) 2002 Compendium of Regulatory Impact Assessments. DTI employment relations research report No. 40.
DTI (2006) Administrative Burdens Measurement Exercise. DTI
DWP (2009) Flexible Working: working for families, working for business. A report by the Family Friendly Working Hours Taskforce
Dex, S., Smith, C. and Winter, C. (2001) Effects of Family Friendly Policies on Business Performance. The Judge Institute of Management Studies, WP 22.
Dex. S and Smith C. (2002) The Nature and Pattern of Family-friendly Employment in Britain. York: Joseph Rowntree Foundation
Dex, F and Scheibl, F (2001) Flexible and family-friendly working arrangements in UK based SMEs: Business cases. British Journal of Industrial Relations, 39: 3 pp411-431.
Dex, F and Scheibl, F (2002) SMEs and Flexible Working Arrangements. York: Joseph Rowntree Foundation.
Dick, P (2009) Bending over Backwards? Using a Pluralistic Framework to Explore the Management of Flexible Working in the UK Police Service. British Journal of Management, Vol. 20.
Dionne, G. and Dostie, B. (2005) New Evidence on the Determinants of Absenteeism Using Linked Employer-Employee Data. Cahier de recherche/Working Paper 05-21.
Doyle & Reeves, R (2002) “Time Out: The Case for Time Sovereignty”. The Industrial Society, London.
Drory A, Shamir B. (1988) Effects of organizational and life variables on job satisfaction and burnout. Group and Organizational Studies;13(4):441–455.
Eaton et al (2001) If You Can Use Them: Flexibility Policies, Organizational Commitment and Perceived Performance. John F. Kennedy School of Government, Harvard University Faculty Research Working Papers Series. RWP01-009
Edwards, P., Ram, M. and Black, J (2003) The impact of employment legislation on small firms: a case study analysis. DTI ERS No. 20
Edwards, C and Robinson, O. (2009) Evaluating the Business Case for Part-time Working amongst Qualified Nurses British Journal of Industrial Relations 42:1 March 2004 0007–1080 pp. 167–183
EEF (2011) Flexibility in the modern manufacturing workplace. London: EEF.
Equality and Human Rights Commission (EHRC) (2009) Working Better: Meeting the changing needs of families, workers and employers in the 21st century EHRC
142

Eurofound (2007) Parental leave in European Companies. Establishment Survey on Working Time 2004–2005
Evans, J. (2001) Firms' Contribution to the Reconciliation between Work and Family Life OECD Labour Market and Social Policy Occasional Papers No. 48
Federation of Small Businesses (2010) Flexible working: small business solutions. London: FSB
Felstead, A. Jewson, N., Phizacklea, A. and Walters, S. (2000) A statistical portrait of working at home in the UK: evidence from the labour force survey. ESRC Future of Work Working Paper no. 4.
Felstead, A., Jewson, N., Phizacklea, A. and Walters, S. (2002) 'The option to work at home: another privilege for the favoured few?' New Technology, Work & Employment, 17, 3: 204-23.
Ford, J and Collinson, D. (2011) In search of the perfect manager? Work-life balance and managerial work. Work Employment and Society 25 (2) 257-273
Forth, J., Lissenburgh, S., Calendar, C. and Millward, N. (1997) Family-friendly WorkingArrangements in Britain, 1996. London: Department for Education and Employment
Gallup Organisation (2006). ‘Engagement predicts earnings per share’.
Gallup, 2003, cited in Melcrum (2005), Employee Engagement: How to Build A High Performance Workforce
Glass, J. (2004) Blessing or Curse? Work-Family Policies and Mother’s Wage Growth Over Time. Work and Occupations, Vol. 31 No. 3, August 2004 367-394
Glendinning, C.(2009) Cash for care: implications for carers Geneva Association Health and Ageing Newsletter 21, 3-6
Goff SJ, Mount MK, Jamison RL. (1990)Employer supported child care, work/family conflict, and absenteeism: A field study. Personnel Psychology; 43:793–809.
Gornick, J. and Hegewisch, A. (2010)The Impact of “Family-Friendly Policies” on Women’s Employment Outcomes and on the Costs and Benefits of Doing Business. A Commissioned Report for the World Bank
Government Office for Science (2008) Mental Capital and Wellbeing: Making the most of ourselves in the 21st century. London: The Government Office for Science.
Grant, L., Yeandle, S and Buckner, L (2005) ‘Working below potential: women and part time work’ Equal Opportunities Commission Working Paper Series No 40, Manchester.
143

Gray, H. (2002). “Family-Friendly Working: What a Performance! An Analysis of the Relationship between the Availability of Family Friendly Policies and Establishment Performance.” CEP Discussion Paper No. 529.
Gray, M., and Tudball, J. (2003). “Family-Friendly Work Practices: Differences within and between Workplaces.” Journal of Industrial Relations, 45, pp. 269-291.
Green, F (2001) “It’s been a hard days night: The concentration and intensification of labour in the late 20th century Britain.” British Journal of Industrial Relations, 39,1 p53-81.
Guest, D., Michie, J., Sheehan, M. and Conway, N. (2000b) ‘Getting inside the HRM–performance relationship’, Working Paper 8, ESRC Future of Work Programme.
GULC - Georgetown University Law Center. 2010. “Flexible Work Arrangements: Selected Case Studies.”
Harris, L. and Foster, C. (2005) 'Small, flexible and family friendly' - work practices in service sector businesses. DTI Employment Relations Research Series No. 47. London: Department of Trade and Industry.
Harter , J.K. et al (2006), Gallup Q12 Meta-Analysis Gallup Organisation (2006). ‘Engagement predicts earnings per share’.
Hayman, J. (2010). Flexible Work Schedules and Employee Well-Being. The New Zealand Journal of Employment Relations – Special Issue on Occupational Stress. Vol 35(2).
Hayward, B, Fong, B. and Thornton, A. (2007) The third work-life balance employers survey. ERRS No. 86
Health and Social Care Information Centre (2010) Survey of Carers in Households 2009/10. www.ic.nhs.uk/webfiles/publications/009_Social_Care/carersurvey0910/ Survey_of_Carers_in_Households_2009_10_England.pdf
Hegewisch, A. (2009) Flexible working policies: a comparative review. EHRC research report: 16
Hellman, C.M. (1997) ‘Job satisfaction and intent to leave’, Journal of Social Psychology, vol 137, pp 677-89.
Heywood, J. S.A Siebert, W. S. A Wei, X. D. (2007) The implicit wage costs of family friendly work practices. Oxford Economic Papers-New Series, V 59, N 2 pp275-300
Hofferth, S. and Curtin, S. (2003). The Impact of Parental Leave on Maternal Return to Work after Childbirth in the United States. OECD Social, Employment and Migration Working Papers 7. Paris: OECD.
144

Hogarth,T., Hasluck, C. and Pierre, G. (2000) Work-Life Balance 2000: Baseline Study of Work-Life Balance Practices in Great Britain. London:DfEE
Hohl K. (1996) The Effects of Flexible Work Arrangements. Non Profit Management and Leadership, vol. 7, no. 1, Fall
Holt, H. and Grainger, H. (2005) Results of the Second Flexible Working Employee Survey Employment Relations Research Series no 39, DTI
Hom, P.W. and Griffeth, R.W. (1995), Employee Turnover, South-Western, Cincinnati, OH.
Hooker, H., Neathy, F., Casebourne, J. and Munro, M. (2007) The third work-life balance employees survey. ERRS No. 58
House of Commons (2009) All-party parliamentary small business group report. Flexible Working: Challenges for Business.
Houston, D. and Waumsley, J (2003) Attitudes to flexible working and family life. York: Joseph Rowntree Foundation
Hudson, M Lissenburgh, S & Sahin-Dikmen, M (2004) Matenity and Paternity Rights in Britain 2002: Survey of Parents. DWP In-house Report 131. London: HMSO
Hurrell, K., Botcherby, S. and Darton, D. (2007) ‘Out of work or working below potential – assessing the impact of increasing flexible working opportunities’ Manchester.
IFF (2011) SME Business Barometer. Department for Business Innovation and Skills
IRS (2009) Flexible working survey 2009: availability, take-up and impact, Charlotte Wollf, IRS.
IRS (2010) Flexible working survey 2010: benefits, issues and making it work, Charlotte Wollf, IRS.
Joesch, J. (1997) Paid Leave and the Timing of Women's Employment Before and After Birth. Journal of Marriage and the Family 59 (4) (November): 1008-1021.
Kelliher, C. and Anderson, D. (2010) Doing more with less? Flexible working practices and the intensification of work. Human Relations, V 63, N 1, pp83-106
Kelly, E., Kossek, E., Hammer, L., Durham, M., Bray, J. Chermack, K., Murphy, L. and Kaskubar, D (2008) Getting There from Here: Research on the Effects of Work–Family Initiatives on Work–Family Conflict and Business Outcomes. Acad Manag Ann. 2008 August ; 2: 305–349.
145

Kelly, E.L., Moen, P. and Tranby, E. (2011) Chaning workplaces o reduce work-family conflict: schedule control in a white-collar organisation, American Sociological Review 76(2) pp265-290.
Konrad A.M. and Mangel R. (2000). The impact of work-life programs on firm productivity. Strategic Management Journal 21(12): 1225–1237.
Kular, S., Gatenby,M., Rees,C. Soane,E. and Truss, K. (2008) Employee Engagement: A Literature Review. Kingston Business School Working paper Series No. 19
La Valle, I., Clery, E. and Huerta, M.C. (2008). Maternity rights and mothers’ employment decisions. DWP Research Report No. 496, London: TSO.
Lau, R. (2000) Quality of work life and performance. An ad hoc investigation of two key elements in the service profit chain model. International Journal of Service Industry Management, Vol. 11 No. 5, 2000, pp. 422-437
Lourel, M., M. T. Ford, et al. (2009). "Negative and positive spillover between work and home: Relationship to perceived stress and job satisfaction." Journal of Managerial Psychology 24(5): 438-449.
MacLeod, D. and Clarke, N. (2010) Engaging for Success: enhancing performance through employee engagement. BIS.
Maister, D. (2003) Practice What You Preach. New York: Free Press
Manning, A. and Petrongolo, B. (2008) ‘The part-time pay penalty for women in Britain’ The Economic Journal 118 (February) F28-F51
Marketing Innovators (2005) www.marketinginnovators.com/Downloads/TheEffects .pdf
Mauno, S., U. Kinnunen, et al. (2005). "Work-Family Culture in Four Organizations in Finland: Examining Antecedents and Outcomes." Community, Work & Family 8(2): 115-140.
Nelson A , Nemec K, Solvik P & Ramsden C (2004) The evaluation of the Work-Life Balance Challenge Fund. Employment Relations Research Series No. 32. London: DTI.
Oakley, J. (2005) Linking Organizational Characteristics to Employee Attitudes and Behavior
ONS General Lifestyle Survey, 2011. http://www.ons.gov.uk/ons/rel/ghs/general-lifestyle-survey/2011/index.html
ORC International (2008) Employment Law Admin Burden Survey 2008.
Palmer, T. (2004) Results of the First Flexible Working Employee Survey Employment Relations Occasional Papers, DTI
146

Perry-Smith JE, Blum TC. (2000) Work-family resource bundles and perceived organizational performance. Academy of Management Journal 43(6): 1107–1117
Petticrew, M. and Roberts, H. (2006) Systematic Reviews in the Social Sciences: A practical guide. Oxford: Blackwell Publishing.
Philpott, J. (2006) Teleworking: trends and prospects. Available at: http://www.cipd.co.uk/pressoffice/_featured/Teleworking_060906ART.htm
Prognos (2005) Work Life Balance: Engine for economic growth and social stability: analysis of macroeconomic effects. Berlin: Prognos AG.
Remery, C., van Doorne-Huiskes, A and Schippers, J. (2003) Family-friendly policies in The Netherlands: The tripartite involvement . Personnel Review, Vol. 32 No. 4, pp. 456-473
Purcell, J., Kinnie, N., Hutchinson, S., Rayton, B. and Swart, J. (2003), Understanding the People/Performance Link: Unlocking the Black Box, CIPD, London.
Riley, R.; Metcalf, H. And Forth, J. (2007) The business case for Equal Opportunities: An econometric investigation. Department of Work and Pensions Research Report No. 483. Rousseau, D.M. (1995). Psychological contracts in organizations: Understanding written and unwritten agreements. Thousand Oaks, CA: Sage Publications Ruhm, Christopher J. 1998. “The Economic Consequences of Parental Leave Mandates: Lessons from Europe.” The Quarterly Journal of Economics 113 (1) (February): 285-317. Sainsbury Centre for Mental Health (2007) Mental health at work: developing the business case. Policy Paper 8. Scandura, T.A. and Lankau, M.J. (1997) Relationships of gender, family responsibility and flexible work hours to organisational commitment and job satisfaction Journal of Organisational Behaviour Vol 18 pp 377-391.
Scheibl, F. (1999) Can we measure and communicate the benefits of work life policies more effectively? ESRC Centre for Business Research, University of Cambridge Working Paper No. 135
Schlesinger, L.A. and Zornitsky, J.J. (1991) Job satisfaction, service capability, and customer satisfaction: an examination of linkages and management implications. Human Resource Planning, Vol. 14 No. 2, pp. 141-9.
Secret, M. and Sprang, G. (2008) The effects of family-friendly workplace environments on work-family stress of employed parents Journal of social service research Vol 28 (2), pp21-45.
147

Sirota, D., Mischkind, L. And Meltzer, I. (2005) The Enthusiastic Employee: How Companies Profit by Giving Workers What They Want;
Smeaton, D & Marsh A (2006) Maternity & Paternity Rights & Benefits Survey of Parents 2005. DTI
Smeaton, D (2006a) “Work return rates after childbirth in the UK – trends, determinants and implications: a comparison of cohorts born in 1958 and 1970.” Work Employment and Society,20(1).
Smeaton, D and Young, V. (2007) Work in the future: employers and workplace transformation. Manchester: Equal Opportunities Commission.
Smeaton, D. (2009) Working Better presentation EHRC Working Better Conference October 2009 http://www.equalityhumanrights.com/advice-and-guidance/here-for-business/working-better/what-is-working-better/background-to-working-better/working-better seminar/#Session3
Spiess, K. and Wrohlich, K. (2008) The Parental Leave Benefit Reform in Germany: Costs and Labour Market Outcomes of Moving towards the Nordic Model. Population Research and Policy Review Volume 27, Number 5, pp 575-591
Stavrou, E. (2005) Flexible work bundles and organizational competitiveness: a cross-national study of the European work context. Journal of Organisational Behaviour, 26, 923–947
Steel, R.P. and Ovalle, N.K. (1984) ‘A review and meta-analysis of research on the relationship between behavioural intentions and employee turnover’, Journal of Applied Psychology, vol 69, pp 673-86.
Stevens, J., Brown, J. and Lee, C. (2004) The Second Work-Life Balance study: results from the employees study Employment Relations Research Series no 64, DTI
Thompson, C. and Prottas, D. (2005), “Relationships among organizational family support, job autonomy, perceived control, and employee well-being”, Journal of Occupational Health Psychology, Vol. 10 No. 4, pp. 100-18.
Tipping, S., Chanfreau, J., Perry, J. and Tait, C. (2011) The fourth work life balance employee survey. BIS
Tomlinson, J. (2006) ‘Routes to part-time management in UK service sector organisations: implications for women’s skills, flexibility and progression’. Gender, Work and Organisation, Vol. 13, No. 6, pp. 585–605
Towers Perrin-ISR (2006) The ISR Employee Engagement Report.
TUC (2008) Closing the gender pay gap: An update report for the TUC Women’s Conference 2008 London: TUC
148
Truss et al (2006) Working life: employee attitudes and engagement 2006. Research report. London: Chartered Institute of Personnel and Development.
Visser, F. and Williams, L (2006) ‘Work-life balance in the public sector: rhetoric vs. reality’ London: The Work Foundation
Walsh, I. (2008) Flexible Working: A review of how to extend the right to request flexible working to parents of older children BERR
White. M, Hill.S, McGovern.P, Mills.C & Smeaton.D (2003) “High performance management practices, working hours and work life “ British Journal of Industrial Relations, 41 (2).
White, M Hill, S Mills, C & Smeaton D (2004) “Managing to Change: British Workplaces and the Future of Work” Palgrave: Hampshire
Whitehouse, G., Haynes, M. and Macdonald, F. (2007) Reassessing the ‘family-friendly workplace’: Trends and influences in Britain, 1998-2004. Department for Business Enterprise and Regulatory Reform. ERRS No. 76
Women and Work Commission (2006) ‘Shaping a Fairer Future’
Work Foundation (2002) Maximising attendance. London: Work Foundation.
Wood, S. and De Menezes, L (2010) Family-friendly management, organizational performance and social legitimacy. International Journal of Human Resource Management, V 21, N 10, pp1575-1597
Woodland, S., Simmonds, N., Thornby, N., Fitzgerald, R., McGee, A. (2004) The Second Work –Life Balance Study: Results from the Employers’ Survey. DTI Employment Relations Research Series No. 22, HMSO
Working Families (2005) In sickness and in health. London: Working Families
Working Families (2008) Flexible Working and Performance. London: Working Families
Wright, T. (2006), “The emergence of job satisfaction in organisational behaviour”, Journal of Management History, Vol. 12, pp. 262-77.
Yasbek, P. (2004) The business case for firm-level work-life balance policies: a review of the literature. Labour Market Policy Group, New Zealand Department of Labour.
Zveglich, J. and Rodgers, Y. (2003) The Impact of Protective Measures for Female Workers. Journal of Labor Economics 21 (July)
149

10. Appendix 1: Quality
Review
150

Appraisal Matrix
.
No Control group. Cross-sectional design led by a single research method. Anecdotal evidence. Low response rates (below 16%). No description of sampling or methods
No Control group. Longitudinal and repeated measures design to capture changes over time.Moderate method, sample sizes or response rates (16-49%).Methodology is clear, but some areas lacking detail.
Includes a control group achieved through experimental or quasi- experimental techniques. Method written up in a transparent way. Sample design clear and reasonable. Large samples likely to be representative. Random sampling. High response rates. Questions tested and developed, and approach piloted.
Tech
nica
l Rig
our
Weak Moderate StrongSo
undn
ess o
f con
clus
ions
Makes claims that do not follow from evidence or may not be solely attributable to the policy /practice. Based on biased sampling or questions. Low transparency of design, methods or analytical techniques.
Claims based on the evidence but moderate transparency of design, methods or techniquesDependent variable limitations: outcomes not objective or independently verifiable, based instead on individual perceptions. Some recognition of caveats/potential for bias.
A strong technical design. Claims firmly based on the evidence. Highly transparent. Objective dependent variables. Quoted survey statistics are statistically significant.Clear and systematic approach to analysis, and clear analytical framework.Quali: well grounded conclusions based on presented evidence. Where findings not generalisable (weak external validity) the study makes clear scope and caveats.
Polic
y fo
cus Results reported as a
‘package’ of WLB provision: separate elements not distinguished, risking biased / conflated results
Some but not all elements of a package of policy/ practice provision were identified when reporting results.
Report concentrated on one or several specific policy/ practices.
151

11. Appendix 2:
Research Evidence
Appraisal Template
STUDY REFERENCE
Author(s) and date
Funders/sponsors
STUDY CONTENT
Evidence type
Aims of study and research questions
Findings/outcomes (A)
What are the costs and benefits (quantified evidence to be placed in an excel template)
Findings (B) outcome durations
Is there any evidence on the duration of any costs or benefits?
Findings (C)(eg. firm size, sector, type)
Any sub group findings?
Recommendations, evidence gaps as stated by authors
METHODOLOGY
Study design/ methods
Theory
152

Sample framework Include country coverage, sampling strategy, context (i.e. sample population)
Data sources
Quantitative
Qualitative To include years covered, research instrument, respondent types, sample sizes, piloting, type of questioning, methods of analysis
Limitations of the study/dataset as stated by the authors
Limitations of study/dataset as stated by assessor (if not captured below)
EVIDENCE APPRAISAL A – Relevance of study focus for review questions (0-2)
(Refer to relevance scoring, i.e. Table 1 in Protocol, and to conceptual framework from Protocol)
EVIDENCE APPRAISAL B – Quality assessment
Generalisability.
Overall rate, a 1-3 score under headings
Technical Rigour
Soundness of conclusions
Policy/practice focus
153

12. Appendix 3: Search
terms Search Profile: Costs and Benefits to Business of Adopting Work-life Balance Practices Population Interventions Outcomes Employers businesses organisations firms workplaces SMEs small businesses enterprise social enterprise
work life balance WLB family friendly
family leave or time off maternity leave paternity leave parental leave adoption leave dependents – time off emergency leave
flexible working part-time job sharing term-time working working from home home working flexi-time annualised hours compressed week compressed hours reduced hours four-and-a half day week* nine-day fortnight* zero hours contract*
dependent care support childcare childcare subsidy on-site childcare financial support for childcare elderly care/support for carers of adults/eldercare career breaks training for returners keeping in touch schemes carers telephone access
costs benefits absenteeism absence work-related sickness company reputation productivity performance staff/labour turnover retention recruitment business case regulations bureaucracy leave cover administration burden Employee relations Training Skills Wages Wage differentials presenteeism The ‘B’ variables from Figure 4.1, i.e. Loyalty Motivation Commitment engagement Effort Morale Job satisfaction Returners
*these are terms used in labour force survey
154

Search profile: Impact of the right to request on flexible working take-up and availability
Population Interventions Outcomes Employers businesses organisations firms workplaces SMEs small businesses enterprise social enterprise Individuals Employees Staff Workers Carers Parents
Right to request flexible working Right to request reduced hours Flexible working legislation WLB legislation Employment Act 2002 Work & Families Act 2006
Availability of or access to or opportunities for flexible working part-time job sharing term-time working working from home home working flexi-time annualised hours compressed week compressed hours reduced hours four-and-a half day week* nine-day fortnight* zero hours contract* Take up or use of flexible working part-time job sharing term-time working working from home home working flexi-time annualised hours compressed week compressed hours reduced hours four-and-a half day week* nine-day fortnight* zero hours contract*
155

© Crown copyright 2014
You may re-use this information (not including logos) free of charge in any format or medium, under the terms of the Open Government Licence. Visit www.nationalarchives.gov.uk/doc/open-government-licence, write to the Information Policy Team, The National Archives, Kew, London TW9 4DU, or email: [email protected].
This publication available from www.gov.uk/bis
Any enquiries regarding this publication should be sent to: Department for Business, Innovation and Skills 1 Victoria Street London SW1H 0ET Tel: 020 7215 5000 If you require this publication in an alternative format, email [email protected], or call 020 7215 5000. BIS/14/903