costs and benefits of implementing renewable energy policy
TRANSCRIPT
Costs and benefits of implementing renewable energy policy in South Africa RESULTS OF A POWER SYSTEM MODEL OF THE SOUTH AFRICAN ELECTRICITY SYSTEM
18-08-2011

2 | Costs and benefits of implementing renewable energy policy in South Africa, Results of a power system model of the South African electricity system - 18-08-2011
Published by:
Ea Energy Analyses Frederiksholms Kanal 4, 3. th. 1220 Copenhagen K Denmark T: +45 88 70 70 83 F: +45 33 32 16 61 Email: [email protected] Web: www.eaea.dk
3 | Costs and benefits of implementing renewable energy policy in South Africa, Results of a power system model of the South African electricity system - 18-08-2011
Acronyms DoE – Department of Energy ERC – Energy Research Centre at the University of Cape Town Eskom TDP 2010 – Eskom Transmission Development Plan 2010 GIZ – Deutsche Geselschaft für Internationale Zusammenarbeit IRP 2010 – Integrated resource plan for electricity 2010 NERSA – National Energy Regulator of South Africa NIRP 3 – Third National Integrated Resource Plan for South Africa O & M – Operation and maintenance OCGT – Open cycle gas turbine RE – renewable energy REFIT – Renewable energy feed-in tariff

4 | Costs and benefits of implementing renewable energy policy in South Africa, Results of a power system model of the South African electricity system - 18-08-2011
Contents
1 Summary and conclusion .....................................................................5
2 Introduction ........................................................................................6
3 The value of renewable energy ............................................................7
4 Power system planning ........................................................................9
5 Results of the scenario analysis .......................................................... 10
6 Description of the model and data used ............................................. 16
5 | Costs and benefits of implementing renewable energy policy in South Africa, Results of a power system model of the South African electricity system - 18-08-2011
1 Summary and conclusion The introduction of renewables in South Africa is a major shift in energy policy. This analysis attempts to determine the value of this policy decision for the power system by comparing two scenarios of the South African power system in 2015, a reference scenario without renewables and a RE scenario with 3,625 MW of renewable generating capacity. Both scenarios must meet a nominal demand of 268.7 TWh. The Balmorel model was used in the analysis. Balmorel is an economic/technical partial equilibrium model that simulates the power system and market. The model optimises the production at existing and planned production units. The most important results of the scenario analysis are:
− 8.1 TWh of fossil fuel generation is displaced by renewables; 6.8 TWh of coal-fired generation and 1.3 TWh of diesel-fired generation.
− Annual saving of R2.7 billion in short term marginal production costs, mostly in saved expenditure on diesel fuel.
− 8.4 million tons of carbon dioxide emissions are avoided. − The marginal value of transmission capacity is reduced markedly
between the coastal regions and generation centres in the north of the country indicating reduced congestion and required investments in the medium to long term.
The following conclusions can be taken from the scenario study:
− The deployment of 3,625 MW of renewables under the DoE procurement programme will reduce the cost of meeting electricity demand in South Africa
− The introduction of renewables reduces reliance on imported fossil fuels in the electricity supply industry
− Interruptible demand, pumped storage and hydro generation can play an important role in integrating variable generation without significant increases in system costs.
− The deployment of renewable generation capacity in areas currently reliant on transmission for supplying electricity may allow investments in new transmission capacity to be delayed.
Scenario results
Conclusion
6 | Costs and benefits of implementing renewable energy policy in South Africa, Results of a power system model of the South African electricity system - 18-08-2011
2 Introduction The South African government is currently implementing a renewable energy programme that will result in 3,625 MW of renewable energy technologies being deployed by IPP’s over the coming years. This will play an important role in improving security of electricity supply in South Africa and reduce the environmental impact of electricity generation, which is currently dominated by coal-fired power plants. This analysis is part of the GIZ sponsored project “Mapping potential renewable energy projects in South Africa” carried out for the Department of Energy and the National Treasury by Ea Energy Analyses. The project aims at identifying the costs and benefits of deploying renewables for the South African power system. The first part of the project involved the workshop “Grid issues related to connecting wind turbines” held in May 2011. In order to carry out the analysis a model of the South African power system was developed using publically available data from the DoE, NERSA, ERC and Eskom. The Balmorel model was used to simulate the South African power system in 2015 with and without the DoE’s renewable energy programme. This provides information on how the introduction of renewables will influence the power system and the costs and benefits of integrating 3,625 MW of renewable generating capacity. The results of this study provide easily accessible, high level information on the South African power system of the future. This information can be utilised to explain and clarify the effect of implementing government policy on RE by quantifying the costs and benefits of renewables in the South African power system. The information provided by the model can be used to develop further policy initiatives for the electricity system by providing a planning tool that can easily quantify the effects of various policy scenarios on the power system. A short data report is included in chapter 6 and provides more detailed, technical information on the Balmorel model, the data used in the simulations and how the South African power system was structured in the model.
7 | Costs and benefits of implementing renewable energy policy in South Africa, Results of a power system model of the South African electricity system - 18-08-2011
3 The value of renewable energy The value of renewable generation is understood as the avoided costs of electricity production. This is not necessarily the same as the tariff charged for the electricity generated. Two different indicators can describe the value of the electricity produced. These are generally determined through studies using power system modelling tools:
i. The reduction of total cost of supply that can be attributed to renewables. A model simulation with and without renewables can reveal the difference in variable costs between the two scenarios.
ii. The marginal price multiplied by the electricity produced by renewables. The marginal price is calculated as the most expensive generation in each hour that is displaced by renewable generation.
The difference between the two indicators is that the first indicates the overall value of renewable energy for the power system, while the latter indicates the value in the area where the renewable generation is situated. The two indicators may give different results, and can be used as supplement to each other. Any measure to improve the integration of renewables such as grid strengthening, pumped storage, and improved portfolio performance can be evaluated in this way. These same principles apply for evaluating the addition of conventional generation technologies to the power mix. This study focuses on the first indicator. This provides a gauge of the overall value of renewable generation for South Africa by comparing the difference in total fixed and variable costs for operation and maintenance and the fuel costs required to cover the expected electricity demand in a reference scenario without renewable generation and a scenario with renewable generation. Investment costs for new renewable and conventional capacity are not included in the study as the investment decisions for Medupi, Kusile, Ingula and renewable generation have already been made. In South Africa the value of renewables provided by the first indicator will vary from region to region. Renewables will be deployed in grid areas where there is currently limited or no generation capacity and where bottlenecks in the grid sometimes result in supply constraints in certain periods. In a market system this would be expressed by having different price areas that provide

8 | Costs and benefits of implementing renewable energy policy in South Africa, Results of a power system model of the South African electricity system - 18-08-2011
price signals for building generation or transmission capacity where it is of most value for the system, the generator and the end user. The model can provide these price signals to decision makers even without the existence of an electricity market.
9 | Costs and benefits of implementing renewable energy policy in South Africa, Results of a power system model of the South African electricity system - 18-08-2011
4 Power system planning The power system is a dynamic system, subject to continuously changing conditions, some of which can be anticipated and some of which cannot. The primary function of the power system is to serve a continuously varying demand load. The reliability of a power system is determined by its ability to respond to and accommodate expected and unexpected changes and disturbances whilst maintaining continuity of supply to end-users. Ensuring the dependability of a power system requires planning over different timeframes. This can vary from years to seconds before actual generation and consumption. Policy and power system planning must find a balance between security of supply, economic efficiency, environmental concerns and socio-economic factors. In order to achieve this, power system models are often used. The Balmorel power system model is a least cost dispatch model. The model is based on detailed technical representation of the existing power system and possible expansions in terms of transmission and production capacities. The main result in this case is a least cost optimisation of the annual production pattern of all power units. It can also provide information on longer term investment decisions. Results are presented in terms of economy, electricity production, installed capacity and environmental impact. Results can be extracted breaking down the overall effect of policy or investment decisions based on the functioning of the whole power system and identifying benefits and drawbacks for stakeholders. The economically most efficient dispatch of available generating capacity is not necessarily dependant on the existence of a liberalised power market. Many power systems, including the South African power system, implement the principles of least cost dispatch without having a de facto power market. Single buyers and control centres can utilise least cost dispatch principles in order to optimise economic efficiency in the same way that market based power systems do. In this study the Balmorel model optimises the dispatch of the South African generation mix to meet the expected demand in much the same fashion as occurs in the Eskom Power Pool with unit commitment and scheduling based on least cost principles and technical capabilities of units.
10 | Costs and benefits of implementing renewable energy policy in South Africa, Results of a power system model of the South African electricity system - 18-08-2011
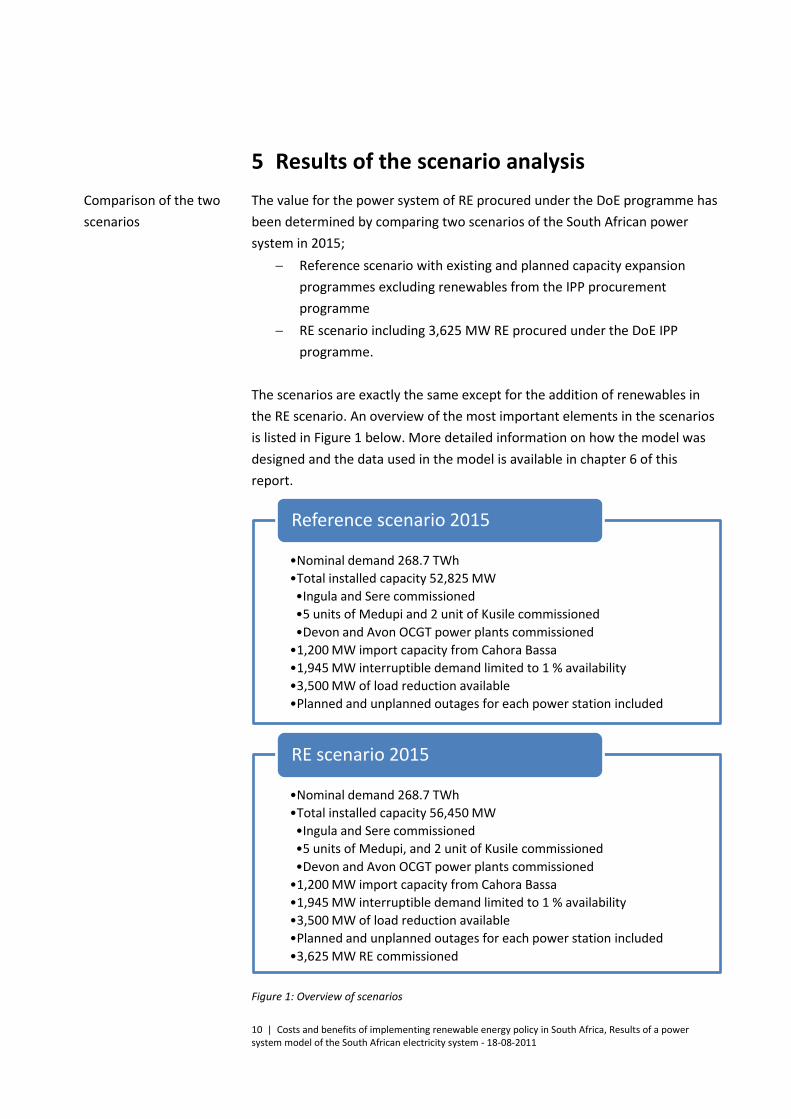
5 Results of the scenario analysis The value for the power system of RE procured under the DoE programme has been determined by comparing two scenarios of the South African power system in 2015;
− Reference scenario with existing and planned capacity expansion programmes excluding renewables from the IPP procurement programme
− RE scenario including 3,625 MW RE procured under the DoE IPP programme.
The scenarios are exactly the same except for the addition of renewables in the RE scenario. An overview of the most important elements in the scenarios is listed in Figure 1 below. More detailed information on how the model was designed and the data used in the model is available in chapter 6 of this report.
Figure 1: Overview of scenarios
•Nominal demand 268.7 TWh •Total installed capacity 52,825 MW •Ingula and Sere commissioned •5 units of Medupi and 2 unit of Kusile commissioned •Devon and Avon OCGT power plants commissioned •1,200 MW import capacity from Cahora Bassa •1,945 MW interruptible demand limited to 1 % availability •3,500 MW of load reduction available •Planned and unplanned outages for each power station included
Reference scenario 2015
•Nominal demand 268.7 TWh •Total installed capacity 56,450 MW •Ingula and Sere commissioned •5 units of Medupi, and 2 unit of Kusile commissioned •Devon and Avon OCGT power plants commissioned •1,200 MW import capacity from Cahora Bassa •1,945 MW interruptible demand limited to 1 % availability •3,500 MW of load reduction available •Planned and unplanned outages for each power station included •3,625 MW RE commissioned
RE scenario 2015
Comparison of the two scenarios
11 | Costs and benefits of implementing renewable energy policy in South Africa, Results of a power system model of the South African electricity system - 18-08-2011
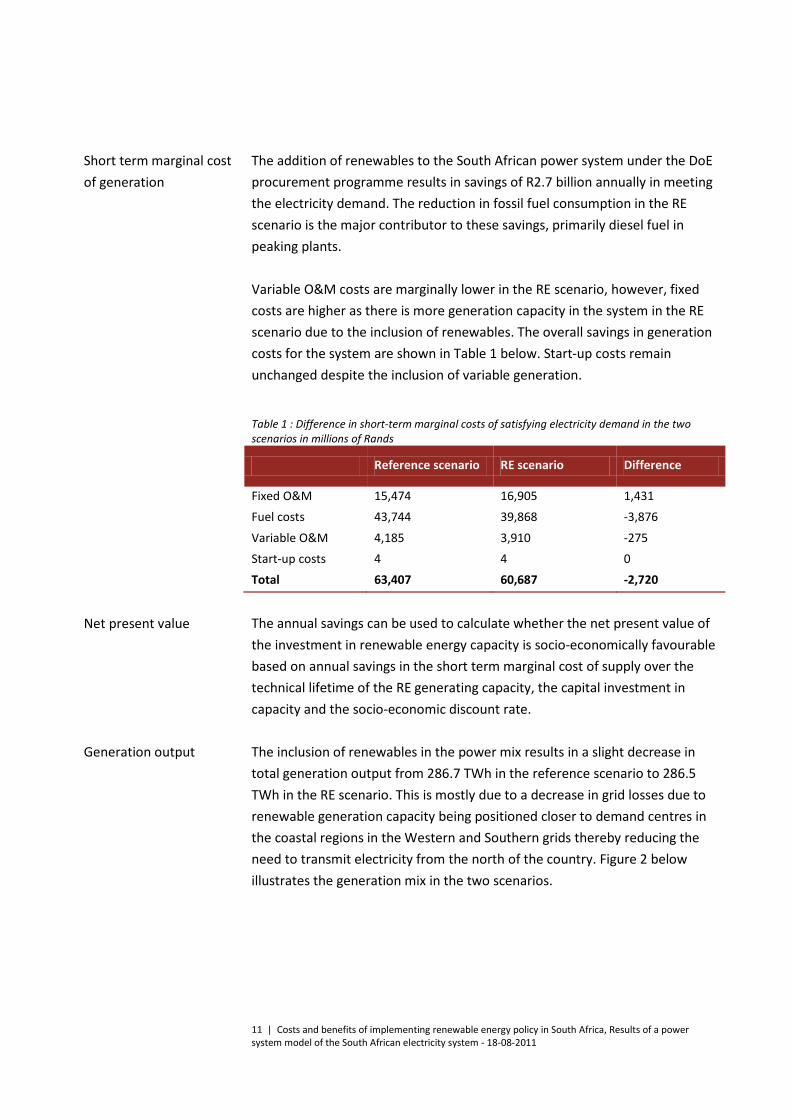
The addition of renewables to the South African power system under the DoE procurement programme results in savings of R2.7 billion annually in meeting the electricity demand. The reduction in fossil fuel consumption in the RE scenario is the major contributor to these savings, primarily diesel fuel in peaking plants. Variable O&M costs are marginally lower in the RE scenario, however, fixed costs are higher as there is more generation capacity in the system in the RE scenario due to the inclusion of renewables. The overall savings in generation costs for the system are shown in Table 1 below. Start-up costs remain unchanged despite the inclusion of variable generation.
Table 1 : Difference in short-term marginal costs of satisfying electricity demand in the two scenarios in millions of Rands
Reference scenario RE scenario Difference
Fixed O&M 15,474 16,905 1,431 Fuel costs 43,744 39,868 -3,876
Variable O&M 4,185 3,910 -275 Start-up costs 4 4 0 Total 63,407 60,687 -2,720
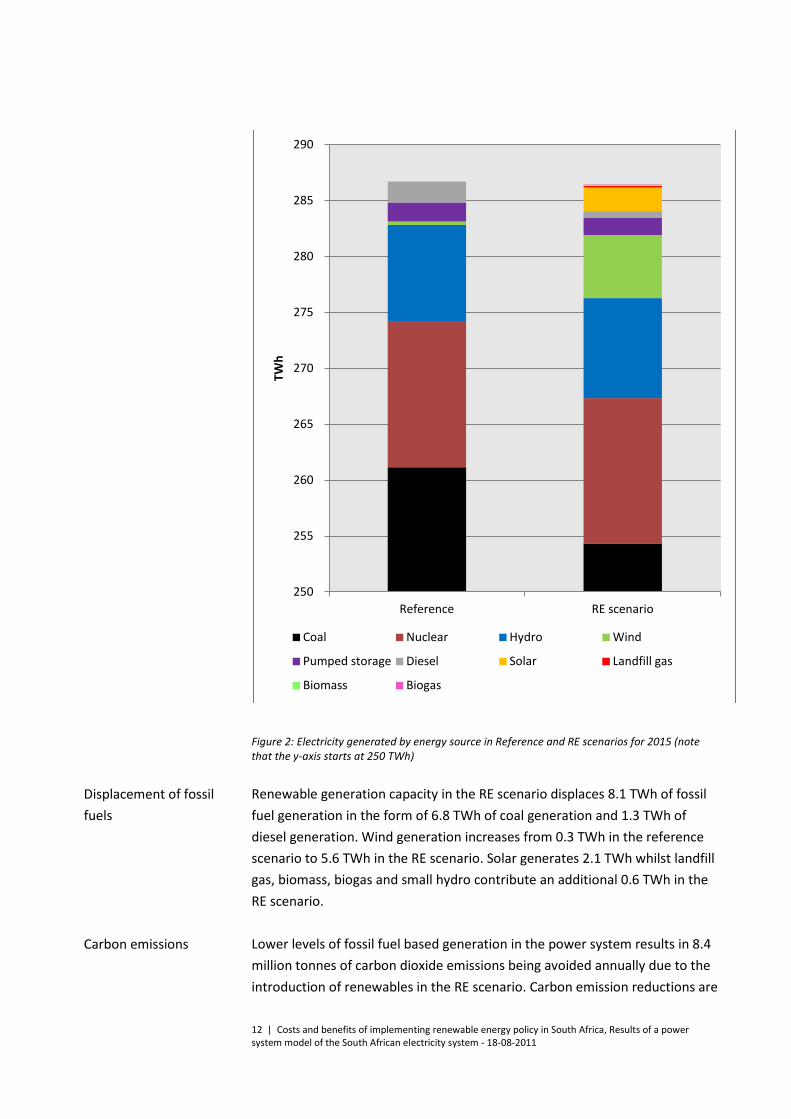
The annual savings can be used to calculate whether the net present value of the investment in renewable energy capacity is socio-economically favourable based on annual savings in the short term marginal cost of supply over the technical lifetime of the RE generating capacity, the capital investment in capacity and the socio-economic discount rate. The inclusion of renewables in the power mix results in a slight decrease in total generation output from 286.7 TWh in the reference scenario to 286.5 TWh in the RE scenario. This is mostly due to a decrease in grid losses due to renewable generation capacity being positioned closer to demand centres in the coastal regions in the Western and Southern grids thereby reducing the need to transmit electricity from the north of the country. Figure 2 below illustrates the generation mix in the two scenarios.
Short term marginal cost of generation
Net present value
Generation output
12 | Costs and benefits of implementing renewable energy policy in South Africa, Results of a power system model of the South African electricity system - 18-08-2011
Figure 2: Electricity generated by energy source in Reference and RE scenarios for 2015 (note that the y-axis starts at 250 TWh) Renewable generation capacity in the RE scenario displaces 8.1 TWh of fossil fuel generation in the form of 6.8 TWh of coal generation and 1.3 TWh of diesel generation. Wind generation increases from 0.3 TWh in the reference scenario to 5.6 TWh in the RE scenario. Solar generates 2.1 TWh whilst landfill gas, biomass, biogas and small hydro contribute an additional 0.6 TWh in the RE scenario. Lower levels of fossil fuel based generation in the power system results in 8.4 million tonnes of carbon dioxide emissions being avoided annually due to the introduction of renewables in the RE scenario. Carbon emission reductions are
250
255
260
265
270
275
280
285
290
Reference RE scenario
TWh
Coal Nuclear Hydro Wind
Pumped storage Diesel Solar Landfill gas
Biomass Biogas
Displacement of fossil fuels
Carbon emissions
13 | Costs and benefits of implementing renewable energy policy in South Africa, Results of a power system model of the South African electricity system - 18-08-2011
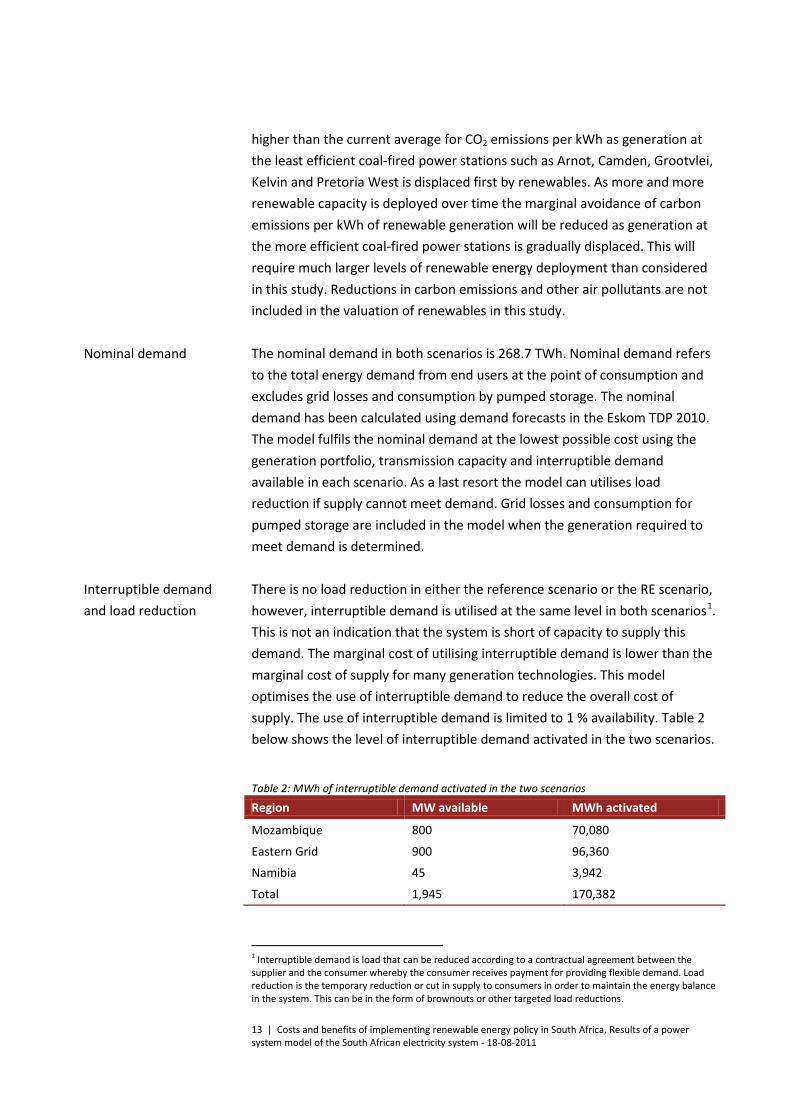
higher than the current average for CO2 emissions per kWh as generation at the least efficient coal-fired power stations such as Arnot, Camden, Grootvlei, Kelvin and Pretoria West is displaced first by renewables. As more and more renewable capacity is deployed over time the marginal avoidance of carbon emissions per kWh of renewable generation will be reduced as generation at the more efficient coal-fired power stations is gradually displaced. This will require much larger levels of renewable energy deployment than considered in this study. Reductions in carbon emissions and other air pollutants are not included in the valuation of renewables in this study. The nominal demand in both scenarios is 268.7 TWh. Nominal demand refers to the total energy demand from end users at the point of consumption and excludes grid losses and consumption by pumped storage. The nominal demand has been calculated using demand forecasts in the Eskom TDP 2010. The model fulfils the nominal demand at the lowest possible cost using the generation portfolio, transmission capacity and interruptible demand available in each scenario. As a last resort the model can utilises load reduction if supply cannot meet demand. Grid losses and consumption for pumped storage are included in the model when the generation required to meet demand is determined. There is no load reduction in either the reference scenario or the RE scenario, however, interruptible demand is utilised at the same level in both scenarios1
Table 2
. This is not an indication that the system is short of capacity to supply this demand. The marginal cost of utilising interruptible demand is lower than the marginal cost of supply for many generation technologies. This model optimises the use of interruptible demand to reduce the overall cost of supply. The use of interruptible demand is limited to 1 % availability. below shows the level of interruptible demand activated in the two scenarios.
Table 2: MWh of interruptible demand activated in the two scenarios
Region MW available MWh activated
Mozambique 800 70,080
Eastern Grid 900 96,360
Namibia 45 3,942
Total 1,945 170,382
1 Interruptible demand is load that can be reduced according to a contractual agreement between the supplier and the consumer whereby the consumer receives payment for providing flexible demand. Load reduction is the temporary reduction or cut in supply to consumers in order to maintain the energy balance in the system. This can be in the form of brownouts or other targeted load reductions.
Nominal demand
Interruptible demand and load reduction
14 | Costs and benefits of implementing renewable energy policy in South Africa, Results of a power system model of the South African electricity system - 18-08-2011
In the reference scenario interruptible demand is generally activated during the winter peak and when unplanned outages occur. The model distributes planned outages for each unit of each power station according to the demand profile and availability of other generating units in the power system. Unplanned outages have been included in the model stochastically. In other words they occur randomly based on data from NIRP 3 and ERC. The model compensates for unplanned outages using the least cost option available. This is sometimes interruptible demand. The power system in the RE scenario is more robust with regards supplying the winter peak and dealing with unplanned outages due to the additional 3.6 GW of capacity from renewables. The presence of interruptible demand provides additional flexibility for integrating variable generation in the RE scenario. The interruptible demand is often activated in periods where production from variable generation is low. The use of interruptible demand in this manner is an important reason why start-up costs are unchanged in the two scenarios despite the addition of large amounts of variable generation. The wind profile in the model is the same for all regions due to a lack of good wind data. This results in much larger variability of generation in the model as there is no geographical smoothing of wind power generation. In other words all 1,850 MW of wind power have exactly the same generation profile. This implies that the wind speed is the same everywhere in South Africa at exactly the same time. This is obviously not the case in reality. Once better wind data is available for the different regions it will be included in the model. Regional differences in solar resources are already included in the model. Transmission and generation can be considered competing technologies when determining how to satisfy a demand for electricity. Transmission can transport electricity from generation far from the demand load or generation can be built close to the demand load. South Africa has traditionally concentrated its power stations around coal resources and utilised transmission capacity to transport the produced electricity to demand loads, sometimes over distances of up to 2,000km. The deployment of renewables in South Africa is expected to be in areas that are currently reliant on transmission for satisfying demand. The reference scenario utilises transmission for supplying demand in these areas whilst in the RE scenario generation capacity is deployed in some of these areas.
Power plant outages
Variable generation
Marginal value of transmission capacity
15 | Costs and benefits of implementing renewable energy policy in South Africa, Results of a power system model of the South African electricity system - 18-08-2011
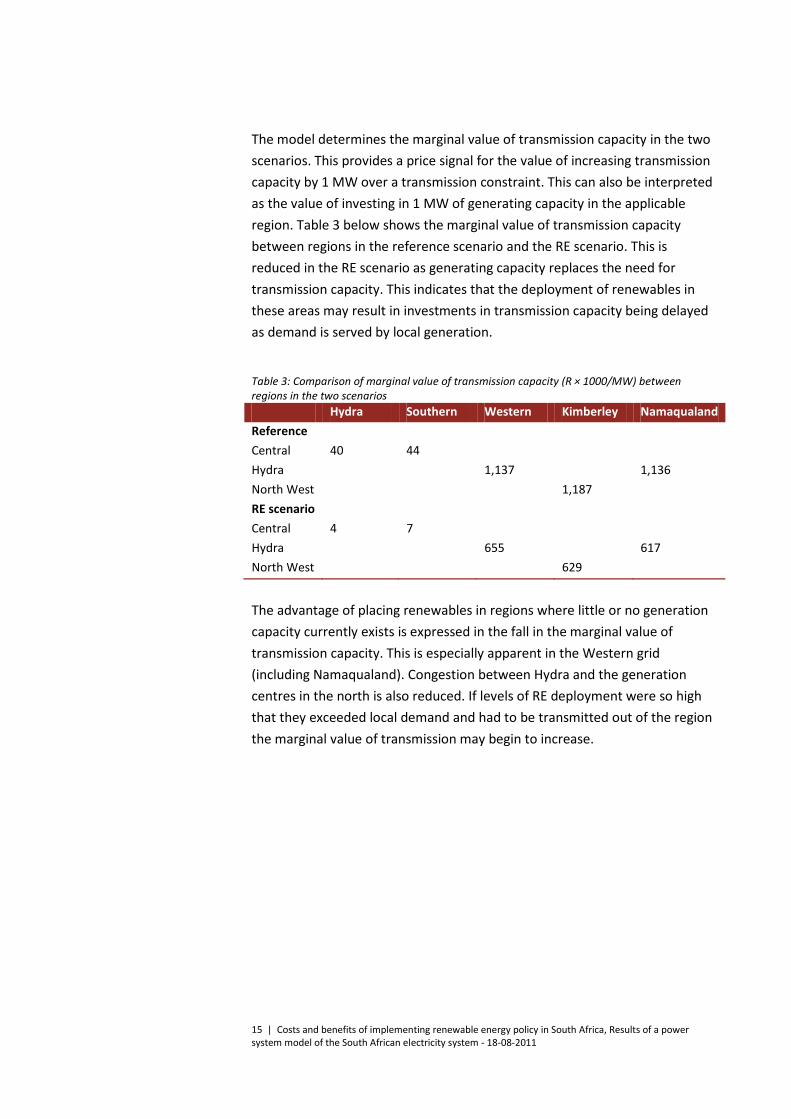
The model determines the marginal value of transmission capacity in the two scenarios. This provides a price signal for the value of increasing transmission capacity by 1 MW over a transmission constraint. This can also be interpreted as the value of investing in 1 MW of generating capacity in the applicable region. Table 3 below shows the marginal value of transmission capacity between regions in the reference scenario and the RE scenario. This is reduced in the RE scenario as generating capacity replaces the need for transmission capacity. This indicates that the deployment of renewables in these areas may result in investments in transmission capacity being delayed as demand is served by local generation.
Table 3: Comparison of marginal value of transmission capacity (R × 1000/MW) between regions in the two scenarios Hydra Southern Western Kimberley Namaqualand Reference Central 40 44 Hydra 1,137 1,136 North West 1,187 RE scenario Central 4 7 Hydra 655 617 North West 629
The advantage of placing renewables in regions where little or no generation capacity currently exists is expressed in the fall in the marginal value of transmission capacity. This is especially apparent in the Western grid (including Namaqualand). Congestion between Hydra and the generation centres in the north is also reduced. If levels of RE deployment were so high that they exceeded local demand and had to be transmitted out of the region the marginal value of transmission may begin to increase.

16 | Costs and benefits of implementing renewable energy policy in South Africa, Results of a power system model of the South African electricity system - 18-08-2011
6 Description of the model and data used The analysis was carried out using the Balmorel model, which is an economic/technical partial equilibrium model that simulates the power system and market. The model optimises the production at existing and planned production units (chosen by the user). It can also allow new investments in generating capacity and transmission capacity to be made in scenarios. These are chosen by the model on a cost minimising basis. For the purpose of this study the model contains technical and economic data on existing and planned generating units in the South African power system that are expected to be active in 2015. In order to simulate the economic dispatch of generation capacity as realistically as possible the model considers the most important transmission constraints in the electricity system. This is done by specifying geographically distinct entities in the model divided into countries, regions and areas. Each country is constituted by one or more region while each region contains zero or more areas. Any area may only be included in one region, and any region may only be included in one country. Figure 3 below illustrates how the model is built up using the geographical entities in Balmorel.
Figure 3: The geographical entities used in the model of the South African power system. Electricity balances are given on a regional basis. In each region an electricity balance must be fulfilled in the model either by generation, the transmission of electricity into or out of the region or a combination of generation and transmission. When using transmission for exchange of electricity between
Countries
Regions
Areas
Electricaltransmission
Region Region
Building the model
17 | Costs and benefits of implementing renewable energy policy in South Africa, Results of a power system model of the South African electricity system - 18-08-2011
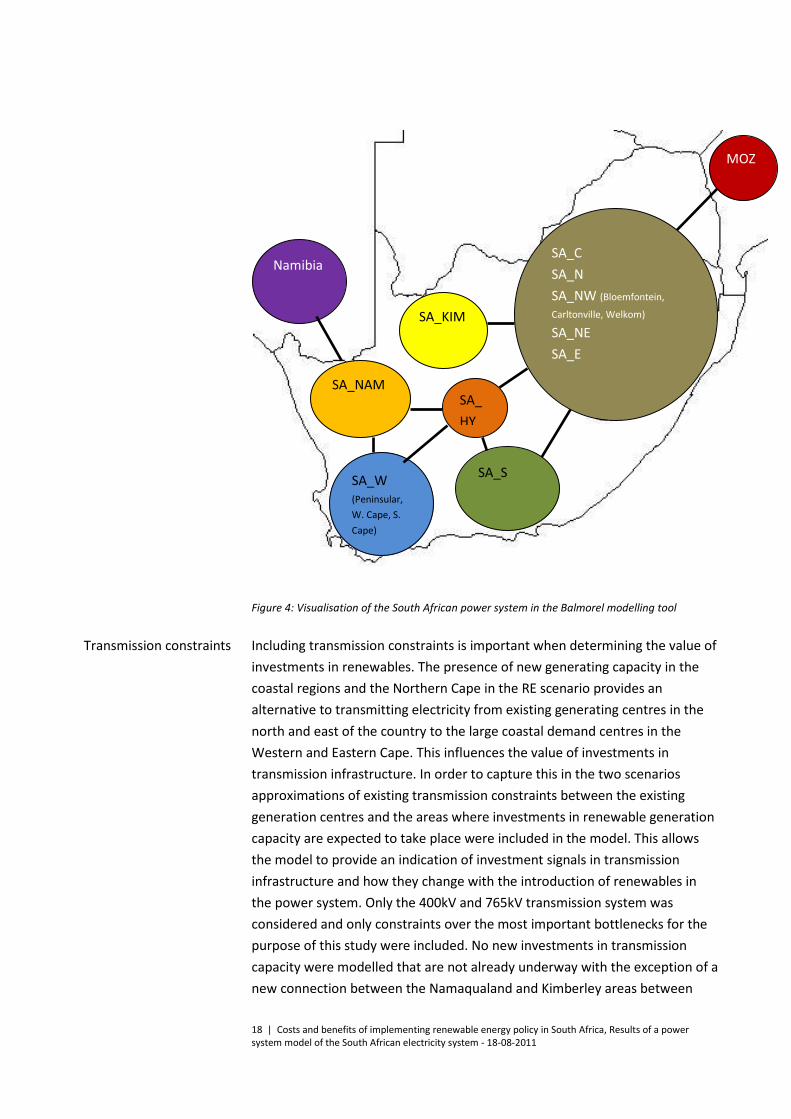
regions transmission constraints, losses and costs are included. This is the motivation for the concept of regions and allows the model to determine the value of placing infrastructure investments in different regions of a power system as well as the different costs associated with generating and consuming electricity in different regions in the same country. A number of regions constitute a country. A country does not have any generation or consumption apart from that which follows as the sum of the regions in the country. However, a number of characteristics may be identical for all entities in a country (e.g. generation units, demands, prices and taxes). A country is constituted of more than one region when required to represent constraints in the electricity transmission system within the country that limit the ability of generating capacity in one region to supply another region with electricity. The South African power system has been modelled in Balmorel based on Eskom’s seven regional grids and the areas within these regions. The map in Figure 4 below shows how the power system was constructed in the model. The connection lines between regions indicate a transmission constraint in the model. It is not possible to have constraints between areas in Balmorel, only between regions, so two of the Eskom areas are modelled as regions, viz. Namaqualand and Kimberley. Major solar developments are expected here that may influence the availability of transmission capacity. A region, Hydra, has been created to represent the constraint along the Cape corridor at Hydra transformer station. Each region in the model has demand and generation based on data from TDP2010 and the positioning of power stations.
South African power system
18 | Costs and benefits of implementing renewable energy policy in South Africa, Results of a power system model of the South African electricity system - 18-08-2011
Figure 4: Visualisation of the South African power system in the Balmorel modelling tool Including transmission constraints is important when determining the value of investments in renewables. The presence of new generating capacity in the coastal regions and the Northern Cape in the RE scenario provides an alternative to transmitting electricity from existing generating centres in the north and east of the country to the large coastal demand centres in the Western and Eastern Cape. This influences the value of investments in transmission infrastructure. In order to capture this in the two scenarios approximations of existing transmission constraints between the existing generation centres and the areas where investments in renewable generation capacity are expected to take place were included in the model. This allows the model to provide an indication of investment signals in transmission infrastructure and how they change with the introduction of renewables in the power system. Only the 400kV and 765kV transmission system was considered and only constraints over the most important bottlenecks for the purpose of this study were included. No new investments in transmission capacity were modelled that are not already underway with the exception of a new connection between the Namaqualand and Kimberley areas between
Transmission constraints
Namibia
SA_W (Peninsular, W. Cape, S. Cape)
SA_NAM SA_HY
SA_S
SA_KIM
MOZ
SA_C SA_N SA_NW (Bloemfontein,
Carltonville, Welkom) SA_NE SA_E
19 | Costs and benefits of implementing renewable energy policy in South Africa, Results of a power system model of the South African electricity system - 18-08-2011
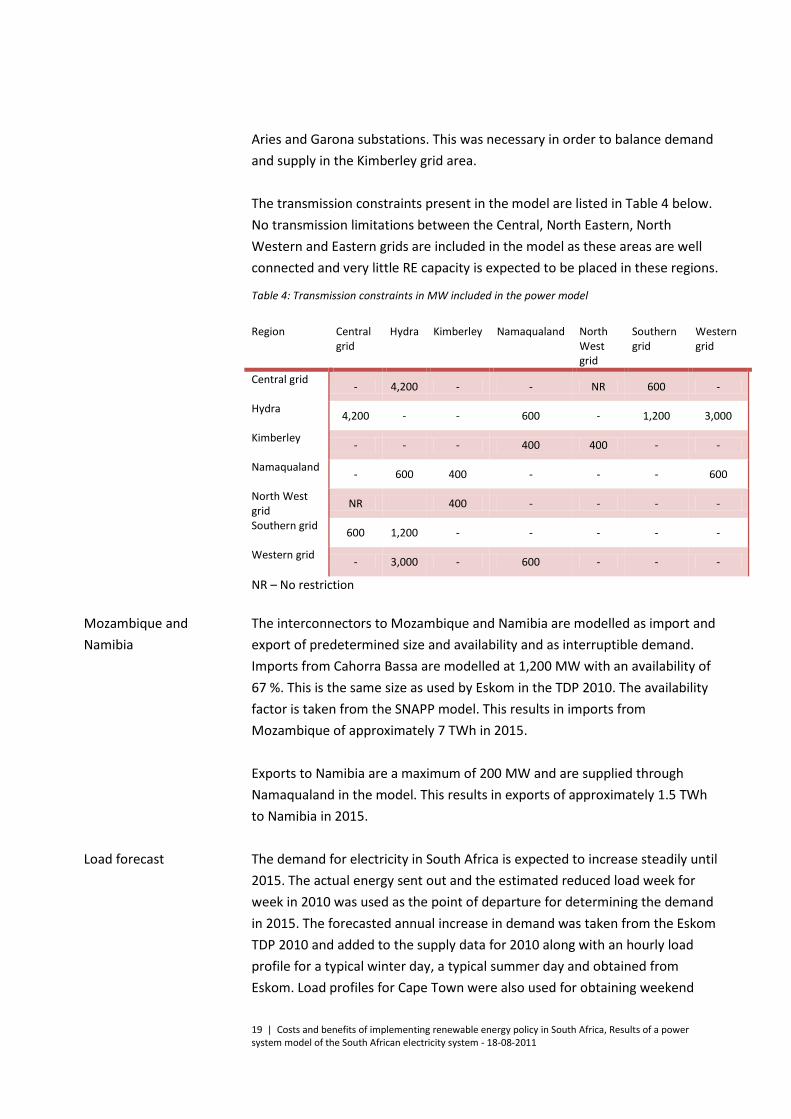
Aries and Garona substations. This was necessary in order to balance demand and supply in the Kimberley grid area. The transmission constraints present in the model are listed in Table 4 below. No transmission limitations between the Central, North Eastern, North Western and Eastern grids are included in the model as these areas are well connected and very little RE capacity is expected to be placed in these regions.
Table 4: Transmission constraints in MW included in the power model Region Central
grid Hydra Kimberley Namaqualand North
West grid
Southern grid
Western grid
Central grid - 4,200 - - NR 600 -
Hydra 4,200 - - 600 - 1,200 3,000
Kimberley - - - 400 400 - -
Namaqualand - 600 400 - - - 600
North West grid NR 400 - - - -
Southern grid 600 1,200 - - - - -
Western grid - 3,000 - 600 - - -
NR – No restriction The interconnectors to Mozambique and Namibia are modelled as import and export of predetermined size and availability and as interruptible demand. Imports from Cahorra Bassa are modelled at 1,200 MW with an availability of 67 %. This is the same size as used by Eskom in the TDP 2010. The availability factor is taken from the SNAPP model. This results in imports from Mozambique of approximately 7 TWh in 2015. Exports to Namibia are a maximum of 200 MW and are supplied through Namaqualand in the model. This results in exports of approximately 1.5 TWh to Namibia in 2015. The demand for electricity in South Africa is expected to increase steadily until 2015. The actual energy sent out and the estimated reduced load week for week in 2010 was used as the point of departure for determining the demand in 2015. The forecasted annual increase in demand was taken from the Eskom TDP 2010 and added to the supply data for 2010 along with an hourly load profile for a typical winter day, a typical summer day and obtained from Eskom. Load profiles for Cape Town were also used for obtaining weekend
Mozambique and Namibia
Load forecast

20 | Costs and benefits of implementing renewable energy policy in South Africa, Results of a power system model of the South African electricity system - 18-08-2011
load profiles for summer and winter. This provided a demand forecast and an hourly profile for consumption that was used in the scenarios. The total nominal demand in South Africa in 2015 as calculated by the model is 268.7 TWh. This demand is divided between the regions in the model as shown in Figure 5 below. Nominal demand refers to the energy demand at the point of consumption. More energy must be generated to meet the demand as grid losses and consumption for pumped storage must also be taken into account. Electricity consumed by pump storage is modelled as a generation loss rather than an end user demand.
Figure 5: Annual nominal demand in the regions in 2015 The model is also fitted with price responsive interruptible demand and the option of activating load reductions as a last resort. Data on interruptible demand is taken from NIRP 3. Interruptible demand can be disconnected when the marginal cost of electricity exceeds the price for interrupting the load; however, each interruptible demand market participant can at most be disconnected 1% of the time. An additional 3,500 MW of load reduction is included in the model in order to reflect the option for the System Operator to activate load reduction through various programmes and initiatives. Load reduction is an action of last resort. This is represented by having a high marginal cost of activation, which is set at R3,500/MWh. The load reduction is positioned in the central grid in the model. Interruptible demand and load reduction are shown in Table 5 below.
66,4
53,6 47,0
37,5
27,7
20,3
11,3
4,0 1,0
-
10,0
20,0
30,0
40,0
50,0
60,0
70,0
TWh
Interruptible demand
21 | Costs and benefits of implementing renewable energy policy in South Africa, Results of a power system model of the South African electricity system - 18-08-2011
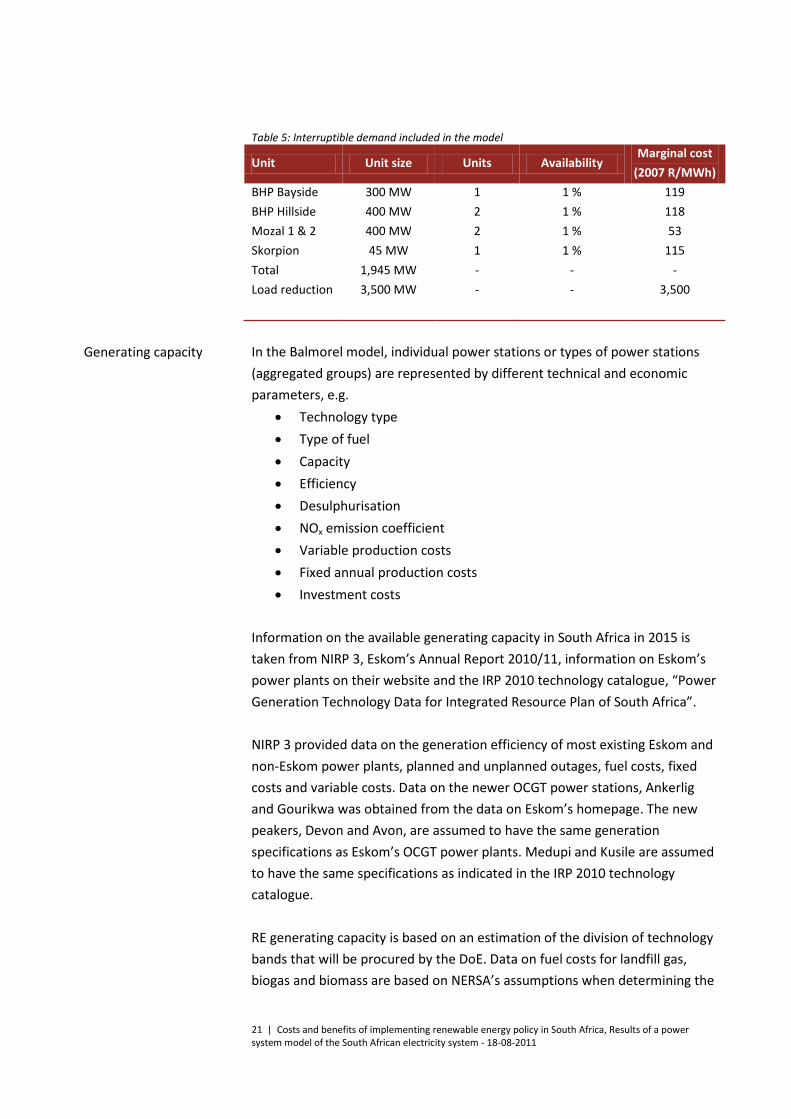
Table 5: Interruptible demand included in the model
Unit Unit size Units Availability Marginal cost
(2007 R/MWh) BHP Bayside 300 MW 1 1 % 119 BHP Hillside 400 MW 2 1 % 118 Mozal 1 & 2 400 MW 2 1 % 53 Skorpion 45 MW 1 1 % 115 Total 1,945 MW - - - Load reduction 3,500 MW - - 3,500
In the Balmorel model, individual power stations or types of power stations (aggregated groups) are represented by different technical and economic parameters, e.g.
• Technology type • Type of fuel • Capacity • Efficiency • Desulphurisation • NOx emission coefficient • Variable production costs • Fixed annual production costs • Investment costs
Information on the available generating capacity in South Africa in 2015 is taken from NIRP 3, Eskom’s Annual Report 2010/11, information on Eskom’s power plants on their website and the IRP 2010 technology catalogue, “Power Generation Technology Data for Integrated Resource Plan of South Africa”. NIRP 3 provided data on the generation efficiency of most existing Eskom and non-Eskom power plants, planned and unplanned outages, fuel costs, fixed costs and variable costs. Data on the newer OCGT power stations, Ankerlig and Gourikwa was obtained from the data on Eskom’s homepage. The new peakers, Devon and Avon, are assumed to have the same generation specifications as Eskom’s OCGT power plants. Medupi and Kusile are assumed to have the same specifications as indicated in the IRP 2010 technology catalogue. RE generating capacity is based on an estimation of the division of technology bands that will be procured by the DoE. Data on fuel costs for landfill gas, biogas and biomass are based on NERSA’s assumptions when determining the
Generating capacity
22 | Costs and benefits of implementing renewable energy policy in South Africa, Results of a power system model of the South African electricity system - 18-08-2011
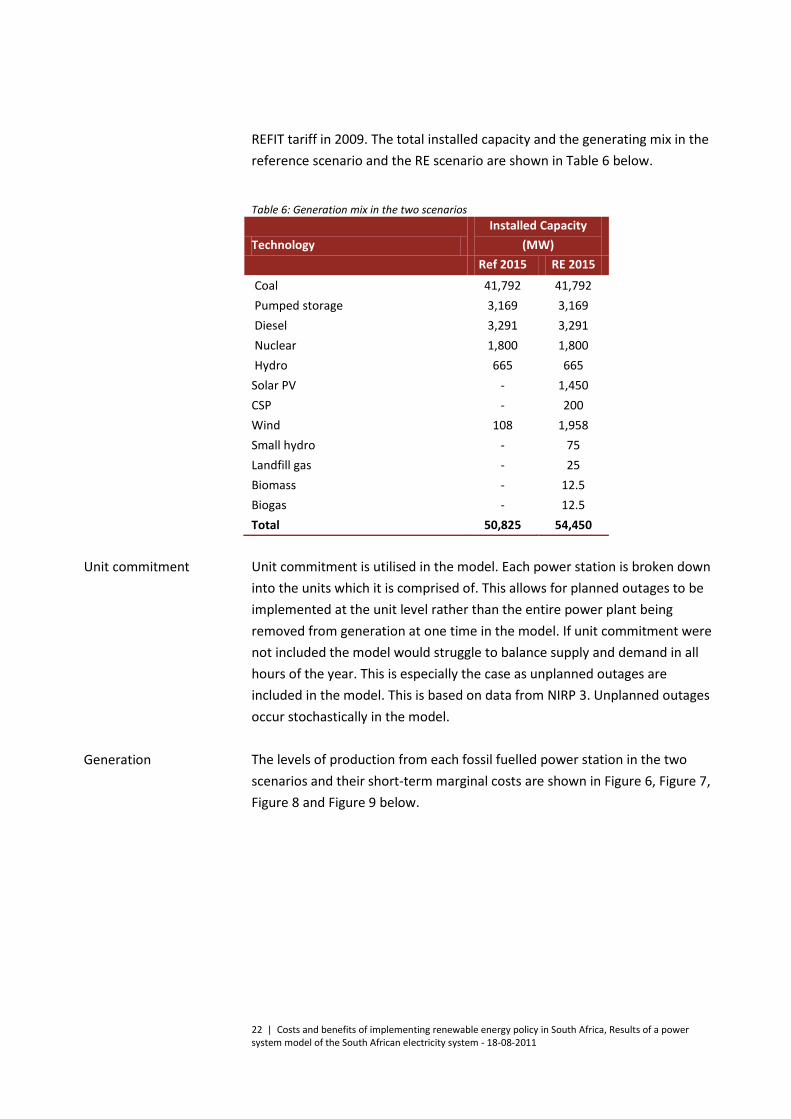
REFIT tariff in 2009. The total installed capacity and the generating mix in the reference scenario and the RE scenario are shown in Table 6 below.
Table 6: Generation mix in the two scenarios
Technology Installed Capacity
(MW) Ref 2015 RE 2015
Coal 41,792 41,792 Pumped storage 3,169 3,169 Diesel 3,291 3,291 Nuclear 1,800 1,800 Hydro 665 665 Solar PV - 1,450 CSP - 200 Wind 108 1,958 Small hydro - 75 Landfill gas - 25 Biomass - 12.5 Biogas - 12.5 Total 50,825 54,450 Unit commitment is utilised in the model. Each power station is broken down into the units which it is comprised of. This allows for planned outages to be implemented at the unit level rather than the entire power plant being removed from generation at one time in the model. If unit commitment were not included the model would struggle to balance supply and demand in all hours of the year. This is especially the case as unplanned outages are included in the model. This is based on data from NIRP 3. Unplanned outages occur stochastically in the model. The levels of production from each fossil fuelled power station in the two scenarios and their short-term marginal costs are shown in Figure 6, Figure 7, Figure 8 and Figure 9 below.
Unit commitment
Generation
23 | Costs and benefits of implementing renewable energy policy in South Africa, Results of a power system model of the South African electricity system - 18-08-2011
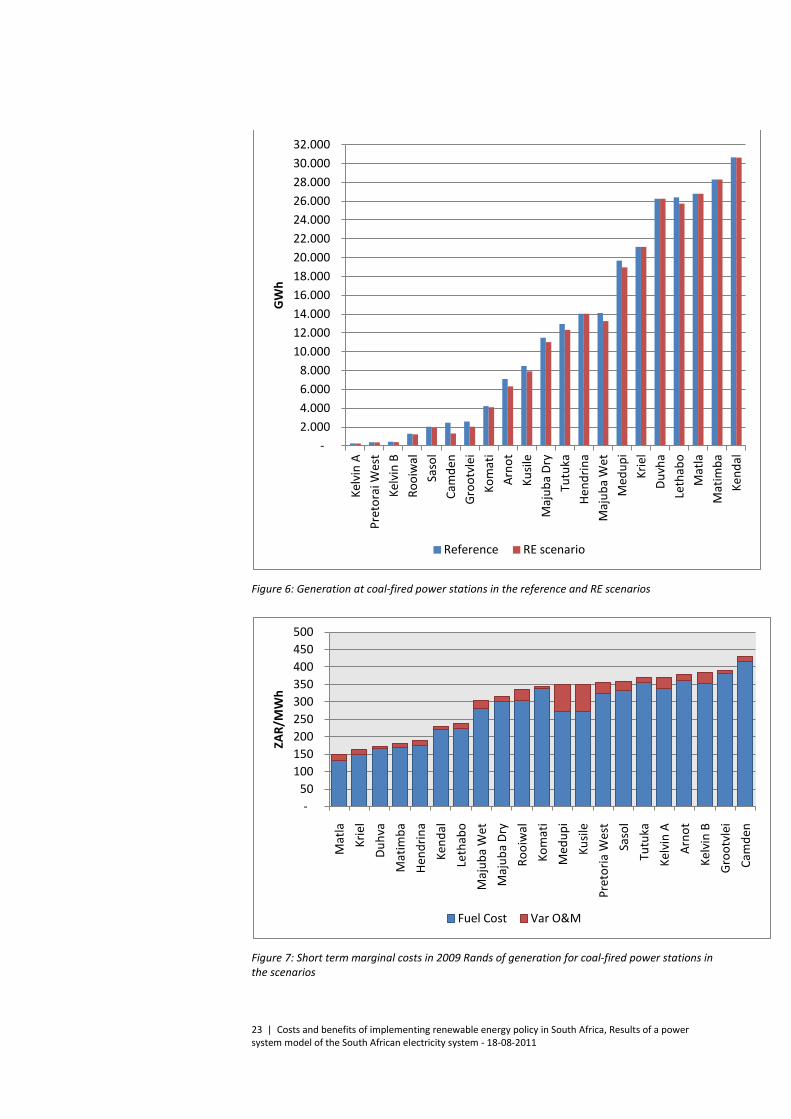
Figure 6: Generation at coal-fired power stations in the reference and RE scenarios
Figure 7: Short term marginal costs in 2009 Rands of generation for coal-fired power stations in the scenarios
- 2.000 4.000 6.000 8.000
10.000 12.000 14.000 16.000 18.000 20.000 22.000 24.000 26.000 28.000 30.000 32.000
Kelv
in A
Pr
etor
ai W
est
Kelv
in B
Ro
oiw
al
Saso
l Ca
mde
n Gr
ootv
lei
Kom
ati
Arno
t Ku
sile
Maj
uba
Dry
Tutu
ka
Hend
rina
Maj
uba
Wet
M
edup
i Kr
iel
Duvh
a Le
thab
o M
atla
M
atim
ba
Kend
al
GW
h
Reference RE scenario
- 50
100 150 200 250 300 350 400 450 500
Mat
la
Krie
l Du
hva
Mat
imba
He
ndrin
a Ke
ndal
Le
thab
o M
ajub
a W
et
Maj
uba
Dry
Rooi
wal
Ko
mat
i M
edup
i Ku
sile
Pret
oria
Wes
t Sa
sol
Tutu
ka
Kelv
in A
Ar
not
Kelv
in B
Gr
ootv
lei
Cam
den
ZAR/
MW
h
Fuel Cost Var O&M
24 | Costs and benefits of implementing renewable energy policy in South Africa, Results of a power system model of the South African electricity system - 18-08-2011
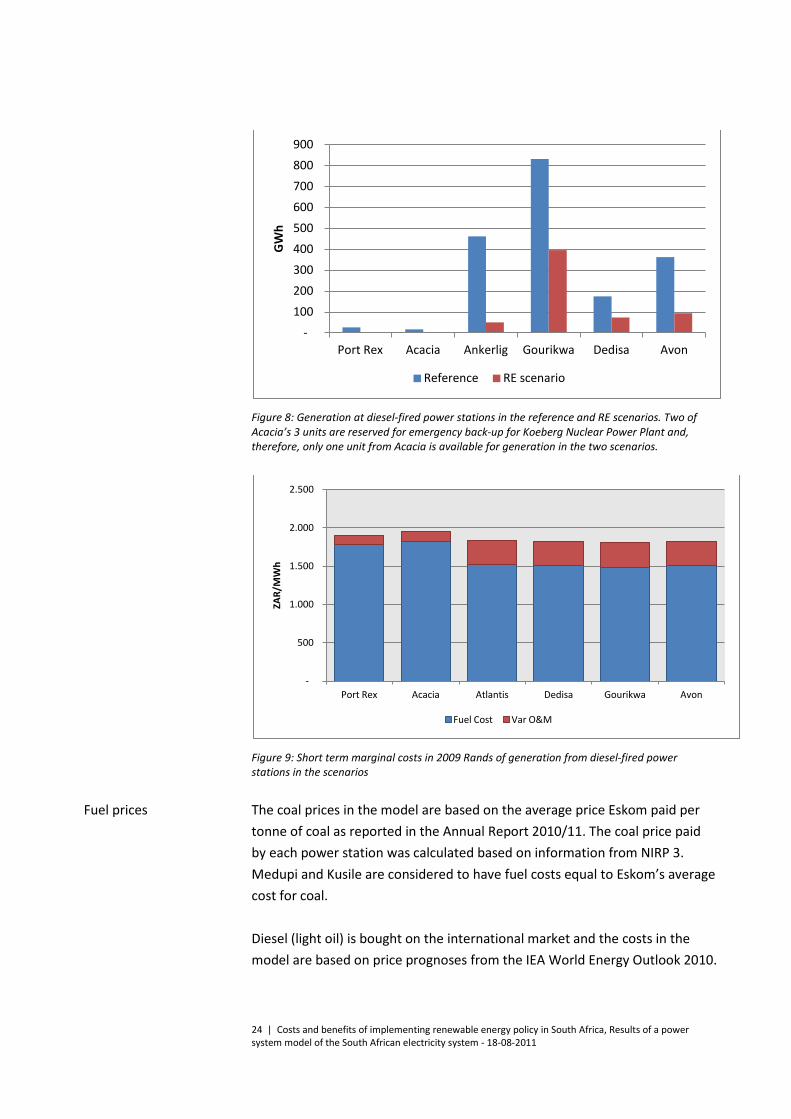
Figure 8: Generation at diesel-fired power stations in the reference and RE scenarios. Two of Acacia’s 3 units are reserved for emergency back-up for Koeberg Nuclear Power Plant and, therefore, only one unit from Acacia is available for generation in the two scenarios.
Figure 9: Short term marginal costs in 2009 Rands of generation from diesel-fired power stations in the scenarios The coal prices in the model are based on the average price Eskom paid per tonne of coal as reported in the Annual Report 2010/11. The coal price paid by each power station was calculated based on information from NIRP 3. Medupi and Kusile are considered to have fuel costs equal to Eskom’s average cost for coal. Diesel (light oil) is bought on the international market and the costs in the model are based on price prognoses from the IEA World Energy Outlook 2010.
- 100 200 300 400 500 600 700 800 900
Port Rex Acacia Ankerlig Gourikwa Dedisa Avon
GW
h
Reference RE scenario
-
500
1.000
1.500
2.000
2.500
Port Rex Acacia Atlantis Dedisa Gourikwa Avon
ZAR/
MW
h
Fuel Cost Var O&M
Fuel prices

25 | Costs and benefits of implementing renewable energy policy in South Africa, Results of a power system model of the South African electricity system - 18-08-2011
Biomass and landfill gas prices are taken from NERSA. Figure 10 below shows the fuel prices used in the model for power stations in the model.
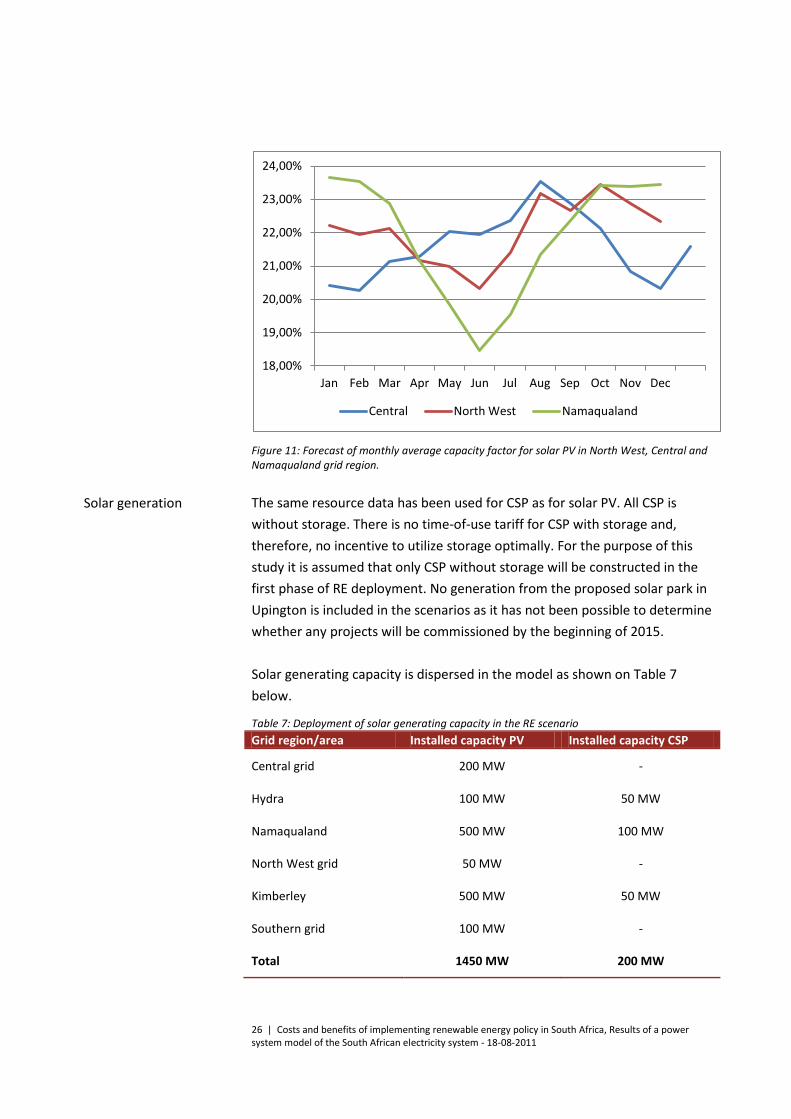
Figure 10: Fuel prices used in the model Solar resources are taken from the EC project “Photovoltaic Geographical Information System”. The project provides a map-based inventory of solar energy resource and assessment of the electricity generation from photovoltaic systems in Europe and Africa. Solar data was available in the form of average production every hour over a day in each month of the year. Solar data was acquired from PVGIS for Namaqualand, Northern Cape, North West, Gauteng, Eastern Cape, Karoo and Limpopo. The results showed that there are different seasonal solar generation profiles in different areas of South Africa. There are areas with higher capacity factors in the summer months and areas with higher capacity factors in the winter months. There are higher annual capacity factors in areas with the summer profile, but the higher levels of generation in winter for areas on the Highveld and Lowveld may give greater value to solar power in these areas. They are also closer to the largest demand centres in the country. There may be advantages for the power system in ensuring that solar capacity is dispersed in both the summer and the winter profile areas in order to ensure generation from solar resources when the electricity is most needed. Three examples of solar capacity factor profiles are shown in Figure 11 below.
3 8 13 15 15 16 17 21 22 22 22 23 23 24 24 25 28 29 29 32 37
208
-
50
100
150
200
250
ZAR/
GJ
Solar resources
26 | Costs and benefits of implementing renewable energy policy in South Africa, Results of a power system model of the South African electricity system - 18-08-2011
Figure 11: Forecast of monthly average capacity factor for solar PV in North West, Central and Namaqualand grid region. The same resource data has been used for CSP as for solar PV. All CSP is without storage. There is no time-of-use tariff for CSP with storage and, therefore, no incentive to utilize storage optimally. For the purpose of this study it is assumed that only CSP without storage will be constructed in the first phase of RE deployment. No generation from the proposed solar park in Upington is included in the scenarios as it has not been possible to determine whether any projects will be commissioned by the beginning of 2015. Solar generating capacity is dispersed in the model as shown on Table 7 below.
Table 7: Deployment of solar generating capacity in the RE scenario Grid region/area Installed capacity PV Installed capacity CSP
Central grid 200 MW -
Hydra 100 MW 50 MW
Namaqualand 500 MW 100 MW
North West grid 50 MW -
Kimberley 500 MW 50 MW
Southern grid 100 MW -
Total 1450 MW 200 MW
18,00%
19,00%
20,00%
21,00%
22,00%
23,00%
24,00%
Jan Feb Mar Apr May Jun Jul Aug Sep Oct Nov Dec
Central North West Namaqualand
Solar generation
27 | Costs and benefits of implementing renewable energy policy in South Africa, Results of a power system model of the South African electricity system - 18-08-2011
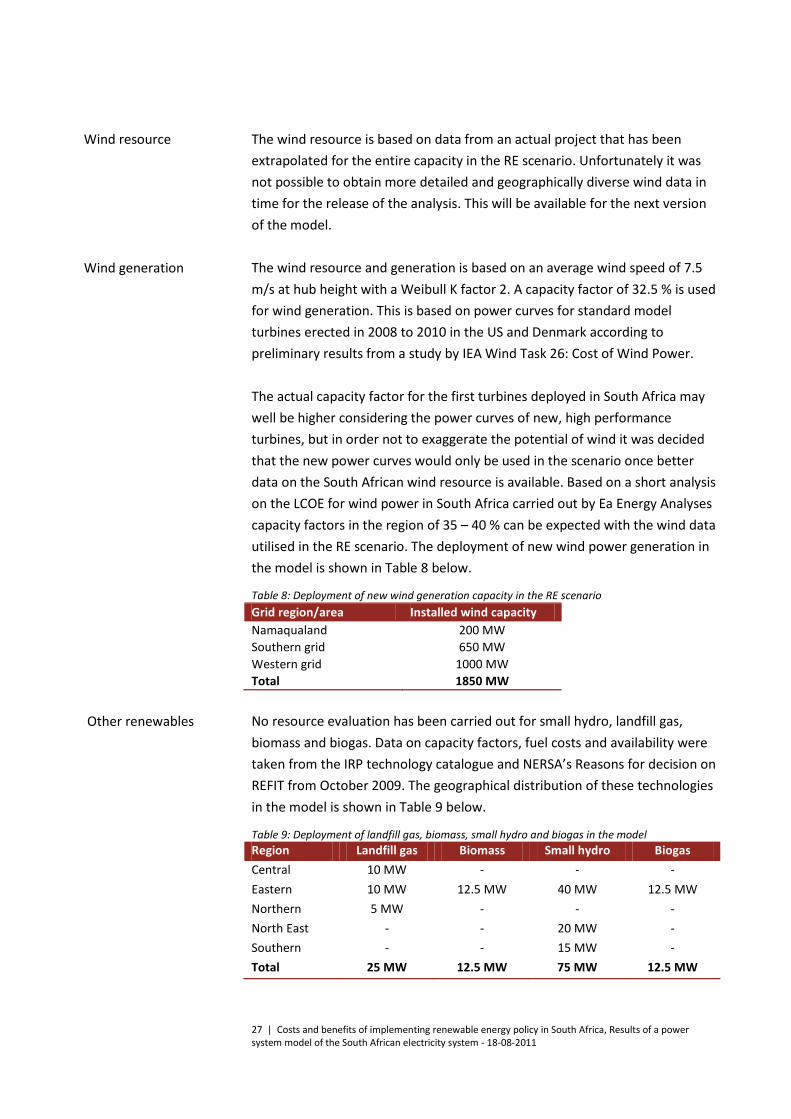
The wind resource is based on data from an actual project that has been extrapolated for the entire capacity in the RE scenario. Unfortunately it was not possible to obtain more detailed and geographically diverse wind data in time for the release of the analysis. This will be available for the next version of the model. The wind resource and generation is based on an average wind speed of 7.5 m/s at hub height with a Weibull K factor 2. A capacity factor of 32.5 % is used for wind generation. This is based on power curves for standard model turbines erected in 2008 to 2010 in the US and Denmark according to preliminary results from a study by IEA Wind Task 26: Cost of Wind Power. The actual capacity factor for the first turbines deployed in South Africa may well be higher considering the power curves of new, high performance turbines, but in order not to exaggerate the potential of wind it was decided that the new power curves would only be used in the scenario once better data on the South African wind resource is available. Based on a short analysis on the LCOE for wind power in South Africa carried out by Ea Energy Analyses capacity factors in the region of 35 – 40 % can be expected with the wind data utilised in the RE scenario. The deployment of new wind power generation in the model is shown in Table 8 below.
Table 8: Deployment of new wind generation capacity in the RE scenario Grid region/area Installed wind capacity Namaqualand 200 MW Southern grid 650 MW Western grid 1000 MW Total 1850 MW No resource evaluation has been carried out for small hydro, landfill gas, biomass and biogas. Data on capacity factors, fuel costs and availability were taken from the IRP technology catalogue and NERSA’s Reasons for decision on REFIT from October 2009. The geographical distribution of these technologies in the model is shown in Table 9 below.
Table 9: Deployment of landfill gas, biomass, small hydro and biogas in the model Region Landfill gas Biomass Small hydro Biogas Central 10 MW - - - Eastern 10 MW 12.5 MW 40 MW 12.5 MW Northern 5 MW - - - North East - - 20 MW - Southern - - 15 MW - Total 25 MW 12.5 MW 75 MW 12.5 MW
Wind resource
Wind generation
Other renewables