costar office report - nai san diego diego office mkt...san diego office market ©2007 costar group,...
TRANSCRIPT

San Diego Office MarketM I D - Y E A R 2 0 0 7
The CoStarOffice Report

San Diego Office Market
©2007 COSTAR GROUP, INC. THE COSTAR OFFICE REPORT A
MID-YEAR 2007 – SAN DIEGO
Table of ContentsTable of Contents . . . . . . . . . . . . . . . . . . . . . . . . . . . . . . . . . . . . . . . . . . . . . . . . . . . . . . . . . . . . . . . . . . . . A
Methodology. . . . . . . . . . . . . . . . . . . . . . . . . . . . . . . . . . . . . . . . . . . . . . . . . . . . . . . . . . . . . . . . . . . . . . . . B
Terms & Definitions. . . . . . . . . . . . . . . . . . . . . . . . . . . . . . . . . . . . . . . . . . . . . . . . . . . . . . . . . . . . . . . . . . C
Market Highlights & Overview. . . . . . . . . . . . . . . . . . . . . . . . . . . . . . . . . . . . . . . . . . . . . . . . . . . . . . . . . 1
CoStar Markets & Submarkets . . . . . . . . . . . . . . . . . . . . . . . . . . . . . . . . . . . . . . . . . . . . . . . . . . . . . . . . . 4
Employment & Tenant Analysis . . . . . . . . . . . . . . . . . . . . . . . . . . . . . . . . . . . . . . . . . . . . . . . . . . . . . . . . 5Employment & Unemployment AnalysisTenant Profiles
Inventory & Development Analysis. . . . . . . . . . . . . . . . . . . . . . . . . . . . . . . . . . . . . . . . . . . . . . . . . . . . . . 7Construction Activity MapInventory & Development AnalysisSelect Top DeliveriesSelect Top Under Construction Properties
Figures at a Glance . . . . . . . . . . . . . . . . . . . . . . . . . . . . . . . . . . . . . . . . . . . . . . . . . . . . . . . . . . . . . . . . . . 12Figures at a Glance by Class & MarketFigures at a Glance by Class & SubmarketFigures at a Glance Grouped by CBD vs SuburbanHistorical Figures at a Glance
Leasing Activity Analysis . . . . . . . . . . . . . . . . . . . . . . . . . . . . . . . . . . . . . . . . . . . . . . . . . . . . . . . . . . . . . 17Leasing Activity MapLeasing Activity AnalysisSelect Top Lease Transactions
Sales Activity Analysis . . . . . . . . . . . . . . . . . . . . . . . . . . . . . . . . . . . . . . . . . . . . . . . . . . . . . . . . . . . . . . . 20Sales Activity AnalysisSelect Top Sales TransactionsSelect Same Building SalesSelect Land Sales
Analysis of Individual CoStar Markets . . . . . . . . . . . . . . . . . . . . . . . . . . . . . . . . . . . . . . . . . . . . . . . . . . 23Central Suburban MarketDowntown MarketHwy-78 Corridor MarketI-15 Corridor MarketNorth Cities MarketNorth County West MarketSouth/Southeast Corridor Market

San Diego Office Market
B THE COSTAR OFFICE REPORT ©2007 COSTAR GROUP, INC.
SAN DIEGO – MID-YEAR 2007
San Diego Office Market
©2007 COSTAR GROUP, INC. THE COSTAR OFFICE REPORT C
MID-YEAR 2007 – SAN DIEGO
Methodology
The CoStar Office Report, unless specifically stated otherwise, calculates office statistics using CoStar Group’s entire database of existing and under construction office buildings in each metropolitan area. Included are office, office condominium, office loft, office medical, all classes and all sizes, and both multi-tenant and single-tenant buildings, including owner-occupied buildings. CoStar Group's national database includes approximately 33.6 billion square feet of coverage in 1.2 million properties. All rental rates reported in the CoStar Office Report have been converted to a Full Service equivalent rental rate.
© Copyright 2007 CoStar Group, Inc. All Rights Reserved. Although CoStar makes efforts to ensure the accuracy and reliability of the information contained herein, CoStar makes no guarantee, representation or warranty regarding the quality, accuracy, timeliness or completeness of the information. The publication is provided ‘as is’ and CoStar expressly disclaims any guarantees, representations or warranties of any kind, including those of MERCHANTABILITY AND FITNESS FOR A PARTICULAR PURPOSE.
CoStar Group, Inc.
2 Bethesda Metro Center • Bethesda, MD USA 20814 • (800) 204-5960 • www.costar.com • NASDAQ: CSGP
For information on subscribing to CoStar’s Advisory reports, or for information
on CoStar’s other products and services, please contact us at 1-877-7COSTAR,
or visit our web site at www.costar.com

San Diego Office Market
B THE COSTAR OFFICE REPORT ©2007 COSTAR GROUP, INC.
SAN DIEGO – MID-YEAR 2007
San Diego Office Market
©2007 COSTAR GROUP, INC. THE COSTAR OFFICE REPORT C
MID-YEAR 2007 – SAN DIEGO
Terms & DefinitionsAvailability Rate: The ratio of available space to total rentable space, calculated by dividing the total available square feet by the total rentable square feet.
Available Space: The total amount of space that is currently being marketed as available for lease in a given time period. It includes any space that is available, regardless of whether the space is vacant, occupied, available for sublease, or available at a future date.
Build-to-Suit: A term describing a particular property, developed specifically for a certain tenant to occupy, with structural features, systems, or improvement work designed specifically for the needs of that tenant. A build-to-suit can be leased or owned by the ten-ant. In a leased build-to-suit, a tenant will usually have a long term lease on the space.
Buyer: The individual, group, company, or entity that has pur-chased a commercial real estate asset.
Cap Rate: Short for capitalization rate. The Cap Rate is a calcula-tion that reflects the relationship between one year’s net operating income and the current market value of a particular property. The Cap Rate is calculated by dividing the annual net operating income by the sales price (or asking sales price).
CBD: Abbreviation for Central Business District. (See also: Central Business District)
Central Business District: The designations of Central Business District (CBD) and Suburban refer to a particular geographic area within a metropolitan statistical area (MSA) describing the level of real estate development found there. The CBD is characterized by a high density, well organized core within the largest city of a given MSA.
Class A: A classification used to describe buildings that generally qualify as extremely desirable investment-grade properties and command the highest rents or sale prices compared to other buildings in the same market. Such buildings are well located and provide efficient tenant layouts as well as high quality, and in some buildings, one-of-a-kind floor plans. They can be an archi-tectural or historical landmark designed by prominent architects. These buildings contain a modern mechanical system, and have above-average maintenance and management as well as the best quality materials and workmanship in their trim and interior fit-tings. They are generally the most attractive and eagerly sought by investors willing to pay a premium for quality.
Class B: A classification used to describe buildings that generally qualify as a more speculative investment, and as such, command lower rents or sale prices compared to Class A properties. Such buildings offer utilitarian space without special attractions, and have ordinary design, if new or fairly new; good to excellent design if an older non-landmark building. These buildings typical-ly have average to good maintenance, management and tenants. They are less appealing to tenants than Class A properties, and may be deficient in a number of respects including floor plans, condition and facilities. They lack prestige and must depend chiefly on a lower price to attract tenants and investors.
Class C: A classification used to describe buildings that gener-ally qualify as no-frills, older buildings that offer basic space and command lower rents or sale prices compared to other buildings in the same market. Such buildings typically have below-average maintenance and management, and could have mixed or low tenant prestige, inferior elevators, and/or mechanical/electrical systems. These buildings lack prestige and must depend chiefly on a lower price to attract tenants and investors.
Construction Starts: Buildings that began construction during a specific period of time. (See also: Deliveries)
Contiguous Blocks of Space: Space within a building that is, or is able to be joined together into a single contiguous space.
Deliveries: Buildings that complete construction during a specified period of time. In order for space to be considered delivered, a certificate of occupancy must have been issued for the property.
Delivery Date: The date a building completes construction and receives a certificate of occupancy.
Developer: The company, entity or individual that transforms raw land to improved property by use of labor, capital and entrepre-neurial efforts.
Direct Space: Space that is being offered for lease directly from the landlord or owner of a building, as opposed to space being offered in a building by another tenant (or broker of a tenant) trying to sublet a space that has already been leased.
Existing Inventory: The square footage of buildings that have received a certificate of occupancy and are able to be occupied by tenants. It does not include space in buildings that are either planned, under construction or under renovation.
Flex Building: A type of building designed to be versatile, which may be used in combination with office (corporate headquarters), research and development, quasi-retail sales, and including but not limited to industrial, warehouse, and distribution uses. A typi-cal flex building will be one or two stories with at least half of the rentable area being used as office space, have ceiling heights of 16 feet or less, and have some type of drive-in door, even though the door may be glassed in or sealed off.
Full Service Rental Rate: Rental rates that include all operating expenses such as utilities, electricity, janitorial services, taxes and insurance.
Gross Absorption: The total change in occupied space over a given period of time, counting space that is occupied but not space that is vacated by tenants. Gross absorption differs from leasing Activity, which is the sum of all space leased over a certain period of time. Unless otherwise noted Gross Absorption includes direct and sublease space.
Growth in Inventory: The change in size of the existing square footage in a given area over a given period of time, generally due to the construction of new buildings.
Industrial Building: A type of building adapted for such uses as the assemblage, processing, and/or manufacturing of products from raw materials or fabricated parts. Additional uses include warehousing, distribution, and maintenance facilities. The pri-mary purpose of the space is for storing, producing, assembling, or distributing product.
Landlord Rep: (Landlord Representative) In a typical lease trans-action between an owner/landlord and tenant, the broker that represents the interests of the owner/landlord is referred to as the Landlord Rep.
Leased Space: All the space that has a financial lease obligation. It includes all leased space, regardless of whether the space is currently occupied by a tenant. Leased space also includes space being offered for sublease.
Leasing Activity: The volume of square footage that is commit-ted to and signed under a lease obligation for a specific building or market in a given period of time. It includes direct leases, subleases and renewals of existing leases. It also includes any pre-leasing activity in planned, under construction, or under renovation buildings.
Market: Geographic boundaries that serve to delineate core areas that are competitive with each other and constitute a generally accepted primary competitive set of areas. Markets are building-type specific, and are non-overlapping contiguous geographic designations having a cumulative sum that matches the boundar-ies of the entire Region (See also: Region). Markets can be further subdivided into Submarkets. (See also: Submarkets)

San Diego Office Market
D THE COSTAR OFFICE REPORT ©2007 COSTAR GROUP, INC.
SAN DIEGO – MID-YEAR 2007 MID-YEAR 2007 – SAN DIEGO
San Diego Office Market
©2007 COSTAR GROUP, INC. THE COSTAR OFFICE REPORT 1
Multi-Tenant: Buildings that house more than one tenant at a given time. Usually, multi-tenant buildings were designed and built to accommodate many different floor plans and designs for different tenant needs. (See also: Tenancy).
Net Absorption: The net change in occupied space over a given period of time. Unless otherwise noted Net Absorption includes direct and sublease space.
Net Rental Rate: A rental rate that excludes certain expenses that a tenant could incur in occupying office space. Such expenses are expected to be paid directly by the tenant and may include janitorial costs, electricity, utilities, taxes, insurance and other related costs.
New Space: Sometimes called first generation space, refers to space that has never been occupied and/or leased by a tenant.
Occupied Space: Space that is physically occupied by a tenant. It does not include leased space that is not currently occupied by a tenant.
Office Building: A type of commercial building used exclusively or primarily for office use (business), as opposed to manufactur-ing, warehousing, or other uses. Office buildings may sometimes have other associated uses within part of the building, i.e., retail sales, financial, or restaurant, usually on the ground floor.
Owner: The company, entity, or individual that holds title on a given building or property.
Planned/Proposed: The status of a building that has been announced for future development but not yet started construction.
Preleased Space: The amount of space in a building that has been leased prior to its construction completion date, or certificate of occupancy date.
Price/SF: Calculated by dividing the price of a building (either sales price or asking sales price) by the Rentable Building Area (RBA).
Property Manager: The company and/or person responsible for the day-to-day operations of a building, such as cleaning, trash removal, etc. The property manager also makes sure that the vari-ous systems within the building, such as the elevators, HVAC, and electrical systems, are functioning properly.
Quoted Rental Rate: The asking rate per square foot for a par-ticular building or unit of space by a broker or property owner. Quoted rental rates may differ from the actual rates paid by tenants following the negotiation of all terms and conditions in a specific lease.
RBA: Abbreviation for Rentable Building Area. (See also: Rentable Building Area)
Region: Core areas containing a large population nucleus, that together with adjacent communities have a high degree of eco-nomic and social integration. Regions are further divided into market areas, called Markets. (See also: Markets)
Relet Space: Sometimes called second generation or direct space, refers to existing space that has previously been occupied by another tenant.
Rentable Building Area: (RBA) The total square footage of a building that can be occupied by, or assigned to a tenant for the purpose of determining a tenant’s rental obligation. Generally RBA includes a percentage of common areas including all hall-ways, main lobbies, bathrooms, and telephone closets.
Rental Rates: The annual costs of occupancy for a particular space quoted on a per square foot basis.
Sales Price: The total dollar amount paid for a particular property at a particular point in time.
Sales Volume: The sum of sales prices for a given group of build-ings in a given time period.
Seller: The individual, group, company, or entity that sells a par-ticular commercial real estate asset.
SF: Abbreviation for Square Feet.
Single-Tenant: Buildings that are occupied, or intended to be occupied by a single tenant. (See also: Build-to-suit and Tenancy)
Sublease Space: Space that has been leased by a tenant and is being offered for lease back to the market by the tenant with the lease obligation. Sublease space is sometimes referred to as sublet space.
Submarkets: Specific geographic boundaries that serve to delin-eate a core group of buildings that are competitive with each other and constitute a generally accepted primary competitive set, or peer group. Submarkets are building type specific (office, industrial, retail, etc.), with distinct boundaries dependent on different factors relevant to each building type. Submarkets are non-overlapping, contiguous geographic designations having a cumulative sum that matches the boundaries of the Market they are located within (See also: Market).
Suburban: The Suburban and Central Business District (CBD) designations refer to a particular geographic area within a metro-politan statistical area (MSA). Suburban is defined as including all office inventory not located in the CBD. (See also: CBD)
Tenancy: A term used to indicate whether or not a building is occupied by multiple tenants (See also: Multi-tenant) or a single tenant. (See also: Single-tenant)
Tenant Rep: Tenant Rep stands for Tenant Representative. In a typical lease transaction between an owner/landlord and tenant, the broker that represents the interests of the tenant is referred to as a Tenant Rep.
Time On Market: A measure of how long a currently available space has been marketed for lease, regardless of whether it is vacant or occupied.
Under Construction: The status of a building that is in the process of being developed, assembled, built or constructed. A building is considered to be under construction after it has begun construc-tion and until it receives a certificate of occupancy.
Vacancy Rate: A measurement expressed as a percentage of the total amount of physically vacant space divided by the total amount of existing inventory. Under construction space generally is not included in vacancy calculations.
Vacant Space: Space that is not currently occupied by a tenant, regardless of any lease obligation that may be on the space. Vacant space could be space that is either available or not avail-able. For example, sublease space that is currently being paid for by a tenant but not occupied by that tenant, would be considered vacant space. Likewise, space that has been leased but not yet occupied because of finish work being done, would also be con-sidered vacant space.
Weighted Average Rental Rate: Rental rates that are calculated by factoring in, or weighting, the square footage associated with each particular rental rate. This has the effect of causing rental rates on larger spaces to affect the average more than that of smaller spaces. The weighted average rental rate is calculated by taking the ratio of the square footage associated with the rental rate on each individual available space to the square footage associated with rental rates on all available spaces, multiplying the rental rate by that ratio, and then adding together all the resulting numbers. Unless specifically specified otherwise, rental rate averages include both Direct and Sublet available spaces.
Year Built: The year in which a building completed construction and was issued a certificate of occupancy.
YTD: Abbreviation for Year-to-Date. Describes statistics that are cumulative from the beginning of a calendar year through what-ever time period is being studied.

San Diego Office Market
D THE COSTAR OFFICE REPORT ©2007 COSTAR GROUP, INC.
SAN DIEGO – MID-YEAR 2007 MID-YEAR 2007 – SAN DIEGO
San Diego Office Market
©2007 COSTAR GROUP, INC. THE COSTAR OFFICE REPORT 1
OVERVIEW
San Diego’s Vacancy Increases to 10.9% Net Absorption Positive 589,875 SF in the Quarter
The San Diego Office market ended the second quarter 2007 with a vacancy rate of 10.9%. The vacancy rate was up over the previous quarter, with net absorption
totaling positive 589,875 square feet in the second quarter. Vacant sublease space decreased in the quarter, ending the quarter at 1,051,088 square feet. Rental rates ended the second quarter at $31.95, an increase over the previous quarter. A total of 27 buildings delivered to the market in the quarter totaling 763,399 square feet, with 4,397,028 square feet still under construction at the end of the quarter.
AbsorptionNet absorption for the overall San Diego office market was
positive 589,875 square feet in the second quarter 2007. That compares to positive 398,548 square feet in the first quarter 2007, positive 361,968 square feet in the fourth quarter 2006, and nega-tive (64,214) square feet in the third quarter 2006.
Tenants moving out of large blocks of space in 2007 include: Conexant Systems moving out of 85,497 square feet at Conexant Bldg; NextWave Wireless, Inc. moving out of 56,816 square feet at Corporate Plaza Bldg A; and Qualcomm, Inc. moving out of 34,615 square feet at Pacific Technology Center.
Tenants moving into large blocks of space in 2007 include: Broadcom Company moving into 94,794 square feet at Discovery Corporate Center - Bldg. A; Amylin Pharmaceuticals, Inc. moving into 71,510 square feet at 9880 Campus Point Dr; and ViaSat moving into 60,000 square feet at Legacy NorthPointe - Bldg E - ViaSat Corporat.
The Class-A office market recorded net absorption of posi-tive 172,880 square feet in the second quarter 2007, compared
to positive 614,776 square feet in the first quarter 2007, positive 127,947 in the fourth quarter 2006, and negative (206,504) in the third quarter 2006.
The Class-B office market recorded net absorption of posi-tive 363,794 square feet in the second quarter 2007, compared to negative (187,275) square feet in the first quarter 2007, positive 198,017 in the fourth quarter 2006, and negative (15,406) in the third quarter 2006.
The Class-C office market recorded net absorption of posi-tive 53,201 square feet in the second quarter 2007 compared to negative (28,953) square feet in the first quarter 2007, positive 36,004 in the fourth quarter 2006, and positive 157,696 in the third quarter 2006.
Net absorption for San Diego’s central business district was positive 230,372 square feet in the second quarter 2007. That compares to negative (110,800) square feet in the first quarter 2007, negative (1,782) in the fourth quarter 2006, and positive 38,964 in the third quarter 2006.
Net absorption for the suburban markets was positive 359,503 square feet in the second quarter 2007. That compares to positive 509,348 square feet in first quarter 2007, positive 363,750 in the fourth quarter 2006, and negative (103,178) in the third quarter 2006.
VacancyThe office vacancy rate in the San Diego market area
increased to 10.9% at the end of the second quarter 2007. The vacancy rate was 10.8% at the end of the first quarter 2007, 10.3% at the end of the fourth quarter 2006, and 9.7% at the end of the third quarter 2006.
Vacancy Rates by Class 1999-2007
Source: CoStar Property®
Absorption & Deliveries U.S. Vacancy ComparisonPast 8 Quarters Past 8 Quarters
Source: CoStar Property• Source: CoStar Property•
4%
6%
8%
10%
12%
14%
16%
18%
20%
19992q
19994q
20002q
20004q
20012q
20014q
20022q
20024q
20032q
20034q
20042q
20044q
20052q
20054q
20062q
20064q
20072q
Vac
ancy
Rat
e
Class A Class B Class C Total Market
0.49
1.01
0.36
0.45
(0.06)
0.360.40
0.59
0.87
0.340.41
0.71 0.70
0.991.05
0.76
(0.2)
0.0
0.2
0.4
0.6
0.8
1.0
1.2
2005 3q 2005 4q 2006 1q 2006 2q 2006 3q 2006 4q 2007 1q 2007 2q
Millio
ns
SF
Net Absorption Deliveries
0.0%
2.0%
4.0%
6.0%
8.0%
10.0%
12.0%
14.0%
2005 3q 2005 4q 2006 1q 2006 2q 2006 3q 2006 4q 2007 1q 2007 2q
Vac
ancy
Rat
e
San Diego United States

2 THE COSTAR OFFICE REPORT ©2007 COSTAR GROUP, INC.
SAN DIEGO – MID-YEAR 2007
San Diego Office MarketMID-YEAR 2007 – SAN DIEGO
San Diego Office Market
©2007 COSTAR GROUP, INC. THE COSTAR OFFICE REPORT 3
OVERVIEW
Class-A projects reported a vacancy rate of 16.3% at the end of the second quarter 2007, 15.8% at the end of the first quarter 2007, 15.0% at the end of the fourth quarter 2006, and 14.2% at the end of the third quarter 2006.
Class-B projects reported a vacancy rate of 10.8% at the end of the second quarter 2007, 10.9% at the end of the first quarter 2007, 10.3% at the end of the fourth quarter 2006, and 9.5% at the end of the third quarter 2006.
Class-C projects reported a vacancy rate of 5.7% at the end of the second quarter 2007, 6.0% at the end of first quarter 2007, 5.8% at the end of the fourth quarter 2006, and 6.0% at the end of the third quarter 2006.
The overall vacancy rate in San Diego’s central business dis-trict at the end of the second quarter 2007 decreased to 12.8%. The vacancy rate was 14.6% at the end of the first quarter 2007, 11.6% at the end of the fourth quarter 2006, and 10.8% at the end of the third quarter 2006.
The vacancy rate in the suburban markets increased to 10.6% in the second quarter 2007. The vacancy rate was 10.3% at the end of the first quarter 2007, 10.1% at the end of the fourth quarter 2006, and 9.6% at the end of the third quarter 2006.
Largest Lease SigningsThe largest lease signings occurring in 2007 included: the
220,092 square-foot lease signed by Amylin Pharmaceuticals, Inc. at Bridge Pointe Corporate Center in the North Cities market; the 168,066 square-foot lease signed by QUALCOMM at Parkway Business Center _ Bldg A in the North Cities market and the 158,076-square-foot lease signed by General Atomics at Parkway Business Center – Bldg A in the I-15 Corridor market..
Sublease VacancyThe amount of vacant sublease space in the San Diego mar-
ket decreased to 1,051,088 square feet by the end of the second quarter 2007, from 1,197,268 square feet at the end of the first quarter 2007. There was 1,171,439 square feet vacant at the end
of the fourth quarter 2006 and 1,165,389 square feet at the end of the third quarter 2006.
San Diego’s Class-A projects reported vacant sublease space of 588,145 square feet at the end of second quarter 2007, down from the 625,044 square feet reported at the end of the first quarter 2007. There were 600,156 square feet of sublease space vacant at the end of the fourth quarter 2006, and 506,872 square feet at the end of the third quarter 2006.
Class-B projects reported vacant sublease space of 390,657 square feet at the end of the second quarter 2007, down from the 512,897 square feet reported at the end of the first quarter 2007. At the end of the fourth quarter 2006 there were 525,802 square feet, and at the end of the third quarter 2006 there were 564,168 square feet vacant.
Class-C projects reported increased vacant sublease space from the first quarter 2007 to the second quarter 2007. Sublease vacancy went from 59,327 square feet to 72,286 square feet dur-ing that time. There was 45,481 square feet at the end of the fourth quarter 2006, and 94,349 square feet at the end of the third quarter 2006.
Sublease vacancy in San Diego’s central business district stood at 89,091 square feet at the end of the second quarter 2007. It was 95,413 square feet at the end of the first quarter 2007, 99,983 square feet at the end of the fourth quarter 2006, and 70,409 square feet at the end of the third quarter 2006.
Sublease vacancy in the suburban markets ended the sec-ond quarter 2007 at 961,997 square feet. At the end of the first quarter 2007 sublease vacancy was 1,101,855 square feet, was 1,071,456 square feet at the end of the fourth quarter 2006, and was 1,094,980 square feet at the end of the third quarter 2006.
Rental RatesThe average quoted asking rental rate for available office
space, all classes, was $31.95 per-square-foot per year at the end of the second quarter 2007 in the San Diego market area. This represented a 0.6% increase in quoted rental rates from the end of the first quarter 2007, when rents were reported at $31.77 per-square-foot.
The average quoted rate within the Class-A sector was $37.00 at the end of the second quarter 2007, while Class-B rates stood at $30.31, and Class-C rates at $22.11. At the end of the first quarter 2007, Class-A rates were $37.29 per-square-foot, Class-B rates were $29.87, and Class-C rates were $22.12.
The average quoted asking rental rate in San Diego’s CBD was $32.88 at the end of the second quarter 2007, and $31.84 in the suburban markets. In the first quarter 2007, quoted rates were $32.83 in the CBD and $31.65 in the suburbs.
Deliveries and ConstructionDuring the second quarter 2007, 27 buildings totaling
763,399 square feet were completed in the San Diego market area. This compares to 10 buildings totaling 1,045,032 square
Vacancy Rates by Class 1999-2007
Source: CoStar Property®
Absorption & Deliveries U.S. Vacancy ComparisonPast 8 Quarters Past 8 Quarters
Source: CoStar Property• Source: CoStar Property•
4%
6%
8%
10%
12%
14%
16%
18%
20%
19992q
19994q
20002q
20004q
20012q
20014q
20022q
20024q
20032q
20034q
20042q
20044q
20052q
20054q
20062q
20064q
20072q
Vac
ancy
Rat
e
Class A Class B Class C Total Market
0.49
1.01
0.36
0.45
(0.06)
0.360.40
0.59
0.87
0.340.41
0.71 0.70
0.991.05
0.76
(0.2)
0.0
0.2
0.4
0.6
0.8
1.0
1.2
2005 3q 2005 4q 2006 1q 2006 2q 2006 3q 2006 4q 2007 1q 2007 2q
Millio
ns
SF
Net Absorption Deliveries
0.0%
2.0%
4.0%
6.0%
8.0%
10.0%
12.0%
14.0%
2005 3q 2005 4q 2006 1q 2006 2q 2006 3q 2006 4q 2007 1q 2007 2q
Vac
ancy
Rat
e
San Diego United States

2 THE COSTAR OFFICE REPORT ©2007 COSTAR GROUP, INC.
SAN DIEGO – MID-YEAR 2007
San Diego Office MarketMID-YEAR 2007 – SAN DIEGO
San Diego Office Market
©2007 COSTAR GROUP, INC. THE COSTAR OFFICE REPORT 3
OVERVIEW
feet that were completed in the first quarter 2007, 20 buildings totaling 985,711 square feet completed in the fourth quarter 2006, and 696,492 square feet in 13 buildings completed in the third quarter 2006.
There were 4,397,028 square feet of office space under con-struction at the end of the second quarter 2007.
Some of the notable 2007 deliveries include: Qualcomm Towers, a 450,000-square-foot facility that delivered in first quar-ter 2007 and is now 100% occupied, and DiamondView Tower, a 306,750-square-foot building that delivered in first quarter 2007 and is now 86% occupied.
The largest projects underway at the end of second quarter 2007 were La Jolla Commons Office Tower, a 347,019-square-foot building with 0% of its space pre-leased, and Cardinal Health, a 318,000-square-foot facility that is 100% pre-leased.
InventoryTotal office inventory in the San Diego market area amount-
ed to 99,838,822 square feet in 4,445 buildings as of the end of the second quarter 2007. The Class-A office sector consisted of 25,964,833 square feet in 210 projects. There were 1,473 Class-B buildings totaling 47,428,073 square feet, and the Class-C sector consisted of 26,445,916 square feet in 2,762 buildings. Within the Office market there were 278 owner-occupied buildings accounting for 7,318,614 square feet of office space.
Sales ActivityTallying office building sales of 15,000 square feet or larger,
San Diego office sales figures fell during the first quarter 2007 in terms of dollar volume compared to the fourth quarter of 2006.
In the first quarter, 15 office transactions closed with a total volume of $454,404,000. The 15 buildings totaled 1,601,874 square feet and the average price per square foot equated to $283.67 per square foot. That compares to 21 transactions total-ing $535,865,657 in the fourth quarter 2006. The total square footage in the fourth quarter was 1,863,719 square feet for an average price per square foot of $287.52.
Total office building sales activity in 2007 was down com-pared to 2005. In the first three months of 2007, the market saw 15 office sales transactions with a total volume of $454,404,000. The price per square foot averaged $283.67. In the same first three months of 2005, the market posted 21 transactions with a total volume of $897,437,136. The price per square foot averaged $313.54.
Cap rates have been higher in 2007, averaging 6.62% com-pared to the same period in 2005 when they averaged 6.50%.
One of the largest transactions that has occurred within the last 4 quarters in the San Diego market is the sale of 401 W A St in San Diego. This 553,715 square foot office building sold for $181,000,000, or $326.88 per square foot. The property sold on 3/7/2007.
Reports compiled by: Paula Bonner CoStar Property® and COMPS® Research Manager, and Luke Andreen Research Associate.
Vacancy Rates by Class 1999-2007
Source: CoStar Property®
Absorption & Deliveries U.S. Vacancy ComparisonPast 8 Quarters Past 8 Quarters
Source: CoStar Property• Source: CoStar Property•
4%
6%
8%
10%
12%
14%
16%
18%
20%
19992q
19994q
20002q
20004q
20012q
20014q
20022q
20024q
20032q
20034q
20042q
20044q
20052q
20054q
20062q
20064q
20072q
Vac
ancy
Rat
e
Class A Class B Class C Total Market
0.49
1.01
0.36
0.45
(0.06)
0.360.40
0.59
0.87
0.340.41
0.71 0.70
0.991.05
0.76
(0.2)
0.0
0.2
0.4
0.6
0.8
1.0
1.2
2005 3q 2005 4q 2006 1q 2006 2q 2006 3q 2006 4q 2007 1q 2007 2q
Millio
ns
SF
Net Absorption Deliveries
0.0%
2.0%
4.0%
6.0%
8.0%
10.0%
12.0%
14.0%
2005 3q 2005 4q 2006 1q 2006 2q 2006 3q 2006 4q 2007 1q 2007 2q
Vac
ancy
Rat
e
San Diego United States

4 THE COSTAR OFFICE REPORT ©2007 COSTAR GROUP, INC.
SAN DIEGO – MID-YEAR 2007
San Diego Office MarketMID-YEAR 2007 – SAN DIEGO
San Diego Office Market
©2007 COSTAR GROUP, INC. THE COSTAR OFFICE REPORT 5
CoStar Markets & Submarkets
In analyzing metropolitan areas in the U.S., CoStar has developed geographic designations to help group properties together, called Regions, Markets and Submarkets. Regions are the equivalent of metropolitan areas, or areas containing a large population nucleus, that together with adjacent communities have a high degree of economic and social integration. Regions are then divided into Markets, which are core areas within a metropolitan area that are known to be competitive with each other in terms of attracting and keeping tenants. Markets are then further subdivided into smaller units called Submarkets, which serve to delineate a core group of buildings that are competitive with each other and constitute a generally accepted competitive set, or peer group.
MARKETS
Markets Submarkets
Central Suburban City Heights/UniversityKearny MesaMission GorgeMission ValleyOld TownPoint LomaRose Canyon/MorenaUptown/Hillcrest
Downtown Downtown*
Hwy-78 Corridor OceansideSan Marcos/Vista
I-15 Corridor EscondidoRancho Bernardo/PowayScripps Ranch
North Cities Del Mar Hts/Carmel ValleyGovernor ParkLa JollaMiramarSorrento MesaTorrey Pines/Sorrento ValUTC
North County West CarlsbadNorth Beach Cities
South/Southeast Corridor East CountySouth San Diego
* Submarkets comprising the CBD. For statistics reference the CBD vs Suburban Figures at a Glance Page.

4 THE COSTAR OFFICE REPORT ©2007 COSTAR GROUP, INC.
SAN DIEGO – MID-YEAR 2007
San Diego Office MarketMID-YEAR 2007 – SAN DIEGO
San Diego Office Market
©2007 COSTAR GROUP, INC. THE COSTAR OFFICE REPORT 5
Total Employment by Industry Total Employment GrowthPercent of Total Employment by Industry Total Number of Jobs Added Per Year
Source: Department of Labor, Bureau of Labor Statistics Source: Department of Labor, Bureau of Labor Statistics
Office* Employment Growth Office* Employment GrowthCumulative Growth in Office* Jobs Over the Past 5 Years Number of Office* Jobs Added Per Year
MarketEmployment
GrowthInventory Growth Difference
Atlanta 7.90% 5.10% 2.80%
Boston 5.20% 2.30% 2.90%
Chicago 7.00% 3.40% 3.60%
Dallas/Ft Worth 15.10% 5.40% 9.70%
Denver 6.50% 3.80% 2.70%
Los Angeles 5.80% 1.80% 4.00%
New York City 6.60% 1.20% 5.40%
Seattle/Puget Sound 13.30% 3.60% 9.70%
Tampa/St Petersburg 19.20% 6.60% 12.60%
Washington 12.60% 7.90% 4.70%
San Diego 6.10% 8.50% -2.40%
Source: Department of Labor, Bureau of Labor Statistics
Historical Unemployment Rates
Source: Department of Labor, Bureau of Labor Statistics.
Source: Department of Labor, Bureau of Labor Statistics. * Office employment is defined as jobs in the Information,
Financial Activities, and Professional & Business Services industries
-1.0%
0.0%
1.0%
2.0%
3.0%
2003 2004 2005 2006 2007
Perc
ent
Gro
wth
San Diego U.S. Average
10%
12%
4%
17%
0%
17%
8%
16%
3%
6%
7%Natural Resources &MiningConstruction
Manufacturing
Trade, Transportation &UtilitiesInformation
Financial Activities
Professional & BusinessServicesEducation & HealthServicesLeisure & Hospitality
Other Services
Government
-2.0%
-1.0%
0.0%
1.0%
2.0%
3.0%
4.0%
2003 2004 2005 2006 2007
Perc
ent
Gro
wth
San Diego U.S. Average
0.0%
1.0%
2.0%
3.0%
4.0%
5.0%
6.0%
7.0%
2003 1q 2003 2q 2003 3q 2003 4q 2004 1q 2004 2q 2004 3q 2004 4q 2005 1q 2005 2q 2005 3q 2005 4q 2006 1q 2006 2q 2006 3q 2006 4q 2007 1q
Perc
ent
Unem
plo
yment
San Diego U.S. Average
EMPLOYMENT AND TENANT

6 THE COSTAR OFFICE REPORT ©2007 COSTAR GROUP, INC.
SAN DIEGO – MID-YEAR 2007
San Diego Office MarketMID-YEAR 2007 – SAN DIEGO
San Diego Office Market
©2007 COSTAR GROUP, INC. THE COSTAR OFFICE REPORT 7
EMPLOYMENT AND TENANT
Tenant by Size Range Tenants by Lease ExpirationBased on Total Number of Tenants Based on Total Square Footage of Tenants
Source: CoStar Tenant® Source: CoStar Tenant®
Tenants by Industry SF Per Employee by IndustryBased on Total Square Footage of Tenants Based on All Tenants
Source: CoStar Tenant® Source: CoStar Tenant®
44.3%
22.4%
16.4%
11.0%
3.0%
1.2%
1.7%
0% 10% 20% 30% 40% 50%
Up to 2,499 SF
2,500-4,999 SF
5,000-9,999 SF
10,000-24,999 SF
25,000-49,999 SF
50,000-74,999 SF
75,000 SF & Up
Percentage of Tenants
15.1%
15.0%
15.8%
12.3%
7.7%
3.5%
0% 5% 10% 15% 20%
2008
2009
2010
2011
2012
2013
Percentage of Tenants
22.5%
15.2%
13.7%
11.3%
8.9%
8.9%
4.0%
3.9%
3.5%
3.5%
2.7%
1.5%
0.5%
0% 5% 10% 15% 20% 25%
Finance/Ins/RE
Services
Manufacturing
Business-Service
Law Firms
Medical
Retailers/Wholes
Government
Engineers/Archit
Agri/Mining/Util
Communications
Accountants
Transportation
Percentage of Tenants
400.3
294.1
291.9
286.4
284.6
281.5
277.0
275.0
273.5
268.3
251.4
184.1
171.0
0 50 100 150 200 250 300 350 400 450
Law Firms
Services
Manufacturing
Accountants
Government
Medical
Engineers/Archit
Finance/Ins/RE
Retailers/Wholes
Business-Service
Transportation
Agri/Mining/Util
Communications
SF Per Employee

6 THE COSTAR OFFICE REPORT ©2007 COSTAR GROUP, INC.
SAN DIEGO – MID-YEAR 2007
San Diego Office MarketMID-YEAR 2007 – SAN DIEGO
San Diego Office Market
©2007 COSTAR GROUP, INC. THE COSTAR OFFICE REPORT 7
Construction Highlights in Select CoStar MarketsColor Coded by Under Construction Square Footage as a Percentage of Existing Inventory
INVENTORY & DEVELOPMENT
�������������������
����� ����������� ��� ��������� ����������� ��� ����
����
�
�
�
�
�
��
��
��
��
��
�
� �
�
�
���
���
���
��������������
��� ���������� ���� � ������� ������ ����� � ����������� �� ���
���� ��������
��� ���������� ����� � ������� ������ ��� � ����������� �� ���
����� ����������
��� ���������� ����� � ������� ������ ����� � ����������� �� ���
����� ������
��� ���������� ����� � ������� ������ ����� � ����������� �� ���
������� ��������
��� ���������� ���� � ������� ������ ����� � ����������� �� ��
��������
��� ���������� ����� � ������� ������ ���� � ����������� �� ���
��������������� �����
��� ���������� ���� � ������� ������ ����� � ����������� �� ���
������������ ������ ���� ���������� �� ���������� �� ���������� �� ��������� ���� �����
Source: CoStar Property®

8 THE COSTAR OFFICE REPORT ©2007 COSTAR GROUP, INC.
SAN DIEGO – MID-YEAR 2007
San Diego Office MarketMID-YEAR 2007 – SAN DIEGO
San Diego Office Market
©2007 COSTAR GROUP, INC. THE COSTAR OFFICE REPORT 9
Historical Deliveries 1982 - 2007
Source: CoStar Property® * Future deliveries based on current under construction buildings.
Construction Activity Markets Ranked by Under Construction Square Footage
# Bldgs Preleased SF Preleased % All Existing U/C
I-15 Corridor 13 723,540 56.2% 20,276 99,075
Central Suburban 13 0 0.0% 18,231 73,138
North Cities 5 318,000 34.6% 52,901 184,013
North County West 47 254,337 47.8% 15,761 11,329
Hwy-78 Corridor 17 47,812 12.5% 12,270 22,447
South/Southeast Corridor 20 125,556 51.4% 10,113 12,206
Downtown 1 60,800 76.0% 51,448 80,000
Totals 116 1,530,045 34.8% 22,461 37,905
Source: CoStar Property®
Recent Deliveries Future Deliveries Leased & Un-Leased SF in Deliveries Since 2003 Preleased & Un-Leased SF in Properties Scheduled to Deliver
Source: CoStar Property® Source: CoStar Property®
1,287,976
4,397,028
950,790
920,066
532,483
381,593
244,120
80,000
Market
Under Construction Inventory Average Bldg Size
Total RBA
3.5 3.4
4.1
3.6
5.6
3.5
2.8
4.0 4.1
2.2
0.90.5
0.10.4
0.6 0.4
2.6
3.22.8
3.8
2.4
1.0 1.1
2.1
2.8
5.1
0.0
1.0
2.0
3.0
4.0
5.0
6.0
1982 1983 1984 1985 1986 1987 1988 1989 1990 1991 1992 1993 1994 1995 1996 1997 1998 1999 2000 2001 2002 2003 2004 2005 2006 2007
Millio
ns
of
SF
Deliveries Average Delivered SF
0.0
0.5
1.0
1.5
2.0
2.5
3.0
2003 2004 2005 2006 2007
Millio
ns
of
SF
Leased Un-Leased
0
200
400
600
800
1,000
1,200
1,400
1,600
1,800
2007 3q 2007 4q 2008 1q 2008 2q
T
Thousa
nds
of
SF
Preleased Un-Leased
INVENTORY & DEVELOPMENT

8 THE COSTAR OFFICE REPORT ©2007 COSTAR GROUP, INC.
SAN DIEGO – MID-YEAR 2007
San Diego Office MarketMID-YEAR 2007 – SAN DIEGO
San Diego Office Market
©2007 COSTAR GROUP, INC. THE COSTAR OFFICE REPORT 9
Historical Construction Starts & DeliveriesSquare Footage Per Quarter Starting and Completing Construction
Source: CoStar Property®
Recent Deliveries by Project Size Breakdown of Year-to-Date Development Based on RBA of Project
Building Size # Bldgs RBA SF Leased % Leased Avg Rate Single-Tenant Multi-Tenant
< 50,000 SF 27 393,984 189,817 48.2% $35.97 107,454 286,530
50,000 SF - 99,999 SF 6 445,306 255,526 57.4% $34.76 115,356 329,950
100,000 SF - 249,999 SF 2 212,391 10,884 5.1% $34.64 0 212,391
250,000 SF - 499,999 SF 2 756,750 713,805 94.3% $41.15 450,000 306,750
>= 500,000 SF 0 0 0 0.0% $0.00 0 0
Source: CoStar Property®
Recent Development by Tenancy Existing Inventory ComparisonBased on RBA Developed for Single & Multi Tenant Use Based on Total RBA
2007 Deliveries
Source: CoStar Property® Source: CoStar Property®
Currently Under Construction By Class By Space Type
0.44
0.58
1.05
0.82
0.21
1.25
0.36
1.02 1.01
0.54
1.46
1.04
0.30
0.65
0.33
0.14
0.280.38 0.35
0.50
0.87
0.340.41
0.71 0.70
0.991.05
0.76
0.0
0.2
0.4
0.6
0.8
1.0
1.2
1.4
1.6
2004 1q 2004 2q 2004 3q 2004 4q 2005 1q 2005 2q 2005 3q 2005 4q 2006 1q 2006 2q 2006 3q 2006 4q 2007 1q 2007 2q
Millio
ns
of
SF
Construction Starts Deliveries
90%
10%
Multi Single
37%
63%
Multi Single
26%
26%
%
Class A Class B Class C
19%
81%
Multi Single
INVENTORY & DEVELOPMENT

10 THE COSTAR OFFICE REPORT ©2007 COSTAR GROUP, INC.
SAN DIEGO – MID-YEAR 2007
San Diego Office MarketMID-YEAR 2007 – SAN DIEGO
San Diego Office Market
©2007 COSTAR GROUP, INC. THE COSTAR OFFICE REPORT 11
������������������������������ �������������������������������
������������������������
���� �������������������������� ����������������� ����������������� ��������� ����������� ����������������� ������������������������������������������������ ������������������������������ ������������������������� ������������������������� ���������������������������
���� ���������������������������� ������������� ����������������� ��������� ����������� ���������������� ���������������������������������������������������� ������������������������������ ��������������������������� ���������������������������� ����������������
���� ������������������������������������ ������������������ ����������������� �������� ����������� ���������������� ��������������������������������������������������� ������������������������������� ��������������������������������� ����������������������������� ����������������������������
��������
���� �������������������������������������� ���������������������� ����������������� �������� ����������� ��������������� ���������������������������������������������������� ������������������������������� ��������������������������������������� �������������������� ����������������������������
���� ����������������������������������������������� ������������������ ���������������� �������� ����������� ����������������� ���������������������������������������������������� ������������������������������ ������������������������������������ ������������������������� ��������������������������
���� ����������������������������������������������� ������������������ ���������������� �������� ����������� ��������������� ���������������������������������������������������� ������������������������������� ������������������������������������ ������������������������� ��������������������������
���� ������������������������������������ ���������������������� ���������������� �������� ����������� ���������������� ���������������������������������������������������� ������������������������������� ��������������������������������������� ��������������������������� �����������������������
���� �������������������������������������� ���������������������� ���������������� �������� ����������� ���������������� ���������������������������������������������������� ������������������������������� ��������������������������������������� ��������������������������� �����������������������
���� �������������������������������������������������������� ���������������������� ���������������� �������� ����������� ����������������� ������������������������������������������������ ������������������������������� ��������������������������� ���������������� ����
���������������������������������������������������� ������������������ ���������������� �������� ����������� ����������������� ���������������������������������������������������� ������������������������������ ������������������������������������ ������������������������� ��������������������������
����������������������������������� ������������������ ���������������� �������� ����������� ���������������� ���������������������������������������������������� ������������������������������ ������������������������������ �������������� ����
����������������������������������������� ����������������������������� ���������������� �������� ����������� ���������������� ��������������������������������������������������� ������������������������������ ������������������������������������ �������������� ����
������������������������������������������������������ ���������������������� ���������������� �������� ����������� ���������������� ���������������������������������������������������� ������������������������������� �������������������� �������������� ����
��������������������������������������� ��������������������� ���������������� �������� ����������� ��������������� ��������������������������������������������������� ������������������������������� ��������������������������
���������������� ���������������������������� �������������
���������������������������������� ����������������������������� ���������������� �������� ����������� ����������������� ������������������������������������������������� ������������������������������ �������������� �������������� ����
INVENTORY & DEVELOPMENT

10 THE COSTAR OFFICE REPORT ©2007 COSTAR GROUP, INC.
SAN DIEGO – MID-YEAR 2007
San Diego Office MarketMID-YEAR 2007 – SAN DIEGO
San Diego Office Market
©2007 COSTAR GROUP, INC. THE COSTAR OFFICE REPORT 11
INVENTORY & DEVELOPMENT
���������������������������������������� �������������������������������
������������������������
���� ��������������������������������������� ����������������� ����������������� ��������� ������������ ��������������� ���������������������������������������������������� ������������������������������� ��������������������������������������� ���������������� ���������
���� �������������������������� ����������������� ����������������� �������� ������������ ����������������� ������������������������������������������������ ������������������������������ ��������������������������� ������������������������������������ ������������������������������
���� ������������������������������������ ��������������������� ����������������� ��������� ������������ ��������������� ������������������������������������������������������� ������������������������������ ������������������������������ �������������������������������� ������������������������
���� ������������������������������������������������� ��������������������� ����������������� �������� ������������ ��������������� �������������������������������������������������������� ������������������������������ ��������������������������������������� ������������������������������������� ����
���� ������������������������������������������������ ��������������������� ����������������� �������� ������������ ��������������� �������������������������������������������������������� ������������������������������ ��������������������������������������� ������������������������������������� ����
���� ������������������������������ ������������������ ����������������� �������� ������������ ����������������� ������������������������������������������������� ������������������������������� ��������������������������� ��������������������������� ������������������������������
���� ����������������������������������� ������������������ ����������������� �������� ������������ ��������������� ��������������������������������������������������� ������������������������������� ��������������������������� ������������������������������������ ��������������������
���� ��������������������������������� ������������������ ����������������� �������� ������������ ����������������� ������������������������������������������������� ������������������������������� ��������������������������������� ������������������������������������ ��������������������
���� ��������������������������������� ������������������ ����������������� �������� ������������ ����������������� ������������������������������������������������� ������������������������������� ��������������������������������� ������������������������������������ ��������������������
������������������������������������������������������ ������������������ ����������������� �������� ������������ ��������������� ������������������������������������������������������� ������������������������������� �������������������������� �������������������������� ������������������������
������������������������������������������������������ ������������������ ����������������� �������� ������������ ��������������� ������������������������������������������������������� ������������������������������� �������������������������� �������������������������� ������������������������
������������������������������������������������������ ������������������ ����������������� �������� ������������ ��������������� ������������������������������������������������������� ������������������������������� �������������������������� �������������������������� ������������������������
����� ��������������������������������� ������������������ ����������������� �������� ������������ ����������������� ������������������������������������������������� ������������������������������� ��������������������������������� ������������������������������������ ��������������������
����� ��������������������������������� ������������������ ����������������� �������� ������������ ����������������� ������������������������������������������������� ������������������������������� ��������������������������������� ������������������������������������ ��������������������
��������������������������������������� ����������������� ����������������� �������� ������������ ��������������� ��������������������������������������������������� ������������������������������� ��������������������������������������� ���������������������������� ��������������������������
����������

12 THE COSTAR OFFICE REPORT ©2007 COSTAR GROUP, INC.
SAN DIEGO – MID-YEAR 2007
San Diego Office MarketMID-YEAR 2007 – SAN DIEGO
San Diego Office Market
©2007 COSTAR GROUP, INC. THE COSTAR OFFICE REPORT 13
Class A Market Statistics Mid-Year 2007
YTD Net YTD Under Quoted
Market # Bldgs Total RBA Direct SF Total SF Vac % Absorption Deliveries Const SF Rates
Central Suburban 28 3,233,678 494,144 537,398 16.6% (141,566) 31,222 895,869 $35.44
Downtown 14 5,816,662 1,001,266 1,059,242 18.2% 137,035 306,750 0 $35.09
Hwy-78 Corridor 4 316,523 9,409 12,660 4.0% 14,713 0 208,336 $33.91
I-15 Corridor 22 2,311,634 601,786 670,379 29.0% 115,081 350,178 1,161,754 $38.21
North Cities 100 11,894,034 859,500 1,227,059 10.3% 578,033 450,000 544,851 $39.87
North County West 37 2,048,433 630,316 672,903 32.8% 27,871 143,972 95,000 $33.83
South/Southeast Corridor 5 343,869 49,601 54,526 15.9% 56,489 40,202 43,830 $28.54
Totals 210 25,964,833 3,646,022 4,234,167 16.3% 787,656 1,322,324 2,949,640 $37.00
Source: CoStar Property®
Class B Market Statistics Mid-Year 2007
YTD Net YTD Under Quoted
Market # Bldgs Total RBA Direct SF Total SF Vac % Absorption Deliveries Const SF Rates
Central Suburban 336 12,597,011 1,133,006 1,196,441 9.5% 96,729 18,000 54,921 $26.73
Downtown 52 3,685,800 339,721 367,836 10.0% (14,394) 0 80,000 $29.53
Hwy-78 Corridor 120 1,817,177 167,321 167,321 9.2% 6,213 15,461 173,257 $28.94
I-15 Corridor 209 6,023,621 825,607 849,984 14.1% (35,548) 66,523 126,222 $29.67
North Cities 299 14,249,983 1,348,750 1,528,911 10.7% (139,655) 0 375,215 $33.57
North County West 337 5,905,121 660,309 747,705 12.7% 244,685 332,107 437,483 $30.61
South/Southeast Corridor 120 3,149,360 266,893 274,066 8.7% 18,489 44,113 200,290 $28.18
Totals 1,473 47,428,073 4,741,607 5,132,264 10.8% 176,519 476,204 1,447,388 $30.31
Source: CoStar Property®
Class C Market Statistics Mid-Year 2007
YTD Net YTD Under Quoted
Market # Bldgs Total RBA Direct SF Total SF Vac % Absorption Deliveries Const SF Rates
Central Suburban 1,112 11,078,616 627,228 653,291 5.9% (9,580) 0 0 $20.96
Downtown 179 3,102,219 180,255 183,255 5.9% (3,069) 0 0 $25.66
Hwy-78 Corridor 178 1,571,981 80,960 96,900 6.2% (1,605) 4,903 0 $22.97
I-15 Corridor 311 2,654,163 165,110 171,033 6.4% 6,845 0 0 $22.69
North Cities 146 2,687,053 156,504 168,381 6.3% 19,050 0 0 $25.50
North County West 210 1,250,588 56,077 57,527 4.6% 7,990 0 0 $26.49
South/Southeast Corridor 626 4,101,296 170,553 178,586 4.4% 4,617 5,000 0 $19.06
Totals 2,762 26,445,916 1,436,687 1,508,973 5.7% 24,248 9,903 0 $22.11
Source: CoStar Property®
Total Office Market Statistics Mid-Year 2007
YTD Net YTD Under Quoted
Market # Bldgs Total RBA Direct SF Total SF Vac % Absorption Deliveries Const SF Rates
Central Suburban 1,476 26,909,305 2,254,378 2,387,130 8.9% (54,417) 49,222 950,790 $27.74
Downtown 245 12,604,681 1,521,242 1,610,333 12.8% 119,572 306,750 80,000 $32.88
Hwy-78 Corridor 302 3,705,681 257,690 276,881 7.5% 19,321 20,364 381,593 $29.50
I-15 Corridor 542 10,989,418 1,592,503 1,691,396 15.4% 86,378 416,701 1,287,976 $32.69
North Cities 545 28,831,070 2,364,754 2,924,351 10.1% 457,428 450,000 920,066 $35.94
North County West 584 9,204,142 1,346,702 1,478,135 16.1% 280,546 476,079 532,483 $31.70
South/Southeast Corridor 751 7,594,525 487,047 507,178 6.7% 79,595 89,315 244,120 $25.62
Totals 4,445 99,838,822 9,824,316 10,875,404 10.9% 988,423 1,808,431 4,397,028 $31.95
Source: CoStar Property®
Vacancy
Existing Inventory Vacancy
Existing Inventory Vacancy
Existing Inventory
Existing Inventory Vacancy
FIGURES AT A GLANCE

12 THE COSTAR OFFICE REPORT ©2007 COSTAR GROUP, INC.
SAN DIEGO – MID-YEAR 2007
San Diego Office MarketMID-YEAR 2007 – SAN DIEGO
San Diego Office Market
©2007 COSTAR GROUP, INC. THE COSTAR OFFICE REPORT 13
FIGURES AT A GLANCE
Class A Submarket Statistics Mid-Year 2007
YTD Net YTD Under Quoted
Market # Bldgs Total RBA Direct SF Total SF Vac % Absorption Deliveries Const SF Rates
Carlsbad 34 1,880,520 610,772 651,220 34.6% (2,527) 143,972 95,000 $33.51 City Heights/University 0 0 0 0 0.0% 0 0 0 $0.00 Del Mar Hts/Carmel Valley 41 3,390,600 173,210 393,321 11.6% 91,056 0 197,832 $46.73 Downtown 14 5,816,662 1,001,266 1,059,242 18.2% 137,035 306,750 0 $35.09 East County 2 126,465 3,019 4,944 3.9% (700) 0 43,830 $27.17 Escondido 1 12,139 5,651 5,651 46.6% 6,477 0 78,777 $39.91 Governor Park 3 208,528 52,605 52,605 25.2% (12,060) 0 0 $28.82 Kearny Mesa 13 1,029,560 227,102 236,467 23.0% (112,803) 31,222 804,780 $34.25 La Jolla 4 304,882 1,800 1,800 0.6% 6,346 0 0 $35.10 Miramar 1 447,273 0 0 0.0% 0 0 0 $0.00 Mission Gorge 0 0 0 0 0.0% 0 0 0 $0.00 Mission Valley 13 2,091,189 258,318 292,207 14.0% (28,763) 0 91,089 $36.48 North Beach Cities 3 167,913 19,544 21,683 12.9% 30,398 0 0 $41.74 Oceanside 0 0 0 0 0.0% 0 0 32,610 $36.57 Old Town 0 0 0 0 0.0% 0 0 0 $0.00 Point Loma 2 112,929 8,724 8,724 7.7% 0 0 0 $33.52 Rancho Bernardo/Poway 17 1,960,679 535,986 601,165 30.7% 108,102 350,178 1,082,977 $38.41 Rose Canyon/Morena 0 0 0 0 0.0% 0 0 0 $0.00 San Marcos/Vista 4 316,523 9,409 12,660 4.0% 14,713 0 175,726 $33.43 Scripps Ranch 4 338,816 60,149 63,563 18.8% 502 0 0 $33.24 Sorrento Mesa 23 3,720,247 318,410 403,799 10.9% 432,754 450,000 0 $32.77 South San Diego 3 217,404 46,582 49,582 22.8% 57,189 40,202 0 $31.87 Torrey Pines/Sorrento Val 1 79,074 0 0 0.0% 0 0 0 $0.00 Uptown/Hillcrest 0 0 0 0 0.0% 0 0 0 $0.00 UTC 27 3,743,430 313,475 375,534 10.0% 59,937 0 347,019 $43.44
Totals 210 25,964,833 3,646,022 4,234,167 16.3% 787,656 1,322,324 2,949,640 $37.00
Source: CoStar Property®
Class B Submarket Statistics Mid-Year 2007
YTD Net YTD Under Quoted
Market # Bldgs Total RBA Direct SF Total SF Vac % Absorption Deliveries Const SF Rates
Carlsbad 148 3,693,850 551,730 616,956 16.7% 153,571 283,107 386,674 $28.23 City Heights/University 17 524,450 46,236 51,002 9.7% 21,328 0 0 $24.40 Del Mar Hts/Carmel Valley 24 804,433 57,659 68,540 8.5% 4,515 0 0 $41.35 Downtown 52 3,685,800 339,721 367,836 10.0% (14,394) 0 80,000 $29.53 East County 51 952,000 31,110 31,110 3.3% 4,248 7,555 66,000 $21.79 Escondido 85 999,988 46,004 65,455 6.5% 21,249 40,911 42,600 $29.95 Governor Park 16 649,853 40,973 43,588 6.7% 13,752 0 0 $36.67 Kearny Mesa 136 6,043,082 441,163 449,764 7.4% 84,759 18,000 48,000 $26.19 La Jolla 36 1,013,500 30,504 30,504 3.0% 14,740 0 0 $33.81 Miramar 20 850,579 147,543 147,543 17.3% (29,987) 0 0 $24.50 Mission Gorge 15 509,036 36,582 36,582 7.2% 3,855 0 0 $23.86 Mission Valley 62 3,080,214 414,051 443,477 14.4% (50,240) 0 0 $27.26 North Beach Cities 189 2,211,271 108,579 130,749 5.9% 91,114 49,000 50,809 $36.85 Oceanside 40 558,905 68,187 68,187 12.2% 3,735 15,461 158,215 $28.62 Old Town 12 291,449 25,479 27,724 9.5% 4,206 0 0 $30.32 Point Loma 22 668,217 98,194 115,836 17.3% 20,763 0 0 $28.19 Rancho Bernardo/Poway 97 4,047,733 547,528 552,454 13.6% (116,588) 25,612 83,622 $30.58 Rose Canyon/Morena 22 307,275 30,885 30,885 10.1% (2,452) 0 0 $26.96 San Marcos/Vista 80 1,258,272 99,134 99,134 7.9% 2,478 0 15,042 $29.22 Scripps Ranch 27 975,900 232,075 232,075 23.8% 59,791 0 0 $26.78 Sorrento Mesa 98 4,675,678 515,025 645,635 13.8% (185,355) 0 375,215 $30.23 South San Diego 69 2,197,360 235,783 242,956 11.1% 14,241 36,558 134,290 $28.64 Torrey Pines/Sorrento Val 47 2,900,519 274,558 301,558 10.4% (176,390) 0 0 $38.58 Uptown/Hillcrest 50 1,173,288 40,416 41,171 3.5% 14,510 0 6,921 $26.66 UTC 58 3,355,421 282,488 291,543 8.7% 219,070 0 0 $35.61
Totals 1,473 47,428,073 4,741,607 5,132,264 10.8% 176,519 476,204 1,447,388 $30.31
Source: CoStar Property®
Existing Inventory Vacancy
Existing Inventory Vacancy

14 THE COSTAR OFFICE REPORT ©2007 COSTAR GROUP, INC.
SAN DIEGO – MID-YEAR 2007
San Diego Office MarketMID-YEAR 2007 – SAN DIEGO
San Diego Office Market
©2007 COSTAR GROUP, INC. THE COSTAR OFFICE REPORT 15
FIGURES AT A GLANCE
Class C Submarket Statistics Mid-Year 2007
YTD Net YTD Under Quoted
Market # Bldgs Total RBA Direct SF Total SF Vac % Absorption Deliveries Const SF Rates
Carlsbad 75 440,043 39,914 39,914 9.1% (7,718) 0 0 $23.67 City Heights/University 205 1,171,241 50,212 50,212 4.3% 6,535 0 0 $20.61 Del Mar Hts/Carmel Valley 0 0 0 0 0.0% 0 0 0 $0.00 Downtown 179 3,102,219 180,255 183,255 5.9% (3,069) 0 0 $25.66 East County 317 2,273,871 118,349 118,349 5.2% 6,233 0 0 $17.49 Escondido 209 1,228,540 70,050 71,850 5.8% 12,378 0 0 $20.84 Governor Park 0 0 0 0 0.0% 0 0 0 $0.00 Kearny Mesa 130 2,282,378 132,548 148,243 6.5% 17,692 0 0 $20.44 La Jolla 80 757,717 12,429 12,429 1.6% 20,911 0 0 $30.86 Miramar 22 354,073 69,675 69,675 19.7% (5,188) 0 0 $18.39 Mission Gorge 83 1,074,543 131,437 131,437 12.2% (79,684) 0 0 $18.96 Mission Valley 62 1,482,722 167,878 175,446 11.8% (18,599) 0 0 $21.54 North Beach Cities 135 810,545 16,163 17,613 2.2% 15,708 0 0 $37.15 Oceanside 60 357,742 19,096 19,096 5.3% 20,884 4,903 0 $33.94 Old Town 48 595,307 11,530 11,530 1.9% 7,803 0 0 $21.07 Point Loma 100 1,165,439 16,551 16,551 1.4% 5,407 0 0 $20.27 Rancho Bernardo/Poway 89 1,164,238 74,228 78,351 6.7% (10,845) 0 0 $25.67 Rose Canyon/Morena 167 1,351,159 51,562 54,362 4.0% 11,208 0 0 $20.66 San Marcos/Vista 118 1,214,239 61,864 77,804 6.4% (22,489) 0 0 $20.44 Scripps Ranch 13 261,385 20,832 20,832 8.0% 5,312 0 0 $19.16 Sorrento Mesa 26 605,695 46,446 58,323 9.6% (16,992) 0 0 $22.75 South San Diego 309 1,827,425 52,204 60,237 3.3% (1,616) 5,000 0 $24.69 Torrey Pines/Sorrento Val 15 934,568 26,939 26,939 2.9% 21,334 0 0 $26.29 Uptown/Hillcrest 317 1,955,827 65,510 65,510 3.3% 40,058 0 0 $23.84 UTC 3 35,000 1,015 1,015 2.9% (1,015) 0 0 $38.74
Totals 2,762 26,445,916 1,436,687 1,508,973 5.7% 24,248 9,903 0 $22.11
Source: CoStar Property®
Total Office Submarket Statistics Mid-Year 2007
YTD Net YTD Under Quoted
Market # Bldgs Total RBA Direct SF Total SF Vac % Absorption Deliveries Const SF Rates
Carlsbad 257 6,014,413 1,202,416 1,308,090 21.7% 143,326 427,079 481,674 $30.48 City Heights/University 222 1,695,691 96,448 101,214 6.0% 27,863 0 0 $22.20 Del Mar Hts/Carmel Valley 65 4,195,033 230,869 461,861 11.0% 95,571 0 197,832 $45.15 Downtown 245 12,604,681 1,521,242 1,610,333 12.8% 119,572 306,750 80,000 $32.88 East County 370 3,352,336 152,478 154,403 4.6% 9,781 7,555 109,830 $19.52 Escondido 295 2,240,667 121,705 142,956 6.4% 40,104 40,911 121,377 $30.00 Governor Park 19 858,381 93,578 96,193 11.2% 1,692 0 0 $34.49 Kearny Mesa 279 9,355,020 800,813 834,474 8.9% (10,352) 49,222 852,780 $27.58 La Jolla 120 2,076,099 44,733 44,733 2.2% 41,997 0 0 $33.17 Miramar 43 1,651,925 217,218 217,218 13.1% (35,175) 0 0 $23.62 Mission Gorge 98 1,583,579 168,019 168,019 10.6% (75,829) 0 0 $19.84 Mission Valley 137 6,654,125 840,247 911,130 13.7% (97,602) 0 91,089 $30.10 North Beach Cities 327 3,189,729 144,286 170,045 5.3% 137,220 49,000 50,809 $37.29 Oceanside 100 916,647 87,283 87,283 9.5% 24,619 20,364 190,825 $30.73 Old Town 60 886,756 37,009 39,254 4.4% 12,009 0 0 $27.70 Point Loma 124 1,946,585 123,469 141,111 7.2% 26,170 0 0 $26.59 Rancho Bernardo/Poway 203 7,172,650 1,157,742 1,231,970 17.2% (19,331) 375,790 1,166,599 $34.20 Rose Canyon/Morena 189 1,658,434 82,447 85,247 5.1% 8,756 0 0 $23.40 San Marcos/Vista 202 2,789,034 170,407 189,598 6.8% (5,298) 0 190,768 $28.97 Scripps Ranch 44 1,576,101 313,056 316,470 20.1% 65,605 0 0 $27.20 Sorrento Mesa 147 9,001,620 879,881 1,107,757 12.3% 230,407 450,000 375,215 $30.98 South San Diego 381 4,242,189 334,569 352,775 8.3% 69,814 81,760 134,290 $28.37 Torrey Pines/Sorrento Val 63 3,914,161 301,497 328,497 8.4% (155,056) 0 0 $36.92 Uptown/Hillcrest 367 3,129,115 105,926 106,681 3.4% 54,568 0 6,921 $24.66 UTC 88 7,133,851 596,978 668,092 9.4% 277,992 0 347,019 $40.27
Totals 4,445 99,838,822 9,824,316 10,875,404 10.9% 988,423 1,808,431 4,397,028 $31.95
Source: CoStar Property®
Existing Inventory Vacancy
Existing Inventory Vacancy

14 THE COSTAR OFFICE REPORT ©2007 COSTAR GROUP, INC.
SAN DIEGO – MID-YEAR 2007
San Diego Office MarketMID-YEAR 2007 – SAN DIEGO
San Diego Office Market
©2007 COSTAR GROUP, INC. THE COSTAR OFFICE REPORT 15
FIGURES AT A GLANCE
Class A Market Statistics Mid-Year 2007
YTD Net YTD Under Quoted
Market # Bldgs Total RBA Direct SF Total SF Vac % Absorption Deliveries Const SF Rates
CBD 14 5,816,662 1,001,266 1,059,242 18.2% 137,035 306,750 0 $35.09
Suburban 196 20,148,171 2,644,756 3,174,925 15.8% 650,621 1,015,574 2,949,640 $37.41
Totals 210 25,964,833 3,646,022 4,234,167 16.3% 787,656 1,322,324 2,949,640 $37.00
Source: CoStar Property®
Class B Market Statistics Mid-Year 2007
YTD Net YTD Under Quoted
Market # Bldgs Total RBA Direct SF Total SF Vac % Absorption Deliveries Const SF Rates
CBD 52 3,685,800 339,721 367,836 10.0% (14,394) 0 80,000 $29.53
Suburban 1,421 43,742,273 4,401,886 4,764,428 10.9% 190,913 476,204 1,367,388 $30.36
Totals 1,473 47,428,073 4,741,607 5,132,264 10.8% 176,519 476,204 1,447,388 $30.31
Source: CoStar Property®
Class C Market Statistics Mid-Year 2007
YTD Net YTD Under Quoted
Market # Bldgs Total RBA Direct SF Total SF Vac % Absorption Deliveries Const SF Rates
CBD 179 3,102,219 180,255 183,255 5.9% (3,069) 0 0 $25.66
Suburban 2,583 23,343,697 1,256,432 1,325,718 5.7% 27,317 9,903 0 $21.82
Totals 2,762 26,445,916 1,436,687 1,508,973 5.7% 24,248 9,903 0 $22.11
Source: CoStar Property®
Class A & B Market Statistics Mid-Year 2007
YTD Net YTD Under Quoted
Market # Bldgs Total RBA Direct SF Total SF Vac % Absorption Deliveries Const SF Rates
CBD 66 9,502,462 1,340,987 1,427,078 15.0% 122,641 306,750 80,000 $33.57
Suburban 1,617 63,890,444 7,046,642 7,939,353 12.4% 841,534 1,491,778 4,317,028 $33.26
Totals 1,683 73,392,906 8,387,629 9,366,431 12.8% 964,175 1,798,528 4,397,028 $33.29
Source: CoStar Property®
Total Office Market Statistics Mid-Year 2007
YTD Net YTD Under Quoted
Market # Bldgs Total RBA Direct SF Total SF Vac % Absorption Deliveries Const SF Rates
CBD 245 12,604,681 1,521,242 1,610,333 12.8% 119,572 306,750 80,000 $32.88
Suburban 4,200 87,234,141 8,303,074 9,265,071 10.6% 868,851 1,501,681 4,317,028 $31.84
Totals 4,445 99,838,822 9,824,316 10,875,404 10.9% 988,423 1,808,431 4,397,028 $31.95
Source: CoStar Property®
Existing Inventory Vacancy
Existing Inventory Vacancy
Existing Inventory Vacancy
Existing Inventory Vacancy
Existing Inventory Vacancy

16 THE COSTAR OFFICE REPORT ©2007 COSTAR GROUP, INC.
SAN DIEGO – MID-YEAR 2007
San Diego Office MarketMID-YEAR 2007 – SAN DIEGO
San Diego Office Market
©2007 COSTAR GROUP, INC. THE COSTAR OFFICE REPORT 17
FIGURES AT A GLANCE
Class A Market Statistics Mid-Year 2007
Net Quoted
Period # Blds Total RBA Direct SF Total SF Vac % Absorption # Blds Total RBA # Blds Total RBA Rates
2007 2q 210 25,964,833 3,646,022 4,234,167 16.3% 172,880 5 375,222 25 2,949,640 $37.00 2007 1q 205 25,589,611 3,406,781 4,031,825 15.8% 614,776 5 947,102 26 2,815,621 $37.29 2006 4q 200 24,642,509 3,099,343 3,699,499 15.0% 127,947 5 368,439 31 3,762,723 $36.53 2006 3q 195 24,274,070 2,952,135 3,459,007 14.2% (206,504) 5 435,336 31 3,429,366 $35.91 2006 2q 190 23,838,734 2,501,543 2,817,167 11.8% 633,396 3 653,330 27 2,978,644 $34.88 2006 1q 187 23,185,404 2,619,054 2,797,233 12.1% 310,631 3 218,732 28 3,488,002 $34.64 2005 4q 184 22,966,672 2,557,123 2,889,132 12.6% 288,628 2 196,531 24 3,092,953 $33.96 2005 3q 182 22,770,141 2,640,899 2,981,229 13.1% 137,744 4 602,074 17 2,410,270 $33.42 2005 2q 178 22,168,067 2,109,553 2,516,899 11.4% 320,143 2 153,148 21 3,012,344 $32.99 2005 1q 176 22,014,919 2,306,961 2,683,894 12.2% (7,115) 3 117,516 14 2,226,344 $32.16 2004 4q 173 21,897,403 2,182,141 2,559,263 11.7% 557,372 2 347,703 16 2,303,658 $31.65 2004 3q 171 21,549,700 2,319,273 2,768,932 12.8% 477,056 2 207,415 15 1,951,309 $30.96 2004 2q 169 21,342,285 2,521,738 3,038,573 14.2% 176,862 0 0 12 1,420,796 $30.96 2004 1q 169 21,342,285 2,656,577 3,215,435 15.1% 233,798 0 0 8 1,181,414 $30.00
2003 169 21,342,285 2,866,697 3,449,233 16.2% 973,950 4 431,575 6 973,519 $29.84 2002 165 20,910,710 3,141,075 3,991,608 19.1% (302,589) 10 969,947 4 431,575 $30.82
Source: CoStar Property®
Class B Market Statistics Mid-Year 2007
Net Quoted
Period # Blds Total RBA Direct SF Total SF Vac % Absorption # Blds Total RBA # Blds Total RBA Rates
2007 2q 1,473 47,428,073 4,741,607 5,132,264 10.8% 363,794 21 383,274 91 1,447,388 $30.31 2007 1q 1,452 47,044,799 4,599,887 5,112,784 10.9% (187,275) 4 92,930 101 1,690,581 $29.87 2006 4q 1,448 46,951,869 4,306,777 4,832,579 10.3% 198,017 15 617,272 74 1,479,437 $28.91 2006 3q 1,433 46,334,597 3,849,156 4,413,324 9.5% (15,406) 7 258,339 63 1,759,059 $28.72 2006 2q 1,426 46,076,258 3,611,652 4,139,579 9.0% (219,179) 6 51,959 49 1,450,077 $28.47 2006 1q 1,420 46,024,299 3,391,382 3,868,441 8.4% 208,341 9 188,126 39 1,113,903 $27.82 2005 4q 1,411 45,836,173 3,501,036 3,888,656 8.5% 728,391 8 136,714 27 903,387 $27.03 2005 3q 1,404 45,738,540 3,983,137 4,519,414 9.9% 373,042 7 268,554 27 901,956 $26.47 2005 2q 1,398 45,561,467 4,267,699 4,715,383 10.3% 629,854 8 350,525 28 811,994 $25.95 2005 1q 1,390 45,210,942 4,545,413 4,994,712 11.0% 150,118 11 235,385 26 846,810 $25.53 2004 4q 1,379 44,975,557 4,405,968 4,909,445 10.9% 104,289 2 34,460 30 919,838 $25.40 2004 3q 1,377 44,941,097 4,501,713 4,979,274 11.1% 147,858 4 76,248 24 838,424 $25.37 2004 2q 1,374 44,906,861 4,548,957 5,092,896 11.3% 268,688 4 142,097 21 603,870 $25.49 2004 1q 1,370 44,764,764 4,540,603 5,219,487 11.7% 650,609 8 326,025 14 400,465 $24.76
2003 1,363 44,457,739 4,741,524 5,563,071 12.5% 312,432 23 594,215 14 495,731 $24.14 2002 1,341 43,874,854 4,522,847 5,292,618 12.1% 1,035,894 27 1,434,809 16 545,182 $24.82
Source: CoStar Property®
Total Office Market Statistics Mid-Year 2007
Net Quoted
Period # Blds Total RBA Direct SF Total SF Vac % Absorption # Blds Total RBA # Blds Total RBA Rates
2007 2q 4,445 99,838,822 9,824,316 10,875,404 10.9% 589,875 27 763,399 116 4,397,028 $31.95 2007 1q 4,420 99,093,243 9,522,432 10,719,700 10.8% 398,548 10 1,045,032 128 4,511,105 $31.77 2006 4q 4,410 98,048,211 8,901,777 10,073,216 10.3% 361,968 20 985,711 107 5,252,063 $31.04 2006 3q 4,390 97,062,500 8,284,084 9,449,473 9.7% (64,214) 13 696,492 96 5,198,328 $30.59 2006 2q 4,377 96,366,008 7,727,898 8,688,767 9.0% 454,118 9 705,289 78 4,436,538 $29.80 2006 1q 4,369 95,664,686 7,660,449 8,441,563 8.8% 360,751 12 406,858 68 4,604,722 $29.48 2005 4q 4,358 95,260,022 7,582,726 8,397,650 8.8% 1,012,954 11 337,245 52 3,999,157 $28.73 2005 3q 4,351 95,007,479 8,157,450 9,158,061 9.6% 493,784 11 870,628 45 3,316,226 $28.09 2005 2q 4,342 94,229,832 7,892,414 8,874,198 9.4% 1,056,135 10 503,673 50 3,828,338 $27.68 2005 1q 4,335 93,771,498 8,551,100 9,471,999 10.1% 64,865 14 352,901 41 3,077,154 $26.99 2004 4q 4,322 93,423,411 8,211,444 9,188,777 9.8% 708,622 4 382,163 46 3,223,496 $26.81 2004 3q 4,319 93,042,848 8,498,220 9,516,836 10.2% 510,338 6 283,663 39 2,789,733 $26.54 2004 2q 4,314 92,801,197 8,644,533 9,785,523 10.5% 428,453 4 142,097 33 2,024,666 $26.63 2004 1q 4,313 92,712,731 8,819,916 10,125,510 10.9% 675,863 9 327,625 22 1,581,879 $25.99
2003 4,309 92,464,082 9,100,451 10,552,724 11.4% 1,516,396 28 1,047,790 20 1,469,250 $25.81 2002 4,288 91,458,990 9,379,953 11,064,028 12.1% 711,570 41 2,432,887 20 976,757 $26.30
Source: CoStar Property®
UC Inventory
Existing Inventory Vacancy Deliveries UC Inventory
Existing Inventory Vacancy Deliveries UC Inventory
Existing Inventory Vacancy Deliveries

16 THE COSTAR OFFICE REPORT ©2007 COSTAR GROUP, INC.
SAN DIEGO – MID-YEAR 2007
San Diego Office MarketMID-YEAR 2007 – SAN DIEGO
San Diego Office Market
©2007 COSTAR GROUP, INC. THE COSTAR OFFICE REPORT 17
LEASING ACTIVITY
Leasing Highlights in Select CoStar MarketsColor Coded by Vacancy Rate
�������������������
����� ����������� ��� ��������� ����������� ��� ����
����
�
�
�
�
�
��
��
��
��
��
�
� �
�
�
���
���
���
��������������
�������� ����������� �� � ����� ����� ������ ���
���� ��������
�������� ������������ �� � ����� ����� ������ ���
����� ����������
�������� ������������ ��� � ����� ����� ������ ���
����� ������
�������� ������������ ��� � ����� ����� ������ ���
������� ��������
�������� ����������� ���� � ����� ����� ������ ���
��������
�������� ������������ ��� � ����� ����� ������ ���
��������������� �����
�������� ����������� �� � ����� ����� ������ ���
������� ����� ���� ������ �� ������ �� ����� �� ������� ���� ��
Source: CoStar Property®

18 THE COSTAR OFFICE REPORT ©2007 COSTAR GROUP, INC.
SAN DIEGO – MID-YEAR 2007
San Diego Office MarketMID-YEAR 2007 – SAN DIEGO
San Diego Office Market
©2007 COSTAR GROUP, INC. THE COSTAR OFFICE REPORT 19
Historical Rental RatesBased on Full-Service Equivalent Rental Rates
Source: CoStar Property®
Vacancy by Available Space Type Vacancy by ClassPercent of All Vacant Space in Direct vs. Sublet Percent of All Vacant Space by Class
Source: CoStar Property® Source: CoStar Property®
U.S. Rental Rate Comparison Future Space AvailableBased on Full-Service Equivalent Rental Rates Space Scheduled to be Available for Occupancy*
Source: CoStar Property® * Includes Under Construction Spaces Source: CoStar Property®
San Diego United States San Diego United States
$15.00
$20.00
$25.00
$30.00
$35.00
$40.00
1999
2q
1999
3q
1999
4q
2000
1q
2000
2q
2000
3q
2000
4q
2001
1q
2001
2q
2001
3q
2001
4q
2002
1q
2002
2q
2002
3q
2002
4q
2003
1q
2003
2q
2003
3q
2003
4q
2004
1q
2004
2q
2004
3q
2004
4q
2005
1q
2005
2q
2005
3q
2005
4q
2006
1q
2006
2q
2006
3q
2006
4q
2007
1q
2007
2q
Dollar
s/SF/Y
ear
Class A Class B Class C Total Market
$15.00
$17.00
$19.00
$21.00
$23.00
$25.00
$27.00
$29.00
$31.00
$33.00
2005 3q 2005 4q 2006 1q 2006 2q 2006 3q 2006 4q 2007 1q 2007 2q
Dollar
s/SF/Y
ear
San Diego United States
90%
10%
Direct Sublet
8%
92%
Direct Sublet
39%
47%
14%
Class A Class B Class C
1.69
2.03
0.18
0.0
0.5
1.0
1.5
2.0
2.5
2007 3q 2007 4q 2008 1q 2008 2q 2008 3q 2008 4q
Mill
ions
15%
48%
37%
Class A Class B Class C
LEASING ACTIVITY
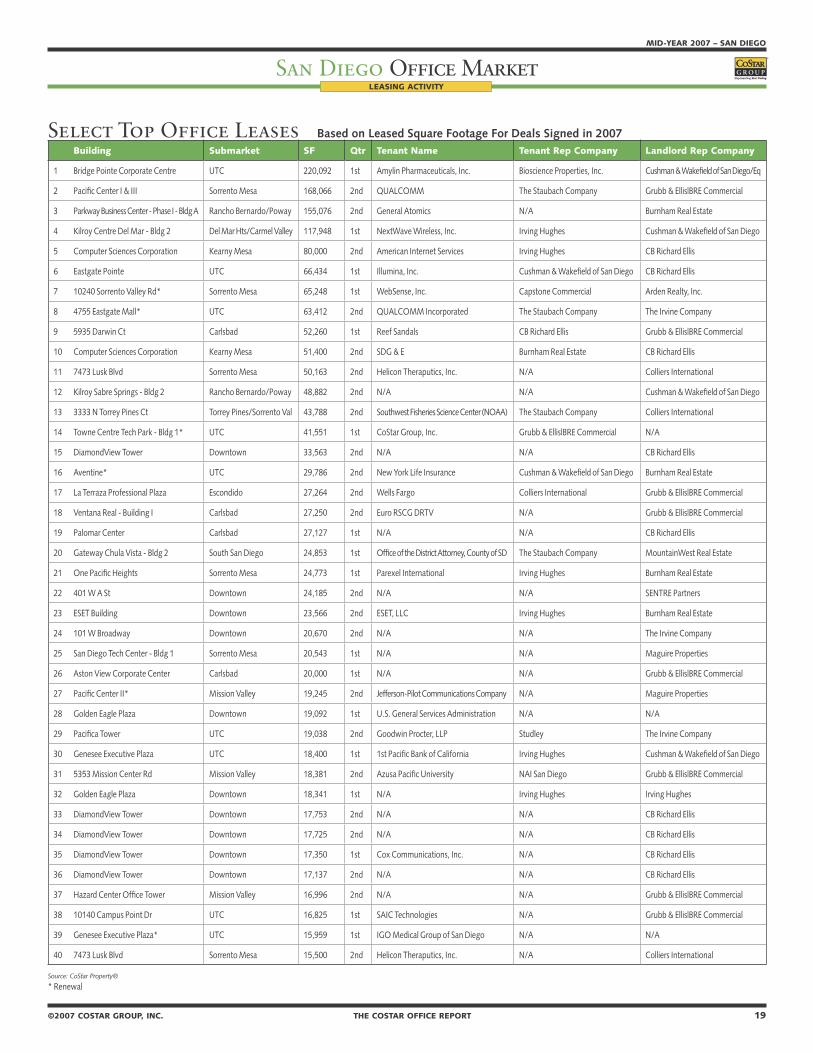
18 THE COSTAR OFFICE REPORT ©2007 COSTAR GROUP, INC.
SAN DIEGO – MID-YEAR 2007
San Diego Office MarketMID-YEAR 2007 – SAN DIEGO
San Diego Office Market
©2007 COSTAR GROUP, INC. THE COSTAR OFFICE REPORT 19
LEASING ACTIVITY
Source: CoStar Property®
* Renewal
Building Submarket SF Qtr Tenant Name Tenant Rep Company Landlord Rep Company
1 Bridge Pointe Corporate Centre UTC 220,092 1st Amylin Pharmaceuticals, Inc. Bioscience Properties, Inc. Cushman & Wakefield of San Diego/Eq
2 Pacific Center I & III Sorrento Mesa 168,066 2nd QUALCOMM The Staubach Company Grubb & Ellis|BRE Commercial
3 Parkway Business Center - Phase I - Bldg A Rancho Bernardo/Poway 155,076 2nd General Atomics N/A Burnham Real Estate
4 Kilroy Centre Del Mar - Bldg 2 Del Mar Hts/Carmel Valley 117,948 1st NextWave Wireless, Inc. Irving Hughes Cushman & Wakefield of San Diego
5 Computer Sciences Corporation Kearny Mesa 80,000 2nd American Internet Services Irving Hughes CB Richard Ellis
6 Eastgate Pointe UTC 66,434 1st Illumina, Inc. Cushman & Wakefield of San Diego CB Richard Ellis
7 10240 Sorrento Valley Rd* Sorrento Mesa 65,248 1st WebSense, Inc. Capstone Commercial Arden Realty, Inc.
8 4755 Eastgate Mall* UTC 63,412 2nd QUALCOMM Incorporated The Staubach Company The Irvine Company
9 5935 Darwin Ct Carlsbad 52,260 1st Reef Sandals CB Richard Ellis Grubb & Ellis|BRE Commercial
10 Computer Sciences Corporation Kearny Mesa 51,400 2nd SDG & E Burnham Real Estate CB Richard Ellis
11 7473 Lusk Blvd Sorrento Mesa 50,163 2nd Helicon Theraputics, Inc. N/A Colliers International
12 Kilroy Sabre Springs - Bldg 2 Rancho Bernardo/Poway 48,882 2nd N/A N/A Cushman & Wakefield of San Diego
13 3333 N Torrey Pines Ct Torrey Pines/Sorrento Val 43,788 2nd Southwest Fisheries Science Center (NOAA) The Staubach Company Colliers International
14 Towne Centre Tech Park - Bldg 1* UTC 41,551 1st CoStar Group, Inc. Grubb & Ellis|BRE Commercial N/A
15 DiamondView Tower Downtown 33,563 2nd N/A N/A CB Richard Ellis
16 Aventine* UTC 29,786 2nd New York Life Insurance Cushman & Wakefield of San Diego Burnham Real Estate
17 La Terraza Professional Plaza Escondido 27,264 2nd Wells Fargo Colliers International Grubb & Ellis|BRE Commercial
18 Ventana Real - Building I Carlsbad 27,250 2nd Euro RSCG DRTV N/A Grubb & Ellis|BRE Commercial
19 Palomar Center Carlsbad 27,127 1st N/A N/A CB Richard Ellis
20 Gateway Chula Vista - Bldg 2 South San Diego 24,853 1st Office of the District Attorney, County of SD The Staubach Company MountainWest Real Estate
21 One Pacific Heights Sorrento Mesa 24,773 1st Parexel International Irving Hughes Burnham Real Estate
22 401 W A St Downtown 24,185 2nd N/A N/A SENTRE Partners
23 ESET Building Downtown 23,566 2nd ESET, LLC Irving Hughes Burnham Real Estate
24 101 W Broadway Downtown 20,670 2nd N/A N/A The Irvine Company
25 San Diego Tech Center - Bldg 1 Sorrento Mesa 20,543 1st N/A N/A Maguire Properties
26 Aston View Corporate Center Carlsbad 20,000 1st N/A N/A Grubb & Ellis|BRE Commercial
27 Pacific Center II* Mission Valley 19,245 2nd Jefferson-Pilot Communications Company N/A Maguire Properties
28 Golden Eagle Plaza Downtown 19,092 1st U.S. General Services Administration N/A N/A
29 Pacifica Tower UTC 19,038 2nd Goodwin Procter, LLP Studley The Irvine Company
30 Genesee Executive Plaza UTC 18,400 1st 1st Pacific Bank of California Irving Hughes Cushman & Wakefield of San Diego
31 5353 Mission Center Rd Mission Valley 18,381 2nd Azusa Pacific University NAI San Diego Grubb & Ellis|BRE Commercial
32 Golden Eagle Plaza Downtown 18,341 1st N/A Irving Hughes Irving Hughes
33 DiamondView Tower Downtown 17,753 2nd N/A N/A CB Richard Ellis
34 DiamondView Tower Downtown 17,725 2nd N/A N/A CB Richard Ellis
35 DiamondView Tower Downtown 17,350 1st Cox Communications, Inc. N/A CB Richard Ellis
36 DiamondView Tower Downtown 17,137 2nd N/A N/A CB Richard Ellis
37 Hazard Center Office Tower Mission Valley 16,996 2nd N/A N/A Grubb & Ellis|BRE Commercial
38 10140 Campus Point Dr UTC 16,825 1st SAIC Technologies N/A Grubb & Ellis|BRE Commercial
39 Genesee Executive Plaza* UTC 15,959 1st IGO Medical Group of San Diego N/A N/A
40 7473 Lusk Blvd Sorrento Mesa 15,500 2nd Helicon Theraputics, Inc. N/A Colliers International
Select Top Office Leases Based on Leased Square Footage For Deals Signed in 2007

20 THE COSTAR OFFICE REPORT ©2007 COSTAR GROUP, INC.
SAN DIEGO – MID-YEAR 2007
San Diego Office MarketMID-YEAR 2007 – SAN DIEGO
San Diego Office Market
©2007 COSTAR GROUP, INC. THE COSTAR OFFICE REPORT 21
SALES ACTIVITY
The Optimist Sales Index Average of Two Highest Price/SF's and Two Lowest Cap Rates Per Quarter
Source: CoStar COMPS®
Sales Volume & Price Sales Analysis by Building SizeBased on Office Building Sales of 15,000 SF and Larger Based on Office Building Sales From April 2006 - March 2007
Bldg Size # RBA $ Volume Price/SF Cap Rate
< 50,000 SF 180 1,672,455 443,883,674$ 265.41$ 5.84%
50K-249K SF 34 3,841,608 1,083,689,657$ 282.09$ 6.19%
250K-499K SF 1 338,905 95,500,000$ 281.79$ 5.76%
>500K SF 3 1,678,767 568,500,000$ 338.64$ -
Source: CoStar COMPS® Source: CoStar COMPS®
U.S. Price/SF Comparison U.S. Cap Rate ComparisonBased on Office Building Sales of 15,000 SF and Larger Based on Office Building Sales of 15,000 SF and Larger
Source: CoStar COMPS® Source: CoStar COMPS®
$20
$70
$120
$170
$220
$270
$320
$370
20022q
20024q
20032q
20034q
20042q
20044q
20052q
20054q
20062q
20064q
Dollar
s per
SF
San Diego US
$0
$100
$200
$300
$400
$500
$600
$700
$800
$900
$1,000
20022q
20024q
20032q
20034q
20042q
20044q
20052q
20054q
20062q
20064q
Millio
ns
of
Sal
es V
olu
me
Do
llar
s
$0
$50
$100
$150
$200
$250
$300
$350
Price
/SF
Sales Volume Price/SF
0.0%
1.0%
2.0%
3.0%
4.0%
5.0%
6.0%
7.0%
2004 2q 2004 3q 2004 4q 2005 1q 2005 2q 2005 3q 2005 4q 2006 1q 2006 2q 2006 3q 2006 4q 2007 1q
Cap
Rat
e P
erc
enta
ge
$0
$100
$200
$300
$400
$500
$600
Dollars/S
F
Cap Rate Price/SF
4.5%
5.5%
6.5%
7.5%
8.5%
9.5%
10.5%
20022q
20024q
20032q
20034q
20042q
20044q
20052q
20054q
20062q
20064q
Cap
Rat
e P
erc
enta
ge
San Diego US
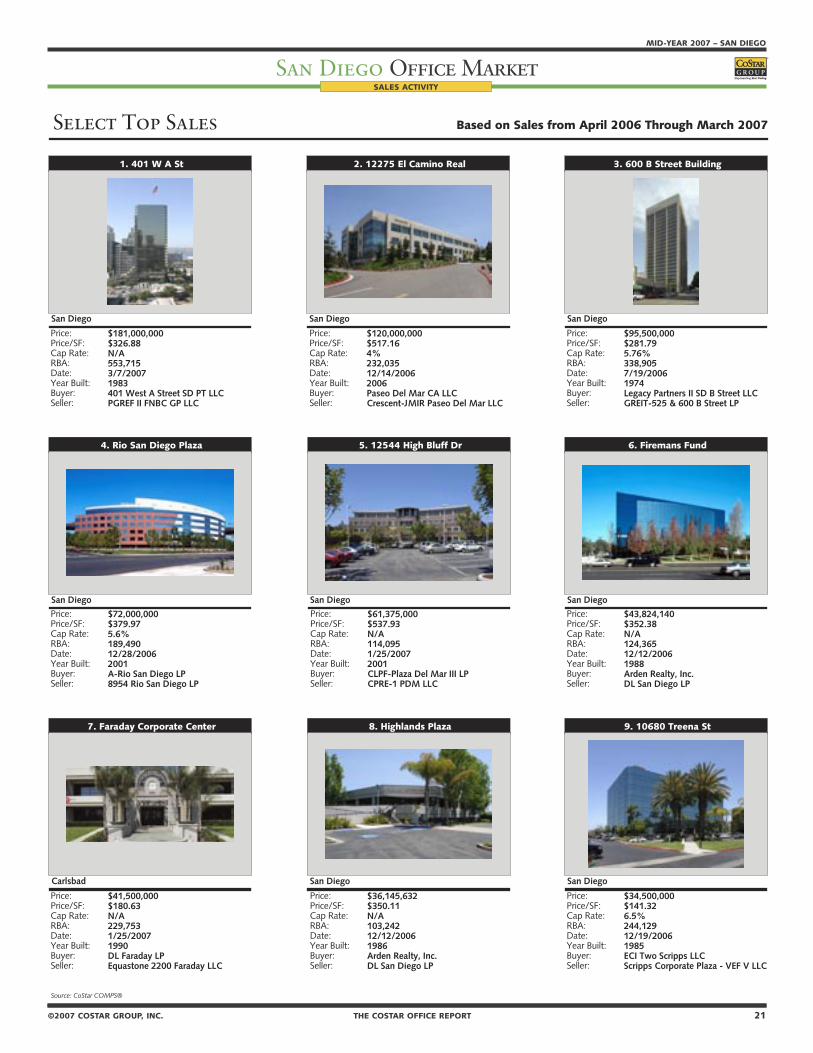
20 THE COSTAR OFFICE REPORT ©2007 COSTAR GROUP, INC.
SAN DIEGO – MID-YEAR 2007
San Diego Office MarketMID-YEAR 2007 – SAN DIEGO
San Diego Office Market
©2007 COSTAR GROUP, INC. THE COSTAR OFFICE REPORT 21
SALES ACTIVITY
���������������� �������������������������������������������������
���������������������
���������������������������������������������������������
����������������������������������������������������������������������������������������
��������������
���������
���������������������������������������������������������
���������������������������������������������������������������������������������������������
������������������������
���������
���������������������������������������������������������
��������������������������������������������������������������������������������������������������������
�������������������������
���������
���������������������������������������������������������
����������������������������������������������������������������������������������
�����������������������
���������
���������������������������������������������������������
��������������������������������������������������������������������������������
�����������������������
���������
���������������������������������������������������������
���������������������������������������������������������������������������
�����������������
���������
���������������������������������������������������������
��������������������������������������������������������������������������������
����������������������������
��������
���������������������������������������������������������
���������������������������������������������������������������������������
�������������������
���������
���������������������������������������������������������
�������������������������������������������������������������������������������������������������
�������������������
���������

22 THE COSTAR OFFICE REPORT ©2007 COSTAR GROUP, INC.
SAN DIEGO – MID-YEAR 2007
San Diego Office Market
©2007 COSTAR GROUP, INC. THE COSTAR OFFICE REPORT 23
MID-YEAR 2007 – SAN DIEGO
San Diego Office MarketMARKET HIGHLIGHTS – CLASS “A, B & C”
�������������������������� �����������������������������������������������������
�����������������������������������������������������������������������������
�����������������������������������������������
������������������������������������������������������������
��������������������������������������������������������������������������������������������
������������������������������������������������������������������
����������������������������������������������������������
������������������������������
�����������������������������������������������������������������������������
�������������������������������������������������������
��������������������������������������������������������������������������
��������������������������������������������������������������������������������������
������������������������������������������������������������������
�������������������������������������������������������������������������������������������
������������������������������
�����������������������������������������������������������������������������
�����������������������������������������������������
����������������������������������������������������������������������������
��������������������������������������������������������������������������������
������������������������������������������������������������������
��������������������������������������������������������������������������������������
������������������������������
�����������������������������������������������������������������������������
����������������������������������������������������
�����������������������������������������������������������������������������
�������������������������������������������������������������������������������������������������������������
������������������������������������������������������������������
�����������������������������������������������������������������������������������������������������������������������������������
������������������������������
���������������������
SALES ACTIVITY
Select Land Sales Based on Commercially Zoned Land Sales Occurring From April 2006 - March 2007
450 2nd Ave, San Diego 5897 Copley Dr, San Diego Carmel Mountain, S of Vista Sorrento, San Diego
Sale Price: $36,500,000 Sale Price: $30,400,000 Sale Price: $20,500,000Acres: 1.38 Acres: 20.56 Acres: 7.70Price/SF: $608.34 Price/SF: $33.94 Price/SF: $61.12Closing Date: 05/02/2006 Closing Date: 08/08/2006 Closing Date: 06/29/2006Zoning: MPD, San Diego Zoning: M-1B, San Diego Zoning: IL2-1, San DiegoIntended Use: Commercial Intended Use: Industrial Intended Use: OfficeBuyer: Bosa Development California II, Inc. Buyer: Terraces at Copley Point Pre-Development Buyer: Torrey Hills Office Partners LPSeller: McKinnon Properties, Inc Seller: San Diego Unified School District Seller: Cognac Torrey Hills LLC
cnr Gateway Rd & Innovation Way, Carlsbad cnr El Camino Real & Costa Del Mar Rd, Carlsbad 160 Calle Magdalena, Encinitas
Sale Price: $14,316,500 Sale Price: $10,500,000 Sale Price: $9,600,000Acres: 11.96 Acres: 3.13 Acres: 4.40Price/SF: $27.48 Price/SF: $77.01 Price/SF: $50.09Closing Date: 07/28/2006 Closing Date: 09/15/2006 Closing Date: 09/13/2006Zoning: PC, Carlsbad Zoning: PC, Carlsbad Zoning: C, EncinitasIntended Use: Office Intended Use: PC Zoned Acreage Intended Use: OfficeBuyer: Bressi Ocean Collection LLC Buyer: Arenal Road LLC Buyer: City of EncinitasSeller: Carlsbad-BC Partners LP Seller: KSL La Costa I LLC Seller: 160 Calle Magdalena LLC
Source: CoStar COMPS®
Source: CoStar COMPS®

22 THE COSTAR OFFICE REPORT ©2007 COSTAR GROUP, INC.
SAN DIEGO – MID-YEAR 2007
San Diego Office Market
©2007 COSTAR GROUP, INC. THE COSTAR OFFICE REPORT 23
MID-YEAR 2007 – SAN DIEGO
San Diego Office MarketMARKET HIGHLIGHTS – CLASS “A, B & C”
C E N T R A L S U B U R B A N M A R K E T
Deliveries, Absorption & Vacancy Historical Analysis, All Classes
Source: CoStar Property®
Vacant Space Quoted Rental RatesHistorical Analysis, All Classes Historical Analysis, All Classes
Source: CoStar Property® Source: CoStar Property®
Net QuotedPeriod # Bldgs Total RBA Vacant SF Vacancy % Absorption # Bldgs Total RBA # Bldgs Total RBA Rates2007 2q 1,476 26,909,305 2,387,130 8.9% (24,025) 2 49,222 13 950,790 $27.74
2007 1q 1,474 26,860,083 2,313,883 8.6% (30,392) 0 0 13 620,012 $27.85
2006 4q 1,474 26,860,083 2,283,491 8.5% 62,369 6 202,830 11 572,012 $26.44
2006 3q 1,468 26,657,253 2,143,030 8.0% (1,317) 4 83,835 15 644,842 $26.09
2006 2q 1,464 26,573,418 2,057,878 7.7% (43,155) 0 0 17 606,366 $25.97
2006 1q 1,464 26,573,418 2,014,723 7.6% 71,301 0 0 16 588,366 $25.89
2005 4q 1,464 26,573,418 2,086,024 7.9% 47,913 0 0 5 233,835 $25.42
2005 3q 1,465 26,609,003 2,169,522 8.2% 8,094 1 50,663 4 231,018 $25.45
2005 2q 1,464 26,558,340 2,126,953 8.0% 506,715 6 422,587 3 209,663 $25.23
2005 1q 1,458 26,135,753 2,211,081 8.5% 156,983 4 127,213 7 473,250 $25.33
2004 4q 1,454 26,008,540 2,240,851 8.6% (21,311) 0 0 11 600,463 $25.27
2004 3q 1,455 26,010,140 2,221,140 8.5% 93,604 1 26,000 9 513,791 $24.79
2004 2q 1,454 25,984,140 2,288,744 8.8% 41,871 1 82,236 8 442,158 $24.67
2004 1q 1,453 25,901,904 2,248,379 8.7% 80,050 3 78,600 5 210,906 $23.92
2003 4q 1,453 25,854,280 2,280,805 8.8% (209,136) 3 123,275 3 159,236 $23.81
2003 3q 1,451 25,742,335 1,959,724 7.6% 160,424 0 0 6 282,511 $23.45
Source: CoStar Property®
UC InventoryDelivered InventoryExisting Inventory Vacancy
(0.100)
0.000
0.100
0.200
0.300
0.400
0.500
0.600
2004 1q 2004 2q 2004 3q 2004 4q 2005 1q 2005 2q 2005 3q 2005 4q 2006 1q 2006 2q 2006 3q 2006 4q 2007 1q 2007 2q
Millio
ns
SF
6.5%
7.0%
7.5%
8.0%
8.5%
9.0%
Perce
nt V
acant
Delivered SF Absorption SF Vacancy
$24.50
$25.00
$25.50
$26.00
$26.50
$27.00
$27.50
$28.00
2006 1q 2006 2q 2006 3q 2006 4q 2007 1q 2007 2q
Dollar
s/SF/Y
ear
0.00
0.50
1.00
1.50
2.00
2.50
3.00
2006 1q 2006 2q 2006 3q 2006 4q 2007 1q 2007 2q
Millio
ns
SF
Direct SF Sublet SF

24 THE COSTAR OFFICE REPORT ©2007 COSTAR GROUP, INC.
SAN DIEGO – MID-YEAR 2007
San Diego Office MarketMARKET HIGHLIGHTS – CLASS “A, B & C”
©2007 COSTAR GROUP, INC. THE COSTAR OFFICE REPORT 25
MID-YEAR 2007 – SAN DIEGO
San Diego Office MarketMARKET HIGHLIGHTS – CLASS “A, B & C”
D O W N T O W N M A R K E T
Deliveries, Absorption & Vacancy Historical Analysis, All Classes
Source: CoStar Property®
Vacant Space Quoted Rental RatesHistorical Analysis, All Classes Historical Analysis, All Classes
Source: CoStar Property® Source: CoStar Property®
Net QuotedPeriod # Bldgs Total RBA Vacant SF Vacancy % Absorption # Bldgs Total RBA # Bldgs Total RBA Rates2007 2q 245 12,604,681 1,610,333 12.8% 230,372 0 0 1 80,000 $32.88
2007 1q 245 12,604,681 1,840,705 14.6% (110,800) 1 306,750 1 80,000 $32.83
2006 4q 244 12,297,931 1,423,155 11.6% (1,782) 1 109,389 2 386,750 $32.36
2006 3q 243 12,188,542 1,311,984 10.8% 38,964 1 47,040 3 496,139 $32.81
2006 2q 242 12,141,502 1,303,908 10.7% 11,326 0 0 4 543,179 $32.23
2006 1q 242 12,141,502 1,315,234 10.8% 19,554 0 0 4 543,179 $31.55
2005 4q 243 12,143,696 1,336,982 11.0% 29,086 0 0 3 463,179 $30.10
2005 3q 244 12,152,532 1,374,904 11.3% 21,524 1 381,043 3 463,179 $29.28
2005 2q 244 11,862,970 1,106,866 9.3% 88,035 0 0 4 844,222 $28.84
2005 1q 245 11,886,970 1,218,901 10.3% (22,834) 0 0 2 490,432 $27.58
2004 4q 246 11,891,784 1,200,881 10.1% (38,328) 0 0 2 490,432 $27.62
2004 3q 246 11,891,784 1,162,553 9.8% 31,868 0 0 1 381,043 $25.91
2004 2q 246 11,891,784 1,194,421 10.0% 66,274 0 0 1 381,043 $25.72
2004 1q 246 11,891,784 1,260,695 10.6% 96,964 0 0 1 381,043 $25.66
2003 4q 248 11,939,784 1,405,659 11.8% (75,516) 0 0 1 381,043 $25.43
2003 3q 249 11,942,484 1,332,843 11.2% (39,499) 0 0 0 0 $25.18
Source: CoStar Property®
UC InventoryDelivered InventoryExisting Inventory Vacancy
(0.200)
(0.100)
0.000
0.100
0.200
0.300
0.400
0.500
2004 1q 2004 2q 2004 3q 2004 4q 2005 1q 2005 2q 2005 3q 2005 4q 2006 1q 2006 2q 2006 3q 2006 4q 2007 1q 2007 2q
Millio
ns
SF
0.0%
2.0%
4.0%
6.0%
8.0%
10.0%
12.0%
14.0%
16.0%
Perce
nt V
acant
Delivered SF Absorption SF Vacancy
$30.50
$31.00
$31.50
$32.00
$32.50
$33.00
2006 1q 2006 2q 2006 3q 2006 4q 2007 1q 2007 2q
Dollar
s/SF/Y
ear
0.00
0.20
0.40
0.60
0.80
1.00
1.20
1.40
1.60
1.80
2.00
2006 1q 2006 2q 2006 3q 2006 4q 2007 1q 2007 2q
Millio
ns
SF
Direct SF Sublet SF

24 THE COSTAR OFFICE REPORT ©2007 COSTAR GROUP, INC.
SAN DIEGO – MID-YEAR 2007
San Diego Office MarketMARKET HIGHLIGHTS – CLASS “A, B & C”
©2007 COSTAR GROUP, INC. THE COSTAR OFFICE REPORT 25
MID-YEAR 2007 – SAN DIEGO
San Diego Office MarketMARKET HIGHLIGHTS – CLASS “A, B & C”
H W Y - 7 8 C O R R I D O R M A R K E T
Deliveries, Absorption & Vacancy Historical Analysis, All Classes
Source: CoStar Property®
Vacant Space Quoted Rental RatesHistorical Analysis, All Classes Historical Analysis, All Classes
Source: CoStar Property® Source: CoStar Property®
Net QuotedPeriod # Bldgs Total RBA Vacant SF Vacancy % Absorption # Bldgs Total RBA # Bldgs Total RBA Rates2007 2q 302 3,705,681 276,881 7.5% 10,435 1 4,903 17 381,593 $29.50
2007 1q 301 3,700,778 282,413 7.6% 8,886 1 15,461 6 156,255 $27.25
2006 4q 300 3,685,317 275,838 7.5% 67,895 1 10,538 7 171,716 $26.57
2006 3q 299 3,674,779 333,195 9.1% 45,180 1 111,639 6 149,997 $25.99
2006 2q 298 3,563,140 266,736 7.5% 66,025 0 0 5 241,272 $24.94
2006 1q 298 3,563,140 332,761 9.3% 10,423 3 68,973 4 201,272 $24.87
2005 4q 295 3,494,167 274,211 7.8% 25,049 1 4,000 4 180,612 $23.04
2005 3q 294 3,490,167 295,260 8.5% (48,811) 0 0 5 184,612 $22.28
2005 2q 294 3,490,167 246,449 7.1% 19,983 1 14,850 4 72,973 $21.85
2005 1q 293 3,475,317 251,582 7.2% 7,491 4 17,030 3 57,364 $21.73
2004 4q 289 3,458,287 242,043 7.0% 81,537 1 30,000 5 31,880 $20.84
2004 3q 288 3,428,287 293,580 8.6% (45,672) 0 0 6 61,880 $21.81
2004 2q 288 3,428,287 247,908 7.2% 3,874 0 0 6 61,880 $22.44
2004 1q 288 3,428,287 251,782 7.3% (50,758) 0 0 2 44,850 $22.87
2003 4q 288 3,428,287 201,024 5.9% (12,058) 0 0 1 14,850 $22.16
2003 3q 288 3,428,287 188,966 5.5% 27,040 1 22,766 0 0 $22.42
Source: CoStar Property®
UC InventoryDelivered InventoryExisting Inventory Vacancy
(0.060)
(0.040)
(0.020)
0.000
0.020
0.040
0.060
0.080
0.100
0.120
2004 1q 2004 2q 2004 3q 2004 4q 2005 1q 2005 2q 2005 3q 2005 4q 2006 1q 2006 2q 2006 3q 2006 4q 2007 1q 2007 2q
Millio
ns
SF
0.0%
1.0%
2.0%
3.0%
4.0%
5.0%
6.0%
7.0%
8.0%
9.0%
10.0%
Perce
nt V
acant
Delivered SF Absorption SF Vacancy
$22.00
$23.00
$24.00
$25.00
$26.00
$27.00
$28.00
$29.00
$30.00
2006 1q 2006 2q 2006 3q 2006 4q 2007 1q 2007 2q
Dollar
s/SF/Y
ear
0.00
0.05
0.10
0.15
0.20
0.25
0.30
0.35
2006 1q 2006 2q 2006 3q 2006 4q 2007 1q 2007 2q
Millio
ns
SF
Direct SF Sublet SF

26 THE COSTAR OFFICE REPORT ©2007 COSTAR GROUP, INC.
SAN DIEGO – MID-YEAR 2007
San Diego Office MarketMARKET HIGHLIGHTS – CLASS “A, B & C”
©2007 COSTAR GROUP, INC. THE COSTAR OFFICE REPORT 27
MID-YEAR 2007 – SAN DIEGO
San Diego Office MarketMARKET HIGHLIGHTS – CLASS “A, B & C”
I - 1 5 C O R R I D O R M A R K E TMARKET HIGHLIGHTS – CLASS “A, B & C”
Deliveries, Absorption & Vacancy Historical Analysis, All Classes
Source: CoStar Property®
Vacant Space Quoted Rental RatesHistorical Analysis, All Classes Historical Analysis, All Classes
Source: CoStar Property® Source: CoStar Property®
Net QuotedPeriod # Bldgs Total RBA Vacant SF Vacancy % Absorption # Bldgs Total RBA # Bldgs Total RBA Rates2007 2q 542 10,989,418 1,691,396 15.4% 21,525 3 225,640 13 1,287,976 $32.69
2007 1q 539 10,763,778 1,487,281 13.8% 64,853 3 191,061 16 1,513,616 $32.23
2006 4q 536 10,572,717 1,361,073 12.9% 24,393 3 113,929 18 1,621,055 $31.27
2006 3q 533 10,458,788 1,271,537 12.2% (152,789) 0 0 17 1,444,595 $31.13
2006 2q 533 10,458,788 1,118,748 10.7% 19,337 1 56,202 13 973,680 $29.49
2006 1q 532 10,402,586 1,081,883 10.4% (60,365) 2 113,706 13 988,971 $29.44
2005 4q 530 10,288,880 907,812 8.8% 143,253 2 56,725 10 877,304 $28.65
2005 3q 528 10,232,155 994,340 9.7% 100,277 4 257,876 5 226,633 $26.99
2005 2q 524 9,974,279 836,741 8.4% (75,742) 0 0 9 484,509 $26.75
2005 1q 524 9,974,279 760,999 7.6% (35,581) 0 0 6 314,601 $25.74
2004 4q 524 9,974,279 725,418 7.3% 283,204 0 0 6 314,601 $25.59
2004 3q 524 9,974,279 1,008,622 10.1% 11,703 3 50,248 4 257,876 $25.33
2004 2q 522 9,966,043 1,012,089 10.2% 53,727 0 0 3 50,248 $25.68
2004 1q 522 9,966,043 1,065,816 10.7% 206,984 0 0 3 50,248 $24.61
2003 4q 522 9,966,043 1,272,800 12.8% (22,613) 1 23,485 1 12,759 $24.85
2003 3q 521 9,942,558 1,226,702 12.3% 37,055 0 0 1 23,485 $25.58
Source: CoStar Property®
UC InventoryDelivered InventoryExisting Inventory Vacancy
(0.200)
(0.150)
(0.100)
(0.050)
0.000
0.050
0.100
0.150
0.200
0.250
0.300
0.350
2004 1q 2004 2q 2004 3q 2004 4q 2005 1q 2005 2q 2005 3q 2005 4q 2006 1q 2006 2q 2006 3q 2006 4q 2007 1q 2007 2q
Millio
ns
SF
0.0%
2.0%
4.0%
6.0%
8.0%
10.0%
12.0%
14.0%
16.0%
18.0%
Perce
nt V
acant
Delivered SF Absorption SF Vacancy
$27.00
$28.00
$29.00
$30.00
$31.00
$32.00
$33.00
2006 1q 2006 2q 2006 3q 2006 4q 2007 1q 2007 2q
Dollar
s/SF/Y
ear
0.00
0.20
0.40
0.60
0.80
1.00
1.20
1.40
1.60
1.80
2006 1q 2006 2q 2006 3q 2006 4q 2007 1q 2007 2q
Millio
ns
SF
Direct SF Sublet SF

26 THE COSTAR OFFICE REPORT ©2007 COSTAR GROUP, INC.
SAN DIEGO – MID-YEAR 2007
San Diego Office MarketMARKET HIGHLIGHTS – CLASS “A, B & C”
©2007 COSTAR GROUP, INC. THE COSTAR OFFICE REPORT 27
MID-YEAR 2007 – SAN DIEGO
San Diego Office MarketMARKET HIGHLIGHTS – CLASS “A, B & C”
N O R T H C I T I E S M A R K E TMARKET HIGHLIGHTS – CLASS “A, B & C”
Deliveries, Absorption & Vacancy Historical Analysis, All Classes
Source: CoStar Property®
Vacant Space Quoted Rental RatesHistorical Analysis, All Classes Historical Analysis, All Classes
Source: CoStar Property® Source: CoStar Property®
Net QuotedPeriod # Bldgs Total RBA Vacant SF Vacancy % Absorption # Bldgs Total RBA # Bldgs Total RBA Rates2007 2q 545 28,831,070 2,924,351 10.1% 62,237 0 0 5 920,066 $35.94
2007 1q 545 28,831,070 2,986,588 10.4% 395,191 1 450,000 5 920,066 $35.60
2006 4q 544 28,381,070 2,931,779 10.3% 210,858 4 272,560 5 1,312,851 $34.62
2006 3q 540 28,108,510 2,870,077 10.2% (26,087) 4 375,336 8 1,238,392 $33.54
2006 2q 536 27,733,174 2,468,654 8.9% 307,971 1 540,000 9 1,097,896 $32.83
2006 1q 535 27,193,174 2,236,625 8.2% 260,416 0 0 9 1,592,896 $32.47
2005 4q 535 27,193,174 2,497,041 9.2% 517,528 2 71,403 9 1,592,896 $32.15
2005 3q 533 27,121,771 2,943,166 10.9% 333,524 2 134,631 10 1,593,299 $31.19
2005 2q 531 26,987,140 3,142,059 11.6% 292,946 0 0 10 1,571,370 $30.55
2005 1q 531 26,987,140 3,435,005 12.7% (41,831) 1 34,600 6 1,196,034 $29.47
2004 4q 530 26,952,540 3,358,574 12.5% 356,559 2 347,703 6 1,226,560 $29.05
2004 3q 528 26,604,837 3,367,430 12.7% 449,012 2 207,415 7 1,034,263 $29.29
2004 2q 526 26,397,422 3,609,027 13.7% 121,801 0 0 7 747,577 $29.24
2004 1q 526 26,397,422 3,730,828 14.1% 155,903 1 83,653 5 589,718 $28.77
2003 4q 525 26,313,769 3,803,078 14.5% 175,489 1 22,000 4 560,078 $28.42
2003 3q 524 26,291,769 3,956,567 15.0% 124,035 1 208,464 5 582,078 $28.96
Source: CoStar Property®
UC InventoryDelivered InventoryExisting Inventory Vacancy
(0.100)
0.000
0.100
0.200
0.300
0.400
0.500
0.600
2004 1q 2004 2q 2004 3q 2004 4q 2005 1q 2005 2q 2005 3q 2005 4q 2006 1q 2006 2q 2006 3q 2006 4q 2007 1q 2007 2q
Millio
ns
SF
0.0%
2.0%
4.0%
6.0%
8.0%
10.0%
12.0%
14.0%
16.0%
Perce
nt V
acant
Delivered SF Absorption SF Vacancy
$30.00
$31.00
$32.00
$33.00
$34.00
$35.00
$36.00
$37.00
2006 1q 2006 2q 2006 3q 2006 4q 2007 1q 2007 2q
Dollar
s/SF/Y
ear
0.00
0.50
1.00
1.50
2.00
2.50
3.00
3.50
2006 1q 2006 2q 2006 3q 2006 4q 2007 1q 2007 2q
Millio
ns
SF
Direct SF Sublet SF

28 THE COSTAR OFFICE REPORT ©2007 COSTAR GROUP, INC.
SAN DIEGO – MID-YEAR 2007
San Diego Office MarketMARKET HIGHLIGHTS – CLASS “A, B & C”
©2007 COSTAR GROUP, INC. THE COSTAR OFFICE REPORT 29
MID-YEAR 2007 – SAN DIEGO
San Diego Office MarketMARKET HIGHLIGHTS – CLASS “A, B & C”
N O R T H C O U N T Y W E S T M A R K E T
Deliveries, Absorption & Vacancy Historical Analysis, All Classes
Source: CoStar Property®
Vacant Space Quoted Rental RatesHistorical Analysis, All Classes Historical Analysis, All Classes
Source: CoStar Property® Source: CoStar Property®
Net QuotedPeriod # Bldgs Total RBA Vacant SF Vacancy % Absorption # Bldgs Total RBA # Bldgs Total RBA Rates2007 2q 584 9,204,142 1,478,135 16.1% 250,439 20 476,079 47 532,483 $31.70
2007 1q 564 8,728,063 1,252,495 14.4% 30,107 0 0 67 1,008,562 $31.63
2006 4q 564 8,728,063 1,282,602 14.7% 35,100 5 276,465 41 895,825 $31.63
2006 3q 559 8,451,598 1,041,237 12.3% (57,627) 1 60,000 40 1,063,815 $31.67
2006 2q 558 8,391,598 923,610 11.0% 19,489 4 72,228 21 794,955 $31.03
2006 1q 554 8,319,370 870,871 10.5% 29,904 4 140,679 14 523,102 $30.42
2005 4q 550 8,178,691 760,096 9.3% 146,065 1 34,460 11 444,725 $29.14
2005 3q 549 8,144,231 871,701 10.7% 114,013 0 0 7 292,267 $29.03
2005 2q 549 8,144,231 985,714 12.1% 149,575 1 27,894 7 292,267 $28.14
2005 1q 548 8,116,337 1,107,395 13.6% 91,110 3 164,237 5 207,857 $27.20
2004 4q 545 7,952,100 1,034,268 13.0% 33,469 0 0 6 327,131 $27.14
2004 3q 545 7,952,100 1,067,737 13.4% 8,697 0 0 6 327,131 $26.93
2004 2q 545 7,952,100 1,076,434 13.5% 117,852 2 56,861 3 164,237 $26.28
2004 1q 543 7,895,239 1,137,425 14.4% 120,814 1 11,000 4 172,912 $24.61
2003 4q 542 7,884,239 1,247,239 15.8% 66,264 5 48,920 5 183,912 $24.73
2003 3q 537 7,835,319 1,264,583 16.1% 158,384 0 0 7 98,031 $23.47
Source: CoStar Property®
UC InventoryDelivered InventoryExisting Inventory Vacancy
(0.100)
0.000
0.100
0.200
0.300
0.400
0.500
0.600
2004 1q 2004 2q 2004 3q 2004 4q 2005 1q 2005 2q 2005 3q 2005 4q 2006 1q 2006 2q 2006 3q 2006 4q 2007 1q 2007 2q
Millio
ns
SF
0.0%
2.0%
4.0%
6.0%
8.0%
10.0%
12.0%
14.0%
16.0%
18.0%
Perce
nt V
acant
Delivered SF Absorption SF Vacancy
$29.50
$30.00
$30.50
$31.00
$31.50
$32.00
2006 1q 2006 2q 2006 3q 2006 4q 2007 1q 2007 2q
Dollar
s/SF/Y
ear
0.00
0.20
0.40
0.60
0.80
1.00
1.20
1.40
1.60
2006 1q 2006 2q 2006 3q 2006 4q 2007 1q 2007 2q
Millio
ns
SF
Direct SF Sublet SF

28 THE COSTAR OFFICE REPORT ©2007 COSTAR GROUP, INC.
SAN DIEGO – MID-YEAR 2007
San Diego Office MarketMARKET HIGHLIGHTS – CLASS “A, B & C”
©2007 COSTAR GROUP, INC. THE COSTAR OFFICE REPORT 29
MID-YEAR 2007 – SAN DIEGO
San Diego Office MarketMARKET HIGHLIGHTS – CLASS “A, B & C”
S O U T H / S O U T H E A S T C O R R I D O R M A R K E T
Deliveries, Absorption & Vacancy Historical Analysis, All Classes
Source: CoStar Property®
Vacant Space Quoted Rental RatesHistorical Analysis, All Classes Historical Analysis, All Classes
Source: CoStar Property® Source: CoStar Property®
Net QuotedPeriod # Bldgs Total RBA Vacant SF Vacancy % Absorption # Bldgs Total RBA # Bldgs Total RBA Rates2007 2q 751 7,594,525 507,178 6.7% 38,892 1 7,555 20 244,120 $25.62
2007 1q 752 7,604,790 556,335 7.3% 40,703 4 81,760 20 212,594 $24.42
2006 4q 748 7,523,030 515,278 6.8% (36,865) 0 0 23 291,854 $23.95
2006 3q 748 7,523,030 478,413 6.4% 89,462 2 18,642 7 160,548 $23.80
2006 2q 746 7,504,388 549,233 7.3% 73,125 3 36,859 9 179,190 $22.73
2006 1q 744 7,471,496 589,466 7.9% 29,518 3 83,500 8 166,936 $23.35
2005 4q 741 7,387,996 535,484 7.2% 104,060 5 170,657 10 206,606 $23.00
2005 3q 738 7,257,620 509,168 7.0% (34,837) 3 46,415 11 325,218 $22.88
2005 2q 736 7,212,705 429,416 6.0% 74,623 2 38,342 13 353,334 $22.60
2005 1q 736 7,195,702 487,036 6.8% (90,473) 2 9,821 12 337,616 $22.33
2004 4q 734 7,185,881 386,742 5.4% 13,492 1 4,460 10 232,429 $21.87
2004 3q 733 7,181,421 395,774 5.5% (38,874) 0 0 6 213,749 $20.99
2004 2q 733 7,181,421 356,900 5.0% 23,054 1 3,000 5 177,523 $21.74
2004 1q 735 7,232,052 430,585 6.0% 65,906 4 154,372 2 132,202 $21.35
2003 4q 731 7,077,680 342,119 4.8% 34,490 1 19,000 5 157,372 $19.32
2003 3q 730 7,058,680 357,609 5.1% 34,422 0 0 6 176,372 $19.49
Source: CoStar Property®
UC InventoryDelivered InventoryExisting Inventory Vacancy
(0.150)
(0.100)
(0.050)
0.000
0.050
0.100
0.150
0.200
2004 1q 2004 2q 2004 3q 2004 4q 2005 1q 2005 2q 2005 3q 2005 4q 2006 1q 2006 2q 2006 3q 2006 4q 2007 1q 2007 2q
Millio
ns
SF
0.0%
1.0%
2.0%
3.0%
4.0%
5.0%
6.0%
7.0%
8.0%
9.0%
Perce
nt V
acant
Delivered SF Absorption SF Vacancy
$21.00
$21.50
$22.00
$22.50
$23.00
$23.50
$24.00
$24.50
$25.00
$25.50
$26.00
2006 1q 2006 2q 2006 3q 2006 4q 2007 1q 2007 2q
Dollar
s/SF/Y
ear
0.00
0.10
0.20
0.30
0.40
0.50
0.60
0.70
2006 1q 2006 2q 2006 3q 2006 4q 2007 1q 2007 2q
Millio
ns
SF
Direct SF Sublet SF

National Overview**
Atlanta
Austin
Baltimore
Boston
Broward County
Charlotte
Chicago
Cincinnati
Cleveland
Columbus
Dallas/Ft. Worth
Denver
Detroit
Dayton
East Bay/Oakland
Houston
Indianapolis
Inland Empire
Jacksonville
Kansas City
Long Island
Los Angeles
Memphis
Miami-Dade County
Nashville
New York City
Northern New Jersey
Orange County, CA
Orlando
Palm Beach County
Philadelphia
Phoenix
Pittsburgh
Portland
Raleigh/Durham
Sacramento
San Diego
San Francisco
Seattle/Puget Sound
South Bay/San Jose
South Florida*
St. Louis
Tampa/St. Petersburg
Washington
Westchester/So Conn.
In today’s uncertain economic times, the difference between the right decision and a wrong one can mean hundreds of thousands, if not millions of dollars. With the CoStar Market Report, you’ll have the critical information you need to help you and your clients make smarter decisions.
CoStar’s Office or Industrial Market Report, updated every quarter, contains the most current statistics available for you Local market, right now to the submarket level. Comprehensive charts, graphs and detailed narrative will give you a precise picture of absorption, vacancy rates, rental rates, existing inventory and buildings under construction, sales prices, and cap rates.
Individual MarketsIndividual market reports include comprehensive statistics and analysis on local market conditions, right down to the submarket level. Individual reports are available for 45 major U.S. Office markets and 44 major U.S. Industrial Markets. All local market subscriptions include a national overview.Single Market (office or industrial) - Hard Copy $495Single Market (office or industrial) - Electronic Format $695
National EditionThe National edition includes a national overview and comprehensive statistics and analysis on 46 major U.S. Office markets and 45 major U.S. Industrial Markets. Published in PDF format on a CD-ROM version, use it to copy charts and graphs into your client reports, presentations and marketing materials.Single Copy - CD-ROM $7,200
DiscountsReceive 15% off when you buy two copies.Receive 25% off when you purchase 3 or more.
CoStar Market Report
The CoStar Market Report Order Form
MARKET QTY:OFFICE INDUSTRIAL TOTAL QTY SUBTOTAL
Mail to: CoStar Group Attn: Sales 2 Bethesda Metro Center
Bethesda, MD 20814Fax to: (800) 494-0052
Subtotal:
Discount:
Tax:
Total:
* South Florida Report included at no cost with purchase of Broward County, Miami-Dade County, or Palm Beach County Report of the same building type.** National Report included at no cost with purchase of any Market Report of the same building type.
San Diego Office MarketM I D - Y E A R 2 0 0 7
The CoStarOffice Report
Name:
Title:
Company:
Street Address:
City: State: Zip:
Phone: ( ) Email:
My check for $ is enclosed.(Please add local sales tax.)
Charge to my:
Visa Master Card American Express
Credit Card No:
Exp (xx/xxx):
Signature: