costar office report - · pdf filehouston, indianapolis, inland empire (california),...
TRANSCRIPT
National Office MarketY e a r - E n d 2 0 1 7
CoStar Office Statistics

National Office Market
©2018 CoStar Group, Inc. CoStar Office Statistics A
Year-End 2017 – National
Table of ContentsTable of Contents . . . . . . . . . . . . . . . . . . . . . . . . . . . . . . . . . . . . . . . . . . . . . . . . . . . . . . . . . . . . . . . . . AMethodology . . . . . . . . . . . . . . . . . . . . . . . . . . . . . . . . . . . . . . . . . . . . . . . . . . . . . . . . . . . . . . . . . . . . . . BTerms & Definitions. . . . . . . . . . . . . . . . . . . . . . . . . . . . . . . . . . . . . . . . . . . . . . . . . . . . . . . . . . . . . . . . CMarket Highlights & Overview . . . . . . . . . . . . . . . . . . . . . . . . . . . . . . . . . . . . . . . . . . . . . . . . . . . . . . . . 1Inventory & Development Analysis. . . . . . . . . . . . . . . . . . . . . . . . . . . . . . . . . . . . . . . . . . . . . . . . . . . . 16
Inventory & Development AnalysisSelect Top DeliveriesSelect Top Under Construction Properties
Figures at a Glance. . . . . . . . . . . . . . . . . . . . . . . . . . . . . . . . . . . . . . . . . . . . . . . . . . . . . . . . . . . . . . . . 20Figures at a Glance by Class & SubmarketFigures at a Glance Grouped by CBD vs SuburbanHistorical Figures at a Glance
Leasing Activity Analysis. . . . . . . . . . . . . . . . . . . . . . . . . . . . . . . . . . . . . . . . . . . . . . . . . . . . . . . . . . . . 34Select Top Lease Transactions
Sales Activity Analysis . . . . . . . . . . . . . . . . . . . . . . . . . . . . . . . . . . . . . . . . . . . . . . . . . . . . . . . . . . . . . . 36Sales Activity AnalysisSelect Top Sales Transactions
National Office Market
B CoStar Office Statistics ©2018 CoStar Group, Inc.
National – Year-End 2017
National Office Market
©2018 CoStar Group, Inc. CoStar Office Statistics C
Year-End 2017 – National
MethodologyThe CoStar Office Statistics, unless specifically stated otherwise, calculates office statistics using CoStar Group’s entire database of existing and under construction office buildings in each metropolitan area. Included are office, office condominium, office loft, office medical, all classes and all sizes, and both multi-tenant and single-tenant buildings, including owner-occupied buildings. CoStar Group's global database includes approximately 95.6 billion square feet of coverage in 4.4 million properties. All rental rates reported in the CoStar Office Report have been converted to a Full Service equivalent rental rate.
CoStar regularly opens new markets to expand its geographic coverage which results in varying start dates for historical data. Due to differences in market start dates and a desire to show as long a historical timeframe as possible, only the following markets are included in the historical charts within this report: Atlanta, Austin, Baltimore, Boston, Broward County, Charlotte, Chicago, Cincinnati, Cleveland, Columbus, Dallas/Ft Worth, Dayton, Denver, Detroit, East Bay/Oakland, Houston, Indianapolis, Inland Empire (California), Jacksonville (Florida), Kansas City, Long Island (New York), Los Angeles, Memphis, Miami-Dade County, Nashville, Northern New Jersey, Orange (California), Orlando, Palm Beach County, Philadelphia, Phoenix, Pittsburgh, Raleigh/Durham, Sacramento, San Diego, San Francisco, Seattle/Puget Sound, South Bay/San Jose, St. Louis, Tampa/St Petersburg, Washington, and Westchester/So Connecticut. When ever possible all markets are included to provide as broad as possible national coverage. The Market Highlights and Overview narrative includes all markets.
© Copyright 2018 CoStar Group, Inc. All Rights Reserved. Although CoStar makes efforts to ensure the accuracy and reliability of the information contained herein, CoStar makes no guarantee, representation or warranty regarding the quality, accuracy, timeliness or completeness of the information. The publication is provided ‘as is’ and CoStar expressly disclaims any guarantees, representations or warranties of any kind, including those of MERCHANTABILITY AND FITNESS FOR A PARTICULAR PURPOSE.
CoStar Group, Inc.
1331 L ST NW • Washington, DC 20005• (800) 204-5960 • www.costar.com • NASDAQ: CSGP
For information on subscribing to CoStar’s other products and services, please contact us at 1-877-7COSTAR, or visit our web site at www.costar.com
National Office Market
B CoStar Office Statistics ©2018 CoStar Group, Inc.
National – Year-End 2017
National Office Market
©2018 CoStar Group, Inc. CoStar Office Statistics C
Year-End 2017 – National
Terms & DefinitionsAvailability Rate: The ratio of available space to total rentable space, calculated by dividing the total available square feet by the total rentable square feet.Available Space: The total amount of space that is currently being marketed as available for lease in a given time period. It includes any space that is available, regardless of whether the space is vacant, occupied, available for sublease, or available at a future date. Build-to-Suit: A term describing a particular property, developed specifically for a certain tenant to occupy, with structural features, systems, or improvement work designed specifically for the needs of that tenant. A build-to-suit can be leased or owned by the tenant. In a leased build-to-suit, a tenant will usually have a long term lease on the space.Buyer: The individual, group, company, or entity that has purchased a commercial real estate asset.Cap Rate: Short for capitalization rate. The Cap Rate is a calculation that reflects the relationship between one year’s net operating income and the current market value of a particular property. The Cap Rate is calculated by dividing the annual net operating income by the sales price (or asking sales price).CBD: Abbreviation for Central Business District. (See also: Central Business District)Central Business District: The designations of Central Business District (CBD) and Suburban refer to a particular geographic area within a metropolitan statistical area (MSA) describing the level of real estate development found there. The CBD is characterized by a high density, well organized core within the largest city of a given MSA.Class A: A classification used to describe buildings that generally qualify as extremely desirable investment-grade properties and com-mand the highest rents or sale prices compared to other buildings in the same market. Such buildings are well located and provide efficient tenant layouts as well as high quality, and in some buildings, one-of-a-kind floor plans. They can be an architectural or historical landmark designed by prominent architects. These buildings contain a modern mechanical system, and have above-average maintenance and management as well as the best quality materials and workmanship in their trim and interior fittings. They are generally the most attractive and eagerly sought by investors willing to pay a premium for quality.Class B: A classification used to describe buildings that generally qualify as a more speculative investment, and as such, command lower rents or sale prices compared to Class A properties. Such buildings offer utilitarian space without special attractions, and have ordinary design, if new or fairly new; good to excellent design if an older non-landmark building. These buildings typically have average to good maintenance, management and tenants. They are less appealing to tenants than Class A properties, and may be deficient in a number of respects including floor plans, condition and facilities. They lack prestige and must depend chiefly on a lower price to attract tenants and investors.Class C: A classification used to describe buildings that generally qualify as no-frills, older buildings that offer basic space and command lower rents or sale prices compared to other buildings in the same market. Such buildings typically have below-average maintenance and management, and could have mixed or low tenant prestige, inferior elevators, and/or mechanical/electrical systems. These build-ings lack prestige and must depend chiefly on a lower price to attract tenants and investors.Construction Starts: Buildings that began construction during a specific period of time. (See also: Deliveries)Contiguous Blocks of Space: Space within a building that is, or is able to be joined together into a single contiguous space.Deliveries: Buildings that complete construction during a specified period of time. In order for space to be considered delivered, a certifi-
cate of occupancy must have been issued for the property.Delivery Date: The date a building completes construction and receives a certificate of occupancy.Developer: The company, entity or individual that transforms raw land to improved property by use of labor, capital and entrepreneurial efforts. Direct Space: Space that is being offered for lease directly from the landlord or owner of a building, as opposed to space being offered in a building by another tenant (or broker of a tenant) trying to sublet a space that has already been leased.Existing Inventory: The square footage of buildings that have received a certificate of occupancy and are able to be occupied by tenants. It does not include space in buildings that are either planned, under construction or under renovation.Flex Building: A type of building designed to be versatile, which may be used in combination with office (corporate headquarters), research and development, quasi-retail sales, and including but not limited to industrial, warehouse, and distribution uses. A typical flex building will be one or two stories with at least half of the rentable area being used as office space, have ceiling heights of 16 feet or less, and have some type of drive-in door, even though the door may be glassed in or sealed off.Full Service Rental Rate: Rental rates that include all operating expenses such as utilities, electricity, janitorial services, taxes and insur-ance.Gross Absorption: The total change in occupied space over a given period of time, counting space that is occupied but not space that is vacated by tenants. Gross absorption differs from leasing Activity, which is the sum of all space leased over a certain period of time. Unless otherwise noted Gross Absorption includes direct and sublease space.Growth in Inventory: The change in size of the existing square footage in a given area over a given period of time, generally due to the construction of new buildings.Industrial Building: A type of building adapted for such uses as the assemblage, processing, and/or manufacturing of products from raw materials or fabricated parts. Additional uses include warehous-ing, distribution, and maintenance facilities. The primary purpose of the space is for storing, producing, assembling, or distributing product.Landlord Rep: (Landlord Representative) In a typical lease transaction between an owner/landlord and tenant, the broker that represents the interests of the owner/landlord is referred to as the Landlord Rep.Leased Space: All the space that has a financial lease obligation. It includes all leased space, regardless of whether the space is currently occupied by a tenant. Leased space also includes space being offered for sublease.Leasing Activity: The volume of square footage that is commit-ted to and signed under a lease obligation for a specific building or market in a given period of time. It includes direct leases, subleases and renewals of existing leases. It also includes any pre-leasing activity in planned, under construction, or under renovation buildings.Market: Geographic boundaries that serve to delineate core areas that are competitive with each other and constitute a generally accepted primary competitive set of areas. Markets are building-type specific, and are non-overlapping contiguous geographic designations having a cumulative sum that matches the boundaries of the entire Region (See also: Region). Markets can be further subdivided into Submarkets. (See also: Submarkets)Multi-Tenant: Buildings that house more than one tenant at a given time. Usually, multi-tenant buildings were designed and built to accommodate many different floor plans and designs for different
National Office Market
D CoStar Office Statistics ©2018 CoStar Group, Inc.
National – Year-End 2017 Year-End 2017 – National
National Office Market
©2018 CoStar Group, Inc. CoStar Office Statistics 1
tenant needs. (See also: Tenancy).Net Absorption: The net change in occupied space over a given period of time. Unless otherwise noted Net Absorption includes direct and sublease space.Net Rental Rate: A rental rate that excludes certain expenses that a tenant could incur in occupying office space. Such expenses are expected to be paid directly by the tenant and may include janitorial costs, electricity, utilities, taxes, insurance and other related costs.New Space: Sometimes called first generation space, refers to space that has never been occupied and/or leased by a tenant.Occupied Space: Space that is physically occupied by a tenant. It does not include leased space that is not currently occupied by a tenant.Office Building: A type of commercial building used exclusively or primarily for office use (business), as opposed to manufacturing, warehousing, or other uses. Office buildings may sometimes have other associated uses within part of the building, i.e., retail sales, finan-cial, or restaurant, usually on the ground floor.Owner: The company, entity, or individual that holds title on a given building or property.Planned/Proposed: The status of a building that has been announced for future development but not yet started construction.Preleased Space: The amount of space in a building that has been leased prior to its construction completion date, or certificate of occupancy date.Price/SF: Calculated by dividing the price of a building (either sales price or asking sales price) by the Rentable Building Area (RBA).Property Manager: The company and/or person responsible for the day-to-day operations of a building, such as cleaning, trash removal, etc. The property manager also makes sure that the various systems within the building, such as the elevators, HVAC, and electrical systems, are functioning properly.Quoted Rental Rate: The asking rate per square foot for a par-ticular building or unit of space by a broker or property owner. Quoted rental rates may differ from the actual rates paid by tenants following the negotiation of all terms and conditions in a specific lease. RBA: Abbreviation for Rentable Building Area. (See also: Rentable Building Area)Region: Core areas containing a large population nucleus, that together with adjacent communities have a high degree of economic and social integration. Regions are further divided into market areas, called Markets. (See also: Markets)Relet Space: Sometimes called second generation or direct space, refers to existing space that has previously been occupied by another tenant.Rentable Building Area: (RBA) The total square footage of a building that can be occupied by, or assigned to a tenant for the purpose of determining a tenant’s rental obligation. Generally RBA includes a percentage of common areas including all hallways, main lobbies, bathrooms, and telephone closets.Rental Rates: The annual costs of occupancy for a particular space quoted on a per square foot basis.Sales Price: The total dollar amount paid for a particular property at a particular point in time.Sales Volume: The sum of sales prices for a given group of buildings in a given time period.Seller: The individual, group, company, or entity that sells a particular commercial real estate asset.SF: Abbreviation for Square Feet.Single-Tenant: Buildings that are occupied, or intended to be occupied by a single tenant. (See also: Build-to-suit and Tenancy)
Sublease Space: Space that has been leased by a tenant and is being offered for lease back to the market by the tenant with the lease obligation. Sublease space is sometimes referred to as sublet space.Submarkets: Specific geographic boundaries that serve to delin-eate a core group of buildings that are competitive with each other and constitute a generally accepted primary competitive set, or peer group. Submarkets are building type specific (office, industrial, retail, etc.), with distinct boundaries dependent on different factors relevant to each building type. Submarkets are non-overlapping, contiguous geographic designations having a cumulative sum that matches the boundaries of the Market they are located within (See also: Market).Suburban: The Suburban and Central Business District (CBD) des-ignations refer to a particular geographic area within a metropolitan statistical area (MSA). Suburban is defined as including all office inven-tory not located in the CBD. (See also: CBD)Tenancy: A term used to indicate whether or not a building is occu-pied by multiple tenants (See also: Multi-tenant) or a single tenant. (See also: Single-tenant)Tenant Rep: Tenant Rep stands for Tenant Representative. In a typical lease transaction between an owner/landlord and tenant, the broker that represents the interests of the tenant is referred to as a Tenant Rep.Time On Market: A measure of how long a currently available space has been marketed for lease, regardless of whether it is vacant or occupied.Under Construction: Buildings in a state of construction, up until they receive their certificate of occupancy. In order for CoStar to consider a building under construction, the site must have a concrete foundation in place. Abbreviated UC.Vacancy Rate: A measurement expressed as a percentage of the total amount of physically vacant space divided by the total amount of existing inventory. Under construction space generally is not included in vacancy calculations.Vacant Space: Space that is not currently occupied by a tenant, regardless of any lease obligation that may be on the space. Vacant space could be space that is either available or not available. For example, sublease space that is currently being paid for by a tenant but not occupied by that tenant, would be considered vacant space. Likewise, space that has been leased but not yet occupied because of finish work being done, would also be considered vacant space. Weighted Average Rental Rate: Rental rates that are cal-culated by factoring in, or weighting, the square footage associated with each particular rental rate. This has the effect of causing rental rates on larger spaces to affect the average more than that of smaller spaces. The weighted average rental rate is calculated by taking the ratio of the square footage associated with the rental rate on each individual available space to the square footage associated with rental rates on all available spaces, multiplying the rental rate by that ratio, and then adding together all the resulting numbers. Unless specifically specified otherwise, rental rate averages include both Direct and Sublet available spaces.Year Built: The year in which a building completed construction and was issued a certificate of occupancy.YTD: Abbreviation for Year-to-Date. Describes statistics that are cumulative from the beginning of a calendar year through whatever time period is being studied.
National Office Market
D CoStar Office Statistics ©2018 CoStar Group, Inc.
National – Year-End 2017 Year-End 2017 – National
National Office Market
©2018 CoStar Group, Inc. CoStar Office Statistics 1
Overview
U.S.’s Vacancy Stays at 9.4% Net Absorption Positive 19,857,899 SF in the Quarter
The U.S. Office market ended the fourth quarter 2017 with a vacancy rate of 9.4%. The vacancy rate was unchanged over the previous quarter, with net absorp-
tion totaling positive 19,857,899 square feet in the fourth quar-ter. Vacant sublease space increased in the quarter, ending the quarter at 56,350,518 square feet. Rental rates ended the fourth quarter at $25.15, an increase over the previous quarter. A total of 400 buildings delivered to the market in the quarter totaling 21,861,523 square feet, with 150,685,169 square feet still under construction at the end of the quarter.
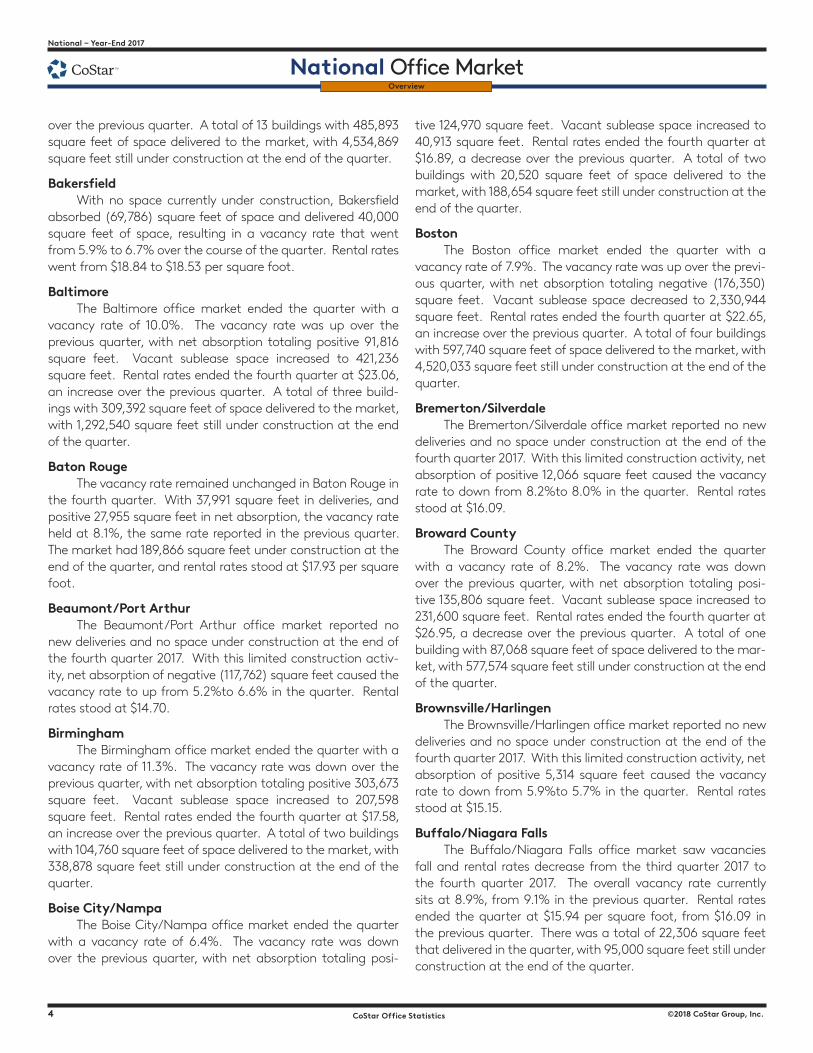
AbsorptionNet absorption for the overall U.S. office market was
positive 19,857,899 square feet in the fourth quarter 2017. That compares to positive 14,324,092 square feet in the third quar-ter 2017, positive 25,324,940 square feet in the second quarter 2017, and positive 17,077,699 square feet in the first quarter 2017.
The Class-A office market recorded net absorption of positive 14,171,958 square feet in the fourth quarter 2017, com-pared to positive 13,808,700 square feet in the third quarter 2017, positive 12,573,203 in the second quarter 2017, and posi-tive 7,808,572 in the first quarter 2017.
The Class-B office market recorded net absorption of positive 3,769,098 square feet in the fourth quarter 2017, compared to positive 1,572,701 square feet in the third quarter 2017, positive 11,493,081 in the second quarter 2017, and posi-tive 9,582,453 in the first quarter 2017.
The Class-C office market recorded net absorption of positive 1,916,843 square feet in the fourth quarter 2017 com-
pared to negative (1,057,309) square feet in the third quarter 2017, positive 1,258,656 in the second quarter 2017, and nega-tive (313,326) in the first quarter 2017.
Net absorption for U.S.’s central business district was positive 4,480,454 square feet in the fourth quarter 2017. That compares to positive 2,685,262 square feet in the third quarter 2017, positive 1,849,800 in the second quarter 2017, and nega-tive (655,703) in the first quarter 2017.
Net absorption for the suburban markets was positive 15,377,445 square feet in the fourth quarter 2017. That com-pares to positive 11,638,830 square feet in third quarter 2017, positive 23,475,140 in the second quarter 2017, and positive 17,733,402 in the first quarter 2017.
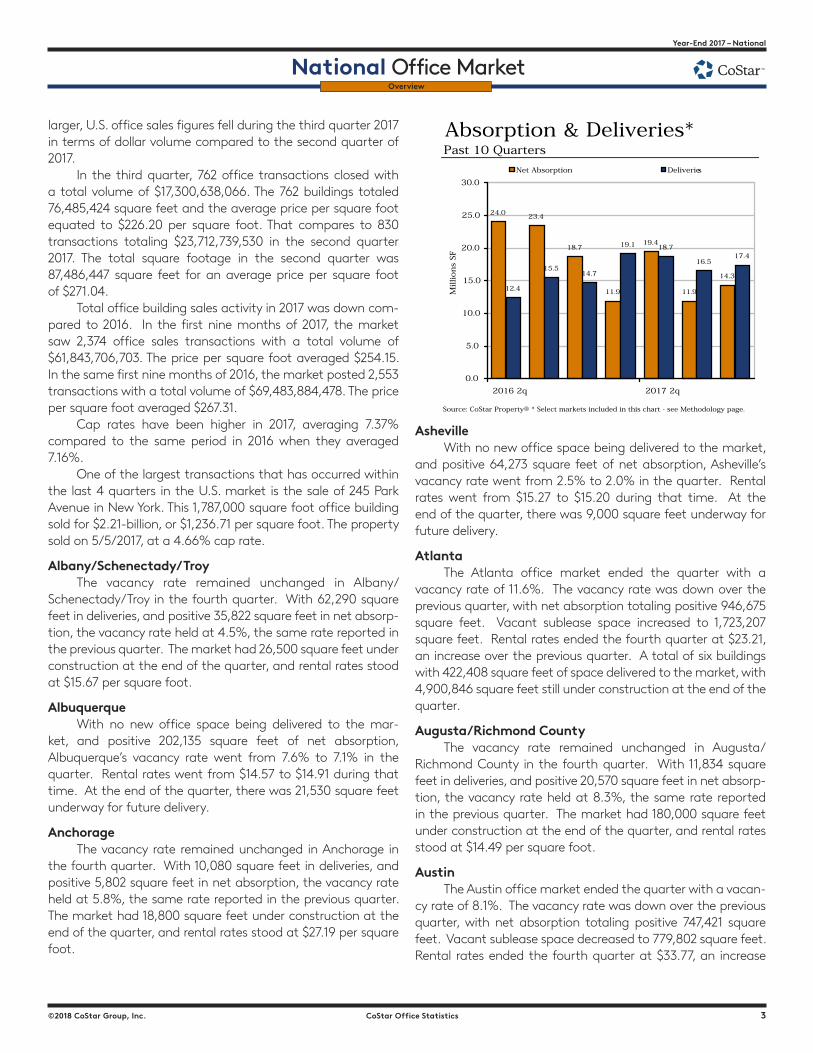
VacancyThe office vacancy rate in the U.S. market area remained
at 9.4% throughout 2017. Class-A projects reported a vacancy rate of 12.2% at the
end of the fourth quarter through second quarter 2017, and 12.1% at the end of the first quarter 2017.
Class-B projects reported a vacancy rate of 9.3% at the end of the fourth quarter 2017, 9.3% at the end of the third quarter 2017, 9.2% at the end of the second quarter 2017, and 9.4% at the end of the first quarter 2017.
Class-C projects reported a vacancy rate of 5.5% at the end of the fourth quarter 2017, 5.6% at the end of third quarter 2017, 5.5% at the end of the second quarter 2017, and 5.6% at the end of the first quarter 2017.
The overall vacancy rate in U.S.’s central business district remained flat in 2017 at 9.5%.
Vacancy Rates by Class* 2000-2017
Source: CoStar Property® * Select markets included in this historical chart - see Methodology page.
Absorption & Deliveries*Past 10 Quarters
Source: CoStar Property® * Select markets included in this chart - see Methodology page.
5%
7%
9%
11%
13%
15%
17%
2000 4q 2001 4q 2002 4q 2003 4q 2004 4q 2005 4q 2006 4q 2007 4q 2008 4q 2009 4q 2010 4q 2011 4q 2012 4q 2013 4q 2014 4q 2015 4q 2016 4q 2017 4
Vaca
ncy
Rate
Class A Class B Class C Total Market
24.023.4
18.7
11.9
19.4
11.9
14.3
12.4
15.514.7
19.1 18.7
16.517.4
0.0
5.0
10.0
15.0
20.0
25.0
30.0
2016 2q 2017 2q
Millions
SF
Net Absorption Deliveries
2 CoStar Office Statistics ©2018 CoStar Group, Inc.
National � Year-End 2017
National Office MarketYear-End 2017 – National
National Office Market
©2018 CoStar Group, Inc. CoStar Office Statistics 3
Overview
The vacancy rate in the suburban markets changed to 9.4% in the fourth quarter 2017. The vacancy rate was 9.4% at the end of the third quarter 2017, 9.3% at the end of the second quarter 2017, and 9.4% at the end of the first quarter 2017.
Largest Lease SigningsThe largest lease signings occurring in 2017 included: the
738,902-square-foot lease signed by Amazon.com at Rainier Square Development in the Seattle/Puget Sound market; the 736,550-square-foot deal signed by Dropbox at The Exchange in the San Francisco market; and the 604,205-square-foot lease signed by Ernst & Young at One Manhattan West in the New York City market.
Sublease VacancyThe amount of vacant sublease space in the U.S. market
increased to 56,350,518 square feet by the end of the fourth quarter 2017, from 54,241,348 square feet at the end of the third quarter 2017. There was 49,892,983 square feet vacant at the end of the second quarter 2017 and 48,432,462 square feet at the end of the first quarter 2017.
U.S.’s Class-A projects reported vacant sublease space of 34,764,626 square feet at the end of fourth quarter 2017, up from the 34,138,376 square feet reported at the end of the third quarter 2017. There were 31,569,803 square feet of sub-lease space vacant at the end of the second quarter 2017, and 30,766,179 square feet at the end of the first quarter 2017.
Class-B projects reported vacant sublease space of 19,129,691 square feet at the end of the fourth quarter 2017, up from the 17,906,251 square feet reported at the end of the third quarter 2017. At the end of the second quarter 2017 there were 16,278,493 square feet, and at the end of the first quarter 2017 there were 15,602,717 square feet vacant.
Class-C projects reported increased vacant sublease space from the third quarter 2017 to the fourth quarter 2017. Sublease vacancy went from 2,196,721 square feet to 2,456,201 square feet during that time. There was 2,044,687 square feet at the end of the second quarter 2017, and 2,063,566 square feet at the end of the first quarter 2017.
Sublease vacancy in U.S.’s central business district stood at 16,435,019 square feet at the end of the fourth quarter 2017. It was 16,079,139 square feet at the end of the third quarter 2017, 14,469,250 square feet at the end of the second quarter 2017, and 14,005,285 square feet at the end of the first quarter 2017.
Sublease vacancy in the suburban markets ended the fourth quarter 2017 at 39,915,499 square feet. At the end of the third quarter 2017 sublease vacancy was 38,162,209 square feet, was 35,423,733 square feet at the end of the second quarter 2017, and was 34,427,177 square feet at the end of the first quarter 2017.
Rental RatesThe average quoted asking rental rate for available office
space, all classes, was $25.15 per square foot per year at the end of the fourth quarter 2017 in the U.S. market area. This represented a 2.2% increase in quoted rental rates from the end of the third quarter 2017, when rents were reported at $24.61 per square foot.
The average quoted rate within the Class-A sector was $31.22 at the end of the fourth quarter 2017, while Class-B rates stood at $22.16, and Class-C rates at $18.25. At the end of the third quarter 2017, Class-A rates were $30.65 per square foot, Class-B rates were $21.90, and Class-C rates were $17.81.
The average quoted asking rental rate in U.S.’s CBD was $32.82 at the end of the fourth quarter 2017, and $23.45 in the suburban markets. In the third quarter 2017, quoted rates were $31.80 in the CBD and $23.03 in the suburbs.
Deliveries and ConstructionDuring the fourth quarter 2017, 400 buildings totaling
21,861,523 square feet were completed in the U.S. market area. This compares to 389 buildings totaling 21,755,412 square feet that were completed in the third quarter 2017, 453 buildings totaling 22,881,478 square feet completed in the second quar-ter 2017, and 22,606,617 square feet in 412 buildings completed in the first quarter 2017.
There were 150,685,169 square feet of office space under construction at the end of the fourth quarter 2017.
Some of the notable 2017 deliveries include: Apple Park, a 2,800,000-square-foot custom built facility that delivered in second quarter 2017 and is now 100% occupied by Apple Inc. in the South Bay/San Jose market, and 150 N Riverside Dr. in the Chicago market, a 1,239,947-square-foot building that deliv-ered in first quarter 2017 and is now 86% occupied.
The largest projects underway at the end of fourth quar-ter 2017 were all in the New York City market including 3 World Trade Center, a 2,861,402-square-foot building with 37% of its space pre-leased, and 30 Hudson Yards, a 2,600,000-square-foot facility that is 100% pre-leased.
InventoryTotal office inventory in the U.S. market area amounted
to 10,957,985,884 square feet in 532,569 buildings as of the end of the fourth quarter 2017. The Class-A office sector consisted of 3,510,679,360 square feet in 18,745 projects. There were 205,414 Class-B buildings totaling 5,063,219,158 square feet, and the Class-C sector consisted of 2,384,087,366 square feet in 308,410 buildings. Within the Office market there were 22,310 owner-occupied buildings accounting for 984,496,057 square feet of office space.
Sales ActivityTallying office building sales of 15,000 square feet or
2 CoStar Office Statistics ©2018 CoStar Group, Inc.
National � Year-End 2017
National Office MarketYear-End 2017 – National
National Office Market
©2018 CoStar Group, Inc. CoStar Office Statistics 3
Overview
larger, U.S. office sales figures fell during the third quarter 2017 in terms of dollar volume compared to the second quarter of 2017.
In the third quarter, 762 office transactions closed with a total volume of $17,300,638,066. The 762 buildings totaled 76,485,424 square feet and the average price per square foot equated to $226.20 per square foot. That compares to 830 transactions totaling $23,712,739,530 in the second quarter 2017. The total square footage in the second quarter was 87,486,447 square feet for an average price per square foot of $271.04.
Total office building sales activity in 2017 was down com-pared to 2016. In the first nine months of 2017, the market saw 2,374 office sales transactions with a total volume of $61,843,706,703. The price per square foot averaged $254.15. In the same first nine months of 2016, the market posted 2,553 transactions with a total volume of $69,483,884,478. The price per square foot averaged $267.31.
Cap rates have been higher in 2017, averaging 7.37% compared to the same period in 2016 when they averaged 7.16%.
One of the largest transactions that has occurred within the last 4 quarters in the U.S. market is the sale of 245 Park Avenue in New York. This 1,787,000 square foot office building sold for $2.21-billion, or $1,236.71 per square foot. The property sold on 5/5/2017, at a 4.66% cap rate.
Albany/Schenectady/TroyThe vacancy rate remained unchanged in Albany/
Schenectady/Troy in the fourth quarter. With 62,290 square feet in deliveries, and positive 35,822 square feet in net absorp-tion, the vacancy rate held at 4.5%, the same rate reported in the previous quarter. The market had 26,500 square feet under construction at the end of the quarter, and rental rates stood at $15.67 per square foot.
AlbuquerqueWith no new office space being delivered to the mar-
ket, and positive 202,135 square feet of net absorption, Albuquerque’s vacancy rate went from 7.6% to 7.1% in the quarter. Rental rates went from $14.57 to $14.91 during that time. At the end of the quarter, there was 21,530 square feet underway for future delivery.
AnchorageThe vacancy rate remained unchanged in Anchorage in
the fourth quarter. With 10,080 square feet in deliveries, and positive 5,802 square feet in net absorption, the vacancy rate held at 5.8%, the same rate reported in the previous quarter. The market had 18,800 square feet under construction at the end of the quarter, and rental rates stood at $27.19 per square foot.
AshevilleWith no new office space being delivered to the market,
and positive 64,273 square feet of net absorption, Asheville’s vacancy rate went from 2.5% to 2.0% in the quarter. Rental rates went from $15.27 to $15.20 during that time. At the end of the quarter, there was 9,000 square feet underway for future delivery.
AtlantaThe Atlanta office market ended the quarter with a
vacancy rate of 11.6%. The vacancy rate was down over the previous quarter, with net absorption totaling positive 946,675 square feet. Vacant sublease space increased to 1,723,207 square feet. Rental rates ended the fourth quarter at $23.21, an increase over the previous quarter. A total of six buildings with 422,408 square feet of space delivered to the market, with 4,900,846 square feet still under construction at the end of the quarter.
Augusta/Richmond CountyThe vacancy rate remained unchanged in Augusta/
Richmond County in the fourth quarter. With 11,834 square feet in deliveries, and positive 20,570 square feet in net absorp-tion, the vacancy rate held at 8.3%, the same rate reported in the previous quarter. The market had 180,000 square feet under construction at the end of the quarter, and rental rates stood at $14.49 per square foot.
AustinThe Austin office market ended the quarter with a vacan-
cy rate of 8.1%. The vacancy rate was down over the previous quarter, with net absorption totaling positive 747,421 square feet. Vacant sublease space decreased to 779,802 square feet. Rental rates ended the fourth quarter at $33.77, an increase
Vacancy Rates by Class* 2000-2017
Source: CoStar Property® * Select markets included in this historical chart - see Methodology page.
Absorption & Deliveries*Past 10 Quarters
Source: CoStar Property® * Select markets included in this chart - see Methodology page.
5%
7%
9%
11%
13%
15%
17%
2000 4q 2001 4q 2002 4q 2003 4q 2004 4q 2005 4q 2006 4q 2007 4q 2008 4q 2009 4q 2010 4q 2011 4q 2012 4q 2013 4q 2014 4q 2015 4q 2016 4q 2017 4
Vaca
ncy
Rate
Class A Class B Class C Total Market
24.023.4
18.7
11.9
19.4
11.9
14.3
12.4
15.514.7
19.1 18.7
16.517.4
0.0
5.0
10.0
15.0
20.0
25.0
30.0
2016 2q 2017 2q
Millions
SF
Net Absorption Deliveries
4 CoStar Office Statistics ©2018 CoStar Group, Inc.
National � Year-End 2017
National Office MarketYear-End 2017 – National
National Office Market
©2018 CoStar Group, Inc. CoStar Office Statistics 5
Overview
over the previous quarter. A total of 13 buildings with 485,893 square feet of space delivered to the market, with 4,534,869 square feet still under construction at the end of the quarter.
BakersfieldWith no space currently under construction, Bakersfield
absorbed (69,786) square feet of space and delivered 40,000 square feet of space, resulting in a vacancy rate that went from 5.9% to 6.7% over the course of the quarter. Rental rates went from $18.84 to $18.53 per square foot.
BaltimoreThe Baltimore office market ended the quarter with a
vacancy rate of 10.0%. The vacancy rate was up over the previous quarter, with net absorption totaling positive 91,816 square feet. Vacant sublease space increased to 421,236 square feet. Rental rates ended the fourth quarter at $23.06, an increase over the previous quarter. A total of three build-ings with 309,392 square feet of space delivered to the market, with 1,292,540 square feet still under construction at the end of the quarter.
Baton RougeThe vacancy rate remained unchanged in Baton Rouge in
the fourth quarter. With 37,991 square feet in deliveries, and positive 27,955 square feet in net absorption, the vacancy rate held at 8.1%, the same rate reported in the previous quarter. The market had 189,866 square feet under construction at the end of the quarter, and rental rates stood at $17.93 per square foot.
Beaumont/Port ArthurThe Beaumont/Port Arthur office market reported no
new deliveries and no space under construction at the end of the fourth quarter 2017. With this limited construction activ-ity, net absorption of negative (117,762) square feet caused the vacancy rate to up from 5.2%to 6.6% in the quarter. Rental rates stood at $14.70.
BirminghamThe Birmingham office market ended the quarter with a
vacancy rate of 11.3%. The vacancy rate was down over the previous quarter, with net absorption totaling positive 303,673 square feet. Vacant sublease space increased to 207,598 square feet. Rental rates ended the fourth quarter at $17.58, an increase over the previous quarter. A total of two buildings with 104,760 square feet of space delivered to the market, with 338,878 square feet still under construction at the end of the quarter.
Boise City/NampaThe Boise City/Nampa office market ended the quarter
with a vacancy rate of 6.4%. The vacancy rate was down over the previous quarter, with net absorption totaling posi-
tive 124,970 square feet. Vacant sublease space increased to 40,913 square feet. Rental rates ended the fourth quarter at $16.89, a decrease over the previous quarter. A total of two buildings with 20,520 square feet of space delivered to the market, with 188,654 square feet still under construction at the end of the quarter.
BostonThe Boston office market ended the quarter with a
vacancy rate of 7.9%. The vacancy rate was up over the previ-ous quarter, with net absorption totaling negative (176,350) square feet. Vacant sublease space decreased to 2,330,944 square feet. Rental rates ended the fourth quarter at $22.65, an increase over the previous quarter. A total of four buildings with 597,740 square feet of space delivered to the market, with 4,520,033 square feet still under construction at the end of the quarter.
Bremerton/SilverdaleThe Bremerton/Silverdale office market reported no new
deliveries and no space under construction at the end of the fourth quarter 2017. With this limited construction activity, net absorption of positive 12,066 square feet caused the vacancy rate to down from 8.2%to 8.0% in the quarter. Rental rates stood at $16.09.
Broward CountyThe Broward County office market ended the quarter
with a vacancy rate of 8.2%. The vacancy rate was down over the previous quarter, with net absorption totaling posi-tive 135,806 square feet. Vacant sublease space increased to 231,600 square feet. Rental rates ended the fourth quarter at $26.95, a decrease over the previous quarter. A total of one building with 87,068 square feet of space delivered to the mar-ket, with 577,574 square feet still under construction at the end of the quarter.
Brownsville/HarlingenThe Brownsville/Harlingen office market reported no new
deliveries and no space under construction at the end of the fourth quarter 2017. With this limited construction activity, net absorption of positive 5,314 square feet caused the vacancy rate to down from 5.9%to 5.7% in the quarter. Rental rates stood at $15.15.
Buffalo/Niagara FallsThe Buffalo/Niagara Falls office market saw vacancies
fall and rental rates decrease from the third quarter 2017 to the fourth quarter 2017. The overall vacancy rate currently sits at 8.9%, from 9.1% in the previous quarter. Rental rates ended the quarter at $15.94 per square foot, from $16.09 in the previous quarter. There was a total of 22,306 square feet that delivered in the quarter, with 95,000 square feet still under construction at the end of the quarter.
4 CoStar Office Statistics ©2018 CoStar Group, Inc.
National � Year-End 2017
National Office MarketYear-End 2017 – National
National Office Market
©2018 CoStar Group, Inc. CoStar Office Statistics 5
Overview
Charleston WVWith no space currently under construction, Charleston
WV absorbed 59,882 square feet of space and delivered 8,000 square feet of space, resulting in a vacancy rate that went from 7.0% to 6.6% over the course of the quarter. Rental rates went from $15.28 to $16.44 per square foot.
Charleston/N CharlestonThe Charleston/N Charleston office market ended the
quarter with a vacancy rate of 6.0%. The vacancy rate was up over the previous quarter, with net absorption totaling nega-tive (30,269) square feet. Vacant sublease space increased to 37,741 square feet. Rental rates ended the fourth quarter at $21.41, a decrease over the previous quarter. A total of seven buildings with 77,200 square feet of space delivered to the market, with 744,981 square feet still under construction at the end of the quarter.
CharlotteThe Charlotte office market ended the quarter with a
vacancy rate of 8.7%. The vacancy rate was up over the previ-ous quarter, with net absorption totaling negative (242,668) square feet. Vacant sublease space increased to 406,941 square feet. Rental rates ended the fourth quarter at $24.48, an increase over the previous quarter. A total of one building with 10,000 square feet of space delivered to the market, with 2,307,289 square feet still under construction at the end of the quarter.
ChattanoogaWith no new office space being delivered to the mar-
ket, and positive 17,356 square feet of net absorption, Chattanooga’s vacancy rate went from 4.5% to 4.4% in the quarter. Rental rates went from $17.26 to $16.88 during that time. At the end of the quarter, there was 68,000 square feet underway for future delivery.
ChicagoThe Chicago office market ended the quarter with a
vacancy rate of 13.0%. The vacancy rate was down over the previous quarter, with net absorption totaling positive 1,901,781 square feet. Vacant sublease space decreased to 3,321,414 square feet. Rental rates ended the fourth quarter at $23.71, an increase over the previous quarter. A total of eight buildings with 617,636 square feet of space delivered to the market, with 4,202,264 square feet still under construction at the end of the quarter.
CincinnatiThe Cincinnati office market ended the quarter with
a vacancy rate of 9.1%. The vacancy rate was up over the previous quarter, with net absorption totaling positive 261,825 square feet. Vacant sublease space increased to 204,520 square feet. Rental rates ended the fourth quarter at $16.71,
an increase over the previous quarter. A total of five buildings with 372,500 square feet of space delivered to the market, with 231,464 square feet still under construction at the end of the quarter.
ClevelandThe Cleveland office market ended the quarter with a
vacancy rate of 9.5%. The vacancy rate was up over the pre-vious quarter, with net absorption totaling negative (112,987) square feet. Vacant sublease space increased to 219,349 square feet. Rental rates ended the fourth quarter at $17.36, an increase over the previous quarter. A total of eight buildings with 437,823 square feet of space delivered to the market, with 1,481,472 square feet still under construction at the end of the quarter.
Colorado SpringsWith no new office space being delivered to the market,
and positive 16,304 square feet of net absorption, Colorado Springs’s vacancy rate went from 11.1% to 11.0% in the quarter. Rental rates went from $15.61 to $15.33 during that time. At the end of the quarter, there was 109,800 square feet under-way for future delivery.
ColumbiaWith no new office space being delivered to the mar-
ket, and negative (45,892) square feet of net absorption, Columbia’s vacancy rate went from 6.7% to 6.8% in the quarter. Rental rates went from $15.14 to $14.85 during that time. At the end of the quarter, there was 81,773 square feet underway for future delivery.
ColumbusThe Columbus office market ended the quarter with a
vacancy rate of 6.4%. The vacancy rate was down over the previous quarter, with net absorption totaling positive 664,317 square feet. Vacant sublease space increased to 292,845 square feet. Rental rates ended the fourth quarter at $18.07, an increase over the previous quarter. A total of two buildings with 264,400 square feet of space delivered to the market, with 867,685 square feet still under construction at the end of the quarter.
Columbus GAThe Columbus GA office market reported no new deliver-
ies and no space under construction at the end of the fourth quarter 2017. With this limited construction activity, net absorption of positive 60,567 square feet caused the vacancy rate to down from 8.1%to 7.5% in the quarter. Rental rates stood at $12.63.
Corpus ChristiWith no new office space being delivered to the market,
and negative (129,416) square feet of net absorption, Corpus
6 CoStar Office Statistics ©2018 CoStar Group, Inc.
National � Year-End 2017
National Office MarketYear-End 2017 – National
National Office Market
©2018 CoStar Group, Inc. CoStar Office Statistics 7
Overview
Christi’s vacancy rate went from 7.1% to 8.3% in the quarter. Rental rates went from $15.20 to $14.34 during that time. At the end of the quarter, there was 40,000 square feet underway for future delivery.
Dallas/Ft WorthThe Dallas/Ft Worth office market ended the quarter with
a vacancy rate of 14.7%. The vacancy rate was up over the previous quarter, with net absorption totaling positive 1,567,153 square feet. Vacant sublease space increased to 3,490,106 square feet. Rental rates ended the fourth quarter at $25.01, a decrease over the previous quarter. A total of 57 buildings with 2,703,406 square feet of space delivered to the market, with 9,160,415 square feet still under construction at the end of the quarter.
Davenport/Moline/Rock IslandWith no new office space being delivered to the mar-
ket, and negative (23,626) square feet of net absorption, Davenport/Moline/Rock Island’s vacancy rate went from 5.9% to 6.2% in the quarter. Rental rates went from $10.03 to $10.16 during that time. At the end of the quarter, there was 136,726 square feet underway for future delivery.
DaytonThe Dayton office market ended the quarter with a
vacancy rate of 8.9%. The vacancy rate was down over the previous quarter, with net absorption totaling positive 207,198 square feet. Vacant sublease space increased to 59,461 square feet. Rental rates ended the fourth quarter at $14.86, a decrease over the previous quarter. A total of three buildings with 43,000 square feet of space delivered to the market, with 422,900 square feet still under construction at the end of the quarter.
Deltona/Daytona BeachWith no new office space being delivered to the market,
and positive 20,573 square feet of net absorption, Deltona/Daytona Beach’s vacancy rate went from 4.9% to 4.8% in the quarter. Rental rates went from $13.02 to $13.45 during that time. At the end of the quarter, there was 26,800 square feet underway for future delivery.
DenverThe Denver office market ended the quarter with a
vacancy rate of 10.5%. The vacancy rate was up over the previous quarter, with net absorption totaling positive 32,956 square feet. Vacant sublease space increased to 1,906,860 square feet. Rental rates ended the fourth quarter at $26.32, an increase over the previous quarter. A total of 11 buildings with 482,174 square feet of space delivered to the market, with 5,233,168 square feet still under construction at the end of the quarter.
Des MoinesWith no new office space being delivered to the market,
and positive 62,635 square feet of net absorption, Des Moines’s vacancy rate went from 3.9% to 3.8% in the quarter. Rental rates went from $13.08 to $13.05 during that time. At the end of the quarter, there was 408,503 square feet underway for future delivery.
DetroitThe Detroit office market ended the quarter with a
vacancy rate of 10.2%. The vacancy rate was down over the previous quarter, with net absorption totaling positive 310,402 square feet. Vacant sublease space increased to 330,491 square feet. Rental rates ended the fourth quarter at $19.20, an increase over the previous quarter. A total of four buildings with 111,285 square feet of space delivered to the market, with 1,788,874 square feet still under construction at the end of the quarter.
DuluthThe Duluth office market reported no new deliveries and
no space under construction at the end of the fourth quarter 2017. With this limited construction activity, net absorption of negative (39,695) square feet caused the vacancy rate to up from 3.2%to 3.8% in the quarter. Rental rates stood at $12.37.
East Bay/OaklandWith no new office space being delivered to the market,
and negative (338,291) square feet of net absorption, East Bay/Oakland’s vacancy rate went from 8.5% to 8.8% in the quarter. Rental rates went from $33.75 to $35.58 during that time. At the end of the quarter, there was 1,771,918 square feet underway for future delivery.
El PasoWith no new office space being delivered to the market,
and positive 14,060 square feet of net absorption, El Paso’s vacancy rate went from 5.4% to 5.2% in the quarter. Rental rates went from $15.12 to $15.08 during that time. At the end of the quarter, there was 2,191 square feet underway for future delivery.
ErieWith no new office space being delivered to the market,
and negative (81,711) square feet of net absorption, Erie’s vacancy rate went from 2.6% to 3.5% in the quarter. Rental rates went from $10.80 to $10.37 during that time. At the end of the quarter, there was 346,000 square feet underway for future delivery.
EvansvilleThe Evansville office market ended the quarter with a
vacancy rate of 5.6%. The vacancy rate was up over the pre-
6 CoStar Office Statistics ©2018 CoStar Group, Inc.
National � Year-End 2017
National Office MarketYear-End 2017 – National
National Office Market
©2018 CoStar Group, Inc. CoStar Office Statistics 7
Overview
vious quarter, with net absorption totaling negative (10,155) square feet. Vacant sublease space stayed the same at 4,726 square feet. Rental rates ended the fourth quarter at $11.44, an increase over the previous quarter. A total of one building with 4,200 square feet of space delivered to the market, with 14,000 square feet still under construction at the end of the quarter.
FayettevilleThe Fayetteville office market saw vacancies rise and
rental rates increase from the third quarter 2017 to the fourth quarter 2017. The overall vacancy rate currently sits at 6.8%, from 6.6% in the previous quarter. Rental rates ended the quarter at $15.45 per square foot, from $15.20 in the previous quarter. There was a total of 35,268 square feet that delivered in the quarter, with 34,410 square feet still under construction at the end of the quarter.
Fayetteville/Springdale/RogersThe Fayetteville/Springdale/Rogers office market ended
the quarter with a vacancy rate of 6.9%. The vacancy rate was down over the previous quarter, with net absorption totaling positive 104,551 square feet. Vacant sublease space increased to 19,152 square feet. Rental rates ended the fourth quarter at $17.51, an increase over the previous quarter. A total of four buildings with 94,576 square feet of space delivered to the market, with 132,983 square feet still under construction at the end of the quarter.
Fort SmithWith no space currently under construction, Fort Smith
absorbed (9,404) square feet of space and delivered 27,000 square feet of space, resulting in a vacancy rate that went from 3.9% to 4.7% over the course of the quarter. Rental rates went from $11.06 to $10.52 per square foot.
Fort WayneWith no new office space being delivered to the market,
and negative (29,008) square feet of net absorption, Fort Wayne’s vacancy rate went from 5.6% to 5.8% in the quarter. Rental rates went from $13.54 to $14.29 during that time. At the end of the quarter, there was 227,310 square feet underway for future delivery.
FresnoThe Fresno office market ended the quarter with a vacan-
cy rate of 8.3%. The vacancy rate was down over the previous quarter, with net absorption totaling positive 238,445 square feet. Vacant sublease space increased to 84,317 square feet. Rental rates ended the fourth quarter at $16.86, an increase over the previous quarter. A total of five buildings with 116,404 square feet of space delivered to the market, with 22,488 square feet still under construction at the end of the quarter.
Green BayThe Green Bay office market saw vacancies rise and rental
rates decrease from the third quarter 2017 to the fourth quar-ter 2017. The overall vacancy rate currently sits at 6.1%, from 5.9% in the previous quarter. Rental rates ended the quarter at $12.39 per square foot, from $12.56 in the previous quarter. There was a total of 5,000 square feet that delivered in the quarter, with 55,082 square feet still under construction at the end of the quarter.
Greensboro/Winston-SalemWith no new office space being delivered to the mar-
ket, and negative (40,389) square feet of net absorption, Greensboro/Winston-Salem’s vacancy rate went from 8.6% to 8.6% in the quarter. Rental rates went from $15.16 to $15.72 during that time. At the end of the quarter, there was 151,900 square feet underway for future delivery.
Greenville/SpartanburgThe Greenville/Spartanburg office market ended the
quarter with a vacancy rate of 6.9%. The vacancy rate was down over the previous quarter, with net absorption totaling positive 308,494 square feet. Vacant sublease space decreased to 182,528 square feet. Rental rates ended the fourth quarter at $17.30, an increase over the previous quarter. A total of five buildings with 177,733 square feet of space delivered to the market, with 116,273 square feet still under construction at the end of the quarter.
Hampton RoadsThe Hampton Roads office market ended the quarter
with a vacancy rate of 9.2%. The vacancy rate was up over the previous quarter, with net absorption totaling negative (98,773) square feet. Vacant sublease space decreased to 99,817 square feet. Rental rates ended the fourth quarter at $17.39, an increase over the previous quarter. A total of two buildings with 201,923 square feet of space delivered to the market, with 392,480 square feet still under construction at the end of the quarter.
HartfordThe Hartford office market saw vacancies fall and rental
rates increase from the third quarter 2017 to the fourth quar-ter 2017. The overall vacancy rate currently sits at 8.5%, from 8.6% in the previous quarter. Rental rates ended the quarter at $18.97 per square foot, from $18.95 in the previous quarter. There was a total of 579,800 square feet that delivered in the quarter, with 240,185 square feet still under construction at the end of the quarter.
HawaiiWith no new office space being delivered to the market,
and negative (177,935) square feet of net absorption, Hawaii’s vacancy rate went from 4.7% to 5.3% in the quarter. Rental
8 CoStar Office Statistics ©2018 CoStar Group, Inc.
National � Year-End 2017
National Office MarketYear-End 2017 – National
National Office Market
©2018 CoStar Group, Inc. CoStar Office Statistics 9
Overview
rates went from $27.97 to $26.35 during that time. At the end of the quarter, there was 48,132 square feet underway for future delivery.
HoustonThe Houston office market ended the quarter with a
vacancy rate of 16.3%. The vacancy rate was down over the previous quarter, with net absorption totaling positive 769,331 square feet. Vacant sublease space decreased to 5,165,446 square feet. Rental rates ended the fourth quarter at $27.76, an increase over the previous quarter. A total of 16 buildings with 636,600 square feet of space delivered to the market, with 2,479,402 square feet still under construction at the end of the quarter.
Huntington/AshlandThe Huntington/Ashland office market reported no new
deliveries and no space under construction at the end of the fourth quarter 2017. With this limited construction activity, net absorption of positive 11,700 square feet caused the vacancy rate to down from 3.3%to 3.2% in the quarter. Rental rates stood at $10.67.
HuntsvilleThe Huntsville office market ended the quarter with a
vacancy rate of 7.6%. The vacancy rate was down over the previous quarter, with net absorption totaling positive 112,561 square feet. Vacant sublease space increased to 26,109 square feet. Rental rates ended the fourth quarter at $14.33, an increase over the previous quarter. A total of one building with 11,000 square feet of space delivered to the market, with 447,000 square feet still under construction at the end of the quarter.
IndianapolisThe Indianapolis office market ended the quarter with a
vacancy rate of 7.0%. The vacancy rate was up over the previ-ous quarter, with net absorption totaling positive 61,503 square feet. Vacant sublease space increased to 102,110 square feet. Rental rates ended the fourth quarter at $18.35, an increase over the previous quarter. A total of five buildings with 129,000 square feet of space delivered to the market, with 369,400 square feet still under construction at the end of the quarter.
Inland Empire (California)The Inland Empire (California) office market saw vacan-
cies fall and rental rates increase from the third quarter 2017 to the fourth quarter 2017. The overall vacancy rate currently sits at 8.3%, from 8.5% in the previous quarter. Rental rates ended the quarter at $21.28 per square foot, from $20.56 in the previous quarter. There was a total of 94,080 square feet that delivered in the quarter, with 264,382 square feet still under construction at the end of the quarter.
JacksonThe vacancy rate remained unchanged in Jackson in
the fourth quarter. With 42,300 square feet in deliveries, and positive 50,164 square feet in net absorption, the vacancy rate held at 7.3%, the same rate reported in the previous quarter. The market had 34,133 square feet under construction at the end of the quarter, and rental rates stood at $16.15 per square foot.
Jacksonville (Florida)The Jacksonville (Florida) office market ended the quarter
with a vacancy rate of 7.5%. The vacancy rate was up over the previous quarter, with net absorption totaling negative (79,354) square feet. Vacant sublease space increased to 284,572 square feet. Rental rates ended the fourth quarter at $18.88, a decrease over the previous quarter. A total of five buildings with 40,283 square feet of space delivered to the market, with 288,637 square feet still under construction at the end of the quarter.
Kansas CityThe Kansas City office market ended the quarter with a
vacancy rate of 7.7%. The vacancy rate was down over the previous quarter, with net absorption totaling negative (70,167) square feet. Vacant sublease space increased to 487,896 square feet. Rental rates ended the fourth quarter at $19.17, an increase over the previous quarter. A total of one building with 7,880 square feet of space delivered to the market, with 516,968 square feet still under construction at the end of the quarter.
Killeen/Temple/Fort HoodThe Killeen/Temple/Fort Hood office market reported no
new deliveries and no space under construction at the end of the fourth quarter 2017. With this limited construction activ-ity, net absorption of positive 32,765 square feet caused the vacancy rate to down from 7.5%to 6.5% in the quarter. Rental rates stood at $12.74.
Kingsport/Bristol/BristolThe Kingsport/Bristol/Bristol office market reported no
new deliveries and no space under construction at the end of the fourth quarter 2017. With this limited construction activ-ity, net absorption of positive 95,913 square feet caused the vacancy rate to down from 8.5%to 7.2% in the quarter. Rental rates stood at $13.68.
KnoxvilleThe Knoxville office market ended the quarter with a
vacancy rate of 4.4%. The vacancy rate was down over the previous quarter, with net absorption totaling positive 52,684 square feet. Vacant sublease space increased to 37,144 square feet. Rental rates ended the fourth quarter at $15.45, an increase over the previous quarter. A total of two buildings
8 CoStar Office Statistics ©2018 CoStar Group, Inc.
National � Year-End 2017
National Office MarketYear-End 2017 – National
National Office Market
©2018 CoStar Group, Inc. CoStar Office Statistics 9
Overview
with 12,466 square feet of space delivered to the market, with 36,850 square feet still under construction at the end of the quarter.
LafayetteThe Lafayette office market reported no new deliveries
and no space under construction at the end of the fourth quarter 2017. With this limited construction activity, net absorption of positive 31,278 square feet caused the vacancy rate to down from 8.8%to 8.5% in the quarter. Rental rates stood at $15.28.
Las VegasThe Las Vegas office market ended the quarter with a
vacancy rate of 12.7%. The vacancy rate was down over the previous quarter, with net absorption totaling positive 767,271 square feet. Vacant sublease space decreased to 304,407 square feet. Rental rates ended the fourth quarter at $19.37, an increase over the previous quarter. A total of four buildings with 60,563 square feet of space delivered to the market, with 316,043 square feet still under construction at the end of the quarter.
Lexington/FayetteWith no new office space being delivered to the mar-
ket, and negative (51,963) square feet of net absorption, Lexington/Fayette’s vacancy rate went from 6.8% to 7.0% in the quarter. Rental rates went from $16.57 to $16.58 during that time. At the end of the quarter, there was 229,906 square feet underway for future delivery.
LincolnWith no space currently under construction, Lincoln
absorbed 128,403 square feet of space and delivered 82,705 square feet of space, resulting in a vacancy rate that went from 4.3% to 4.0% over the course of the quarter. Rental rates went from $13.24 to $13.91 per square foot.
Little Rock/N Little RockWith no new office space being delivered to the market,
and positive 73,285 square feet of net absorption, Little Rock/N Little Rock’s vacancy rate went from 5.3% to 5.0% in the quarter. Rental rates went from $15.78 to $16.02 during that time. At the end of the quarter, there was 75,000 square feet underway for future delivery.
Long Island (New York)The Long Island (New York) office market saw vacancies
rise and rental rates increase from the third quarter 2017 to the fourth quarter 2017. The overall vacancy rate currently sits at 7.2%, from 6.6% in the previous quarter. Rental rates ended the quarter at $28.53 per square foot, from $28.39 in the pre-vious quarter. There was a total of 132,941 square feet that delivered in the quarter, with 5,685,648 square feet still under
construction at the end of the quarter.
Los AngelesThe Los Angeles office market ended the quarter with a
vacancy rate of 10.5%. The vacancy rate was down over the previous quarter, with net absorption totaling positive 317,157 square feet. Vacant sublease space increased to 2,355,571 square feet. Rental rates ended the fourth quarter at $35.03, an increase over the previous quarter. A total of 10 buildings with 162,074 square feet of space delivered to the market, with 5,876,410 square feet still under construction at the end of the quarter.
LouisvilleThe Louisville office market saw vacancies rise and rental
rates change from the third quarter 2017 to the fourth quar-ter 2017. The overall vacancy rate currently sits at 6.1%, from 6.0% in the previous quarter. Rental rates ended the quarter at $16.99 per square foot, from $16.99 in the previous quarter. There was a total of 43,790 square feet that delivered in the quarter, with 362,950 square feet still under construction at the end of the quarter.
LubbockThe Lubbock office market ended the quarter with a
vacancy rate of 5.4%. The vacancy rate was up over the pre-vious quarter, with net absorption totaling negative (38,584) square feet. Vacant sublease space increased to 9,532 square feet. Rental rates ended the fourth quarter at $14.17, no change over the previous quarter. A total of three buildings with 33,881 square feet of space delivered to the market, with 27,948 square feet still under construction at the end of the quarter.
MadisonThe Madison office market saw vacancies rise and rental
rates decrease from the third quarter 2017 to the fourth quar-ter 2017. The overall vacancy rate currently sits at 4.9%, from 4.8% in the previous quarter. Rental rates ended the quarter at $15.14 per square foot, from $15.63 in the previous quarter. There was a total of 97,000 square feet that delivered in the quarter, with 1,181,000 square feet still under construction at the end of the quarter.
McAllen/Edinburg/PharrWith no new office space being delivered to the market,
and negative (5,923) square feet of net absorption, McAllen/Edinburg/Pharr’s vacancy rate went from 5.8% to 5.9% in the quarter. Rental rates went from $15.94 to $15.26 during that time. At the end of the quarter, there was 65,850 square feet underway for future delivery.
MemphisThe Memphis office market ended the quarter with a

10 CoStar Office Statistics ©2018 CoStar Group, Inc.
National � Year-End 2017
National Office MarketYear-End 2017 – National
National Office Market
©2018 CoStar Group, Inc. CoStar Office Statistics 11
Overview
vacancy rate of 12.2%. The vacancy rate was up over the pre-vious quarter, with net absorption totaling negative (148,851) square feet. Vacant sublease space increased to 71,637 square feet. Rental rates ended the fourth quarter at $17.45, an increase over the previous quarter. A total of six buildings with 334,005 square feet of space delivered to the market, with 531,559 square feet still under construction at the end of the quarter.
Miami-Dade CountyThe vacancy rate remained unchanged in Miami-Dade
County in the fourth quarter. With 89,821 square feet in deliveries, and positive 58,523 square feet in net absorption, the vacancy rate held at 8.5%, the same rate reported in the previous quarter. The market had 1,842,638 square feet under construction at the end of the quarter, and rental rates stood at $34.16 per square foot.
MilwaukeeThe Milwaukee office market ended the quarter with a
vacancy rate of 7.1%. The vacancy rate was up over the previ-ous quarter, with net absorption totaling negative (65,407) square feet. Vacant sublease space increased to 83,792 square feet. Rental rates ended the fourth quarter at $16.56, an increase over the previous quarter. A total of one building with 12,000 square feet of space delivered to the market, with 927,720 square feet still under construction at the end of the quarter.
MinneapolisThe Minneapolis office market ended the quarter with a
vacancy rate of 7.3%. The vacancy rate was down over the previous quarter, with net absorption totaling positive 937,148 square feet. Vacant sublease space increased to 377,331 square feet. Rental rates ended the fourth quarter at $19.47, an increase over the previous quarter. A total of 13 buildings with 481,301 square feet of space delivered to the market, with 1,572,696 square feet still under construction at the end of the quarter.
MobileWith no new office space being delivered to the market,
and negative (4,829) square feet of net absorption, Mobile’s vacancy rate went from 6.2% to 6.3% in the quarter. Rental rates went from $13.25 to $13.43 during that time. At the end of the quarter, there was 36,000 square feet underway for future delivery.
MontgomeryThe Montgomery office market reported no new deliver-
ies and no space under construction at the end of the fourth quarter 2017. With this limited construction activity, net absorption of positive 71,101 square feet caused the vacancy rate to down from 7.4%to 7.0% in the quarter. Rental rates stood at $14.31.
Myrtle Beach/ConwayWith no space currently under construction, Myrtle
Beach/Conway absorbed (32,681) square feet of space and delivered 1,200 square feet of space, resulting in a vacancy rate that went from 2.6% to 3.2% over the course of the quarter. Rental rates went from $14.56 to $14.21 per square foot.
NashvilleThe Nashville office market ended the quarter with a
vacancy rate of 6.9%. The vacancy rate was up over the previ-ous quarter, with net absorption totaling negative (243,681) square feet. Vacant sublease space increased to 673,491 square feet. Rental rates ended the fourth quarter at $25.97, an increase over the previous quarter. A total of eight buildings with 582,597 square feet of space delivered to the market, with 1,585,460 square feet still under construction at the end of the quarter.
New Orleans/Metairie/KennerWith no new office space being delivered to the market,
and negative (171,235) square feet of net absorption, New Orleans/Metairie/Kenner’s vacancy rate went from 6.6% to 7.0% in the quarter. Rental rates went from $17.96 to $17.92 during that time. At the end of the quarter, there was 29,200 square feet underway for future delivery.
New York CityThe vacancy rate remained unchanged in New York City in
the fourth quarter. With 177,950 square feet in deliveries, and positive 89,525 square feet in net absorption, the vacancy rate held at 8.1%, the same rate reported in the previous quarter. The market had 15,526,512 square feet under construction at the end of the quarter, and rental rates stood at $65.96 per square foot.
North Bay/Santa RosaWith no new office space being delivered to the market,
and positive 248,483 square feet of net absorption, North Bay/Santa Rosa’s vacancy rate went from 10.2% to 9.5% in the quarter. Rental rates went from $25.02 to $25.47 during that time. At the end of the quarter, there was 19,000 square feet underway for future delivery.
Northern New JerseyThe vacancy rate remained unchanged in Northern New
Jersey in the fourth quarter. With 123,800 square feet in deliv-eries, and positive 286,101 square feet in net absorption, the vacancy rate held at 12.4%, the same rate reported in the previous quarter. The market had 1,906,627 square feet under construction at the end of the quarter, and rental rates stood at $25.12 per square foot.
OcalaThe Ocala office market reported no new deliveries and no
space under construction at the end of the fourth quarter 2017.
10 CoStar Office Statistics ©2018 CoStar Group, Inc.
National � Year-End 2017
National Office MarketYear-End 2017 – National
National Office Market
©2018 CoStar Group, Inc. CoStar Office Statistics 11
Overview
With this limited construction activity, net absorption of nega-tive (39,085) square feet caused the vacancy rate to up from 6.5%to 7.4% in the quarter. Rental rates stood at $13.00.
Oklahoma CityThe Oklahoma City office market ended the quarter with
a vacancy rate of 6.9%. The vacancy rate was up over the pre-vious quarter, with net absorption totaling negative (347,072) square feet. Vacant sublease space increased to 84,107 square feet. Rental rates ended the fourth quarter at $17.31, an increase over the previous quarter. A total of two buildings with 5,565 square feet of space delivered to the market, with 992,552 square feet still under construction at the end of the quarter.
OlympiaWith no new office space being delivered to the market,
and positive 10,070 square feet of net absorption, Olympia’s vacancy rate went from 7.8% to 7.7% in the quarter. Rental rates went from $16.25 to $16.50 during that time. At the end of the quarter, there was 6,400 square feet underway for future delivery.
Omaha/Council BluffsWith no new office space being delivered to the market,
and negative (181,866) square feet of net absorption, Omaha/Council Bluffs’ vacancy rate went from 7.1% to 7.5% in the quarter. Rental rates went from $16.16 to $17.02 during that time. At the end of the quarter, there was 1,088,304 square feet underway for future delivery.
Orange County (California)The Orange County (California) office market ended the
quarter with a vacancy rate of 9.7%. The vacancy rate was up over the previous quarter, with net absorption totaling posi-tive 306,710 square feet. Vacant sublease space increased to 900,805 square feet. Rental rates ended the fourth quarter at $29.99, an increase over the previous quarter. A total of three buildings with 1,091,557 square feet of space delivered to the market, with 1,547,302 square feet still under construction at the end of the quarter.
OrlandoThe Orlando office market ended the quarter with a
vacancy rate of 6.9%. The vacancy rate was down over the previous quarter, with net absorption totaling positive 387,835 square feet. Vacant sublease space increased to 214,582 square feet. Rental rates ended the fourth quarter at $20.74, an increase over the previous quarter. A total of seven build-ings with 187,819 square feet of space delivered to the market, with 1,813,994 square feet still under construction at the end of the quarter.
Palm Beach CountyThe Palm Beach County office market ended the quarter
with a vacancy rate of 10.8%. The vacancy rate was up over the previous quarter, with net absorption totaling negative (118,809) square feet. Vacant sublease space increased to 155,670 square feet. Rental rates ended the fourth quarter at $29.28, an increase over the previous quarter. A total of two buildings with 10,849 square feet of space delivered to the market, with 281,433 square feet still under construction at the end of the quarter.
PensacolaThe Pensacola office market ended the quarter with a
vacancy rate of 4.7%. The vacancy rate was up over the pre-vious quarter, with net absorption totaling negative (59,913) square feet. Vacant sublease space stayed the same at 0 square feet. Rental rates ended the fourth quarter at $15.08, an increase over the previous quarter. A total of one building with 6,000 square feet of space delivered to the market, with 302,115 square feet still under construction at the end of the quarter.
PeoriaThe Peoria office market reported no new deliveries and
no space under construction at the end of the fourth quarter 2017. With this limited construction activity, net absorption of positive 27,302 square feet caused the vacancy rate to down from 6.1%to 5.7% in the quarter. Rental rates stood at $12.07.
PhiladelphiaThe Philadelphia office market ended the quarter with a
vacancy rate of 8.3%. The vacancy rate was up over the previ-ous quarter, with net absorption totaling negative (255,201) square feet. Vacant sublease space increased to 1,365,518 square feet. Rental rates ended the fourth quarter at $22.94, an increase over the previous quarter. A total of two buildings with 157,200 square feet of space delivered to the market, with 3,943,608 square feet still under construction at the end of the quarter.
PhoenixThe Phoenix office market ended the quarter with a
vacancy rate of 14.7%. The vacancy rate was down over the previous quarter, with net absorption totaling positive 898,494 square feet. Vacant sublease space decreased to 1,321,543 square feet. Rental rates ended the fourth quarter at $24.57, an increase over the previous quarter. A total of six buildings with 338,421 square feet of space delivered to the market, with 1,740,329 square feet still under construction at the end of the quarter.
PittsburghThe Pittsburgh office market ended the quarter with a
vacancy rate of 8.6%. The vacancy rate was up over the previ-ous quarter, with net absorption totaling negative (280,647) square feet. Vacant sublease space decreased to 399,602
12 CoStar Office Statistics ©2018 CoStar Group, Inc.
National � Year-End 2017
National Office MarketYear-End 2017 – National
National Office Market
©2018 CoStar Group, Inc. CoStar Office Statistics 13
Overview
square feet. Rental rates ended the fourth quarter at $21.30, a decrease over the previous quarter. A total of three buildings with 174,611 square feet of space delivered to the market, with 590,293 square feet still under construction at the end of the quarter.
Port St Lucie/Fort PierceThe Port St Lucie/Fort Pierce office market saw vacan-
cies rise and rental rates decrease from the third quarter 2017 to the fourth quarter 2017. The overall vacancy rate currently sits at 8.4%, from 7.2% in the previous quarter. Rental rates ended the quarter at $14.33 per square foot, from $14.49 in the previous quarter. There was a total of 121,771 square feet that delivered in the quarter, with 37,806 square feet still under construction at the end of the quarter.
PortlandThe Portland office market ended the quarter with a
vacancy rate of 6.8%. The vacancy rate was down over the previous quarter, with net absorption totaling positive 283,479 square feet. Vacant sublease space decreased to 185,644 square feet. Rental rates ended the fourth quarter at $25.31, an increase over the previous quarter. A total of five buildings with 241,619 square feet of space delivered to the market, with 3,192,252 square feet still under construction at the end of the quarter.
Portland/South PortlandThe Portland/South Portland office market ended the
quarter with a vacancy rate of 4.6%. The vacancy rate was down over the previous quarter, with net absorption totaling positive 223,007 square feet. Vacant sublease space increased to 43,352 square feet. Rental rates ended the fourth quarter at $13.78, a decrease over the previous quarter. A total of one building with 35,000 square feet of space delivered to the mar-ket, with 98,449 square feet still under construction at the end of the quarter.
ProvidenceThe Providence office market saw vacancies fall and
rental rates increase from the third quarter 2017 to the fourth quarter 2017. The overall vacancy rate currently sits at 5.4%, from 5.6% in the previous quarter. Rental rates ended the quarter at $17.06 per square foot, from $16.87 in the previous quarter. There was a total of 19,648 square feet that delivered in the quarter, with 693,000 square feet still under construction at the end of the quarter.
Raleigh/DurhamThe Raleigh/Durham office market ended the quarter
with a vacancy rate of 7.0%. The vacancy rate was down over the previous quarter, with net absorption totaling posi-tive 562,121 square feet. Vacant sublease space increased to 290,649 square feet. Rental rates ended the fourth quarter at
$22.48, an increase over the previous quarter. A total of three buildings with 269,699 square feet of space delivered to the market, with 2,690,837 square feet still under construction at the end of the quarter.
Reno/SparksThe Reno/Sparks office market ended the quarter with
a vacancy rate of 8.9%. The vacancy rate was down over the previous quarter, with net absorption totaling positive 82,188 square feet. Vacant sublease space decreased to 55,635 square feet. Rental rates ended the fourth quarter at $17.84, an increase over the previous quarter. A total of one building with 4,168 square feet of space delivered to the market, with 65,919 square feet still under construction at the end of the quarter.
Richmond VAThe Richmond VA office market ended the quarter with
a vacancy rate of 6.9%. The vacancy rate was down over the previous quarter, with net absorption totaling positive 235,200 square feet. Vacant sublease space decreased to 94,448 square feet. Rental rates ended the fourth quarter at $18.16, a decrease over the previous quarter. A total of one building with 7,500 square feet of space delivered to the market, with 922,225 square feet still under construction at the end of the quarter.
RoanokeWith no space currently under construction, Roanoke
absorbed 40,916 square feet of space and delivered 6,400 square feet of space, resulting in a vacancy rate that went from 7.3% to 7.1% over the course of the quarter. Rental rates went from $15.15 to $16.28 per square foot.
RochesterThe vacancy rate remained unchanged in Rochester in
the fourth quarter. With 32,000 square feet in deliveries, and positive 67,146 square feet in net absorption, the vacancy rate held at 8.5%, the same rate reported in the previous quarter. The market had 214,034 square feet under construction at the end of the quarter, and rental rates stood at $13.55 per square foot.
SacramentoWith no new office space being delivered to the mar-
ket, and positive 106,047 square feet of net absorption, Sacramento’s vacancy rate went from 10.4% to 10.3% in the quarter. Rental rates went from $21.54 to $21.61 during that time. At the end of the quarter, there was 663,890 square feet underway for future delivery.
SalinasThe Salinas office market reported no new deliveries and
no space under construction at the end of the fourth quarter
12 CoStar Office Statistics ©2018 CoStar Group, Inc.
National � Year-End 2017
National Office MarketYear-End 2017 – National
National Office Market
©2018 CoStar Group, Inc. CoStar Office Statistics 13
2017. With this limited construction activity, net absorption of positive 209 square feet caused the vacancy rate to remain unchanged from 6.6%to 6.6% in the quarter. Rental rates stood at $21.24.
Salt Lake CityThe Salt Lake City office market ended the quarter with a
vacancy rate of 7.3%. The vacancy rate was up over the previ-ous quarter, with net absorption totaling positive 27,412 square feet. Vacant sublease space increased to 677,756 square feet. Rental rates ended the fourth quarter at $20.62, an increase over the previous quarter. A total of six buildings with 368,804 square feet of space delivered to the market, with 1,652,990 square feet still under construction at the end of the quarter.
San AntonioThe San Antonio office market ended the quarter with a
vacancy rate of 9.0%. The vacancy rate was down over the previous quarter, with net absorption totaling positive 690,455 square feet. Vacant sublease space decreased to 176,496 square feet. Rental rates ended the fourth quarter at $21.08, a decrease over the previous quarter. A total of nine buildings with 469,770 square feet of space delivered to the market, with 1,241,894 square feet still under construction at the end of the quarter.
San DiegoThe San Diego office market ended the quarter with a
vacancy rate of 9.6%. The vacancy rate was down over the previous quarter, with net absorption totaling positive 324,986 square feet. Vacant sublease space decreased to 647,501 square feet. Rental rates ended the fourth quarter at $31.98, an increase over the previous quarter. A total of one building with 11,800 square feet of space delivered to the market, with 699,858 square feet still under construction at the end of the quarter.
San FranciscoThe vacancy rate remained unchanged in San Francisco
in the fourth quarter. With 449,000 square feet in deliveries, and positive 392,756 square feet in net absorption, the vacancy rate held at 7.0%, the same rate reported in the previous quar-ter. The market had 10,505,093 square feet under construction at the end of the quarter, and rental rates stood at $59.83 per square foot.
San Luis Obispo/Paso RoblesThe San Luis Obispo/Paso Robles office market ended the
quarter with a vacancy rate of 2.1%. The vacancy rate was up over the previous quarter, with net absorption totaling posi-tive 19,829 square feet. Vacant sublease space decreased to 0 square feet. Rental rates ended the fourth quarter at $20.89, an increase over the previous quarter. A total of one building with 36,200 square feet of space delivered to the market, with
45,213 square feet still under construction at the end of the quarter.
Santa Barbara/Sta Maria/GoletaThe Santa Barbara/Sta Maria/Goleta office market
reported no new deliveries and no space under construction at the end of the fourth quarter 2017. With this limited con-struction activity, net absorption of negative (9,503) square feet caused the vacancy rate to up from 3.7%to 3.8% in the quarter. Rental rates stood at $23.01.
Santa Cruz/WatsonvilleThe Santa Cruz/Watsonville office market reported no
new deliveries and no space under construction at the end of the fourth quarter 2017. With this limited construction activity, net absorption of positive 9,932 square feet caused the vacan-cy rate to down from 5.4%to 5.3% in the quarter. Rental rates stood at $22.31.
SavannahThe Savannah office market ended the quarter with a
vacancy rate of 4.9%. The vacancy rate was down over the previous quarter, with net absorption totaling positive 44,961 square feet. Vacant sublease space stayed the same at 0 square feet. Rental rates ended the fourth quarter at $17.31, an increase over the previous quarter. A total of one building with 11,484 square feet of space delivered to the market, with 32,964 square feet still under construction at the end of the quarter.
Seattle/Puget SoundThe Seattle/Puget Sound office market ended the quarter
with a vacancy rate of 7.6%. The vacancy rate was up over the previous quarter, with net absorption totaling positive 670,508 square feet. Vacant sublease space increased to 1,098,765 square feet. Rental rates ended the fourth quarter at $32.39, an increase over the previous quarter. A total of four buildings with 1,468,787 square feet of space delivered to the market, with 5,821,470 square feet still under construction at the end of the quarter.
Shreveport/Bossier CityThe Shreveport/Bossier City office market saw vacan-
cies rise and rental rates increase from the third quarter 2017 to the fourth quarter 2017. The overall vacancy rate currently sits at 8.4%, from 8.2% in the previous quarter. Rental rates ended the quarter at $14.30 per square foot, from $13.81 in the previous quarter. There was a total of 20,000 square feet that delivered in the quarter, with 7,500 square feet still under construction at the end of the quarter.
South Bay/San JoseThe South Bay/San Jose office market ended the quarter
with a vacancy rate of 9.6%. The vacancy rate was up over
14 CoStar Office Statistics ©2018 CoStar Group, Inc.
National � Year-End 2017
National Office MarketYear-End 2017 – National
National Office Market
©2018 CoStar Group, Inc. CoStar Office Statistics 15
the previous quarter, with net absorption totaling positive 1,385,696 square feet. Vacant sublease space decreased to 2,207,934 square feet. Rental rates ended the fourth quarter at $42.88, a decrease over the previous quarter. A total of 14 buildings with 1,844,105 square feet of space delivered to the market, with 5,422,273 square feet still under construction at the end of the quarter.
South Bend/MishawakaThe South Bend/Mishawaka office market reported no
new deliveries and no space under construction at the end of the fourth quarter 2017. With this limited construction activ-ity, net absorption of negative (121,916) square feet caused the vacancy rate to up from 7.4%to 8.7% in the quarter. Rental rates stood at $15.11.
Southwest FloridaThe Southwest Florida office market saw vacancies rise
and rental rates increase from the third quarter 2017 to the fourth quarter 2017. The overall vacancy rate currently sits at 6.3%, from 6.1% in the previous quarter. Rental rates ended the quarter at $15.40 per square foot, from $15.11 in the pre-vious quarter. There was a total of 111,382 square feet that delivered in the quarter, with 44,504 square feet still under construction at the end of the quarter.
SpokaneWith no new office space being delivered to the mar-
ket, and negative (122,062) square feet of net absorption, Spokane’s vacancy rate went from 8.2% to 8.7% in the quarter. Rental rates went from $15.63 to $15.64 during that time. At the end of the quarter, there was 11,710 square feet underway for future delivery.
SpringfieldWith no new office space being delivered to the market,
and positive 45,759 square feet of net absorption, Springfield’s vacancy rate went from 6.2% to 5.7% in the quarter. Rental rates went from $13.38 to $13.06 during that time. At the end of the quarter, there was 84,000 square feet underway for future delivery.
St. LouisThe St. Louis office market ended the quarter with a
vacancy rate of 7.1%. The vacancy rate was down over the previous quarter, with net absorption totaling positive 803,028 square feet. Vacant sublease space increased to 291,647 square feet. Rental rates ended the fourth quarter at $18.60, an increase over the previous quarter. A total of four buildings with 342,324 square feet of space delivered to the market, with 933,348 square feet still under construction at the end of the quarter.
Stockton/ModestoThe Stockton/Modesto office market reported no new
deliveries and no space under construction at the end of the fourth quarter 2017. With this limited construction activity, net absorption of positive 43,838 square feet caused the vacancy rate to down from 5.8%to 5.6% in the quarter. Rental rates stood at $16.12.
SyracuseThe Syracuse office market saw vacancies fall and rental
rates decrease from the third quarter 2017 to the fourth quar-ter 2017. The overall vacancy rate currently sits at 7.8%, from 7.9% in the previous quarter. Rental rates ended the quarter at $13.92 per square foot, from $14.40 in the previous quarter. There was a total of 45,236 square feet that delivered in the quarter, with 158,945 square feet still under construction at the end of the quarter.
TallahasseeThe Tallahassee office market ended the quarter with a
vacancy rate of 4.0%. The vacancy rate was down over the previous quarter, with net absorption totaling positive 137,799 square feet. Vacant sublease space decreased to 13,706 square feet. Rental rates ended the fourth quarter at $16.88, a decrease over the previous quarter. A total of two buildings with 65,280 square feet of space delivered to the market, with 66,200 square feet still under construction at the end of the quarter.
Tampa/St PetersburgThe Tampa/St Petersburg office market ended the quar-
ter with a vacancy rate of 7.0%. The vacancy rate was down over the previous quarter, with net absorption totaling posi-tive 731,930 square feet. Vacant sublease space decreased to 426,073 square feet. Rental rates ended the fourth quarter at $20.80, an increase over the previous quarter. A total of four buildings with 29,800 square feet of space delivered to the market, with 654,746 square feet still under construction at the end of the quarter.
ToledoWith no new office space being delivered to the market,
and positive 75,981 square feet of net absorption, Toledo’s vacancy rate went from 7.6% to 7.4% in the quarter. Rental rates went from $13.17 to $13.48 during that time. At the end of the quarter, there was 97,247 square feet underway for future delivery.
TucsonThe Tucson office market ended the quarter with a vacan-
cy rate of 9.4%. The vacancy rate was down over the previous quarter, with net absorption totaling positive 118,374 square feet. Vacant sublease space increased to 39,362 square feet.
14 CoStar Office Statistics ©2018 CoStar Group, Inc.
National � Year-End 2017
National Office MarketYear-End 2017 – National
National Office Market
©2018 CoStar Group, Inc. CoStar Office Statistics 15
Rental rates ended the fourth quarter at $18.93, an increase over the previous quarter. A total of one building with 6,000 square feet of space delivered to the market, with 249,000 square feet still under construction at the end of the quarter.
TulsaThe Tulsa office market ended the quarter with a vacancy
rate of 10.6%. The vacancy rate was up over the previous quar-ter, with net absorption totaling negative (37,173) square feet. Vacant sublease space increased to 449,573 square feet. Rental rates ended the fourth quarter at $15.08, an increase over the previous quarter. A total of seven buildings with 56,477 square feet of space delivered to the market, with 112,628 square feet still under construction at the end of the quarter.
Utica/RomeThe Utica/Rome office market reported no new deliver-
ies and no space under construction at the end of the fourth quarter 2017. With this limited construction activity, net absorption of positive 63,900 square feet caused the vacancy rate to down from 2.6%to 1.9% in the quarter. Rental rates stood at $9.76.
Visalia/PortervilleWith no new office space being delivered to the market,
and positive 41,734 square feet of net absorption, Visalia/Porterville’s vacancy rate went from 3.6% to 2.9% in the quar-ter. Rental rates went from $14.89 to $15.66 during that time. At the end of the quarter, there was 15,734 square feet under-way for future delivery.
WashingtonThe Washington office market ended the quarter with
a vacancy rate of 14.0%. The vacancy rate was down over the previous quarter, with net absorption totaling positive 1,900,493 square feet. Vacant sublease space increased to 3,458,682 square feet. Rental rates ended the fourth quarter at $35.88, a decrease over the previous quarter. A total of seven buildings with 1,429,375 square feet of space delivered to the market, with 11,047,016 square feet still under construction at the end of the quarter.
West MichiganThe West Michigan office market saw vacancies rise and
rental rates increase from the third quarter 2017 to the fourth quarter 2017. The overall vacancy rate currently sits at 5.4%, from 5.3% in the previous quarter. Rental rates ended the quarter at $13.76 per square foot, from $13.70 in the previous quarter. There was a total of 237,309 square feet that delivered in the quarter, with 498,068 square feet still under construction at the end of the quarter.
Westchester/So ConnecticutThe vacancy rate remained unchanged in Westchester/So
Connecticut in the fourth quarter. With 128,200 square feet in deliveries, and positive 129,885 square feet in net absorption, the vacancy rate held at 12.2%, the same rate reported in the previous quarter. The market had 220,000 square feet under construction at the end of the quarter, and rental rates stood at $28.16 per square foot.
WichitaThe Wichita office market ended the quarter with a
vacancy rate of 7.4%. The vacancy rate was up over the pre-vious quarter, with net absorption totaling negative (88,854) square feet. Vacant sublease space increased to 32,205 square feet. Rental rates ended the fourth quarter at $13.43, a decrease over the previous quarter. A total of two buildings with 20,400 square feet of space delivered to the market, with 67,981 square feet still under construction at the end of the quarter.
WilmingtonThe Wilmington office market ended the quarter with a
vacancy rate of 4.5%. The vacancy rate was up over the pre-vious quarter, with net absorption totaling negative (18,409) square feet. Vacant sublease space decreased to 0 square feet. Rental rates ended the fourth quarter at $17.67, an increase over the previous quarter. A total of one building with 6,400 square feet of space delivered to the market, with 113,550 square feet still under construction at the end of the quarter.
YakimaThe Yakima office market reported no new deliveries and
no space under construction at the end of the fourth quarter 2017. With this limited construction activity, net absorption of positive 54,242 square feet caused the vacancy rate to down from 8.3%to 7.1% in the quarter. Rental rates stood at $11.59.
Youngstown/Warren/BoardmanWith no space currently under construction, Youngstown/
Warren/Boardman absorbed 54,932 square feet of space and delivered 22,716 square feet of space, resulting in a vacancy rate that went from 5.4% to 5.2% over the course of the quar-ter. Rental rates went from $10.27 to $10.35 per square foot.
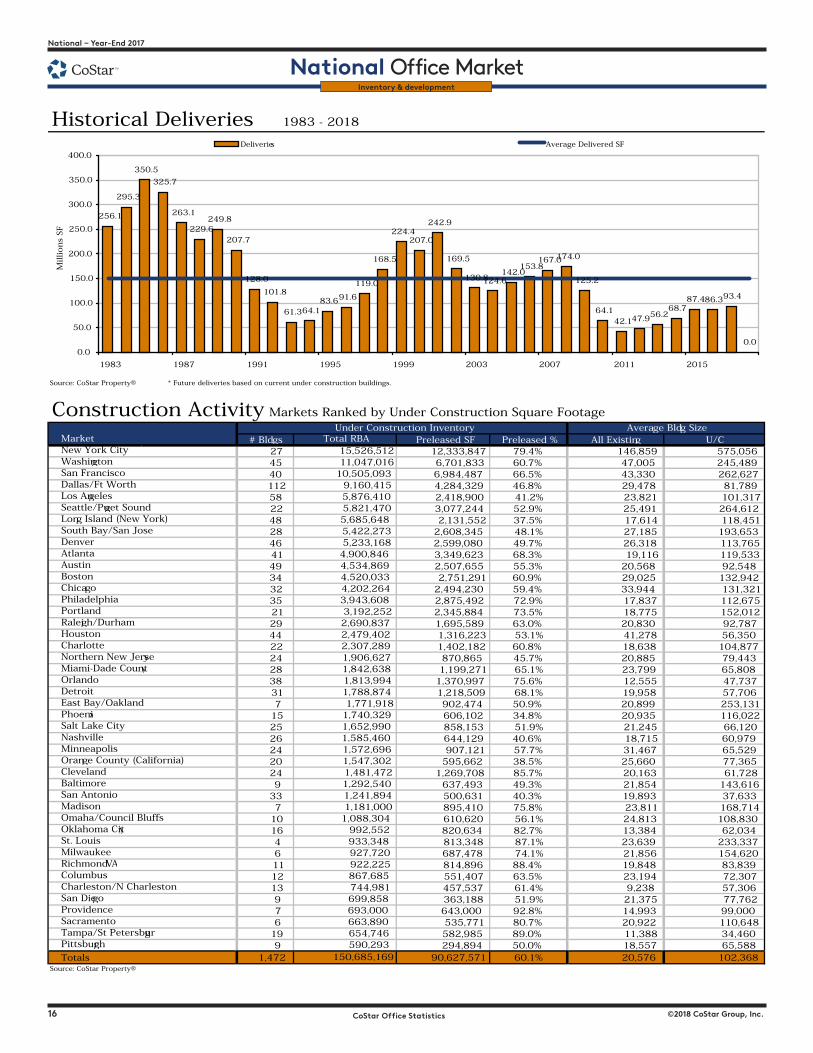
16 CoStar Office Statistics ©2018 CoStar Group, Inc.
National � Year-End 2017
National Office MarketYear-End 2017 – National
National Office Market
©2018 CoStar Group, Inc. CoStar Office Statistics 17
Historical Deliveries 1983 - 2018
Source: CoStar Property® * Future deliveries based on current under construction buildings.
Construction Activity Markets Ranked by Under Construction Square Footage
# Bldgs Preleased SF Preleased % All Existing U/CNew York City 27 12,333,847 79.4% 146,859 575,056 Washington 45 6,701,833 60.7% 47,005 245,489 San Francisco 40 6,984,487 66.5% 43,330 262,627 Dallas/Ft Worth 112 4,284,329 46.8% 29,478 81,789 Los Angeles 58 2,418,900 41.2% 23,821 101,317 Seattle/Puget Sound 22 3,077,244 52.9% 25,491 264,612 Long Island (New York) 48 2,131,552 37.5% 17,614 118,451 South Bay/San Jose 28 2,608,345 48.1% 27,185 193,653 Denver 46 2,599,080 49.7% 26,318 113,765 Atlanta 41 3,349,623 68.3% 19,116 119,533 Austin 49 2,507,655 55.3% 20,568 92,548 Boston 34 2,751,291 60.9% 29,025 132,942 Chicago 32 2,494,230 59.4% 33,944 131,321 Philadelphia 35 2,875,492 72.9% 17,837 112,675 Portland 21 2,345,884 73.5% 18,775 152,012 Raleigh/Durham 29 1,695,589 63.0% 20,830 92,787 Houston 44 1,316,223 53.1% 41,278 56,350 Charlotte 22 1,402,182 60.8% 18,638 104,877 Northern New Jersey 24 870,865 45.7% 20,885 79,443 Miami-Dade County 28 1,199,271 65.1% 23,799 65,808 Orlando 38 1,370,997 75.6% 12,555 47,737 Detroit 31 1,218,509 68.1% 19,958 57,706 East Bay/Oakland 7 902,474 50.9% 20,899 253,131 Phoenix 15 606,102 34.8% 20,935 116,022 Salt Lake City 25 858,153 51.9% 21,245 66,120 Nashville 26 644,129 40.6% 18,715 60,979 Minneapolis 24 907,121 57.7% 31,467 65,529 Orange County (California) 20 595,662 38.5% 25,660 77,365 Cleveland 24 1,269,708 85.7% 20,163 61,728 Baltimore 9 637,493 49.3% 21,854 143,616 San Antonio 33 500,631 40.3% 19,893 37,633 Madison 7 895,410 75.8% 23,811 168,714 Omaha/Council Bluffs 10 610,620 56.1% 24,813 108,830 Oklahoma City 16 820,634 82.7% 13,384 62,034 St. Louis 4 813,348 87.1% 23,639 233,337 Milwaukee 6 687,478 74.1% 21,856 154,620 Richmond VA 11 814,896 88.4% 19,848 83,839 Columbus 12 551,407 63.5% 23,194 72,307 Charleston/N Charleston 13 457,537 61.4% 9,238 57,306 San Diego 9 363,188 51.9% 21,375 77,762 Providence 7 643,000 92.8% 14,993 99,000 Sacramento 6 535,771 80.7% 20,922 110,648 Tampa/St Petersburg 19 582,985 89.0% 11,388 34,460 Pittsburgh 9 294,894 50.0% 18,557 65,588 Totals 1,472 90,627,571 60.1% 20,576 102,368
Source: CoStar Property®
150,685,169
MarketUnder Construction Inventory Average Bldg Size
Total RBA
1,181,000
699,858
15,526,512
5,821,470 5,685,648 5,422,273
11,047,016 10,505,093
9,160,415 5,876,410
693,000 663,890
590,293 654,746
4,202,264
5,233,168 4,900,846 4,534,869 4,520,033
1,906,627 2,307,289
3,943,608 3,192,252
2,479,402 2,690,837
1,842,638
1,740,329
1,813,994 1,788,874 1,771,918
1,292,540 1,241,894
1,652,990
1,572,696 1,547,302 1,481,472
1,585,460
867,685 744,981
1,088,304 992,552 933,348
922,225 927,720
350.5
325.7
263.1
229.6249.8
207.7
128.0
101.8
61.364.183.691.6
119.0
168.5
224.4207.0
242.9
169.5
130.8124.6142.0
153.8167.0174.0
125.2
64.142.147.956.2
68.787.486.393.4
0.0
256.1
295.3
0.0
50.0
100.0
150.0
200.0
250.0
300.0
350.0
400.0
1983 1987 1991 1995 1999 2003 2007 2011 2015
Millions
SF
Deliveries Average Delivered SF
Inventory & development
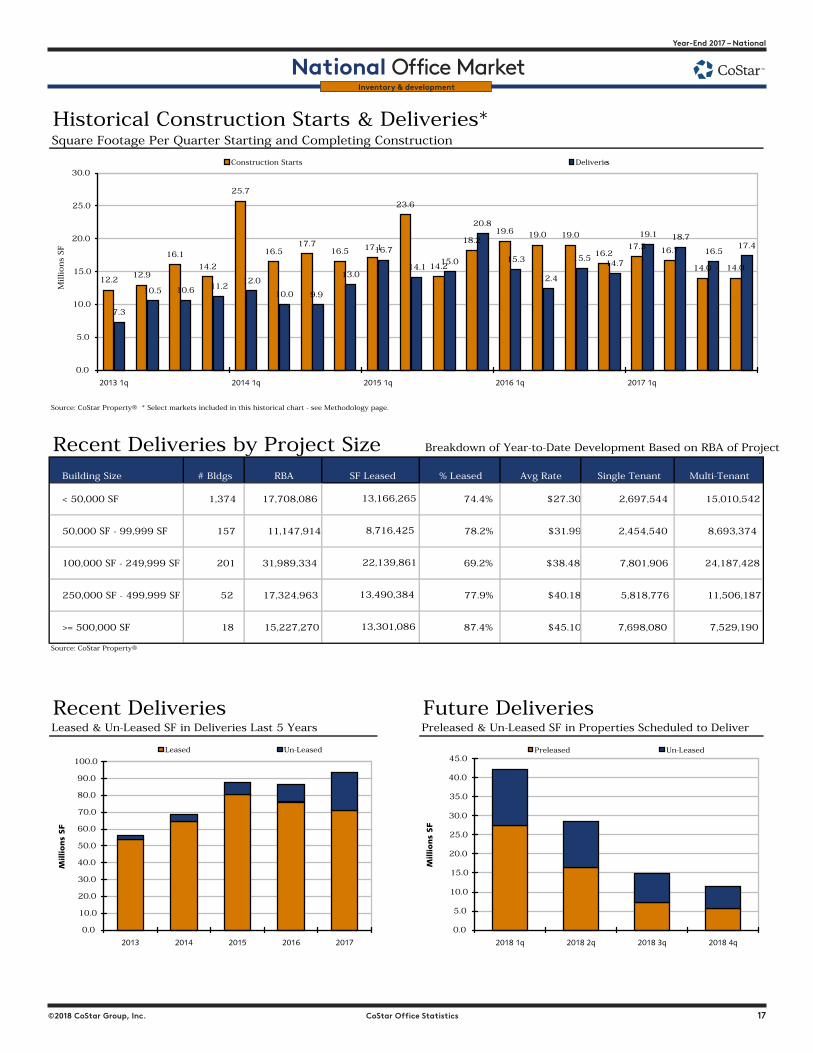
16 CoStar Office Statistics ©2018 CoStar Group, Inc.
National � Year-End 2017
National Office MarketYear-End 2017 – National
National Office Market
©2018 CoStar Group, Inc. CoStar Office Statistics 17
Historical Construction Starts & Deliveries*Square Footage Per Quarter Starting and Completing Construction
Source: CoStar Property® * Select markets included in this historical chart - see Methodology page.
Recent Deliveries by Project Size Breakdown of Year-to-Date Development Based on RBA of Project
Building Size # Bldgs RBA % Leased Avg Rate Single Tenant Multi-Tenant
< 50,000 SF 1,374 17,708,086 74.4% $27.30 2,697,544 15,010,542
50,000 SF - 99,999 SF 157 11,147,914 78.2% $31.99 2,454,540 8,693,374
100,000 SF - 249,999 SF 201 31,989,334 69.2% $38.48 7,801,906 24,187,428
250,000 SF - 499,999 SF 52 17,324,963 77.9% $40.18 5,818,776 11,506,187
>= 500,000 SF 18 15,227,270 87.4% $45.10 7,698,080 7,529,190
Source: CoStar Property®
Recent Deliveries Future Deliveries Leased & Un-Leased SF in Deliveries Last 5 Years Preleased & Un-Leased SF in Properties Scheduled to Deliver
13,490,384
13,301,086
SF Leased
13,166,265
8,716,425
22,139,861
12.212.9
16.1
14.2
25.7
16.517.7
16.5 17.1
23.6
14.2
18.219.6 19.0 19.0
16.217.3 16.7
14.0 14.0
7.3
10.5 10.6 11.212.0
10.0 9.9
13.0
16.7
14.115.0
20.8
15.3
12.4
15.514.7
19.1 18.7
16.517.4
0.0
5.0
10.0
15.0
20.0
25.0
30.0
2013 1q 2014 1q 2015 1q 2016 1q 2017 1q
Millions
SF
Construction Starts Deliveries
0.0
10.0
20.0
30.0
40.0
50.0
60.0
70.0
80.0
90.0
100.0
2013 2014 2015 2016 2017
Millio
ns
SF
Leased Un-Leased
0.0
5.0
10.0
15.0
20.0
25.0
30.0
35.0
40.0
45.0
2018 1q 2018 2q 2018 3q 2018 4q
Millio
ns
SF
Preleased Un-Leased
Inventory & development

18 CoStar Office Statistics ©2018 CoStar Group, Inc.
National � Year-End 2017
National Office MarketYear-End 2017 – National
National Office Market
©2018 CoStar Group, Inc. CoStar Office Statistics 19
������������������������������ �������������������������������
������������������������
���� ������������������ ����������������������� ������������������� �������� ����������� ����������������� ������������������ ������������������������������ ������������������������������� ��������������������� �������������� ������������������
���� �������������������������� ������������ ������������������� ��������� ����������� ���������������� ��������������������� ������������������������������ ������������������������������ ��������������� �����������������������
���������������������� ������������������������
���� ��������������������������������������������� �������������� ������������������� ��������� ����������� ����������������� ������������������ ������������������������������ ������������������������������ �������������������������
�������������������� ����������������������������������� ���������������������������
���� ������������������������� ������������ ������������������� ��������� ����������� ���������������� ��������������������� ������������������������������ ������������������������������ ����������������������������������� ��������������������������������� ���������������������������
���� ���������������������� �������������������� ������������������� �������� ����������� ����������������� ������������������ ������������������������������� ������������������������������� ������������������������������� ����������������
������������������������������ ����������
���� ����������������������������� �������������������� ����������������� �������� ����������� ����������������� ������������������ ������������������������������� ������������������������������� �������������������
������������������������ ����������������
������������������������������ ������������������������
���� �������������������� ����������� ����������������� ��������� ����������� ����������������� ������������������ ������������������������������ ������������������������������ ������������������������������ �������������� ����
���� ���������������������� ������������������������ ����������������� ��������� ����������� ���������������� ������������������������� ������������������������������� ������������������������������� �������������������������������� ������������������������� �����
���� ��������������������������� ��������������� ����������������� ��������� ����������� ���������������� ������������������������� ������������������������������ ������������������������������� �������������������� ����������������������������
������������������ �����������������
���������������������������� �������������� ����������������� ��������� ����������� ���������������� ��������������������� ������������������������������ ������������������������������ ����������������������������� ����������������������������� ���������������������
����� ����������������������������������� ������������������������ ����������������� �������� ����������� ����������������� ������������������ ������������������������������� ������������������������������ ���������������������
������������������ ���������������������� ��������
����� ��������������������������� ������������ ����������������� �������� ����������� ���������������� ������������������������� ������������������������������ ������������������������������� ��������������������������� ���������������������������
��������������� ������������������
�������������
����� ������������������������������� ������������������������������� ����������������� �������� ����������� ���������������� ������������������������� ������������������������������ ������������������������������� ��������������� �������������������������������� ������������������������
������������
��������������������� ������������������������ ����������������� ��������� ����������� ����������������� ��������������������� ������������������������������� ������������������������������� �������������� ������������������������������������� ���������������������
�����������
������������������������������ �������������� ����������������� ��������� ����������� ����������������� ������������������ ������������������������������� ������������������������������ ������������������������������� ������������������������������� ���������������
Inventory & development
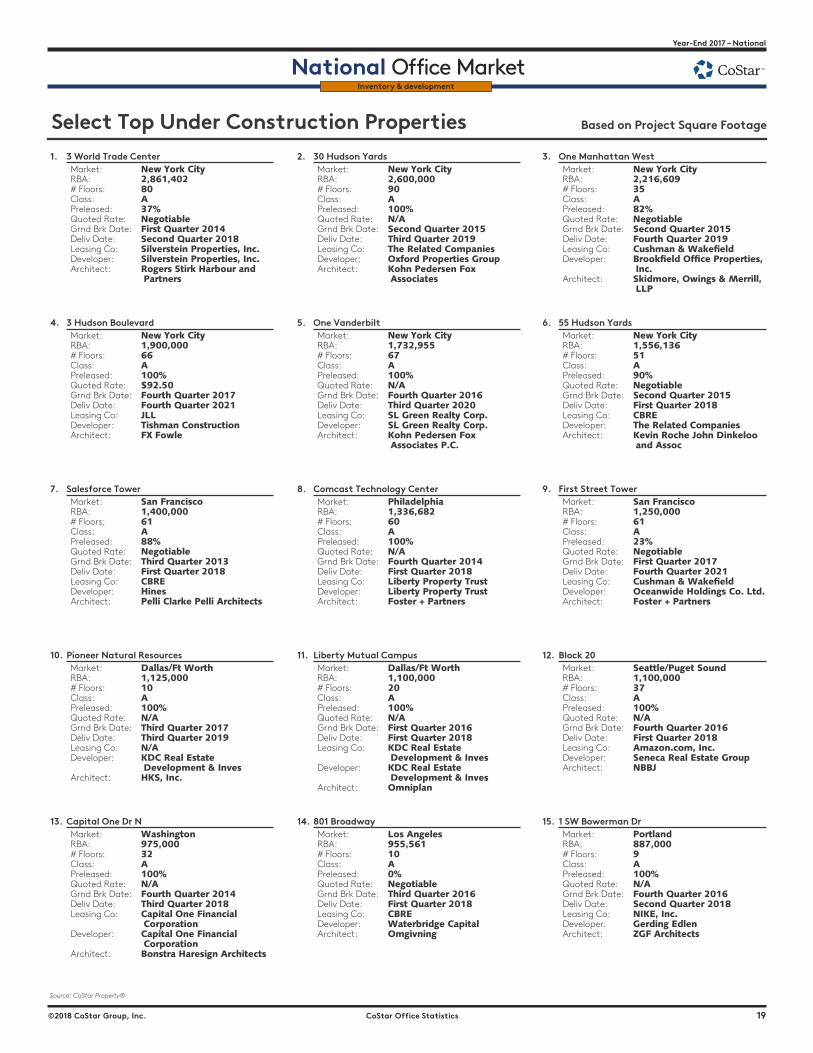
18 CoStar Office Statistics ©2018 CoStar Group, Inc.
National � Year-End 2017
National Office MarketYear-End 2017 – National
National Office Market
©2018 CoStar Group, Inc. CoStar Office Statistics 19
Inventory & development
���������������������������������������� �������������������������������
������������������������
���� ���������������������������� ������������������ ������������������� ��������� ������������ ���������������� ������������������������� ������������������������������ ������������������������������� ��������������������������������������� ��������������������������������������� �������������������������
���������
���� ����������������������� ������������������ ������������������� ��������� ������������ ����������������� ������������������ ������������������������������� ������������������������������ �������������������������������� ���������������������������������� ������������������
�����������
���� �������������������������� ������������������ ������������������� ��������� ������������ ���������������� ������������������������� ������������������������������� ������������������������������� ����������������������������� ����������������������������
��������������� ����������������������������
����
���� �������������������������� ������������������ ������������������� ��������� ������������ ����������������� ��������������������� ������������������������������� ������������������������������� �������������� ������������������������������� ���������
���� ���������������������� ������������������ ������������������� ��������� ������������ ����������������� ������������������ ������������������������������� ������������������������������ �������������������������������� �������������������������������� ������������������
����������������
���� ����������������������� ������������������ ������������������� ��������� ������������ ���������������� ������������������������� ������������������������������� ������������������������������ ��������������� �������������������������������� ��������������������������
����������
���� ������������������������ ������������������ ������������������� ��������� ������������ ���������������� ������������������������� ������������������������������ ������������������������������ ��������������� ���������������� ������������������������������
���� ��������������������������������� ����������������� ������������������� ��������� ������������ ����������������� ������������������ ������������������������������� ������������������������������ ��������������������������������� ��������������������������������� ������������������
���� �������������������������� ������������������ ������������������� ��������� ������������ ���������������� ������������������������� ������������������������������ ������������������������������� ����������������������������� �������������������������������������� ������������������
�������������������������������������� �������������������� ������������������� ��������� ������������ ����������������� ������������������ ������������������������������ ������������������������������ �������������� ����������������
������������������������������ ����������
����� ����������������������������� �������������������� ������������������� ��������� ������������ ����������������� ������������������ ������������������������������ ������������������������������ ����������������
������������������������������ ����������������
������������������������������ ���������
����� ���������������� ������������������������ ������������������� ��������� ������������ ����������������� ������������������ ������������������������������� ������������������������������ ��������������������������� ����������������������������������� �����
����������������������������� ��������������� ����������������� ��������� ������������ ����������������� ������������������ ������������������������������� ������������������������������ ����������������������
���������������������� ����������������������
���������������������� ����������������������������
������������������������� ���������������� ����������������� ��������� ������������ ��������������� ������������������������� ������������������������������ ������������������������������ ��������������� ������������������������������ ����������
����� ������������������������ ������������� ����������������� �������� ������������ ����������������� ������������������ ������������������������������� ������������������������������� ��������������������� ������������������������ ���������������
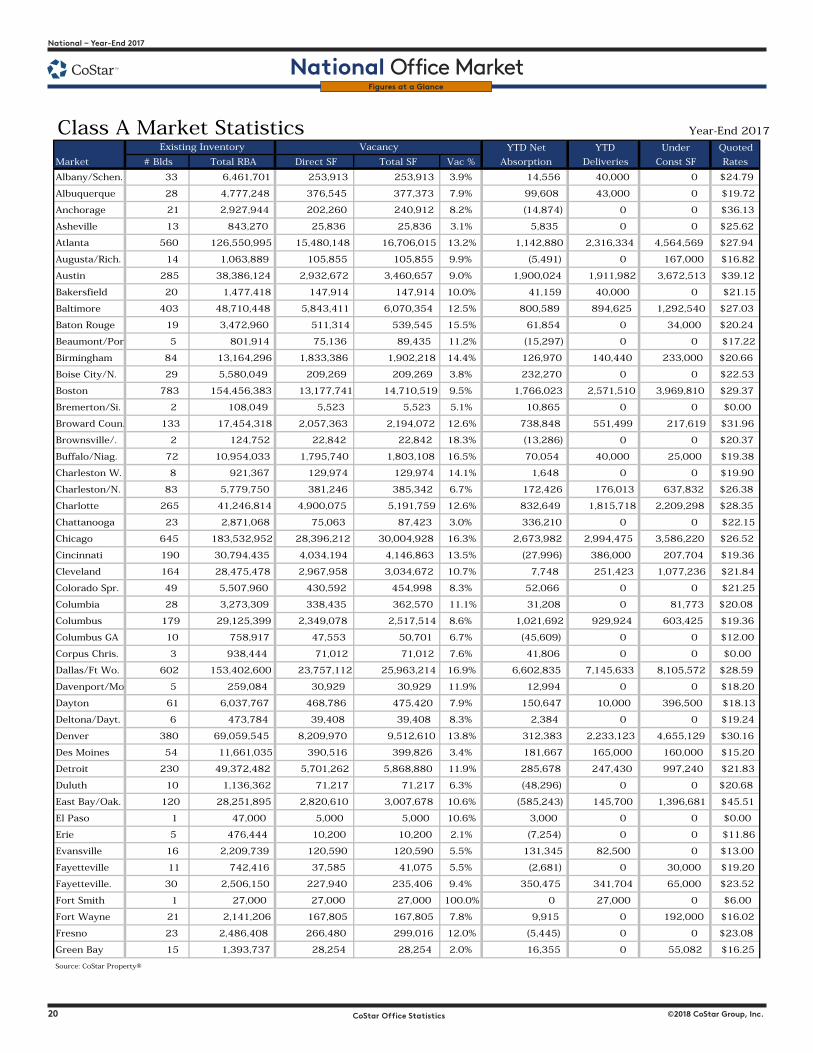
20 CoStar Office Statistics ©2018 CoStar Group, Inc.
National � Year-End 2017
National Office MarketYear-End 2017 – National
National Office Market
©2018 CoStar Group, Inc. CoStar Office Statistics 21
Figures at a Glance
Class A Market Statistics Year-End 2017
YTD Net YTD Under Quoted
Market # Blds Total RBA Direct SF Total SF Vac % Absorption Deliveries Const SF Rates
Albany/Schen. 33 6,461,701 253,913 253,913 3.9% 14,556 40,000 0 $24.79
Albuquerque 28 4,777,248 376,545 377,373 7.9% 99,608 43,000 0 $19.72
Anchorage 21 2,927,944 202,260 240,912 8.2% (14,874) 0 0 $36.13
Asheville 13 843,270 25,836 25,836 3.1% 5,835 0 0 $25.62
Atlanta 560 126,550,995 15,480,148 16,706,015 13.2% 1,142,880 2,316,334 4,564,569 $27.94
Augusta/Rich. 14 1,063,889 105,855 105,855 9.9% (5,491) 0 167,000 $16.82
Austin 285 38,386,124 2,932,672 3,460,657 9.0% 1,900,024 1,911,982 3,672,513 $39.12
Bakersfield 20 1,477,418 147,914 147,914 10.0% 41,159 40,000 0 $21.15
Baltimore 403 48,710,448 5,843,411 6,070,354 12.5% 800,589 894,625 1,292,540 $27.03
Baton Rouge 19 3,472,960 511,314 539,545 15.5% 61,854 0 34,000 $20.24
Beaumont/Por. 5 801,914 75,136 89,435 11.2% (15,297) 0 0 $17.22
Birmingham 84 13,164,296 1,833,386 1,902,218 14.4% 126,970 140,440 233,000 $20.66
Boise City/N. 29 5,580,049 209,269 209,269 3.8% 232,270 0 0 $22.53
Boston 783 154,456,383 13,177,741 14,710,519 9.5% 1,766,023 2,571,510 3,969,810 $29.37
Bremerton/Si. 2 108,049 5,523 5,523 5.1% 10,865 0 0 $0.00
Broward Coun. 133 17,454,318 2,057,363 2,194,072 12.6% 738,848 551,499 217,619 $31.96
Brownsville/. 2 124,752 22,842 22,842 18.3% (13,286) 0 0 $20.37
Buffalo/Niag. 72 10,954,033 1,795,740 1,803,108 16.5% 70,054 40,000 25,000 $19.38
Charleston W. 8 921,367 129,974 129,974 14.1% 1,648 0 0 $19.90
Charleston/N. 83 5,779,750 381,246 385,342 6.7% 172,426 176,013 637,832 $26.38
Charlotte 265 41,246,814 4,900,075 5,191,759 12.6% 832,649 1,815,718 2,209,298 $28.35
Chattanooga 23 2,871,068 75,063 87,423 3.0% 336,210 0 0 $22.15
Chicago 645 183,532,952 28,396,212 30,004,928 16.3% 2,673,982 2,994,475 3,586,220 $26.52
Cincinnati 190 30,794,435 4,034,194 4,146,863 13.5% (27,996) 386,000 207,704 $19.36
Cleveland 164 28,475,478 2,967,958 3,034,672 10.7% 7,748 251,423 1,077,236 $21.84
Colorado Spr. 49 5,507,960 430,592 454,998 8.3% 52,066 0 0 $21.25
Columbia 28 3,273,309 338,435 362,570 11.1% 31,208 0 81,773 $20.08
Columbus 179 29,125,399 2,349,078 2,517,514 8.6% 1,021,692 929,924 603,425 $19.36
Columbus GA 10 758,917 47,553 50,701 6.7% (45,609) 0 0 $12.00
Corpus Chris. 3 938,444 71,012 71,012 7.6% 41,806 0 0 $0.00
Dallas/Ft Wo. 602 153,402,600 23,757,112 25,963,214 16.9% 6,602,835 7,145,633 8,105,572 $28.59
Davenport/Mo. 5 259,084 30,929 30,929 11.9% 12,994 0 0 $18.20
Dayton 61 6,037,767 468,786 475,420 7.9% 150,647 10,000 396,500 $18.13
Deltona/Dayt. 6 473,784 39,408 39,408 8.3% 2,384 0 0 $19.24
Denver 380 69,059,545 8,209,970 9,512,610 13.8% 312,383 2,233,123 4,655,129 $30.16
Des Moines 54 11,661,035 390,516 399,826 3.4% 181,667 165,000 160,000 $15.20
Detroit 230 49,372,482 5,701,262 5,868,880 11.9% 285,678 247,430 997,240 $21.83
Duluth 10 1,136,362 71,217 71,217 6.3% (48,296) 0 0 $20.68
East Bay/Oak. 120 28,251,895 2,820,610 3,007,678 10.6% (585,243) 145,700 1,396,681 $45.51
El Paso 1 47,000 5,000 5,000 10.6% 3,000 0 0 $0.00
Erie 5 476,444 10,200 10,200 2.1% (7,254) 0 0 $11.86
Evansville 16 2,209,739 120,590 120,590 5.5% 131,345 82,500 0 $13.00
Fayetteville 11 742,416 37,585 41,075 5.5% (2,681) 0 30,000 $19.20
Fayetteville. 30 2,506,150 227,940 235,406 9.4% 350,475 341,704 65,000 $23.52
Fort Smith 1 27,000 27,000 27,000 100.0% 0 27,000 0 $6.00
Fort Wayne 21 2,141,206 167,805 167,805 7.8% 9,915 0 192,000 $16.02
Fresno 23 2,486,408 266,480 299,016 12.0% (5,445) 0 0 $23.08
Green Bay 15 1,393,737 28,254 28,254 2.0% 16,355 0 55,082 $16.25
Source: CoStar Property®
Existing Inventory Vacancy
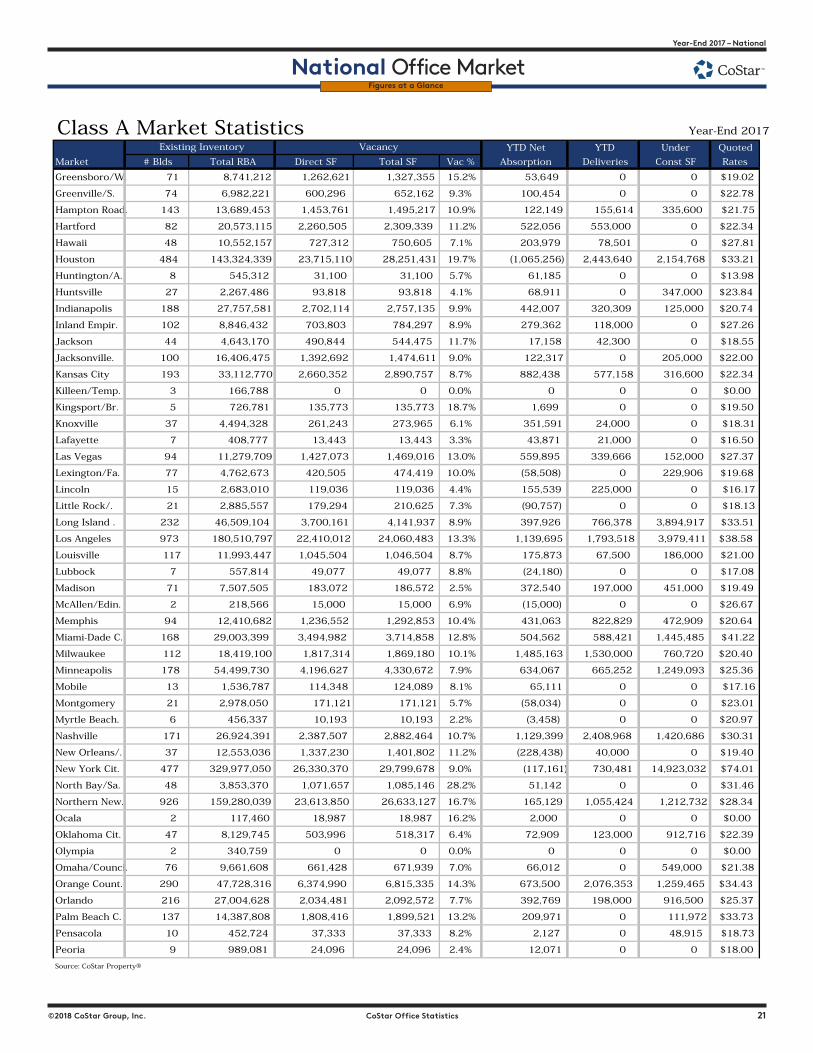
20 CoStar Office Statistics ©2018 CoStar Group, Inc.
National � Year-End 2017
National Office MarketYear-End 2017 – National
National Office Market
©2018 CoStar Group, Inc. CoStar Office Statistics 21
Figures at a Glance
Class A Market Statistics Year-End 2017
YTD Net YTD Under Quoted
Market # Blds Total RBA Direct SF Total SF Vac % Absorption Deliveries Const SF Rates
Greensboro/W. 71 8,741,212 1,262,621 1,327,355 15.2% 53,649 0 0 $19.02
Greenville/S. 74 6,982,221 600,296 652,162 9.3% 100,454 0 0 $22.78
Hampton Road. 143 13,689,453 1,453,761 1,495,217 10.9% 122,149 155,614 335,600 $21.75
Hartford 82 20,573,115 2,260,505 2,309,339 11.2% 522,056 553,000 0 $22.34
Hawaii 48 10,552,157 727,312 750,605 7.1% 203,979 78,501 0 $27.81
Houston 484 143,324,339 23,715,110 28,251,431 19.7% (1,065,256) 2,443,640 2,154,768 $33.21
Huntington/A. 8 545,312 31,100 31,100 5.7% 61,185 0 0 $13.98
Huntsville 27 2,267,486 93,818 93,818 4.1% 68,911 0 347,000 $23.84
Indianapolis 188 27,757,581 2,702,114 2,757,135 9.9% 442,007 320,309 125,000 $20.74
Inland Empir. 102 8,846,432 703,803 784,297 8.9% 279,362 118,000 0 $27.26
Jackson 44 4,643,170 490,844 544,475 11.7% 17,158 42,300 0 $18.55
Jacksonville. 100 16,406,475 1,392,692 1,474,611 9.0% 122,317 0 205,000 $22.00
Kansas City 193 33,112,770 2,660,352 2,890,757 8.7% 882,438 577,158 316,600 $22.34
Killeen/Temp. 3 166,788 0 0 0.0% 0 0 0 $0.00
Kingsport/Br. 5 726,781 135,773 135,773 18.7% 1,699 0 0 $19.50
Knoxville 37 4,494,328 261,243 273,965 6.1% 351,591 24,000 0 $18.31
Lafayette 7 408,777 13,443 13,443 3.3% 43,871 21,000 0 $16.50
Las Vegas 94 11,279,709 1,427,073 1,469,016 13.0% 559,895 339,666 152,000 $27.37
Lexington/Fa. 77 4,762,673 420,505 474,419 10.0% (58,508) 0 229,906 $19.68
Lincoln 15 2,683,010 119,036 119,036 4.4% 155,539 225,000 0 $16.17
Little Rock/. 21 2,885,557 179,294 210,625 7.3% (90,757) 0 0 $18.13
Long Island . 232 46,509,104 3,700,161 4,141,937 8.9% 397,926 766,378 3,894,917 $33.51
Los Angeles 973 180,510,797 22,410,012 24,060,483 13.3% 1,139,695 1,793,518 3,979,411 $38.58
Louisville 117 11,993,447 1,045,504 1,046,504 8.7% 175,873 67,500 186,000 $21.00
Lubbock 7 557,814 49,077 49,077 8.8% (24,180) 0 0 $17.08
Madison 71 7,507,505 183,072 186,572 2.5% 372,540 197,000 451,000 $19.49
McAllen/Edin. 2 218,566 15,000 15,000 6.9% (15,000) 0 0 $26.67
Memphis 94 12,410,682 1,236,552 1,292,853 10.4% 431,063 822,829 472,909 $20.64
Miami-Dade C. 168 29,003,399 3,494,982 3,714,858 12.8% 504,562 588,421 1,445,485 $41.22
Milwaukee 112 18,419,100 1,817,314 1,869,180 10.1% 1,485,163 1,530,000 760,720 $20.40
Minneapolis 178 54,499,730 4,196,627 4,330,672 7.9% 634,067 665,252 1,249,093 $25.36
Mobile 13 1,536,787 114,348 124,089 8.1% 65,111 0 0 $17.16
Montgomery 21 2,978,050 171,121 171,121 5.7% (58,034) 0 0 $23.01
Myrtle Beach. 6 456,337 10,193 10,193 2.2% (3,458) 0 0 $20.97
Nashville 171 26,924,391 2,387,507 2,882,464 10.7% 1,129,399 2,408,968 1,420,686 $30.31
New Orleans/. 37 12,553,036 1,337,230 1,401,802 11.2% (228,438) 40,000 0 $19.40
New York Cit. 477 329,977,050 26,330,370 29,799,678 9.0% (117,161) 730,481 14,923,032 $74.01
North Bay/Sa. 48 3,853,370 1,071,657 1,085,146 28.2% 51,142 0 0 $31.46
Northern New. 926 159,280,039 23,613,850 26,633,127 16.7% 165,129 1,055,424 1,212,732 $28.34
Ocala 2 117,460 18,987 18,987 16.2% 2,000 0 0 $0.00
Oklahoma Cit. 47 8,129,745 503,996 518,317 6.4% 72,909 123,000 912,716 $22.39
Olympia 2 340,759 0 0 0.0% 0 0 0 $0.00
Omaha/Counci. 76 9,661,608 661,428 671,939 7.0% 66,012 0 549,000 $21.38
Orange Count. 290 47,728,316 6,374,990 6,815,335 14.3% 673,500 2,076,353 1,259,465 $34.43
Orlando 216 27,004,628 2,034,481 2,092,572 7.7% 392,769 198,000 916,500 $25.37
Palm Beach C. 137 14,387,808 1,808,416 1,899,521 13.2% 209,971 0 111,972 $33.73
Pensacola 10 452,724 37,333 37,333 8.2% 2,127 0 48,915 $18.73
Peoria 9 989,081 24,096 24,096 2.4% 12,071 0 0 $18.00
Source: CoStar Property®
Existing Inventory Vacancy
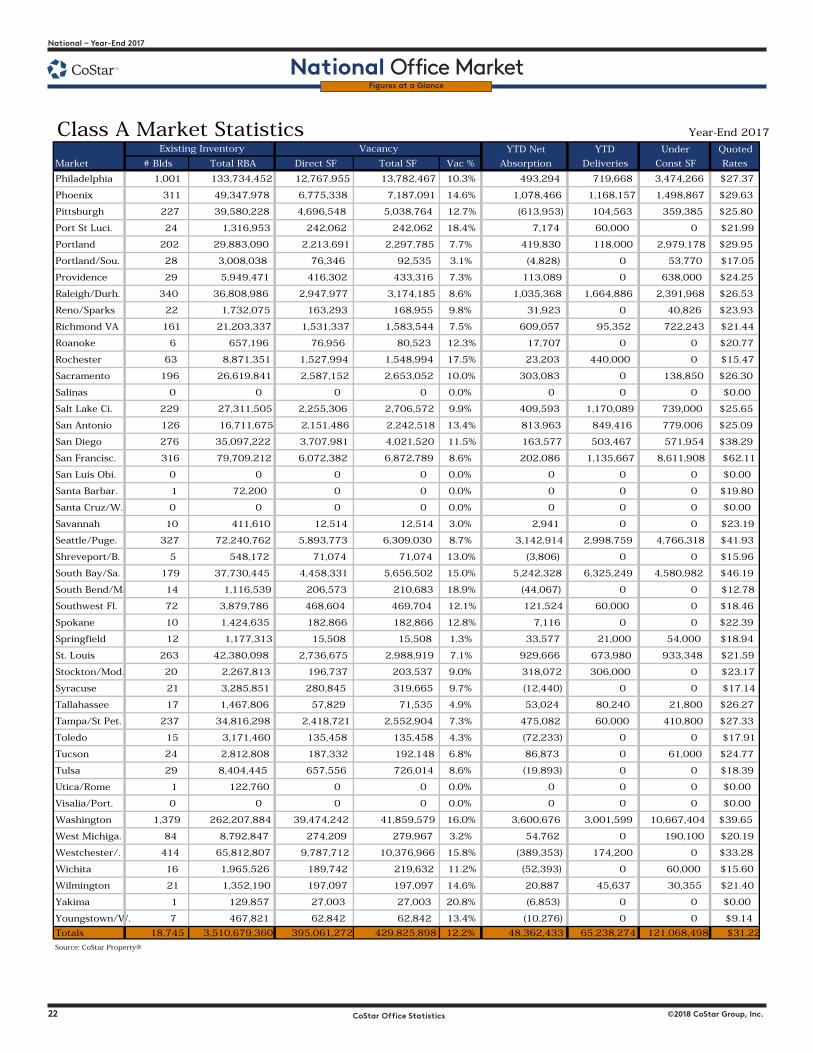
22 CoStar Office Statistics ©2018 CoStar Group, Inc.
National � Year-End 2017
National Office MarketYear-End 2017 – National
National Office Market
©2018 CoStar Group, Inc. CoStar Office Statistics 23
Figures at a Glance
Class A Market Statistics Year-End 2017
YTD Net YTD Under Quoted
Market # Blds Total RBA Direct SF Total SF Vac % Absorption Deliveries Const SF Rates
Philadelphia 1,001 133,734,452 12,767,955 13,782,467 10.3% 493,294 719,668 3,474,266 $27.37
Phoenix 311 49,347,978 6,775,338 7,187,091 14.6% 1,078,466 1,168,157 1,498,867 $29.63
Pittsburgh 227 39,580,228 4,696,548 5,038,764 12.7% (613,953) 104,563 359,385 $25.80
Port St Luci. 24 1,316,953 242,062 242,062 18.4% 7,174 60,000 0 $21.99
Portland 202 29,883,090 2,213,691 2,297,785 7.7% 419,830 118,000 2,979,178 $29.95
Portland/Sou. 28 3,008,038 76,346 92,535 3.1% (4,828) 0 53,770 $17.05
Providence 29 5,949,471 416,302 433,316 7.3% 113,089 0 638,000 $24.25
Raleigh/Durh. 340 36,808,986 2,947,977 3,174,185 8.6% 1,035,368 1,664,886 2,391,968 $26.53
Reno/Sparks 22 1,732,075 163,293 168,955 9.8% 31,923 0 40,826 $23.93
Richmond VA 161 21,203,337 1,531,337 1,583,544 7.5% 609,057 95,352 722,243 $21.44
Roanoke 6 657,196 76,956 80,523 12.3% 17,707 0 0 $20.77
Rochester 63 8,871,351 1,527,994 1,548,994 17.5% 23,203 440,000 0 $15.47
Sacramento 196 26,619,841 2,587,152 2,653,052 10.0% 303,083 0 138,850 $26.30
Salinas 0 0 0 0 0.0% 0 0 0 $0.00
Salt Lake Ci. 229 27,311,505 2,255,306 2,706,572 9.9% 409,593 1,170,089 739,000 $25.65
San Antonio 126 16,711,675 2,151,486 2,242,518 13.4% 813,963 849,416 779,006 $25.09
San Diego 276 35,097,222 3,707,981 4,021,520 11.5% 163,577 503,467 571,954 $38.29
San Francisc. 316 79,709,212 6,072,382 6,872,789 8.6% 202,086 1,135,667 8,611,908 $62.11
San Luis Obi. 0 0 0 0 0.0% 0 0 0 $0.00
Santa Barbar. 1 72,200 0 0 0.0% 0 0 0 $19.80
Santa Cruz/W. 0 0 0 0 0.0% 0 0 0 $0.00
Savannah 10 411,610 12,514 12,514 3.0% 2,941 0 0 $23.19
Seattle/Puge. 327 72,240,762 5,893,773 6,309,030 8.7% 3,142,914 2,998,759 4,766,318 $41.93
Shreveport/B. 5 548,172 71,074 71,074 13.0% (3,806) 0 0 $15.96
South Bay/Sa. 179 37,730,445 4,458,331 5,656,502 15.0% 5,242,328 6,325,249 4,580,982 $46.19
South Bend/M. 14 1,116,539 206,573 210,683 18.9% (44,067) 0 0 $12.78
Southwest Fl. 72 3,879,786 468,604 469,704 12.1% 121,524 60,000 0 $18.46
Spokane 10 1,424,635 182,866 182,866 12.8% 7,116 0 0 $22.39
Springfield 12 1,177,313 15,508 15,508 1.3% 33,577 21,000 54,000 $18.94
St. Louis 263 42,380,098 2,736,675 2,988,919 7.1% 929,666 673,980 933,348 $21.59
Stockton/Mod. 20 2,267,813 196,737 203,537 9.0% 318,072 306,000 0 $23.17
Syracuse 21 3,285,851 280,845 319,665 9.7% (12,440) 0 0 $17.14
Tallahassee 17 1,467,806 57,829 71,535 4.9% 53,024 80,240 21,800 $26.27
Tampa/St Pet. 237 34,816,298 2,418,721 2,552,904 7.3% 475,082 60,000 410,800 $27.33
Toledo 15 3,171,460 135,458 135,458 4.3% (72,233) 0 0 $17.91
Tucson 24 2,812,808 187,332 192,148 6.8% 86,873 0 61,000 $24.77
Tulsa 29 8,404,445 657,556 726,014 8.6% (19,893) 0 0 $18.39
Utica/Rome 1 122,760 0 0 0.0% 0 0 0 $0.00
Visalia/Port. 0 0 0 0 0.0% 0 0 0 $0.00
Washington 1,379 262,207,884 39,474,242 41,859,579 16.0% 3,600,676 3,001,599 10,667,404 $39.65
West Michiga. 84 8,792,847 274,209 279,967 3.2% 54,762 0 190,100 $20.19
Westchester/. 414 65,812,807 9,787,712 10,376,966 15.8% (389,353) 174,200 0 $33.28
Wichita 16 1,965,526 189,742 219,632 11.2% (52,393) 0 60,000 $15.60
Wilmington 21 1,352,190 197,097 197,097 14.6% 20,887 45,637 30,355 $21.40
Yakima 1 129,857 27,003 27,003 20.8% (6,853) 0 0 $0.00
Youngstown/W. 7 467,821 62,842 62,842 13.4% (10,276) 0 0 $9.14
Totals 18,745 3,510,679,360 395,061,272 429,825,898 12.2% 48,362,433 65,238,274 121,068,498 $31.22
Source: CoStar Property®
Existing Inventory Vacancy
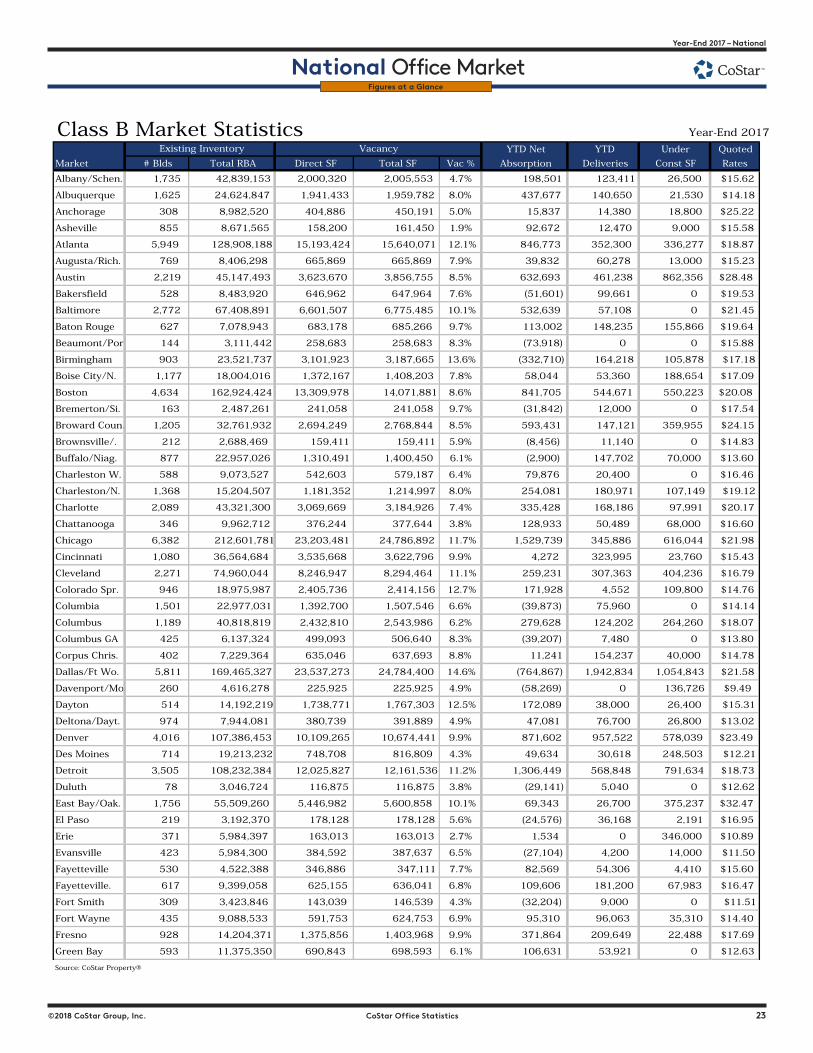
22 CoStar Office Statistics ©2018 CoStar Group, Inc.
National � Year-End 2017
National Office MarketYear-End 2017 – National
National Office Market
©2018 CoStar Group, Inc. CoStar Office Statistics 23
Figures at a Glance
Class B Market Statistics Year-End 2017
YTD Net YTD Under Quoted
Market # Blds Total RBA Direct SF Total SF Vac % Absorption Deliveries Const SF Rates
Albany/Schen. 1,735 42,839,153 2,000,320 2,005,553 4.7% 198,501 123,411 26,500 $15.62
Albuquerque 1,625 24,624,847 1,941,433 1,959,782 8.0% 437,677 140,650 21,530 $14.18
Anchorage 308 8,982,520 404,886 450,191 5.0% 15,837 14,380 18,800 $25.22
Asheville 855 8,671,565 158,200 161,450 1.9% 92,672 12,470 9,000 $15.58
Atlanta 5,949 128,908,188 15,193,424 15,640,071 12.1% 846,773 352,300 336,277 $18.87
Augusta/Rich. 769 8,406,298 665,869 665,869 7.9% 39,832 60,278 13,000 $15.23
Austin 2,219 45,147,493 3,623,670 3,856,755 8.5% 632,693 461,238 862,356 $28.48
Bakersfield 528 8,483,920 646,962 647,964 7.6% (51,601) 99,661 0 $19.53
Baltimore 2,772 67,408,891 6,601,507 6,775,485 10.1% 532,639 57,108 0 $21.45
Baton Rouge 627 7,078,943 683,178 685,266 9.7% 113,002 148,235 155,866 $19.64
Beaumont/Por. 144 3,111,442 258,683 258,683 8.3% (73,918) 0 0 $15.88
Birmingham 903 23,521,737 3,101,923 3,187,665 13.6% (332,710) 164,218 105,878 $17.18
Boise City/N. 1,177 18,004,016 1,372,167 1,408,203 7.8% 58,044 53,360 188,654 $17.09
Boston 4,634 162,924,424 13,309,978 14,071,881 8.6% 841,705 544,671 550,223 $20.08
Bremerton/Si. 163 2,487,261 241,058 241,058 9.7% (31,842) 12,000 0 $17.54
Broward Coun. 1,205 32,761,932 2,694,249 2,768,844 8.5% 593,431 147,121 359,955 $24.15
Brownsville/. 212 2,688,469 159,411 159,411 5.9% (8,456) 11,140 0 $14.83
Buffalo/Niag. 877 22,957,026 1,310,491 1,400,450 6.1% (2,900) 147,702 70,000 $13.60
Charleston W. 588 9,073,527 542,603 579,187 6.4% 79,876 20,400 0 $16.46
Charleston/N. 1,368 15,204,507 1,181,352 1,214,997 8.0% 254,081 180,971 107,149 $19.12
Charlotte 2,089 43,321,300 3,069,669 3,184,926 7.4% 335,428 168,186 97,991 $20.17
Chattanooga 346 9,962,712 376,244 377,644 3.8% 128,933 50,489 68,000 $16.60
Chicago 6,382 212,601,781 23,203,481 24,786,892 11.7% 1,529,739 345,886 616,044 $21.98
Cincinnati 1,080 36,564,684 3,535,668 3,622,796 9.9% 4,272 323,995 23,760 $15.43
Cleveland 2,271 74,960,044 8,246,947 8,294,464 11.1% 259,231 307,363 404,236 $16.79
Colorado Spr. 946 18,975,987 2,405,736 2,414,156 12.7% 171,928 4,552 109,800 $14.76
Columbia 1,501 22,977,031 1,392,700 1,507,546 6.6% (39,873) 75,960 0 $14.14
Columbus 1,189 40,818,819 2,432,810 2,543,986 6.2% 279,628 124,202 264,260 $18.07
Columbus GA 425 6,137,324 499,093 506,640 8.3% (39,207) 7,480 0 $13.80
Corpus Chris. 402 7,229,364 635,046 637,693 8.8% 11,241 154,237 40,000 $14.78
Dallas/Ft Wo. 5,811 169,465,327 23,537,273 24,784,400 14.6% (764,867) 1,942,834 1,054,843 $21.58
Davenport/Mo. 260 4,616,278 225,925 225,925 4.9% (58,269) 0 136,726 $9.49
Dayton 514 14,192,219 1,738,771 1,767,303 12.5% 172,089 38,000 26,400 $15.31
Deltona/Dayt. 974 7,944,081 380,739 391,889 4.9% 47,081 76,700 26,800 $13.02
Denver 4,016 107,386,453 10,109,265 10,674,441 9.9% 871,602 957,522 578,039 $23.49
Des Moines 714 19,213,232 748,708 816,809 4.3% 49,634 30,618 248,503 $12.21
Detroit 3,505 108,232,384 12,025,827 12,161,536 11.2% 1,306,449 568,848 791,634 $18.73
Duluth 78 3,046,724 116,875 116,875 3.8% (29,141) 5,040 0 $12.62
East Bay/Oak. 1,756 55,509,260 5,446,982 5,600,858 10.1% 69,343 26,700 375,237 $32.47
El Paso 219 3,192,370 178,128 178,128 5.6% (24,576) 36,168 2,191 $16.95
Erie 371 5,984,397 163,013 163,013 2.7% 1,534 0 346,000 $10.89
Evansville 423 5,984,300 384,592 387,637 6.5% (27,104) 4,200 14,000 $11.50
Fayetteville 530 4,522,388 346,886 347,111 7.7% 82,569 54,306 4,410 $15.60
Fayetteville. 617 9,399,058 625,155 636,041 6.8% 109,606 181,200 67,983 $16.47
Fort Smith 309 3,423,846 143,039 146,539 4.3% (32,204) 9,000 0 $11.51
Fort Wayne 435 9,088,533 591,753 624,753 6.9% 95,310 96,063 35,310 $14.40
Fresno 928 14,204,371 1,375,856 1,403,968 9.9% 371,864 209,649 22,488 $17.69
Green Bay 593 11,375,350 690,843 698,593 6.1% 106,631 53,921 0 $12.63
Source: CoStar Property®
Existing Inventory Vacancy
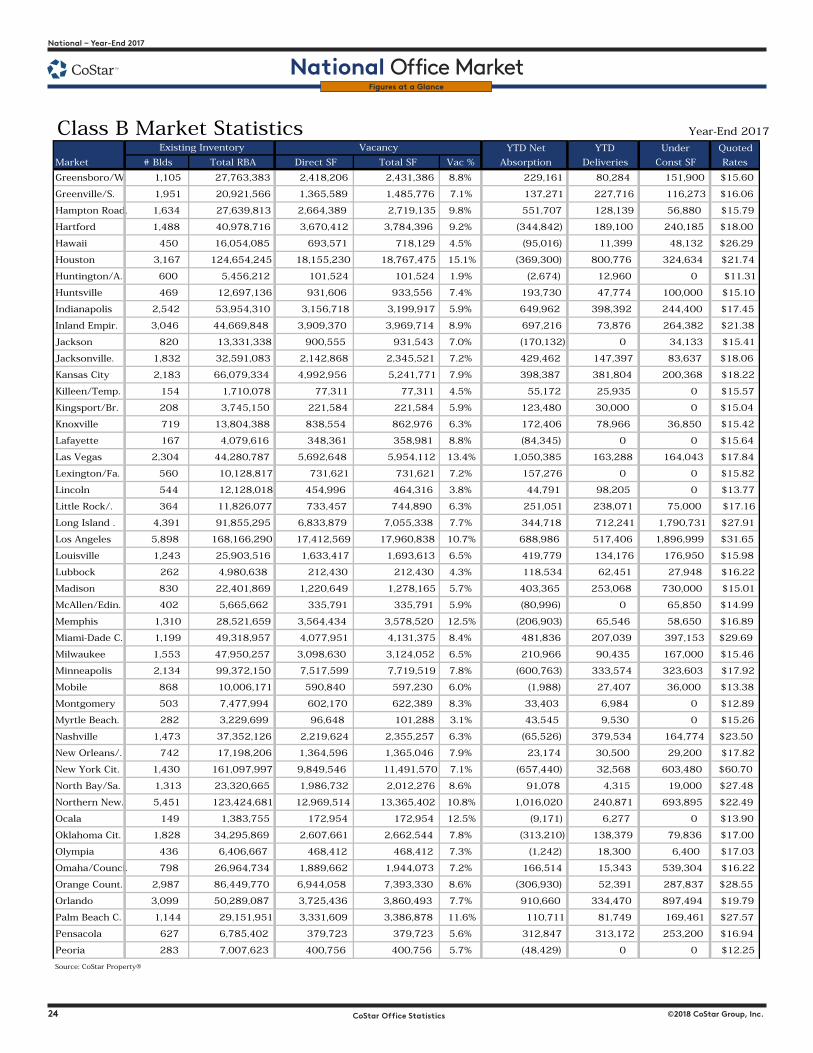
24 CoStar Office Statistics ©2018 CoStar Group, Inc.
National � Year-End 2017
National Office MarketYear-End 2017 – National
National Office Market
©2018 CoStar Group, Inc. CoStar Office Statistics 25
Figures at a Glance
Class B Market Statistics Year-End 2017
YTD Net YTD Under Quoted
Market # Blds Total RBA Direct SF Total SF Vac % Absorption Deliveries Const SF Rates
Greensboro/W. 1,105 27,763,383 2,418,206 2,431,386 8.8% 229,161 80,284 151,900 $15.60
Greenville/S. 1,951 20,921,566 1,365,589 1,485,776 7.1% 137,271 227,716 116,273 $16.06
Hampton Road. 1,634 27,639,813 2,664,389 2,719,135 9.8% 551,707 128,139 56,880 $15.79
Hartford 1,488 40,978,716 3,670,412 3,784,396 9.2% (344,842) 189,100 240,185 $18.00
Hawaii 450 16,054,085 693,571 718,129 4.5% (95,016) 11,399 48,132 $26.29
Houston 3,167 124,654,245 18,155,230 18,767,475 15.1% (369,300) 800,776 324,634 $21.74
Huntington/A. 600 5,456,212 101,524 101,524 1.9% (2,674) 12,960 0 $11.31
Huntsville 469 12,697,136 931,606 933,556 7.4% 193,730 47,774 100,000 $15.10
Indianapolis 2,542 53,954,310 3,156,718 3,199,917 5.9% 649,962 398,392 244,400 $17.45
Inland Empir. 3,046 44,669,848 3,909,370 3,969,714 8.9% 697,216 73,876 264,382 $21.38
Jackson 820 13,331,338 900,555 931,543 7.0% (170,132) 0 34,133 $15.41
Jacksonville. 1,832 32,591,083 2,142,868 2,345,521 7.2% 429,462 147,397 83,637 $18.06
Kansas City 2,183 66,079,334 4,992,956 5,241,771 7.9% 398,387 381,804 200,368 $18.22
Killeen/Temp. 154 1,710,078 77,311 77,311 4.5% 55,172 25,935 0 $15.57
Kingsport/Br. 208 3,745,150 221,584 221,584 5.9% 123,480 30,000 0 $15.04
Knoxville 719 13,804,388 838,554 862,976 6.3% 172,406 78,966 36,850 $15.42
Lafayette 167 4,079,616 348,361 358,981 8.8% (84,345) 0 0 $15.64
Las Vegas 2,304 44,280,787 5,692,648 5,954,112 13.4% 1,050,385 163,288 164,043 $17.84
Lexington/Fa. 560 10,128,817 731,621 731,621 7.2% 157,276 0 0 $15.82
Lincoln 544 12,128,018 454,996 464,316 3.8% 44,791 98,205 0 $13.77
Little Rock/. 364 11,826,077 733,457 744,890 6.3% 251,051 238,071 75,000 $17.16
Long Island . 4,391 91,855,295 6,833,879 7,055,338 7.7% 344,718 712,241 1,790,731 $27.91
Los Angeles 5,898 168,166,290 17,412,569 17,960,838 10.7% 688,986 517,406 1,896,999 $31.65
Louisville 1,243 25,903,516 1,633,417 1,693,613 6.5% 419,779 134,176 176,950 $15.98
Lubbock 262 4,980,638 212,430 212,430 4.3% 118,534 62,451 27,948 $16.22
Madison 830 22,401,869 1,220,649 1,278,165 5.7% 403,365 253,068 730,000 $15.01
McAllen/Edin. 402 5,665,662 335,791 335,791 5.9% (80,996) 0 65,850 $14.99
Memphis 1,310 28,521,659 3,564,434 3,578,520 12.5% (206,903) 65,546 58,650 $16.89
Miami-Dade C. 1,199 49,318,957 4,077,951 4,131,375 8.4% 481,836 207,039 397,153 $29.69
Milwaukee 1,553 47,950,257 3,098,630 3,124,052 6.5% 210,966 90,435 167,000 $15.46
Minneapolis 2,134 99,372,150 7,517,599 7,719,519 7.8% (600,763) 333,574 323,603 $17.92
Mobile 868 10,006,171 590,840 597,230 6.0% (1,988) 27,407 36,000 $13.38
Montgomery 503 7,477,994 602,170 622,389 8.3% 33,403 6,984 0 $12.89
Myrtle Beach. 282 3,229,699 96,648 101,288 3.1% 43,545 9,530 0 $15.26
Nashville 1,473 37,352,126 2,219,624 2,355,257 6.3% (65,526) 379,534 164,774 $23.50
New Orleans/. 742 17,198,206 1,364,596 1,365,046 7.9% 23,174 30,500 29,200 $17.82
New York Cit. 1,430 161,097,997 9,849,546 11,491,570 7.1% (657,440) 32,568 603,480 $60.70
North Bay/Sa. 1,313 23,320,665 1,986,732 2,012,276 8.6% 91,078 4,315 19,000 $27.48
Northern New. 5,451 123,424,681 12,969,514 13,365,402 10.8% 1,016,020 240,871 693,895 $22.49
Ocala 149 1,383,755 172,954 172,954 12.5% (9,171) 6,277 0 $13.90
Oklahoma Cit. 1,828 34,295,869 2,607,661 2,662,544 7.8% (313,210) 138,379 79,836 $17.00
Olympia 436 6,406,667 468,412 468,412 7.3% (1,242) 18,300 6,400 $17.03
Omaha/Counci. 798 26,964,734 1,889,662 1,944,073 7.2% 166,514 15,343 539,304 $16.22
Orange Count. 2,987 86,449,770 6,944,058 7,393,330 8.6% (306,930) 52,391 287,837 $28.55
Orlando 3,099 50,289,087 3,725,436 3,860,493 7.7% 910,660 334,470 897,494 $19.79
Palm Beach C. 1,144 29,151,951 3,331,609 3,386,878 11.6% 110,711 81,749 169,461 $27.57
Pensacola 627 6,785,402 379,723 379,723 5.6% 312,847 313,172 253,200 $16.94
Peoria 283 7,007,623 400,756 400,756 5.7% (48,429) 0 0 $12.25
Source: CoStar Property®
Existing Inventory Vacancy

24 CoStar Office Statistics ©2018 CoStar Group, Inc.
National � Year-End 2017
National Office MarketYear-End 2017 – National
National Office Market
©2018 CoStar Group, Inc. CoStar Office Statistics 25
Figures at a Glance
Class B Market Statistics Year-End 2017
YTD Net YTD Under Quoted
Market # Blds Total RBA Direct SF Total SF Vac % Absorption Deliveries Const SF Rates
Philadelphia 8,273 180,518,434 14,608,151 14,868,954 8.2% 1,454,394 448,970 469,342 $21.01
Phoenix 4,613 101,726,883 15,162,916 16,034,578 15.8% 901,850 720,726 241,462 $22.71
Pittsburgh 2,313 60,962,941 5,024,001 5,079,787 8.3% 54,246 419,712 230,908 $19.99
Port St Luci. 473 6,123,387 508,260 510,519 8.3% 113,552 72,665 37,806 $13.62
Portland 1,574 46,683,356 3,462,363 3,548,061 7.6% 553,383 487,856 213,074 $23.70
Portland/Sou. 459 10,586,027 578,460 605,623 5.7% 54,968 43,640 44,679 $15.21
Providence 719 20,701,867 1,175,125 1,188,876 5.7% 446,850 90,220 55,000 $17.27
Raleigh/Durh. 2,196 48,082,059 3,381,351 3,440,991 7.2% 578,622 330,111 298,869 $18.97
Reno/Sparks 785 10,480,883 969,655 1,000,255 9.5% 305,233 4,168 25,093 $18.30
Richmond VA 1,304 30,239,316 2,245,710 2,287,951 7.6% 120,173 47,911 199,982 $16.42
Roanoke 302 7,016,865 478,825 478,825 6.8% 316,334 16,800 0 $18.52
Rochester 737 26,012,506 1,681,898 1,740,626 6.7% (155,737) 50,500 214,034 $12.85
Sacramento 1,720 45,738,219 4,814,973 4,980,172 10.9% 181,741 0 525,040 $20.99
Salinas 272 4,918,078 416,518 420,874 8.6% 300,949 141,226 0 $22.16
Salt Lake Ci. 2,815 61,396,624 3,829,855 4,048,079 6.6% (244,289) 499,318 913,990 $18.70
San Antonio 1,690 44,911,749 3,685,069 3,761,688 8.4% 765,270 745,846 462,888 $19.74
San Diego 1,954 55,518,818 5,353,541 5,662,387 10.2% 1,024,374 221,941 127,904 $29.78
San Francisc. 1,472 64,850,404 3,385,581 4,186,797 6.5% 3,594 2,000 1,893,185 $59.75
San Luis Obi. 184 2,181,822 80,891 80,891 3.7% 97,046 61,947 45,213 $21.83
Santa Barbar. 1,173 10,669,924 399,160 423,009 4.0% (75,934) 0 0 $23.48
Santa Cruz/W. 421 4,677,589 305,380 306,392 6.6% 20,244 19,000 0 $23.32
Savannah 543 6,086,467 410,748 410,748 6.7% 46,152 50,137 32,964 $17.97
Seattle/Puge. 3,045 97,536,345 7,223,969 7,870,000 8.1% (456,318) 165,086 1,055,152 $27.20
Shreveport/B. 131 3,896,128 401,485 401,485 10.3% (27,382) 20,000 7,500 $14.90
South Bay/Sa. 1,794 65,143,032 4,316,870 5,272,425 8.1% 883,303 1,260,182 841,291 $41.29
South Bend/M. 217 3,822,278 442,677 444,459 11.6% (48,863) 184,681 0 $16.48
Southwest Fl. 1,710 20,768,678 1,282,424 1,300,402 6.3% 403,816 158,267 44,504 $15.16
Spokane 993 16,282,221 1,530,832 1,544,529 9.5% 99,826 0 11,710 $15.18
Springfield 444 5,990,240 441,776 449,721 7.5% 102,570 26,211 30,000 $13.16
St. Louis 2,114 59,706,186 5,141,866 5,177,329 8.7% 276,594 180,101 0 $17.61
Stockton/Mod. 670 9,800,947 500,098 506,171 5.2% 192,461 0 0 $14.73
Syracuse 1,113 24,149,375 1,954,431 1,992,377 8.3% 126,649 64,236 158,945 $13.49
Tallahassee 1,527 18,243,919 717,870 717,870 3.9% 137,585 65,735 44,400 $16.45
Tampa/St Pet. 5,001 69,698,748 5,420,092 5,582,593 8.0% 1,015,888 158,694 243,946 $19.68
Toledo 543 11,426,975 943,601 958,163 8.4% (105,367) 26,926 97,247 $13.44
Tucson 1,284 17,927,915 1,926,464 1,961,010 10.9% 253,629 17,771 188,000 $18.40
Tulsa 929 31,111,259 3,941,824 4,306,977 13.8% (495,824) 141,866 112,628 $14.50
Utica/Rome 273 6,020,427 150,074 150,074 2.5% 98,415 0 0 $9.67
Visalia/Port. 169 1,408,715 57,704 57,704 4.1% 47,223 6,144 15,734 $18.44
Washington 4,519 175,977,355 21,310,506 22,320,875 12.7% 828,682 104,509 379,612 $30.90
West Michiga. 2,113 42,526,136 2,590,849 2,712,722 6.4% 883,252 701,784 307,968 $14.06
Westchester/. 2,361 62,761,277 7,992,946 8,152,177 13.0% (1,278,638) 92,409 220,000 $25.23
Wichita 683 13,833,404 1,148,544 1,150,859 8.3% 2,826 36,800 7,981 $14.22
Wilmington 625 7,309,598 299,747 299,747 4.1% 185,347 80,621 83,195 $16.97
Yakima 421 3,435,677 238,797 238,797 7.0% 13,426 0 0 $12.67
Youngstown/W. 459 6,269,639 431,972 431,972 6.9% 32,325 93,798 0 $10.63
Totals 205,414 5,063,219,158 452,793,053 471,922,744 9.3% 26,417,333 23,866,756 29,616,671 $22.16
Source: CoStar Property®
Existing Inventory Vacancy
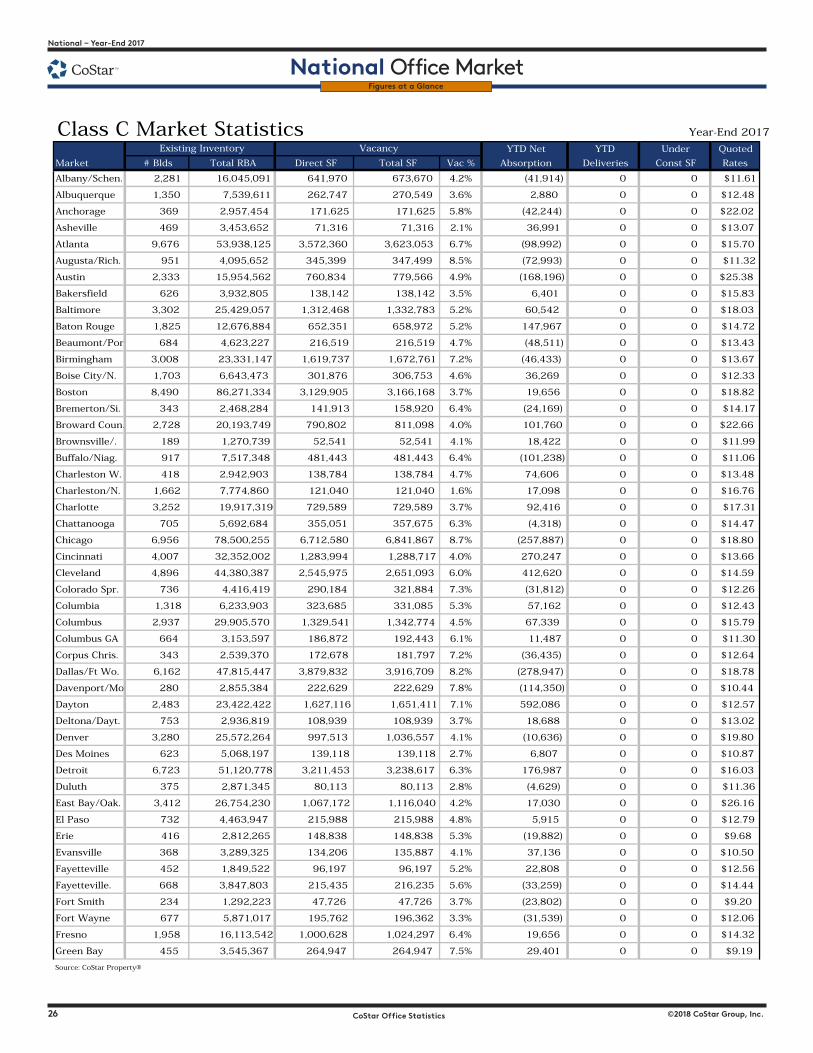
26 CoStar Office Statistics ©2018 CoStar Group, Inc.
National � Year-End 2017
National Office MarketYear-End 2017 – National
National Office Market
©2018 CoStar Group, Inc. CoStar Office Statistics 27
Figures at a Glance
Class C Market Statistics Year-End 2017
YTD Net YTD Under Quoted
Market # Blds Total RBA Direct SF Total SF Vac % Absorption Deliveries Const SF Rates
Albany/Schen. 2,281 16,045,091 641,970 673,670 4.2% (41,914) 0 0 $11.61
Albuquerque 1,350 7,539,611 262,747 270,549 3.6% 2,880 0 0 $12.48
Anchorage 369 2,957,454 171,625 171,625 5.8% (42,244) 0 0 $22.02
Asheville 469 3,453,652 71,316 71,316 2.1% 36,991 0 0 $13.07
Atlanta 9,676 53,938,125 3,572,360 3,623,053 6.7% (98,992) 0 0 $15.70
Augusta/Rich. 951 4,095,652 345,399 347,499 8.5% (72,993) 0 0 $11.32
Austin 2,333 15,954,562 760,834 779,566 4.9% (168,196) 0 0 $25.38
Bakersfield 626 3,932,805 138,142 138,142 3.5% 6,401 0 0 $15.83
Baltimore 3,302 25,429,057 1,312,468 1,332,783 5.2% 60,542 0 0 $18.03
Baton Rouge 1,825 12,676,884 652,351 658,972 5.2% 147,967 0 0 $14.72
Beaumont/Por. 684 4,623,227 216,519 216,519 4.7% (48,511) 0 0 $13.43
Birmingham 3,008 23,331,147 1,619,737 1,672,761 7.2% (46,433) 0 0 $13.67
Boise City/N. 1,703 6,643,473 301,876 306,753 4.6% 36,269 0 0 $12.33
Boston 8,490 86,271,334 3,129,905 3,166,168 3.7% 19,656 0 0 $18.82
Bremerton/Si. 343 2,468,284 141,913 158,920 6.4% (24,169) 0 0 $14.17
Broward Coun. 2,728 20,193,749 790,802 811,098 4.0% 101,760 0 0 $22.66
Brownsville/. 189 1,270,739 52,541 52,541 4.1% 18,422 0 0 $11.99
Buffalo/Niag. 917 7,517,348 481,443 481,443 6.4% (101,238) 0 0 $11.06
Charleston W. 418 2,942,903 138,784 138,784 4.7% 74,606 0 0 $13.48
Charleston/N. 1,662 7,774,860 121,040 121,040 1.6% 17,098 0 0 $16.76
Charlotte 3,252 19,917,319 729,589 729,589 3.7% 92,416 0 0 $17.31
Chattanooga 705 5,692,684 355,051 357,675 6.3% (4,318) 0 0 $14.47
Chicago 6,956 78,500,255 6,712,580 6,841,867 8.7% (257,887) 0 0 $18.80
Cincinnati 4,007 32,352,002 1,283,994 1,288,717 4.0% 270,247 0 0 $13.66
Cleveland 4,896 44,380,387 2,545,975 2,651,093 6.0% 412,620 0 0 $14.59
Colorado Spr. 736 4,416,419 290,184 321,884 7.3% (31,812) 0 0 $12.26
Columbia 1,318 6,233,903 323,685 331,085 5.3% 57,162 0 0 $12.43
Columbus 2,937 29,905,570 1,329,541 1,342,774 4.5% 67,339 0 0 $15.79
Columbus GA 664 3,153,597 186,872 192,443 6.1% 11,487 0 0 $11.30
Corpus Chris. 343 2,539,370 172,678 181,797 7.2% (36,435) 0 0 $12.64
Dallas/Ft Wo. 6,162 47,815,447 3,879,832 3,916,709 8.2% (278,947) 0 0 $18.78
Davenport/Mo. 280 2,855,384 222,629 222,629 7.8% (114,350) 0 0 $10.44
Dayton 2,483 23,422,422 1,627,116 1,651,411 7.1% 592,086 0 0 $12.57
Deltona/Dayt. 753 2,936,819 108,939 108,939 3.7% 18,688 0 0 $13.02
Denver 3,280 25,572,264 997,513 1,036,557 4.1% (10,636) 0 0 $19.80
Des Moines 623 5,068,197 139,118 139,118 2.7% 6,807 0 0 $10.87
Detroit 6,723 51,120,778 3,211,453 3,238,617 6.3% 176,987 0 0 $16.03
Duluth 375 2,871,345 80,113 80,113 2.8% (4,629) 0 0 $11.36
East Bay/Oak. 3,412 26,754,230 1,067,172 1,116,040 4.2% 17,030 0 0 $26.16
El Paso 732 4,463,947 215,988 215,988 4.8% 5,915 0 0 $12.79
Erie 416 2,812,265 148,838 148,838 5.3% (19,882) 0 0 $9.68
Evansville 368 3,289,325 134,206 135,887 4.1% 37,136 0 0 $10.50
Fayetteville 452 1,849,522 96,197 96,197 5.2% 22,808 0 0 $12.56
Fayetteville. 668 3,847,803 215,435 216,235 5.6% (33,259) 0 0 $14.44
Fort Smith 234 1,292,223 47,726 47,726 3.7% (23,802) 0 0 $9.20
Fort Wayne 677 5,871,017 195,762 196,362 3.3% (31,539) 0 0 $12.06
Fresno 1,958 16,113,542 1,000,628 1,024,297 6.4% 19,656 0 0 $14.32
Green Bay 455 3,545,367 264,947 264,947 7.5% 29,401 0 0 $9.19
Source: CoStar Property®
Existing Inventory Vacancy
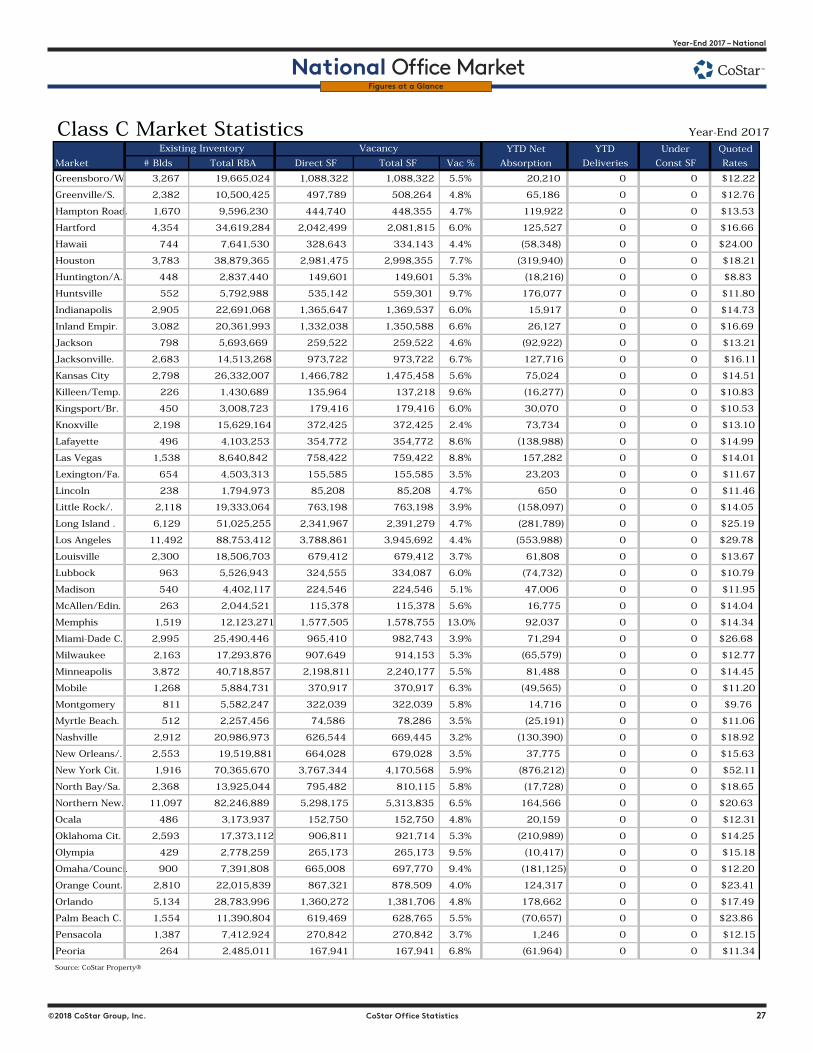
26 CoStar Office Statistics ©2018 CoStar Group, Inc.
National � Year-End 2017
National Office MarketYear-End 2017 – National
National Office Market
©2018 CoStar Group, Inc. CoStar Office Statistics 27
Figures at a Glance
Class C Market Statistics Year-End 2017
YTD Net YTD Under Quoted
Market # Blds Total RBA Direct SF Total SF Vac % Absorption Deliveries Const SF Rates
Greensboro/W. 3,267 19,665,024 1,088,322 1,088,322 5.5% 20,210 0 0 $12.22
Greenville/S. 2,382 10,500,425 497,789 508,264 4.8% 65,186 0 0 $12.76
Hampton Road. 1,670 9,596,230 444,740 448,355 4.7% 119,922 0 0 $13.53
Hartford 4,354 34,619,284 2,042,499 2,081,815 6.0% 125,527 0 0 $16.66
Hawaii 744 7,641,530 328,643 334,143 4.4% (58,348) 0 0 $24.00
Houston 3,783 38,879,365 2,981,475 2,998,355 7.7% (319,940) 0 0 $18.21
Huntington/A. 448 2,837,440 149,601 149,601 5.3% (18,216) 0 0 $8.83
Huntsville 552 5,792,988 535,142 559,301 9.7% 176,077 0 0 $11.80
Indianapolis 2,905 22,691,068 1,365,647 1,369,537 6.0% 15,917 0 0 $14.73
Inland Empir. 3,082 20,361,993 1,332,038 1,350,588 6.6% 26,127 0 0 $16.69
Jackson 798 5,693,669 259,522 259,522 4.6% (92,922) 0 0 $13.21
Jacksonville. 2,683 14,513,268 973,722 973,722 6.7% 127,716 0 0 $16.11
Kansas City 2,798 26,332,007 1,466,782 1,475,458 5.6% 75,024 0 0 $14.51
Killeen/Temp. 226 1,430,689 135,964 137,218 9.6% (16,277) 0 0 $10.83
Kingsport/Br. 450 3,008,723 179,416 179,416 6.0% 30,070 0 0 $10.53
Knoxville 2,198 15,629,164 372,425 372,425 2.4% 73,734 0 0 $13.10
Lafayette 496 4,103,253 354,772 354,772 8.6% (138,988) 0 0 $14.99
Las Vegas 1,538 8,640,842 758,422 759,422 8.8% 157,282 0 0 $14.01
Lexington/Fa. 654 4,503,313 155,585 155,585 3.5% 23,203 0 0 $11.67
Lincoln 238 1,794,973 85,208 85,208 4.7% 650 0 0 $11.46
Little Rock/. 2,118 19,333,064 763,198 763,198 3.9% (158,097) 0 0 $14.05
Long Island . 6,129 51,025,255 2,341,967 2,391,279 4.7% (281,789) 0 0 $25.19
Los Angeles 11,492 88,753,412 3,788,861 3,945,692 4.4% (553,988) 0 0 $29.78
Louisville 2,300 18,506,703 679,412 679,412 3.7% 61,808 0 0 $13.67
Lubbock 963 5,526,943 324,555 334,087 6.0% (74,732) 0 0 $10.79
Madison 540 4,402,117 224,546 224,546 5.1% 47,006 0 0 $11.95
McAllen/Edin. 263 2,044,521 115,378 115,378 5.6% 16,775 0 0 $14.04
Memphis 1,519 12,123,271 1,577,505 1,578,755 13.0% 92,037 0 0 $14.34
Miami-Dade C. 2,995 25,490,446 965,410 982,743 3.9% 71,294 0 0 $26.68
Milwaukee 2,163 17,293,876 907,649 914,153 5.3% (65,579) 0 0 $12.77
Minneapolis 3,872 40,718,857 2,198,811 2,240,177 5.5% 81,488 0 0 $14.45
Mobile 1,268 5,884,731 370,917 370,917 6.3% (49,565) 0 0 $11.20
Montgomery 811 5,582,247 322,039 322,039 5.8% 14,716 0 0 $9.76
Myrtle Beach. 512 2,257,456 74,586 78,286 3.5% (25,191) 0 0 $11.06
Nashville 2,912 20,986,973 626,544 669,445 3.2% (130,390) 0 0 $18.92
New Orleans/. 2,553 19,519,881 664,028 679,028 3.5% 37,775 0 0 $15.63
New York Cit. 1,916 70,365,670 3,767,344 4,170,568 5.9% (876,212) 0 0 $52.11
North Bay/Sa. 2,368 13,925,044 795,482 810,115 5.8% (17,728) 0 0 $18.65
Northern New. 11,097 82,246,889 5,298,175 5,313,835 6.5% 164,566 0 0 $20.63
Ocala 486 3,173,937 152,750 152,750 4.8% 20,159 0 0 $12.31
Oklahoma Cit. 2,593 17,373,112 906,811 921,714 5.3% (210,989) 0 0 $14.25
Olympia 429 2,778,259 265,173 265,173 9.5% (10,417) 0 0 $15.18
Omaha/Counci. 900 7,391,808 665,008 697,770 9.4% (181,125) 0 0 $12.20
Orange Count. 2,810 22,015,839 867,321 878,509 4.0% 124,317 0 0 $23.41
Orlando 5,134 28,783,996 1,360,272 1,381,706 4.8% 178,662 0 0 $17.49
Palm Beach C. 1,554 11,390,804 619,469 628,765 5.5% (70,657) 0 0 $23.86
Pensacola 1,387 7,412,924 270,842 270,842 3.7% 1,246 0 0 $12.15
Peoria 264 2,485,011 167,941 167,941 6.8% (61,964) 0 0 $11.34
Source: CoStar Property®
Existing Inventory Vacancy
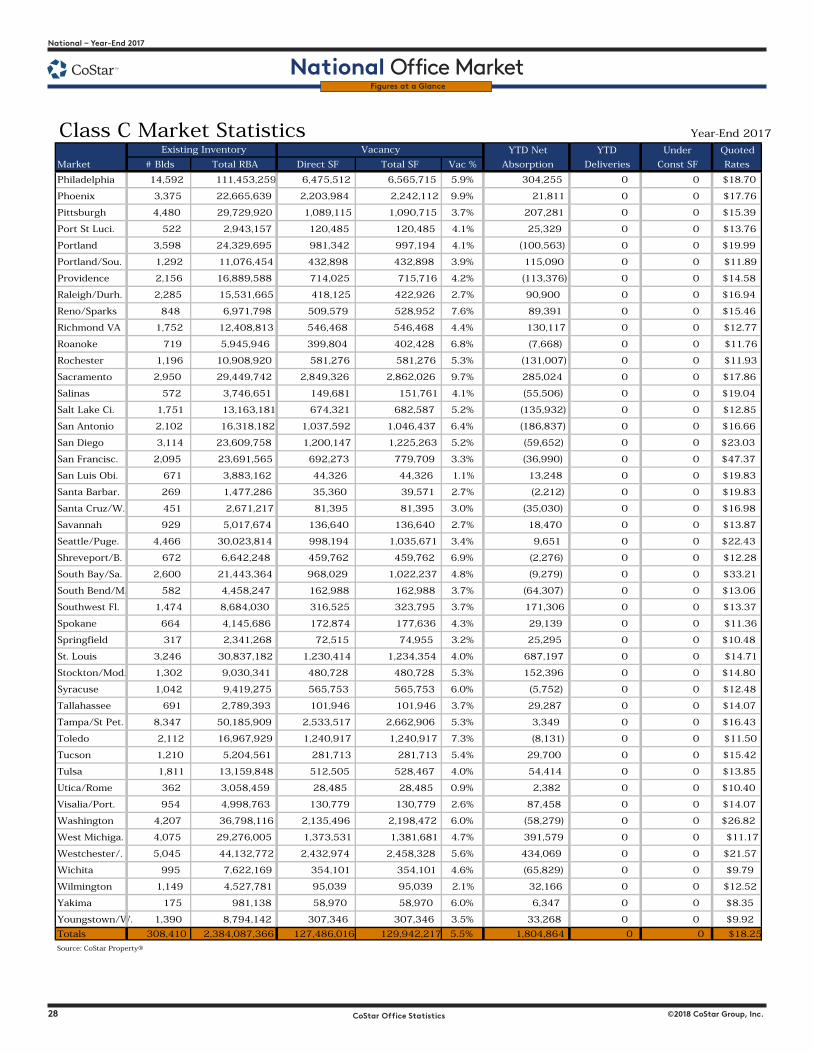
28 CoStar Office Statistics ©2018 CoStar Group, Inc.
National � Year-End 2017
National Office MarketYear-End 2017 – National
National Office Market
©2018 CoStar Group, Inc. CoStar Office Statistics 29
Figures at a Glance
Class C Market Statistics Year-End 2017
YTD Net YTD Under Quoted
Market # Blds Total RBA Direct SF Total SF Vac % Absorption Deliveries Const SF Rates
Philadelphia 14,592 111,453,259 6,475,512 6,565,715 5.9% 304,255 0 0 $18.70
Phoenix 3,375 22,665,639 2,203,984 2,242,112 9.9% 21,811 0 0 $17.76
Pittsburgh 4,480 29,729,920 1,089,115 1,090,715 3.7% 207,281 0 0 $15.39
Port St Luci. 522 2,943,157 120,485 120,485 4.1% 25,329 0 0 $13.76
Portland 3,598 24,329,695 981,342 997,194 4.1% (100,563) 0 0 $19.99
Portland/Sou. 1,292 11,076,454 432,898 432,898 3.9% 115,090 0 0 $11.89
Providence 2,156 16,889,588 714,025 715,716 4.2% (113,376) 0 0 $14.58
Raleigh/Durh. 2,285 15,531,665 418,125 422,926 2.7% 90,900 0 0 $16.94
Reno/Sparks 848 6,971,798 509,579 528,952 7.6% 89,391 0 0 $15.46
Richmond VA 1,752 12,408,813 546,468 546,468 4.4% 130,117 0 0 $12.77
Roanoke 719 5,945,946 399,804 402,428 6.8% (7,668) 0 0 $11.76
Rochester 1,196 10,908,920 581,276 581,276 5.3% (131,007) 0 0 $11.93
Sacramento 2,950 29,449,742 2,849,326 2,862,026 9.7% 285,024 0 0 $17.86
Salinas 572 3,746,651 149,681 151,761 4.1% (55,506) 0 0 $19.04
Salt Lake Ci. 1,751 13,163,181 674,321 682,587 5.2% (135,932) 0 0 $12.85
San Antonio 2,102 16,318,182 1,037,592 1,046,437 6.4% (186,837) 0 0 $16.66
San Diego 3,114 23,609,758 1,200,147 1,225,263 5.2% (59,652) 0 0 $23.03
San Francisc. 2,095 23,691,565 692,273 779,709 3.3% (36,990) 0 0 $47.37
San Luis Obi. 671 3,883,162 44,326 44,326 1.1% 13,248 0 0 $19.83
Santa Barbar. 269 1,477,286 35,360 39,571 2.7% (2,212) 0 0 $19.83
Santa Cruz/W. 451 2,671,217 81,395 81,395 3.0% (35,030) 0 0 $16.98
Savannah 929 5,017,674 136,640 136,640 2.7% 18,470 0 0 $13.87
Seattle/Puge. 4,466 30,023,814 998,194 1,035,671 3.4% 9,651 0 0 $22.43
Shreveport/B. 672 6,642,248 459,762 459,762 6.9% (2,276) 0 0 $12.28
South Bay/Sa. 2,600 21,443,364 968,029 1,022,237 4.8% (9,279) 0 0 $33.21
South Bend/M. 582 4,458,247 162,988 162,988 3.7% (64,307) 0 0 $13.06
Southwest Fl. 1,474 8,684,030 316,525 323,795 3.7% 171,306 0 0 $13.37
Spokane 664 4,145,686 172,874 177,636 4.3% 29,139 0 0 $11.36
Springfield 317 2,341,268 72,515 74,955 3.2% 25,295 0 0 $10.48
St. Louis 3,246 30,837,182 1,230,414 1,234,354 4.0% 687,197 0 0 $14.71
Stockton/Mod. 1,302 9,030,341 480,728 480,728 5.3% 152,396 0 0 $14.80
Syracuse 1,042 9,419,275 565,753 565,753 6.0% (5,752) 0 0 $12.48
Tallahassee 691 2,789,393 101,946 101,946 3.7% 29,287 0 0 $14.07
Tampa/St Pet. 8,347 50,185,909 2,533,517 2,662,906 5.3% 3,349 0 0 $16.43
Toledo 2,112 16,967,929 1,240,917 1,240,917 7.3% (8,131) 0 0 $11.50
Tucson 1,210 5,204,561 281,713 281,713 5.4% 29,700 0 0 $15.42
Tulsa 1,811 13,159,848 512,505 528,467 4.0% 54,414 0 0 $13.85
Utica/Rome 362 3,058,459 28,485 28,485 0.9% 2,382 0 0 $10.40
Visalia/Port. 954 4,998,763 130,779 130,779 2.6% 87,458 0 0 $14.07
Washington 4,207 36,798,116 2,135,496 2,198,472 6.0% (58,279) 0 0 $26.82
West Michiga. 4,075 29,276,005 1,373,531 1,381,681 4.7% 391,579 0 0 $11.17
Westchester/. 5,045 44,132,772 2,432,974 2,458,328 5.6% 434,069 0 0 $21.57
Wichita 995 7,622,169 354,101 354,101 4.6% (65,829) 0 0 $9.79
Wilmington 1,149 4,527,781 95,039 95,039 2.1% 32,166 0 0 $12.52
Yakima 175 981,138 58,970 58,970 6.0% 6,347 0 0 $8.35
Youngstown/W. 1,390 8,794,142 307,346 307,346 3.5% 33,268 0 0 $9.92
Totals 308,410 2,384,087,366 127,486,016 129,942,217 5.5% 1,804,864 0 0 $18.25
Source: CoStar Property®
Existing Inventory Vacancy
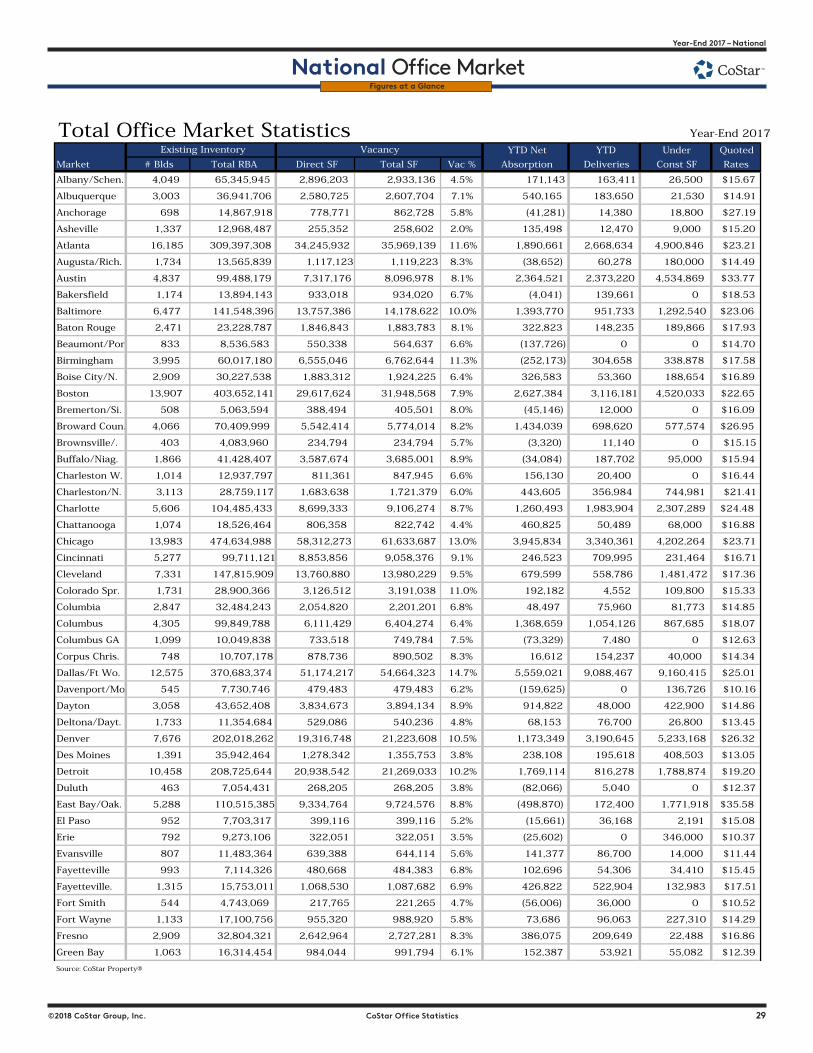
28 CoStar Office Statistics ©2018 CoStar Group, Inc.
National � Year-End 2017
National Office MarketYear-End 2017 – National
National Office Market
©2018 CoStar Group, Inc. CoStar Office Statistics 29
Figures at a Glance
Total Office Market Statistics Year-End 2017
YTD Net YTD Under Quoted
Market # Blds Total RBA Direct SF Total SF Vac % Absorption Deliveries Const SF Rates
Albany/Schen. 4,049 65,345,945 2,896,203 2,933,136 4.5% 171,143 163,411 26,500 $15.67
Albuquerque 3,003 36,941,706 2,580,725 2,607,704 7.1% 540,165 183,650 21,530 $14.91
Anchorage 698 14,867,918 778,771 862,728 5.8% (41,281) 14,380 18,800 $27.19
Asheville 1,337 12,968,487 255,352 258,602 2.0% 135,498 12,470 9,000 $15.20
Atlanta 16,185 309,397,308 34,245,932 35,969,139 11.6% 1,890,661 2,668,634 4,900,846 $23.21
Augusta/Rich. 1,734 13,565,839 1,117,123 1,119,223 8.3% (38,652) 60,278 180,000 $14.49
Austin 4,837 99,488,179 7,317,176 8,096,978 8.1% 2,364,521 2,373,220 4,534,869 $33.77
Bakersfield 1,174 13,894,143 933,018 934,020 6.7% (4,041) 139,661 0 $18.53
Baltimore 6,477 141,548,396 13,757,386 14,178,622 10.0% 1,393,770 951,733 1,292,540 $23.06
Baton Rouge 2,471 23,228,787 1,846,843 1,883,783 8.1% 322,823 148,235 189,866 $17.93
Beaumont/Por. 833 8,536,583 550,338 564,637 6.6% (137,726) 0 0 $14.70
Birmingham 3,995 60,017,180 6,555,046 6,762,644 11.3% (252,173) 304,658 338,878 $17.58
Boise City/N. 2,909 30,227,538 1,883,312 1,924,225 6.4% 326,583 53,360 188,654 $16.89
Boston 13,907 403,652,141 29,617,624 31,948,568 7.9% 2,627,384 3,116,181 4,520,033 $22.65
Bremerton/Si. 508 5,063,594 388,494 405,501 8.0% (45,146) 12,000 0 $16.09
Broward Coun. 4,066 70,409,999 5,542,414 5,774,014 8.2% 1,434,039 698,620 577,574 $26.95
Brownsville/. 403 4,083,960 234,794 234,794 5.7% (3,320) 11,140 0 $15.15
Buffalo/Niag. 1,866 41,428,407 3,587,674 3,685,001 8.9% (34,084) 187,702 95,000 $15.94
Charleston W. 1,014 12,937,797 811,361 847,945 6.6% 156,130 20,400 0 $16.44
Charleston/N. 3,113 28,759,117 1,683,638 1,721,379 6.0% 443,605 356,984 744,981 $21.41
Charlotte 5,606 104,485,433 8,699,333 9,106,274 8.7% 1,260,493 1,983,904 2,307,289 $24.48
Chattanooga 1,074 18,526,464 806,358 822,742 4.4% 460,825 50,489 68,000 $16.88
Chicago 13,983 474,634,988 58,312,273 61,633,687 13.0% 3,945,834 3,340,361 4,202,264 $23.71
Cincinnati 5,277 99,711,121 8,853,856 9,058,376 9.1% 246,523 709,995 231,464 $16.71
Cleveland 7,331 147,815,909 13,760,880 13,980,229 9.5% 679,599 558,786 1,481,472 $17.36
Colorado Spr. 1,731 28,900,366 3,126,512 3,191,038 11.0% 192,182 4,552 109,800 $15.33
Columbia 2,847 32,484,243 2,054,820 2,201,201 6.8% 48,497 75,960 81,773 $14.85
Columbus 4,305 99,849,788 6,111,429 6,404,274 6.4% 1,368,659 1,054,126 867,685 $18.07
Columbus GA 1,099 10,049,838 733,518 749,784 7.5% (73,329) 7,480 0 $12.63
Corpus Chris. 748 10,707,178 878,736 890,502 8.3% 16,612 154,237 40,000 $14.34
Dallas/Ft Wo. 12,575 370,683,374 51,174,217 54,664,323 14.7% 5,559,021 9,088,467 9,160,415 $25.01
Davenport/Mo. 545 7,730,746 479,483 479,483 6.2% (159,625) 0 136,726 $10.16
Dayton 3,058 43,652,408 3,834,673 3,894,134 8.9% 914,822 48,000 422,900 $14.86
Deltona/Dayt. 1,733 11,354,684 529,086 540,236 4.8% 68,153 76,700 26,800 $13.45
Denver 7,676 202,018,262 19,316,748 21,223,608 10.5% 1,173,349 3,190,645 5,233,168 $26.32
Des Moines 1,391 35,942,464 1,278,342 1,355,753 3.8% 238,108 195,618 408,503 $13.05
Detroit 10,458 208,725,644 20,938,542 21,269,033 10.2% 1,769,114 816,278 1,788,874 $19.20
Duluth 463 7,054,431 268,205 268,205 3.8% (82,066) 5,040 0 $12.37
East Bay/Oak. 5,288 110,515,385 9,334,764 9,724,576 8.8% (498,870) 172,400 1,771,918 $35.58
El Paso 952 7,703,317 399,116 399,116 5.2% (15,661) 36,168 2,191 $15.08
Erie 792 9,273,106 322,051 322,051 3.5% (25,602) 0 346,000 $10.37
Evansville 807 11,483,364 639,388 644,114 5.6% 141,377 86,700 14,000 $11.44
Fayetteville 993 7,114,326 480,668 484,383 6.8% 102,696 54,306 34,410 $15.45
Fayetteville. 1,315 15,753,011 1,068,530 1,087,682 6.9% 426,822 522,904 132,983 $17.51
Fort Smith 544 4,743,069 217,765 221,265 4.7% (56,006) 36,000 0 $10.52
Fort Wayne 1,133 17,100,756 955,320 988,920 5.8% 73,686 96,063 227,310 $14.29
Fresno 2,909 32,804,321 2,642,964 2,727,281 8.3% 386,075 209,649 22,488 $16.86
Green Bay 1,063 16,314,454 984,044 991,794 6.1% 152,387 53,921 55,082 $12.39
Source: CoStar Property®
Existing Inventory Vacancy
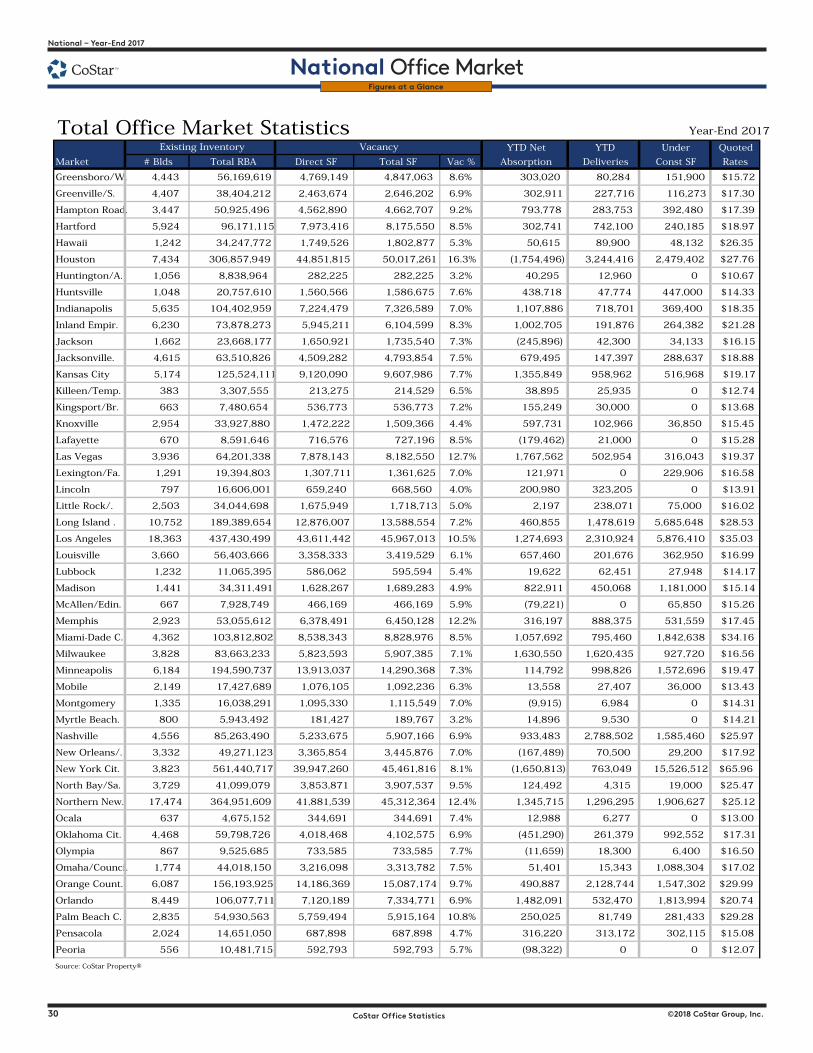
30 CoStar Office Statistics ©2018 CoStar Group, Inc.
National � Year-End 2017
National Office MarketYear-End 2017 – National
National Office Market
©2018 CoStar Group, Inc. CoStar Office Statistics 31
Figures at a Glance
Total Office Market Statistics Year-End 2017
YTD Net YTD Under Quoted
Market # Blds Total RBA Direct SF Total SF Vac % Absorption Deliveries Const SF Rates
Greensboro/W. 4,443 56,169,619 4,769,149 4,847,063 8.6% 303,020 80,284 151,900 $15.72
Greenville/S. 4,407 38,404,212 2,463,674 2,646,202 6.9% 302,911 227,716 116,273 $17.30
Hampton Road. 3,447 50,925,496 4,562,890 4,662,707 9.2% 793,778 283,753 392,480 $17.39
Hartford 5,924 96,171,115 7,973,416 8,175,550 8.5% 302,741 742,100 240,185 $18.97
Hawaii 1,242 34,247,772 1,749,526 1,802,877 5.3% 50,615 89,900 48,132 $26.35
Houston 7,434 306,857,949 44,851,815 50,017,261 16.3% (1,754,496) 3,244,416 2,479,402 $27.76
Huntington/A. 1,056 8,838,964 282,225 282,225 3.2% 40,295 12,960 0 $10.67
Huntsville 1,048 20,757,610 1,560,566 1,586,675 7.6% 438,718 47,774 447,000 $14.33
Indianapolis 5,635 104,402,959 7,224,479 7,326,589 7.0% 1,107,886 718,701 369,400 $18.35
Inland Empir. 6,230 73,878,273 5,945,211 6,104,599 8.3% 1,002,705 191,876 264,382 $21.28
Jackson 1,662 23,668,177 1,650,921 1,735,540 7.3% (245,896) 42,300 34,133 $16.15
Jacksonville. 4,615 63,510,826 4,509,282 4,793,854 7.5% 679,495 147,397 288,637 $18.88
Kansas City 5,174 125,524,111 9,120,090 9,607,986 7.7% 1,355,849 958,962 516,968 $19.17
Killeen/Temp. 383 3,307,555 213,275 214,529 6.5% 38,895 25,935 0 $12.74
Kingsport/Br. 663 7,480,654 536,773 536,773 7.2% 155,249 30,000 0 $13.68
Knoxville 2,954 33,927,880 1,472,222 1,509,366 4.4% 597,731 102,966 36,850 $15.45
Lafayette 670 8,591,646 716,576 727,196 8.5% (179,462) 21,000 0 $15.28
Las Vegas 3,936 64,201,338 7,878,143 8,182,550 12.7% 1,767,562 502,954 316,043 $19.37
Lexington/Fa. 1,291 19,394,803 1,307,711 1,361,625 7.0% 121,971 0 229,906 $16.58
Lincoln 797 16,606,001 659,240 668,560 4.0% 200,980 323,205 0 $13.91
Little Rock/. 2,503 34,044,698 1,675,949 1,718,713 5.0% 2,197 238,071 75,000 $16.02
Long Island . 10,752 189,389,654 12,876,007 13,588,554 7.2% 460,855 1,478,619 5,685,648 $28.53
Los Angeles 18,363 437,430,499 43,611,442 45,967,013 10.5% 1,274,693 2,310,924 5,876,410 $35.03
Louisville 3,660 56,403,666 3,358,333 3,419,529 6.1% 657,460 201,676 362,950 $16.99
Lubbock 1,232 11,065,395 586,062 595,594 5.4% 19,622 62,451 27,948 $14.17
Madison 1,441 34,311,491 1,628,267 1,689,283 4.9% 822,911 450,068 1,181,000 $15.14
McAllen/Edin. 667 7,928,749 466,169 466,169 5.9% (79,221) 0 65,850 $15.26
Memphis 2,923 53,055,612 6,378,491 6,450,128 12.2% 316,197 888,375 531,559 $17.45
Miami-Dade C. 4,362 103,812,802 8,538,343 8,828,976 8.5% 1,057,692 795,460 1,842,638 $34.16
Milwaukee 3,828 83,663,233 5,823,593 5,907,385 7.1% 1,630,550 1,620,435 927,720 $16.56
Minneapolis 6,184 194,590,737 13,913,037 14,290,368 7.3% 114,792 998,826 1,572,696 $19.47
Mobile 2,149 17,427,689 1,076,105 1,092,236 6.3% 13,558 27,407 36,000 $13.43
Montgomery 1,335 16,038,291 1,095,330 1,115,549 7.0% (9,915) 6,984 0 $14.31
Myrtle Beach. 800 5,943,492 181,427 189,767 3.2% 14,896 9,530 0 $14.21
Nashville 4,556 85,263,490 5,233,675 5,907,166 6.9% 933,483 2,788,502 1,585,460 $25.97
New Orleans/. 3,332 49,271,123 3,365,854 3,445,876 7.0% (167,489) 70,500 29,200 $17.92
New York Cit. 3,823 561,440,717 39,947,260 45,461,816 8.1% (1,650,813) 763,049 15,526,512 $65.96
North Bay/Sa. 3,729 41,099,079 3,853,871 3,907,537 9.5% 124,492 4,315 19,000 $25.47
Northern New. 17,474 364,951,609 41,881,539 45,312,364 12.4% 1,345,715 1,296,295 1,906,627 $25.12
Ocala 637 4,675,152 344,691 344,691 7.4% 12,988 6,277 0 $13.00
Oklahoma Cit. 4,468 59,798,726 4,018,468 4,102,575 6.9% (451,290) 261,379 992,552 $17.31
Olympia 867 9,525,685 733,585 733,585 7.7% (11,659) 18,300 6,400 $16.50
Omaha/Counci. 1,774 44,018,150 3,216,098 3,313,782 7.5% 51,401 15,343 1,088,304 $17.02
Orange Count. 6,087 156,193,925 14,186,369 15,087,174 9.7% 490,887 2,128,744 1,547,302 $29.99
Orlando 8,449 106,077,711 7,120,189 7,334,771 6.9% 1,482,091 532,470 1,813,994 $20.74
Palm Beach C. 2,835 54,930,563 5,759,494 5,915,164 10.8% 250,025 81,749 281,433 $29.28
Pensacola 2,024 14,651,050 687,898 687,898 4.7% 316,220 313,172 302,115 $15.08
Peoria 556 10,481,715 592,793 592,793 5.7% (98,322) 0 0 $12.07
Source: CoStar Property®
Existing Inventory Vacancy
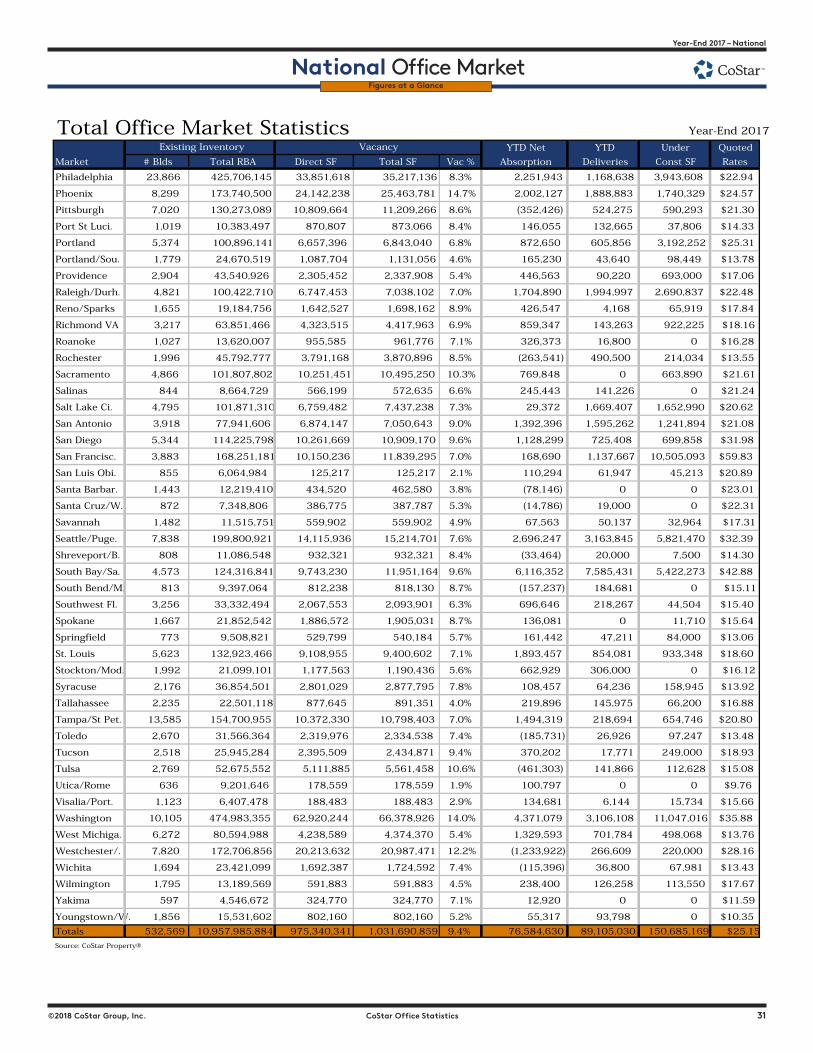
30 CoStar Office Statistics ©2018 CoStar Group, Inc.
National � Year-End 2017
National Office MarketYear-End 2017 – National
National Office Market
©2018 CoStar Group, Inc. CoStar Office Statistics 31
Figures at a Glance
Total Office Market Statistics Year-End 2017
YTD Net YTD Under Quoted
Market # Blds Total RBA Direct SF Total SF Vac % Absorption Deliveries Const SF Rates
Philadelphia 23,866 425,706,145 33,851,618 35,217,136 8.3% 2,251,943 1,168,638 3,943,608 $22.94
Phoenix 8,299 173,740,500 24,142,238 25,463,781 14.7% 2,002,127 1,888,883 1,740,329 $24.57
Pittsburgh 7,020 130,273,089 10,809,664 11,209,266 8.6% (352,426) 524,275 590,293 $21.30
Port St Luci. 1,019 10,383,497 870,807 873,066 8.4% 146,055 132,665 37,806 $14.33
Portland 5,374 100,896,141 6,657,396 6,843,040 6.8% 872,650 605,856 3,192,252 $25.31
Portland/Sou. 1,779 24,670,519 1,087,704 1,131,056 4.6% 165,230 43,640 98,449 $13.78
Providence 2,904 43,540,926 2,305,452 2,337,908 5.4% 446,563 90,220 693,000 $17.06
Raleigh/Durh. 4,821 100,422,710 6,747,453 7,038,102 7.0% 1,704,890 1,994,997 2,690,837 $22.48
Reno/Sparks 1,655 19,184,756 1,642,527 1,698,162 8.9% 426,547 4,168 65,919 $17.84
Richmond VA 3,217 63,851,466 4,323,515 4,417,963 6.9% 859,347 143,263 922,225 $18.16
Roanoke 1,027 13,620,007 955,585 961,776 7.1% 326,373 16,800 0 $16.28
Rochester 1,996 45,792,777 3,791,168 3,870,896 8.5% (263,541) 490,500 214,034 $13.55
Sacramento 4,866 101,807,802 10,251,451 10,495,250 10.3% 769,848 0 663,890 $21.61
Salinas 844 8,664,729 566,199 572,635 6.6% 245,443 141,226 0 $21.24
Salt Lake Ci. 4,795 101,871,310 6,759,482 7,437,238 7.3% 29,372 1,669,407 1,652,990 $20.62
San Antonio 3,918 77,941,606 6,874,147 7,050,643 9.0% 1,392,396 1,595,262 1,241,894 $21.08
San Diego 5,344 114,225,798 10,261,669 10,909,170 9.6% 1,128,299 725,408 699,858 $31.98
San Francisc. 3,883 168,251,181 10,150,236 11,839,295 7.0% 168,690 1,137,667 10,505,093 $59.83
San Luis Obi. 855 6,064,984 125,217 125,217 2.1% 110,294 61,947 45,213 $20.89
Santa Barbar. 1,443 12,219,410 434,520 462,580 3.8% (78,146) 0 0 $23.01
Santa Cruz/W. 872 7,348,806 386,775 387,787 5.3% (14,786) 19,000 0 $22.31
Savannah 1,482 11,515,751 559,902 559,902 4.9% 67,563 50,137 32,964 $17.31
Seattle/Puge. 7,838 199,800,921 14,115,936 15,214,701 7.6% 2,696,247 3,163,845 5,821,470 $32.39
Shreveport/B. 808 11,086,548 932,321 932,321 8.4% (33,464) 20,000 7,500 $14.30
South Bay/Sa. 4,573 124,316,841 9,743,230 11,951,164 9.6% 6,116,352 7,585,431 5,422,273 $42.88
South Bend/M. 813 9,397,064 812,238 818,130 8.7% (157,237) 184,681 0 $15.11
Southwest Fl. 3,256 33,332,494 2,067,553 2,093,901 6.3% 696,646 218,267 44,504 $15.40
Spokane 1,667 21,852,542 1,886,572 1,905,031 8.7% 136,081 0 11,710 $15.64
Springfield 773 9,508,821 529,799 540,184 5.7% 161,442 47,211 84,000 $13.06
St. Louis 5,623 132,923,466 9,108,955 9,400,602 7.1% 1,893,457 854,081 933,348 $18.60
Stockton/Mod. 1,992 21,099,101 1,177,563 1,190,436 5.6% 662,929 306,000 0 $16.12
Syracuse 2,176 36,854,501 2,801,029 2,877,795 7.8% 108,457 64,236 158,945 $13.92
Tallahassee 2,235 22,501,118 877,645 891,351 4.0% 219,896 145,975 66,200 $16.88
Tampa/St Pet. 13,585 154,700,955 10,372,330 10,798,403 7.0% 1,494,319 218,694 654,746 $20.80
Toledo 2,670 31,566,364 2,319,976 2,334,538 7.4% (185,731) 26,926 97,247 $13.48
Tucson 2,518 25,945,284 2,395,509 2,434,871 9.4% 370,202 17,771 249,000 $18.93
Tulsa 2,769 52,675,552 5,111,885 5,561,458 10.6% (461,303) 141,866 112,628 $15.08
Utica/Rome 636 9,201,646 178,559 178,559 1.9% 100,797 0 0 $9.76
Visalia/Port. 1,123 6,407,478 188,483 188,483 2.9% 134,681 6,144 15,734 $15.66
Washington 10,105 474,983,355 62,920,244 66,378,926 14.0% 4,371,079 3,106,108 11,047,016 $35.88
West Michiga. 6,272 80,594,988 4,238,589 4,374,370 5.4% 1,329,593 701,784 498,068 $13.76
Westchester/. 7,820 172,706,856 20,213,632 20,987,471 12.2% (1,233,922) 266,609 220,000 $28.16
Wichita 1,694 23,421,099 1,692,387 1,724,592 7.4% (115,396) 36,800 67,981 $13.43
Wilmington 1,795 13,189,569 591,883 591,883 4.5% 238,400 126,258 113,550 $17.67
Yakima 597 4,546,672 324,770 324,770 7.1% 12,920 0 0 $11.59
Youngstown/W. 1,856 15,531,602 802,160 802,160 5.2% 55,317 93,798 0 $10.35
Totals 532,569 10,957,985,884 975,340,341 1,031,690,859 9.4% 76,584,630 89,105,030 150,685,169 $25.15
Source: CoStar Property®
Existing Inventory Vacancy
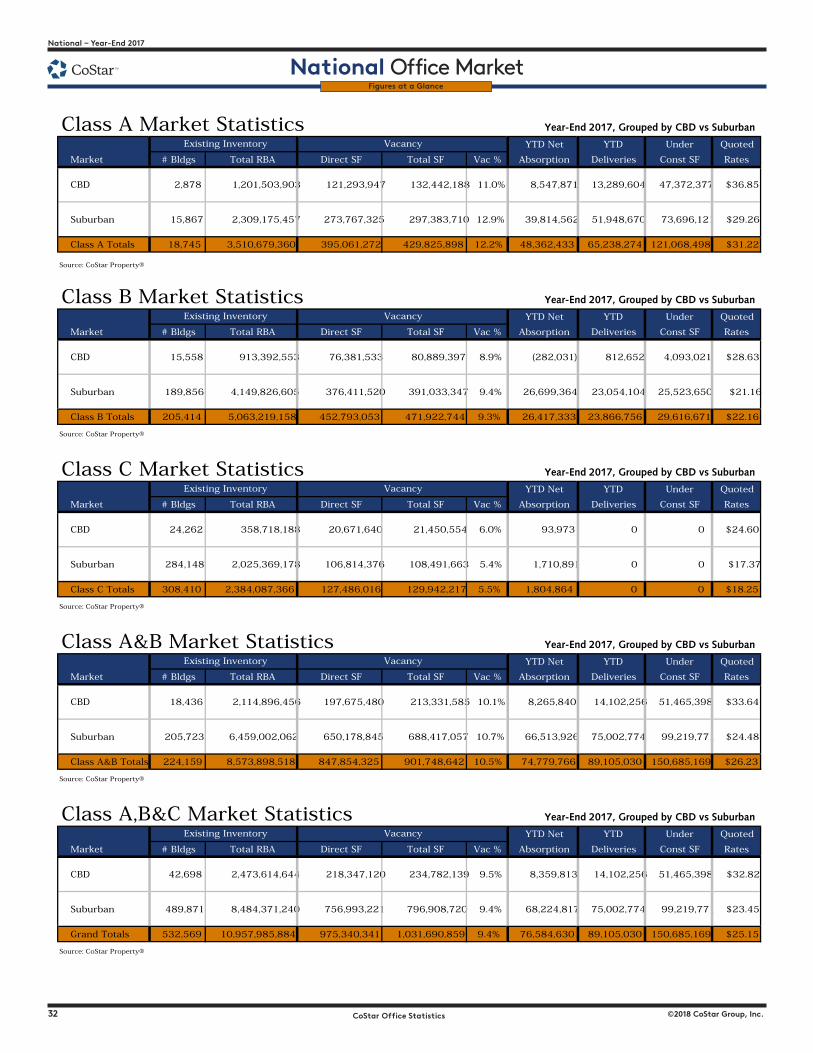
32 CoStar Office Statistics ©2018 CoStar Group, Inc.
National � Year-End 2017
National Office MarketYear-End 2017 – National
National Office Market
©2018 CoStar Group, Inc. CoStar Office Statistics 33
Figures at a Glance
Class A Market Statistics Year-End 2017, Grouped by CBD vs Suburban
YTD Net YTD Under Quoted
Market # Bldgs Total RBA Direct SF Total SF Vac % Absorption Deliveries Const SF Rates
CBD 2,878 1,201,503,903 121,293,947 132,442,188 11.0% 8,547,871 13,289,604 47,372,377 $36.85
Suburban 15,867 2,309,175,457 273,767,325 297,383,710 12.9% 39,814,562 51,948,670 73,696,121 $29.26
Class A Totals 18,745 3,510,679,360 395,061,272 429,825,898 12.2% 48,362,433 65,238,274 121,068,498 $31.22
Source: CoStar Property®
Class B Market Statistics Year-End 2017, Grouped by CBD vs Suburban
YTD Net YTD Under Quoted
Market # Bldgs Total RBA Direct SF Total SF Vac % Absorption Deliveries Const SF Rates
CBD 15,558 913,392,553 76,381,533 80,889,397 8.9% (282,031) 812,652 4,093,021 $28.63
Suburban 189,856 4,149,826,605 376,411,520 391,033,347 9.4% 26,699,364 23,054,104 25,523,650 $21.16
Class B Totals 205,414 5,063,219,158 452,793,053 471,922,744 9.3% 26,417,333 23,866,756 29,616,671 $22.16
Source: CoStar Property®
Class C Market Statistics Year-End 2017, Grouped by CBD vs Suburban
YTD Net YTD Under Quoted
Market # Bldgs Total RBA Direct SF Total SF Vac % Absorption Deliveries Const SF Rates
CBD 24,262 358,718,188 20,671,640 21,450,554 6.0% 93,973 0 0 $24.60
Suburban 284,148 2,025,369,178 106,814,376 108,491,663 5.4% 1,710,891 0 0 $17.37
Class C Totals 308,410 2,384,087,366 127,486,016 129,942,217 5.5% 1,804,864 0 0 $18.25
Source: CoStar Property®
Class A&B Market Statistics Year-End 2017, Grouped by CBD vs Suburban
YTD Net YTD Under Quoted
Market # Bldgs Total RBA Direct SF Total SF Vac % Absorption Deliveries Const SF Rates
CBD 18,436 2,114,896,456 197,675,480 213,331,585 10.1% 8,265,840 14,102,256 51,465,398 $33.64
Suburban 205,723 6,459,002,062 650,178,845 688,417,057 10.7% 66,513,926 75,002,774 99,219,771 $24.48
Class A&B Totals 224,159 8,573,898,518 847,854,325 901,748,642 10.5% 74,779,766 89,105,030 150,685,169 $26.23
Source: CoStar Property®
Class A,B&C Market Statistics Year-End 2017, Grouped by CBD vs Suburban
YTD Net YTD Under Quoted
Market # Bldgs Total RBA Direct SF Total SF Vac % Absorption Deliveries Const SF Rates
CBD 42,698 2,473,614,644 218,347,120 234,782,139 9.5% 8,359,813 14,102,256 51,465,398 $32.82
Suburban 489,871 8,484,371,240 756,993,221 796,908,720 9.4% 68,224,817 75,002,774 99,219,771 $23.45
Grand Totals 532,569 10,957,985,884 975,340,341 1,031,690,859 9.4% 76,584,630 89,105,030 150,685,169 $25.15
Source: CoStar Property®
Existing Inventory Vacancy
Existing Inventory Vacancy
Existing Inventory Vacancy
Existing Inventory Vacancy
Existing Inventory Vacancy
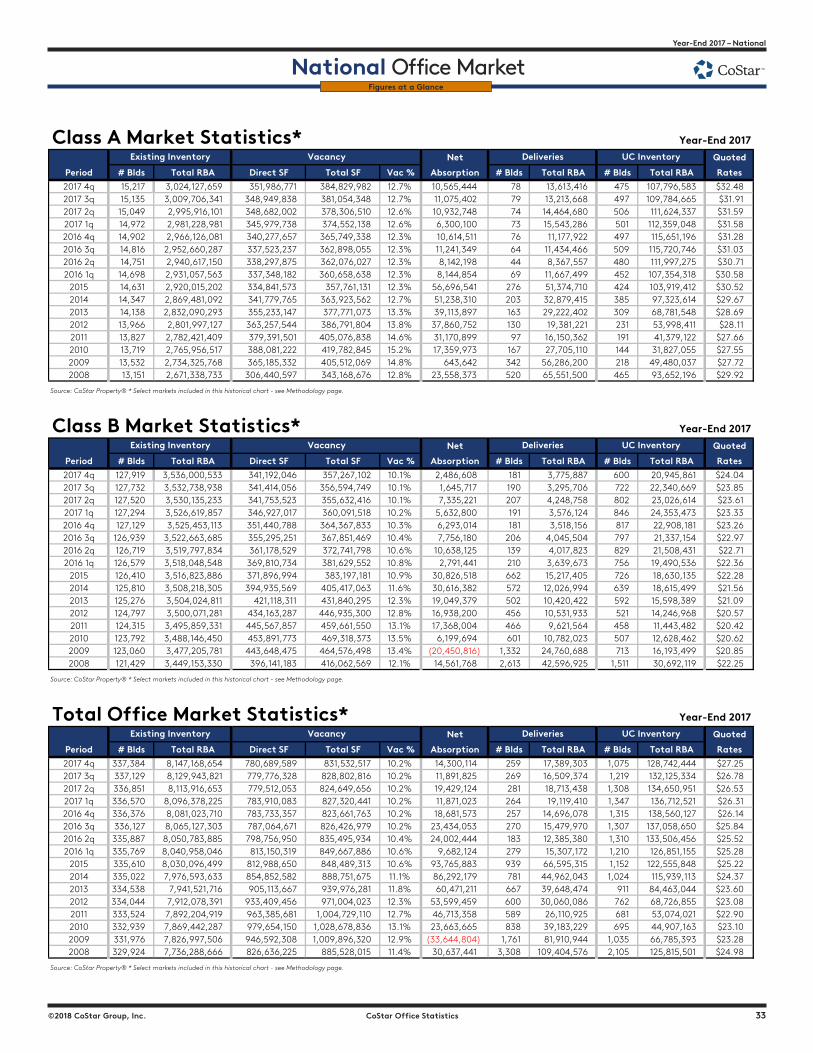
32 CoStar Office Statistics ©2018 CoStar Group, Inc.
National � Year-End 2017
National Office MarketYear-End 2017 – National
National Office Market
©2018 CoStar Group, Inc. CoStar Office Statistics 33
Figures at a Glance
�������������������������� ���������������� ������
������ ������ ��������� ��������� �������� ����� ���������� ������ ��������� ������ ��������� ������������ ������� �������������� ������������ ������������ ������ ������������ ��� ����������� ���� ������������ ���������������� ������� �������������� ������������ ������������ ������ ������������ ��� ����������� ���� ������������ ���������������� ������� �������������� ������������ ������������ ������ ������������ ��� ����������� ���� ������������ ���������������� ������� �������������� ������������ ������������ ������ ����������� ��� ����������� ���� ������������ ���������������� ������� �������������� ������������ ������������ ������ ������������ ��� ����������� ���� ������������ ���������������� ������� �������������� ������������ ������������ ������ ������������ ��� ����������� ���� ������������ ���������������� ������� �������������� ������������ ������������ ������ ����������� ��� ���������� ���� ������������ ���������������� ������� �������������� ������������ ������������ ������ ����������� ��� ����������� ���� ������������ ������������� ������� �������������� ������������ ������������ ������ ������������ ���� ����������� ���� ������������ ������������� ������� �������������� ������������ ������������ ������ ������������ ���� ����������� ���� ����������� ������������� ������� �������������� ������������ ������������ ������ ������������ ���� ����������� ���� ����������� ������������� ������� �������������� ������������ ������������ ������ ������������ ���� ����������� ���� ����������� ������������� ������� �������������� ������������ ������������ ������ ������������ ��� ����������� ���� ����������� ������������� ������� �������������� ������������ ������������ ������ ������������ ���� ����������� ���� ����������� ������������� ������� �������������� ������������ ������������ ������ ��������� ���� ����������� ���� ����������� ������������� ������� �������������� ������������ ������������ ������ ������������ ���� ����������� ���� ����������� ���������
���������������������������������������������������������������������������������������������������
�������������������������� ���������������� ������
������ ������ ��������� ��������� �������� ����� ���������� ������ ��������� ������ ��������� ������������ �������� �������������� ������������ ������������ ������ ����������� ���� ���������� ���� ����������� ���������������� �������� �������������� ������������ ������������ ������ ����������� ���� ���������� ���� ����������� ���������������� �������� �������������� ������������ ������������ ������ ����������� ���� ���������� ���� ����������� ���������������� �������� �������������� ������������ ������������ ������ ����������� ���� ���������� ���� ����������� ���������������� �������� �������������� ������������ ������������ ������ ����������� ���� ���������� ���� ����������� ���������������� �������� �������������� ������������ ������������ ������ ����������� ���� ���������� ���� ����������� ���������������� �������� �������������� ������������ ������������ ������ ������������ ���� ���������� ���� ����������� ���������������� �������� �������������� ������������ ������������ ������ ����������� ���� ���������� ���� ����������� ������������� �������� �������������� ������������ ������������ ������ ������������ ���� ����������� ���� ����������� ������������� �������� �������������� ������������ ������������ ������ ������������ ���� ����������� ���� ����������� ������������� �������� �������������� ������������ ������������ ������ ������������ ���� ����������� ���� ����������� ������������� �������� �������������� ������������ ������������ ������ ������������ ���� ����������� ���� ����������� ������������� �������� �������������� ������������ ������������ ������ ������������ ���� ���������� ���� ����������� ������������� �������� �������������� ������������ ������������ ������ ����������� ���� ����������� ���� ����������� ������������� �������� �������������� ������������ ������������ ������ �������������� ������ ����������� ���� ����������� ������������� �������� �������������� ������������ ������������ ������ ������������ ������ ����������� ������ ����������� ���������
���������������������������������������������������������������������������������������������������
������������������������������� ���������������� ������
������ ������ ��������� ��������� �������� ����� ���������� ������ ��������� ������ ��������� ������������ �������� �������������� ������������ ������������ ������ ������������ ���� ����������� ������ ������������ ���������������� �������� �������������� ������������ ������������ ������ ������������ ���� ����������� ������ ������������ ���������������� �������� �������������� ������������ ������������ ������ ������������ ���� ����������� ������ ������������ ���������������� �������� �������������� ������������ ������������ ������ ������������ ���� ����������� ������ ������������ ���������������� �������� �������������� ������������ ������������ ������ ������������ ���� ����������� ������ ������������ ���������������� �������� �������������� ������������ ������������ ������ ������������ ���� ����������� ������ ������������ ���������������� �������� �������������� ������������ ������������ ������ ������������ ���� ����������� ������ ������������ ���������������� �������� �������������� ������������ ������������ ������ ����������� ���� ����������� ������ ������������ ������������� �������� �������������� ������������ ������������ ������ ������������ ���� ����������� ������ ������������ ������������� �������� �������������� ������������ ������������ ������ ������������ ���� ����������� ������ ������������ ������������� �������� �������������� ������������ ������������ ������ ������������ ���� ����������� ���� ����������� ������������� �������� �������������� ������������ ������������ ������ ������������ ���� ����������� ���� ����������� ������������� �������� �������������� ������������ �������������� ������ ������������ ���� ����������� ���� ����������� ������������� �������� �������������� ������������ �������������� ������ ������������ ���� ����������� ���� ����������� ������������� �������� �������������� ������������ �������������� ������ �������������� ������ ����������� ������ ����������� ������������� �������� �������������� ������������ ������������ ������ ������������ ������ ������������ ������ ������������ ���������
���������������������������������������������������������������������������������������������������
������������������ ������� ���������� ������������
������������
������������������ ������� ���������� ������������
������������������ ������� ����������
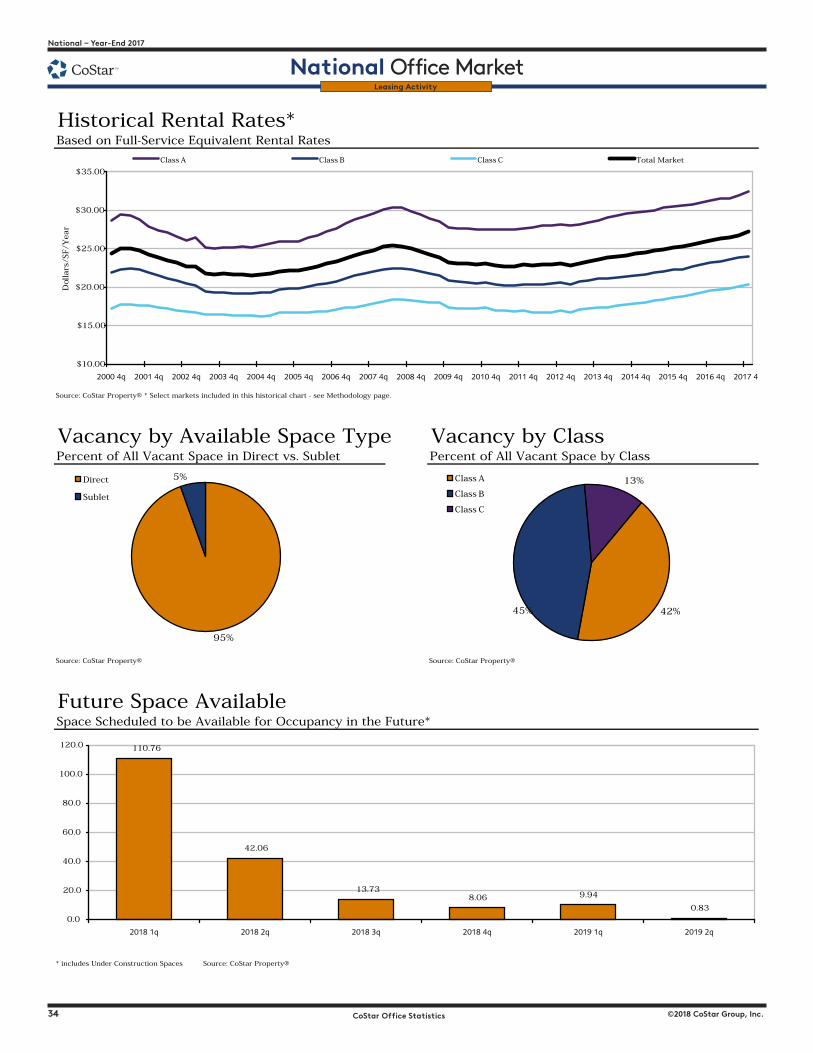
34 CoStar Office Statistics ©2018 CoStar Group, Inc.
National � Year-End 2017
National Office MarketYear-End 2017 – National
National Office Market
©2018 CoStar Group, Inc. CoStar Office Statistics 35
Historical Rental Rates*Based on Full-Service Equivalent Rental Rates
Source: CoStar Property® * Select markets included in this historical chart - see Methodology page.
Vacancy by Available Space Type Vacancy by ClassPercent of All Vacant Space in Direct vs. Sublet Percent of All Vacant Space by Class
Source: CoStar Property® Source: CoStar Property®
Future Space AvailableSpace Scheduled to be Available for Occupancy in the Future*
* includes Under Construction Spaces Source: CoStar Property®
$10.00
$15.00
$20.00
$25.00
$30.00
$35.00
2000 4q 2001 4q 2002 4q 2003 4q 2004 4q 2005 4q 2006 4q 2007 4q 2008 4q 2009 4q 2010 4q 2011 4q 2012 4q 2013 4q 2014 4q 2015 4q 2016 4q 2017 4
Dol
lars
/SF/Y
ear
Class A Class B Class C Total Market
95%
5%Direct
Sublet
42%45%
13%Class A
Class B
Class C
110.76
42.06
13.738.06 9.94
0.83
0.0
20.0
40.0
60.0
80.0
100.0
120.0
2018 1q 2018 2q 2018 3q 2018 4q 2019 1q 2019 2q
Leasing Activity
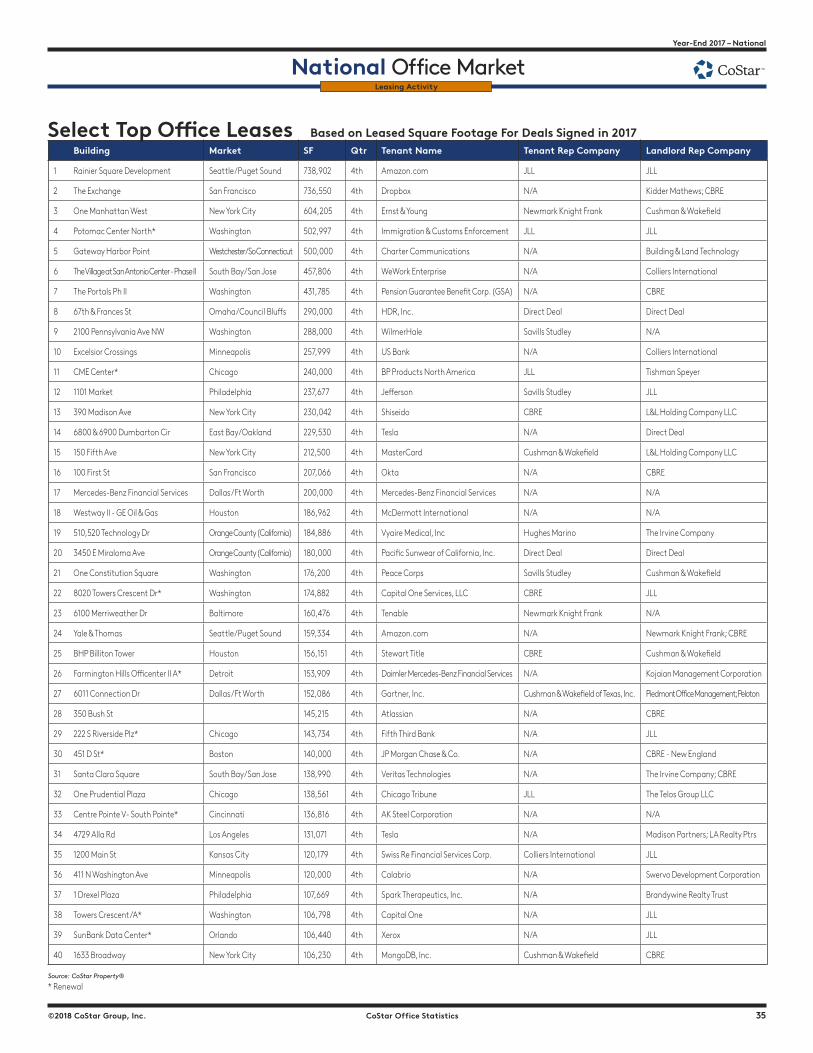
34 CoStar Office Statistics ©2018 CoStar Group, Inc.
National � Year-End 2017
National Office MarketYear-End 2017 – National
National Office Market
©2018 CoStar Group, Inc. CoStar Office Statistics 35
Leasing Activity
Source: CoStar Property®
* Renewal
Building Market SF Qtr Tenant Name Tenant Rep Company Landlord Rep Company
1 Rainier Square Development Seattle/Puget Sound 738,902 4th Amazon.com JLL JLL
2 The Exchange San Francisco 736,550 4th Dropbox N/A Kidder Mathews; CBRE
3 One Manhattan West New York City 604,205 4th Ernst & Young Newmark Knight Frank Cushman & Wake�eld
4 Potomac Center North* Washington 502,997 4th Immigration & Customs Enforcement JLL JLL
5 Gateway Harbor Point Westchester/So Connecticut 500,000 4th Charter Communications N/A Building & Land Technology
6 The Village at San Antonio Center - Phase II South Bay/San Jose 457,806 4th WeWork Enterprise N/A Colliers International
7 The Portals Ph II Washington 431,785 4th Pension Guarantee Bene�t Corp. (GSA) N/A CBRE
8 67th & Frances St Omaha/Council Blu�s 290,000 4th HDR, Inc. Direct Deal Direct Deal
9 2100 Pennsylvania Ave NW Washington 288,000 4th WilmerHale Savills Studley N/A
10 Excelsior Crossings Minneapolis 257,999 4th US Bank N/A Colliers International
11 CME Center* Chicago 240,000 4th BP Products North America JLL Tishman Speyer
12 1101 Market Philadelphia 237,677 4th Je�erson Savills Studley JLL
13 390 Madison Ave New York City 230,042 4th Shiseido CBRE L&L Holding Company LLC
14 6800 & 6900 Dumbarton Cir East Bay/Oakland 229,530 4th Tesla N/A Direct Deal
15 150 Fifth Ave New York City 212,500 4th MasterCard Cushman & Wake�eld L&L Holding Company LLC
16 100 First St San Francisco 207,066 4th Okta N/A CBRE
17 Mercedes-Benz Financial Services Dallas/Ft Worth 200,000 4th Mercedes-Benz Financial Services N/A N/A
18 Westway II - GE Oil & Gas Houston 186,962 4th McDermott International N/A N/A
19 510,520 Technology Dr Orange County (California) 184,886 4th Vyaire Medical, Inc Hughes Marino The Irvine Company
20 3450 E Miraloma Ave Orange County (California) 180,000 4th Paci�c Sunwear of California, Inc. Direct Deal Direct Deal
21 One Constitution Square Washington 176,200 4th Peace Corps Savills Studley Cushman & Wake�eld
22 8020 Towers Crescent Dr* Washington 174,882 4th Capital One Services, LLC CBRE JLL
23 6100 Merriweather Dr Baltimore 160,476 4th Tenable Newmark Knight Frank N/A
24 Yale & Thomas Seattle/Puget Sound 159,334 4th Amazon.com N/A Newmark Knight Frank; CBRE
25 BHP Billiton Tower Houston 156,151 4th Stewart Title CBRE Cushman & Wake�eld
26 Farmington Hills O�center II A* Detroit 153,909 4th Daimler Mercedes-Benz Financial Services N/A Kojaian Management Corporation
27 6011 Connection Dr Dallas/Ft Worth 152,086 4th Gartner, Inc. Cushman & Wake�eld of Texas, Inc. Piedmont Office Management; Peloton
28 350 Bush St 145,215 4th Atlassian N/A CBRE
29 222 S Riverside Plz* Chicago 143,734 4th Fifth Third Bank N/A JLL
30 451 D St* Boston 140,000 4th JP Morgan Chase & Co. N/A CBRE - New England
31 Santa Clara Square South Bay/San Jose 138,990 4th Veritas Technologies N/A The Irvine Company; CBRE
32 One Prudential Plaza Chicago 138,561 4th Chicago Tribune JLL The Telos Group LLC
33 Centre Pointe V- South Pointe* Cincinnati 136,816 4th AK Steel Corporation N/A N/A
34 4729 Alla Rd Los Angeles 131,071 4th Tesla N/A Madison Partners; LA Realty Ptrs
35 1200 Main St Kansas City 120,179 4th Swiss Re Financial Services Corp. Colliers International JLL
36 411 N Washington Ave Minneapolis 120,000 4th Calabrio N/A Swervo Development Corporation
37 1 Drexel Plaza Philadelphia 107,669 4th Spark Therapeutics, Inc. N/A Brandywine Realty Trust
38 Towers Crescent/A* Washington 106,798 4th Capital One N/A JLL
39 SunBank Data Center* Orlando 106,440 4th Xerox N/A JLL
40 1633 Broadway New York City 106,230 4th MongoDB, Inc. Cushman & Wake�eld CBRE
Select Top O�ce Leases Based on Leased Square Footage For Deals Signed in 2017
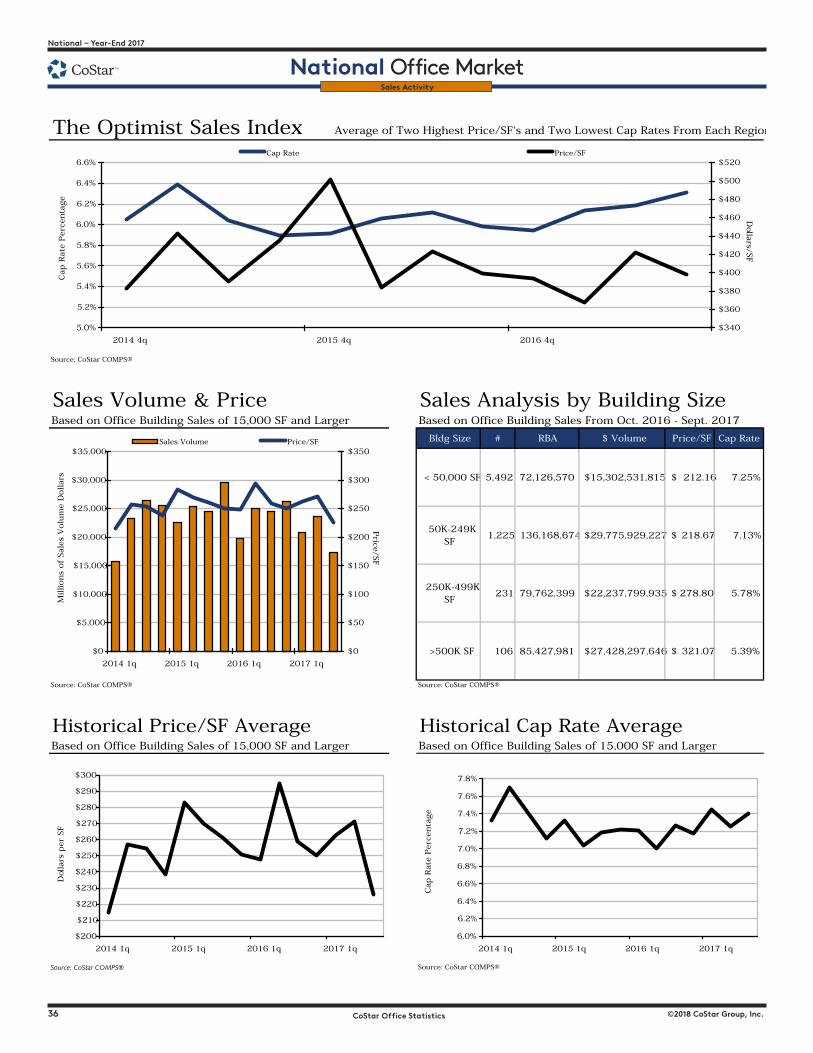
36 CoStar Office Statistics ©2018 CoStar Group, Inc.
National � Year-End 2017
National Office MarketYear-End 2017 – National
National Office Market
©2018 CoStar Group, Inc. CoStar Office Statistics 37
Sales Activity
The Optimist Sales Index Average of Two Highest Price/SF's and Two Lowest Cap Rates From Each Region
Source: CoStar COMPS®
Sales Volume & Price Sales Analysis by Building SizeBased on Office Building Sales of 15,000 SF and Larger Based on Office Building Sales From Oct. 2016 - Sept. 2017
Bldg Size # RBA $ Volume Price/SF Cap Rate
< 50,000 SF 5,492 72,126,570 $15,302,531,815 212.16$ 7.25%
50K-249K SF
1,225 136,168,674 $29,775,929,227 218.67$ 7.13%
250K-499K SF
231 79,762,399 $22,237,799,935 278.80$ 5.78%
>500K SF 106 85,427,981 $27,428,297,646 321.07$ 5.39%
Source: CoStar COMPS® Source: CoStar COMPS®
Historical Price/SF Average Historical Cap Rate AverageBased on Office Building Sales of 15,000 SF and Larger Based on Office Building Sales of 15,000 SF and Larger
Source: CoStar COMPS® Source: CoStar COMPS®
$200
$210
$220
$230
$240
$250
$260
$270
$280
$290
$300
2014 1q 2015 1q 2016 1q 2017 1q
Dol
lars
per
SF
$0
$5,000
$10,000
$15,000
$20,000
$25,000
$30,000
$35,000
2014 1q 2015 1q 2016 1q 2017 1q
Millions
of
Sale
s V
olu
me D
ollars
$0
$50
$100
$150
$200
$250
$300
$350
Price
/SF
Sales Volume Price/SF
5.0%
5.2%
5.4%
5.6%
5.8%
6.0%
6.2%
6.4%
6.6%
2014 4q 2015 4q 2016 4q
Cap R
ate
Perc
enta
ge
$340
$360
$380
$400
$420
$440
$460
$480
$500
$520
Dolla
rs/SF
Cap Rate Price/SF
6.0%
6.2%
6.4%
6.6%
6.8%
7.0%
7.2%
7.4%
7.6%
7.8%
2014 1q 2015 1q 2016 1q 2017 1q
Cap R
ate
Perc
enta
ge
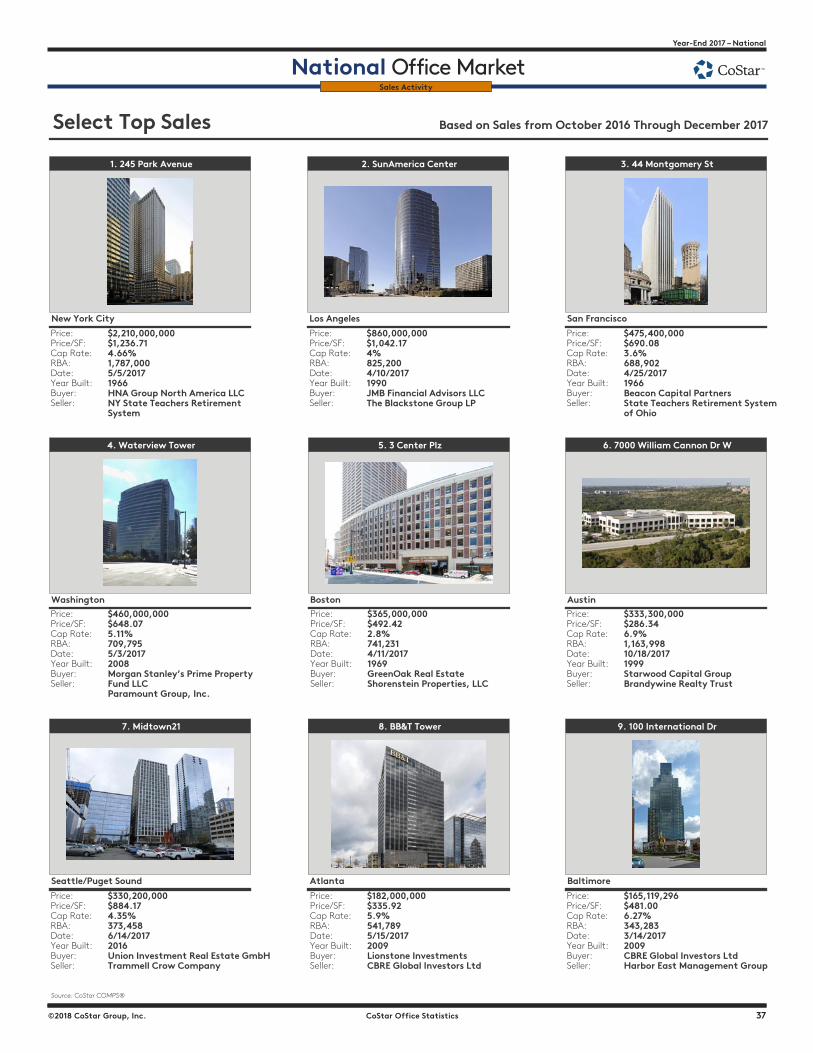
36 CoStar Office Statistics ©2018 CoStar Group, Inc.
National � Year-End 2017
National Office MarketYear-End 2017 – National
National Office Market
©2018 CoStar Group, Inc. CoStar Office Statistics 37
Sales Activity
���������������� ������������������������������������������������������
���������������������
���������������������������������������������������������
���������������������������������������������������������������������������������������������������������������
�������������������
����������������������������������������������������������������������
��������������������������������������������������������������������������������������������
���������������������
��������������������������������������������������������������������
����������������������������������������������������������������������������������������������������������
��������������������
�������������
���������������������������������������������������������
��������������������������������������������������������������������������������������������������������
�������������������
�������������������������������������������������������������������
������������������������������������������������������������������������������������������
����������������
���������������������������������������������������������������
�������������������������������������������������������������������������������������������
����������������������������
������
���������������������������������������������������������
��������������������������������������������������������������������������������������������������
�������������
����������������������������������������������������������������������������
�����������������������������������������������������������������������������������������
��������������
����������������������������������������������������������������
�������������������������������������������������������������������������������������������������
������������������������
���������