cost of quality in home building
TRANSCRIPT

Cost of Quality & ReworkCost of Quality & ReworkIn Home BuildingIn Home Building
Denis Leonard Ph.D.


Pheng, L.S & Ke-Wei, P (1996) A Framework for Implementing TQM in Construction, The TQM Magazine, Vol 8 No 5, pp 39-46

Construction Rework CostsConstruction Rework Costs
Rework costs for a study of 260 construction projects:
Mean $ Mean % of contract value
Indirect 1,072,287 5.43
Direct 1,186,398 5.56
Total 2,257,340 11.07
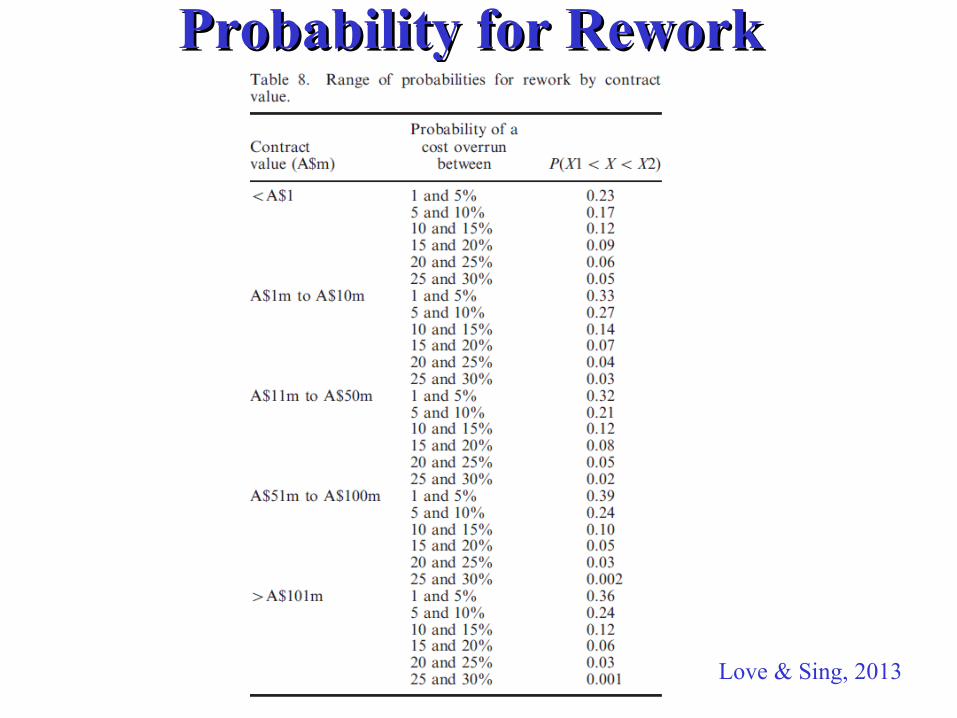
Probability for ReworkProbability for Rework
Love & Sing, 2013

FRI Rework Danger ChartFRI Rework Danger Chart

FRI Warns of Cost GrowthFRI Warns of Cost Growth
FRI Score Cost Growth (%)
>45 25.8%
30-45 6.0%
<30 -7.8%SAVINGS!

FRI Warns OF Field Rework FRI Warns OF Field Rework and Cost Growthand Cost Growth
• For Database– Warning for field rework and for cost growth
about equal– FRI target of <30 is good for both


Residential Construction CostsResidential Construction Costs
• Take 3.5% of revenue is cost of quality• 75% of cost of quality is failure costs
= 2.62 % of revenue is failure cost
•Therefore on a $150k home $3930 is failure cost• On a $150k home the profit at 1.22% (taken from industry data via Professional Builder Magazine) is $1830• If 50 homes per year are built that equals $589,500 of failure cost per year, the equivalent of 4 homes per year
(at $150k)

Construction Quality Construction Quality (Xiao & Proverbs, 2002)
Low cost and speedy construction should not be achieved at the expense of the quality of the project. In fact, poor quality performance results in increased rework, which has significant cost and schedule implications. Doing thing the right way the first time is achievable.
Construction Quality Construction Quality (Xiao & Proverbs, 2002)
The cost of correcting deviations from stated requirements is in the region of 12 percent of project cost, whereas the cost of providing TQM is between 1-5 percent.

Construction Quality Construction Quality (Salem, Solomon, Genaidy & Leugring, 2005)
The commitment of the top management for the implementation of these (quality) tools may prove to be the most important factor in successful implementation.

Construction Quality Construction Quality (Rahman, Kwan & Woods 1999)
Traditional method to control quality is to look for defects correct them and prevent them from recurring, but with new customers or products it is about customer requirements and starting upstream at the design concept stage

Construction Quality Construction Quality (Barrat, 2000)
A combination of sound formal systems and strong relationships is essential to achieve high quality in the project environment of construction, both within companies and across the supply network.

Construction Quality Construction Quality (Haupt & Whitman 2003)
The construction industry has been slow to embrace the concept of TQM. While companies implement quality in their offices and management operations few can transfer this to field operations. Inhibiting factors include:
• Too much paperwork
• Subs and trades not interested
• Low bid subcontracting
• Field managers seeing quality irrelevant
• Transient workforce
• Low education level of field workforce
• Short term focus on cost savings
• Too tight scheduling
Quality of ConstructionQuality of Construction(FIDIC Exectutive Committee, 2004)
Actions could include:• Recognise the importance of quality of construction. • Adopt quality management systems. • Provide procedures for corrective action when quality control and /or acceptance criteria are not met. • Recruit, train and assign a skilled work force. • Take measures to ensure that subcontractors are qualified,
and/or licensed as required.

THE IMPACT OF QUALITYTHE IMPACT OF QUALITYIN HOME BUILDINGIN HOME BUILDING

Cost of ReworkCost of Rework
• Cost of rework in commercial construction 12.4% of total contract cost
• In residential construction 4.1%
• Mean defect cost $4500
Benchmarking Construction Rework in Australian Housing, Mills, Williams & Yu, Int. Journal for Housing Science, Vol.34, No.3 pp. 207-220, 2010

Scott SedamScott Sedam
• 2010 survey 497 trades
• 12.3% got all the information needed
• 20% of plan errors add trip at an average cost of $201 per trip

The Market for Quality The Market for Quality In Home BuildingIn Home Building
May 2009

Average Building Code Failure RatesAverage Building Code Failure RatesSan Diego CA 1999-2003San Diego CA 1999-2003

Defects in HomesDefects in Homes
• 15-20% of new homes nationally do not meet reasonable standards.
• This includes roof framing, waterproofing, drainage and weather-tightness.
Disputed Survey Finds Many Flaws in New HomesSacramento Business Journal, 7/25/03

Defects in HomesDefects in Homes• Data captured by Quality Built field
inspectors on 31,995 completed homes and condominiums across 27 U.S. states for the 12-month period ending October 1, 2005.
• Single-family homes averaged $5,398 in corrected defects per home in 2005
• Multi-family homes and mixed commercial use construction averaged $4,556 in corrected defects.
Nation’s Leading Risk Management Company Releases Top Builder Defect Data for Construction Industry
Quality Built® Data Shows Builder Top Risk Issues Are Preventable Media Kit :Orlando, Fla., Jan. 11, 2006 — (International Builders’ Show)

Constructions Seven Deadly SinsConstructions Seven Deadly Sins
Since 1994 200,000 homes built under this programCombined risk savings (builder & insurance co) $1B
1. Technical Design2. Communication3. Builder Knowledge4. Process5. Customer Service6. Claims & Data7. Sales & Safety
Quality Initiatives & Trends in the Housing Industry, 2005, Stan Luhr, Quality Built
Kaizen ImpactsKaizen Impacts
Modular homebuilding company study
• As a result of the study/implementation of Kaizen – 59% labor productivity gain– 22% cycle time reduction
US DOE Building AmericaIndustrialized Housing Partnership
Manufacturing /Construction Productivity2005
Kaizen ImpactsKaizen Impacts
Metric Categories of
1. Customer Satisfaction2. Operational Performance3. Financial Performance4. Team Member Satisfaction5. Community Service
US DOE Building AmericaIndustrialized Housing Partnership
Manufacturing /Construction Productivity2005

Kaizen ImpactsKaizen Impacts
Customer Satisfaction
1. Customer satisfaction index2. Annual customer survey3. Referral rates4. On time delivery5. Defects found by builder at delivery6. Defects found by homeowner at inspection7. Warranty calls8. Warranty costs9. Response time on warranty calls
US DOE Building AmericaIndustrialized Housing Partnership
Manufacturing /Construction Productivity2005

Kaizen ImpactsKaizen ImpactsOperational Performance
1. Defects found by online inspection2. Defects found by finished product quality audits3. Feedback from company set crew4. Feedback from company final trim out5. Service claims received and completed6. Leads and leads closed7. Company sales vs sales in region8. Homes shipped complete9. Labor efficiency10.Line rework cost11.Warranty costs12.Costs of quality13.Utility cost14.Vendor rating
US DOE Building AmericaIndustrialized Housing Partnership
Manufacturing /Construction Productivity2005

Decline in Word of Mouth Based on Decline in Decline in Word of Mouth Based on Decline in Customer SatisfactionCustomer Satisfaction
90%
65%
30%
9%3% 2% 0% 0% 0% 0%
10 9 8 7 6 5 4 3 2 1
% Definitely will Recommend Company
-36%
Overall Satisfaction with Compnay
Source: J.D. Power and Associates 2005 New Home Builder Customer Satisfaction Study
UnacceptableOutstanding Average
-70% -91% -97% -98% -100%

4.175.59
7.58
0.200.340.310.63
1.311.86
2.86
0.00
1.00
2.00
3.00
4.00
5.00
6.00
7.00
8.00
9.00
10 9 8 7 6 5 4 3 2 1
Overall Satisfaction
Num
ber
of R
ecom
men
dati
ons 30 Market Total
MEAN NUMBER OF RECOMMENDATIONS GIVEN BY OVERALL SATISFACTION
Comparison of Loyalty Rates and Customer Comparison of Loyalty Rates and Customer Satisfaction LevelsSatisfaction Levels
J.D. Power and Associates 2005 New Home Builder Customer Satisfaction Study

At an Index score of 122, the
average builder could receive 4.62 positive
recommendations per homebuyer.
The average builder, at an Index score of 112, receives 3.96 positive
recommendations per
homebuyer.
A 10-point increase in a builder’s Index score can yield 0.66 extra recommendations per homebuyer.
3.964.62
As Overall Satisfaction Scores Increase, As Overall Satisfaction Scores Increase, So Do the Number of So Do the Number of
Positive Recommendations per HomebuyerPositive Recommendations per Homebuyer
JD Power, The Impact of Quality on Customer Satisfaction, Maryland National Capital Building Industry Assoc, June 21st 2006

= $3,504,000 Revenue
5% Average Profit MarginX= $175,000
Additional profit from additional
recommendations
X 15%Convert to
Sales=
$292,000 Average Sale PriceXX
128
=0.66 Additional Recommendation
per Buyer
84AverageNumber of Returned
Questionnaires per Builder
Potential Customers
12Additional
Home Sales
JD Power, The Impact of Quality on Customer Satisfaction, Maryland National Capital Building Industry Assoc
June 21st 2006

Analysis Step 2: Determine the Importance of Each ofthe Drivers of Customer Satisfaction% Contribution to Overall % Contribution to Overall
Experience With New-Home BuilderExperience With New-Home Builder
JD Power, The Impact of Quality on Customer Satisfaction, Maryland National Capital Building Industry Assoc
June 21st 2006

36
The Percent of Home Buyers Experiencing Significant The Percent of Home Buyers Experiencing Significant Construction Problems Impacts Customer SatisfactionConstruction Problems Impacts Customer Satisfaction
Washington, D.C. Baltimore
Q25Home Exterior Home Exterior 77% 68%Q2501 Landscaping 54% 40%Q2505 Sidewalk, driveway, foundation cracks 41% 34%Q2506 Lot and slope drainage 32% 27%Q2504 Exterior paint 27% 20%Q2503 Exterior walls 25% 19%Q2508 Other exterior 19% 16%Q2507 Roof leaks 11% 9%Q2502 Fencing 4% 2%Q25Kitchen Kitchen 62% 56%Q2511 Plumbing problems 35% 30%Q2509 Cabinet quality and finish 32% 25%Q2510 Countertop problems 23% 23%Q2512 Other kitchen problems 18% 13%Q25Bathrooms Bathrooms 61% 55%Q2513 Toilet problems 30% 27%Q2514 Sink, tub and shower stall plumbing 30% 24%Q2515 Other sink, tub and shower stall 21% 17%Q2517 Other bathroom problems 15% 13%Q2516 Countertop problems 9% 10%Q25Windows/Doors Windows/Doors 65% 59%Q2520 Internal door misfits 29% 27%Q2518 Window misfits or leaks 28% 26%Q2519 External door misfits or leaks 24% 23%Q2522 Other window or door 23% 15%Q2521 Garage door 17% 12%Q25Electrical/Appliances Electrical/Appliances 63% 61%Q2525 Heating and air-conditioning 40% 42%Q2523 Electrical problems 27% 23%Q2526 Appliance problems 21% 20%Q2524 Lighting fixture problems 12% 11%Q2527 Other electrical/appliance 6% 6%
Washington, D.C. Baltimore
Flooring/Stairs 73% 71%Floor squeaks 37% 31%Visible carpet seams 37% 29%Hardwood floor problems 25% 29%Carpet coming up at edges 22% 18%Tile cracks, chips 19% 17%Stairway squeaks 17% 15%Other flooring/stair problems 16% 13%Stairway handrail weakness 12% 9%Linoleum dimples/buckles 5% 8%Discolored tile or linoleum 4% 5%
Drywall 67% 70%Nail pops/exposed nails 46% 46%Wall/ceiling cracks 34% 37%Visible joints/seams 29% 29%Wall bulges/unevenness of surfaces 21% 20%Crooked walls 19% 17%Other drywall problems 14% 16%
Interior paint 35% 34%Uneven paint coverage 18% 17%Paint of poor quality 16% 17%Paint scratches/chipping 13% 10%Paint not washable 7% 8%Other interior paint problems 7% 5%
Other significant problems 10% 10%
JD Power, The Impact of Quality on Customer Satisfaction, Maryland National Capital Building Industry Assoc
June 21st 2006

Not Surprisingly, Problems per 100 Homes Increases Over Time in Home…
PROBLEMS PER 100 HOMES
Problems per 100 Homes Increases Over Time Problems per 100 Homes Increases Over Time
JD Power, The Impact of Quality on Customer Satisfaction, Maryland National Capital Building Industry Assoc
June 21st 2006

As Does Problems per 1,000 FeetAs Does Problems per 1,000 Feet2.2.
PROBLEMS PER 1,000 FEET2
5.795.89
6.01
6.566.68
5.00
5.50
6.00
6.50
7.00
Less Than 6Months
6 Months toLess Than 9
Months
9 Months toLess Than 12
Months
12 Months toLess Than 15
Months
15 Months toLess Than 18
Months
Length of Time in Home
Ave
rag
e N
um
ber
of
Pro
ble
ms
Exp
erie
nce
d
JD Power, The Impact of Quality on Customer Satisfaction, Maryland National Capital Building Industry Assoc
June 21st 2006
3+ Visits to Resolve
2 Visits to Resolve
1 Visit to Resolve
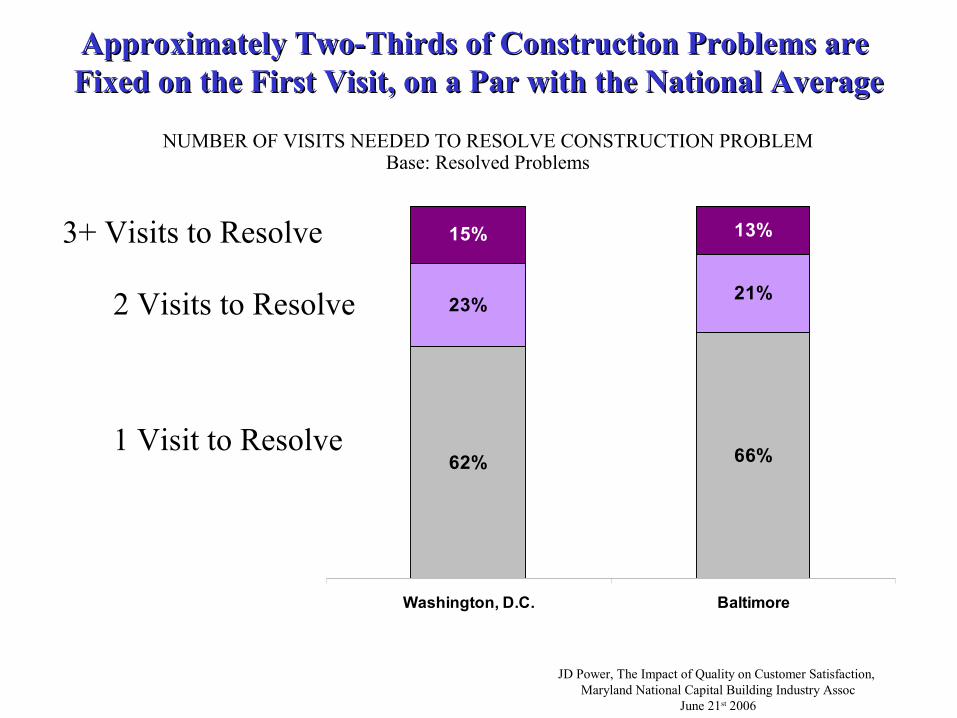
NUMBER OF VISITS NEEDED TO RESOLVE CONSTRUCTION PROBLEMBase: Resolved Problems
Approximately Two-Thirds of Construction Problems are Approximately Two-Thirds of Construction Problems are Fixed on the First Visit, on a Par with the National AverageFixed on the First Visit, on a Par with the National Average
62% 66%
15% 13%
23%21%
Washington, D.C. Baltimore
JD Power, The Impact of Quality on Customer Satisfaction, Maryland National Capital Building Industry Assoc
June 21st 2006

Overall Satisfaction Declines Dramatically When Overall Satisfaction Declines Dramatically When Problems Require More Than One Visit to ResolveProblems Require More Than One Visit to Resolve
Ove
rall
Sat
isfa
ctio
n In
dex
Visits To Resolve Problem
OVERALL SATISFACTION INDEX VS. PROBLEM RESOLUTION
30 Market Total
JD Power, The Impact of Quality on Customer Satisfaction, Maryland National Capital Building Industry Assoc
June 21st 2006

HIGHEST IMPACT ON OVERALL SATISFACTION
Each Occurrence of the Following Problems Will Reduce Each Occurrence of the Following Problems Will Reduce an Individual’s Overall Satisfaction Score, by...an Individual’s Overall Satisfaction Score, by...
Category Problem Impact WeightHome Exterior Roof leaks -3.31Drywall Crooked walls -3.06Home Exterior Sidewalk/driveway/foundation cracks -3.05Interior paint Interior paint of poor quality -2.86Flooring/Stairs Linoleum dimples/buckles -2.73Kitchen Cabinet quality and finish -2.27Home Exterior Lot and slope drainage -2.19Flooring/Stairs Visible carpet seams -2.18Home Exterior Exterior walls -2.01Flooring/Stairs Stairway handrail weakness -1.94Flooring/Stairs Discolored tile or linoleum -1.91Electrical/Appliance Electrical problems -1.87Flooring/Stairs Other flooring problems -1.77Windows/Doors External door misfits or leaks -1.72Windows/Doors Window misfits or leaks -1.69Home Exterior Landscaping -1.63
JD Power, The Impact of Quality on Customer Satisfaction, Maryland National Capital Building Industry Assoc
June 21st 2006