cost of floating offshore wind energy using new …cost of floating offshore wind energy using new...
TRANSCRIPT
NREL is a national laboratory of the U.S. Department of Energy Office of Energy Efficiency & Renewable Energy Operated by the Alliance for Sustainable Energy, LLC This report is available at no cost from the National Renewable Energy Laboratory (NREL) at www.nrel.gov/publications.
Contract No. DE-AC36-08GO28308
Technical Report NREL/TP-5000-75618 January 2020
Cost of Floating Offshore Wind Energy Using New England Aqua Ventus Concrete Semisubmersible Technology Walter Musial, Philipp Beiter, and Jake Nunemaker
National Renewable Energy Laboratory
NREL is a national laboratory of the U.S. Department of Energy Office of Energy Efficiency & Renewable Energy Operated by the Alliance for Sustainable Energy, LLC This report is available at no cost from the National Renewable Energy Laboratory (NREL) at www.nrel.gov/publications.
Contract No. DE-AC36-08GO28308
National Renewable Energy Laboratory 15013 Denver West Parkway Golden, CO 80401 303-275-3000 • www.nrel.gov
Technical Report NREL/TP-5000-75618 January 2020
Cost of Floating Offshore Wind Energy Using New England Aqua Ventus Concrete Semisubmersible Technology Walter Musial, Philipp Beiter, and Jake Nunemaker
National Renewable Energy Laboratory
Suggested Citation Musial, Walter, Philipp Beiter, and Jake Nunemaker. 2020. Cost of Floating Offshore Wind Energy using New England Aqua Ventus Concrete Semisubmersible Technology. Golden, CO: National Renewable Energy Laboratory. NREL/TP-5000-75618. https://www.nrel.gov/docs/fy20osti/75618.pdf.
NOTICE
This work was authored by the National Renewable Energy Laboratory, operated by Alliance for Sustainable Energy, LLC, for the U.S. Department of Energy (DOE) under Contract No. DE-AC36-08GO28308. Funding provided by the University of Maine. The views expressed herein do not necessarily represent the views of the University of Maine, DOE or the U.S. Government.
This report is available at no cost from the National Renewable Energy Laboratory (NREL) at www.nrel.gov/publications.
U.S. Department of Energy (DOE) reports produced after 1991 and a growing number of pre-1991 documents are available free via www.OSTI.gov.
Cover Photo by Gary Norton: NREL 27462.
NREL prints on paper that contains recycled content.
iv This report is available at no cost from the National Renewable Energy Laboratory (NREL) at www.nrel.gov/publications.
Acknowledgments This study was funded by the University of Maine, and the analysis was conducted independently by the National Renewable Energy Laboratory. The key contributors from the University of Maine were Habib Dagher and Anthony Viselli, who provided component cost data and engineering analysis related to the Aqua Ventus floating semisubmersible substructure. The authors would like to thank the following contributors from the National Renewable Energy Laboratory who provided helpful comments and review: Matt Shields, Amy Robertson, Eric Lantz, and Brian Smith. In addition, the contributions of Dan Beals from the U.S. Department of Energy are greatly appreciated. Editing was provided by Sheri Anstedt (National Renewable Energy Laboratory). The content of this report and any omissions are the sole responsibility of the authors.
v This report is available at no cost from the National Renewable Energy Laboratory (NREL) at www.nrel.gov/publications.
List of Acronyms AEP annual energy production ATD Advanced Technology Demonstration CapEx capital expenditures COD commercial operation date DOE U.S. Department of Energy DTU Technical University of Denmark FCR fixed charge rate GWh gigawatt-hour km kilometer kW kilowatt kWh kilowatt-hour LCOE levelized cost of energy m meter m/s meter per second MW megawatt MWh megawatt-hour NREL National Renewable Energy Laboratory O&M operation and maintenance OpEx operational expenditures ORCA Offshore Regional Cost Analyzer PPA power purchase agreement TWh terawatt-hour UMaine University of Maine WEA wind energy area yr year
vi This report is available at no cost from the National Renewable Energy Laboratory (NREL) at www.nrel.gov/publications.
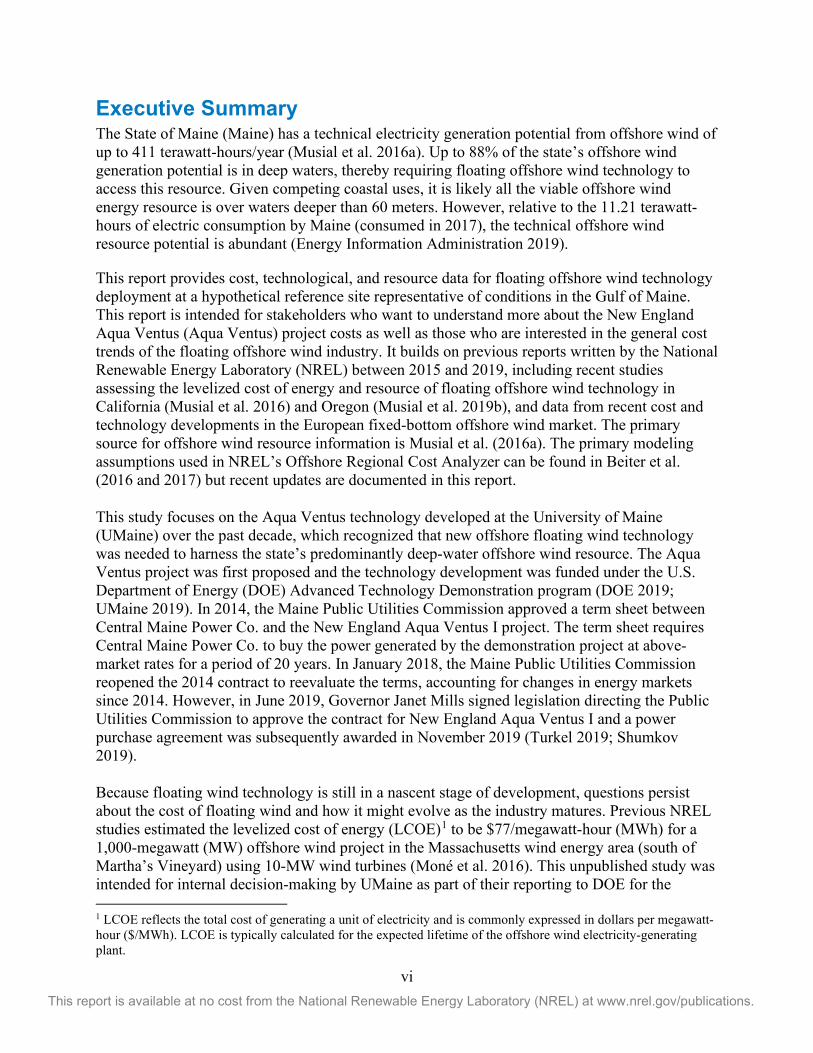
Executive Summary The State of Maine (Maine) has a technical electricity generation potential from offshore wind of up to 411 terawatt-hours/year (Musial et al. 2016a). Up to 88% of the state’s offshore wind generation potential is in deep waters, thereby requiring floating offshore wind technology to access this resource. Given competing coastal uses, it is likely all the viable offshore wind energy resource is over waters deeper than 60 meters. However, relative to the 11.21 terawatt-hours of electric consumption by Maine (consumed in 2017), the technical offshore wind resource potential is abundant (Energy Information Administration 2019).
This report provides cost, technological, and resource data for floating offshore wind technology deployment at a hypothetical reference site representative of conditions in the Gulf of Maine. This report is intended for stakeholders who want to understand more about the New England Aqua Ventus (Aqua Ventus) project costs as well as those who are interested in the general cost trends of the floating offshore wind industry. It builds on previous reports written by the National Renewable Energy Laboratory (NREL) between 2015 and 2019, including recent studies assessing the levelized cost of energy and resource of floating offshore wind technology in California (Musial et al. 2016) and Oregon (Musial et al. 2019b), and data from recent cost and technology developments in the European fixed-bottom offshore wind market. The primary source for offshore wind resource information is Musial et al. (2016a). The primary modeling assumptions used in NREL’s Offshore Regional Cost Analyzer can be found in Beiter et al. (2016 and 2017) but recent updates are documented in this report.
This study focuses on the Aqua Ventus technology developed at the University of Maine (UMaine) over the past decade, which recognized that new offshore floating wind technology was needed to harness the state’s predominantly deep-water offshore wind resource. The Aqua Ventus project was first proposed and the technology development was funded under the U.S. Department of Energy (DOE) Advanced Technology Demonstration program (DOE 2019; UMaine 2019). In 2014, the Maine Public Utilities Commission approved a term sheet between Central Maine Power Co. and the New England Aqua Ventus I project. The term sheet requires Central Maine Power Co. to buy the power generated by the demonstration project at above-market rates for a period of 20 years. In January 2018, the Maine Public Utilities Commission reopened the 2014 contract to reevaluate the terms, accounting for changes in energy markets since 2014. However, in June 2019, Governor Janet Mills signed legislation directing the Public Utilities Commission to approve the contract for New England Aqua Ventus I and a power purchase agreement was subsequently awarded in November 2019 (Turkel 2019; Shumkov 2019).
Because floating wind technology is still in a nascent stage of development, questions persist about the cost of floating wind and how it might evolve as the industry matures. Previous NREL studies estimated the levelized cost of energy (LCOE)1 to be $77/megawatt-hour (MWh) for a 1,000-megawatt (MW) offshore wind project in the Massachusetts wind energy area (south of Martha’s Vineyard) using 10-MW wind turbines (Moné et al. 2016). This unpublished study was intended for internal decision-making by UMaine as part of their reporting to DOE for the
1 LCOE reflects the total cost of generating a unit of electricity and is commonly expressed in dollars per megawatt-hour ($/MWh). LCOE is typically calculated for the expected lifetime of the offshore wind electricity-generating plant.
vii This report is available at no cost from the National Renewable Energy Laboratory (NREL) at www.nrel.gov/publications.
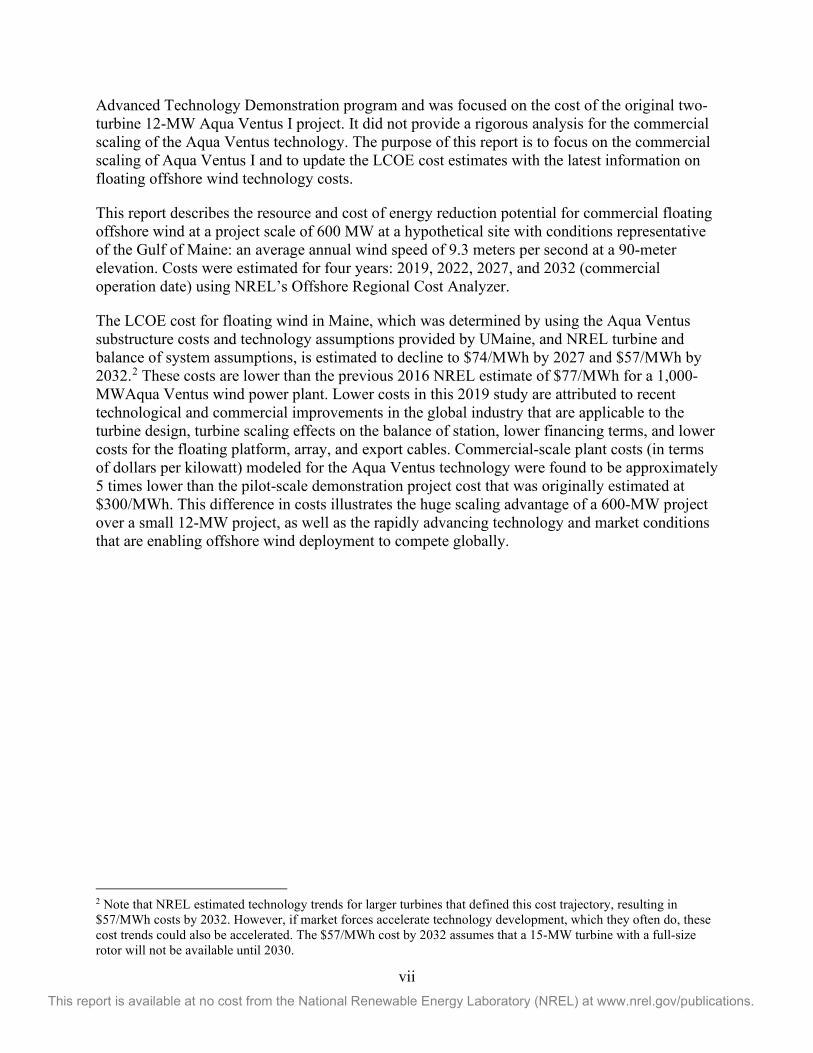
Advanced Technology Demonstration program and was focused on the cost of the original two-turbine 12-MW Aqua Ventus I project. It did not provide a rigorous analysis for the commercial scaling of the Aqua Ventus technology. The purpose of this report is to focus on the commercial scaling of Aqua Ventus I and to update the LCOE cost estimates with the latest information on floating offshore wind technology costs.
This report describes the resource and cost of energy reduction potential for commercial floating offshore wind at a project scale of 600 MW at a hypothetical site with conditions representative of the Gulf of Maine: an average annual wind speed of 9.3 meters per second at a 90-meter elevation. Costs were estimated for four years: 2019, 2022, 2027, and 2032 (commercial operation date) using NREL’s Offshore Regional Cost Analyzer.
The LCOE cost for floating wind in Maine, which was determined by using the Aqua Ventus substructure costs and technology assumptions provided by UMaine, and NREL turbine and balance of system assumptions, is estimated to decline to $74/MWh by 2027 and $57/MWh by 2032.2 These costs are lower than the previous 2016 NREL estimate of $77/MWh for a 1,000-MWAqua Ventus wind power plant. Lower costs in this 2019 study are attributed to recent technological and commercial improvements in the global industry that are applicable to the turbine design, turbine scaling effects on the balance of station, lower financing terms, and lower costs for the floating platform, array, and export cables. Commercial-scale plant costs (in terms of dollars per kilowatt) modeled for the Aqua Ventus technology were found to be approximately 5 times lower than the pilot-scale demonstration project cost that was originally estimated at $300/MWh. This difference in costs illustrates the huge scaling advantage of a 600-MW project over a small 12-MW project, as well as the rapidly advancing technology and market conditions that are enabling offshore wind deployment to compete globally.
2 Note that NREL estimated technology trends for larger turbines that defined this cost trajectory, resulting in $57/MWh costs by 2032. However, if market forces accelerate technology development, which they often do, these cost trends could also be accelerated. The $57/MWh cost by 2032 assumes that a 15-MW turbine with a full-size rotor will not be available until 2030.
viii This report is available at no cost from the National Renewable Energy Laboratory (NREL) at www.nrel.gov/publications.
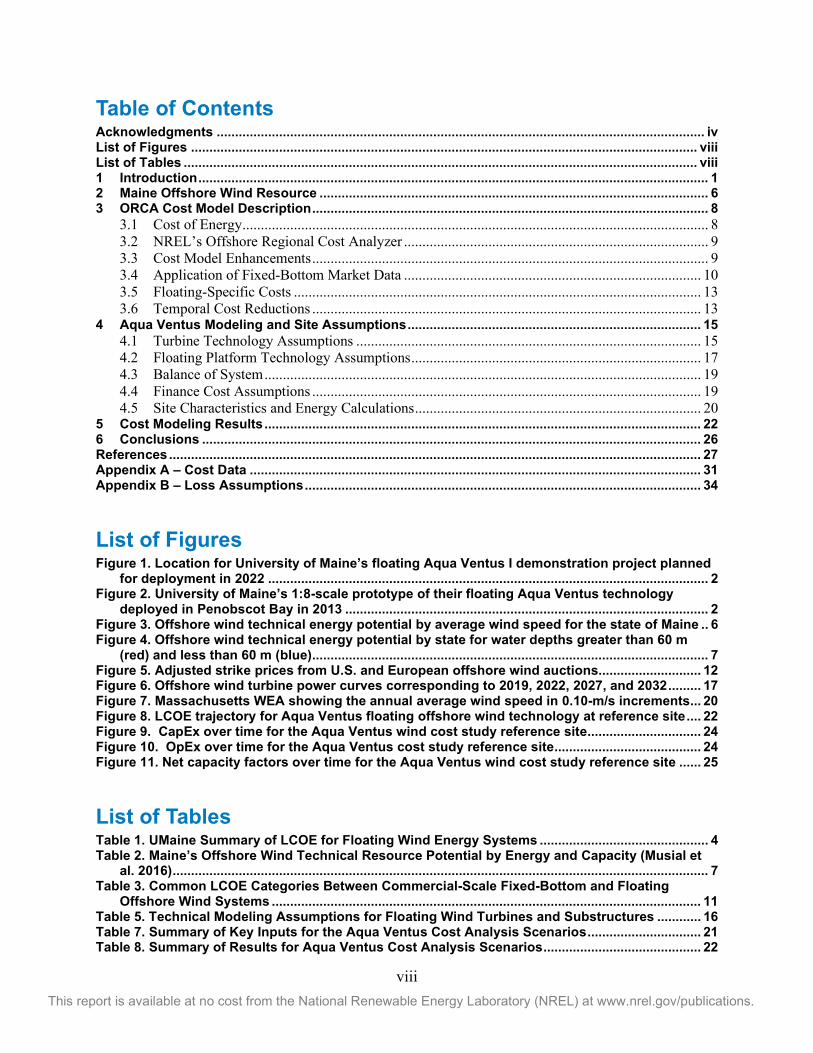
Table of Contents Acknowledgments ..................................................................................................................................... iv List of Figures .......................................................................................................................................... viii List of Tables ............................................................................................................................................ viii 1 Introduction ........................................................................................................................................... 1 2 Maine Offshore Wind Resource .......................................................................................................... 6 3 ORCA Cost Model Description ............................................................................................................ 8
3.1 Cost of Energy ............................................................................................................................... 8 3.2 NREL’s Offshore Regional Cost Analyzer ................................................................................... 9 3.3 Cost Model Enhancements ............................................................................................................ 9 3.4 Application of Fixed-Bottom Market Data ................................................................................. 10 3.5 Floating-Specific Costs ............................................................................................................... 13 3.6 Temporal Cost Reductions .......................................................................................................... 13
4 Aqua Ventus Modeling and Site Assumptions ................................................................................ 15 4.1 Turbine Technology Assumptions .............................................................................................. 15 4.2 Floating Platform Technology Assumptions ............................................................................... 17 4.3 Balance of System ....................................................................................................................... 19 4.4 Finance Cost Assumptions .......................................................................................................... 19 4.5 Site Characteristics and Energy Calculations .............................................................................. 20
5 Cost Modeling Results ....................................................................................................................... 22 6 Conclusions ........................................................................................................................................ 26 References ................................................................................................................................................. 27 Appendix A – Cost Data ........................................................................................................................... 31 Appendix B – Loss Assumptions ............................................................................................................ 34
List of Figures Figure 1. Location for University of Maine’s floating Aqua Ventus I demonstration project planned
for deployment in 2022 ........................................................................................................................ 2 Figure 2. University of Maine’s 1:8-scale prototype of their floating Aqua Ventus technology
deployed in Penobscot Bay in 2013 ................................................................................................... 2 Figure 3. Offshore wind technical energy potential by average wind speed for the state of Maine .. 6 Figure 4. Offshore wind technical energy potential by state for water depths greater than 60 m
(red) and less than 60 m (blue) ............................................................................................................ 7 Figure 5. Adjusted strike prices from U.S. and European offshore wind auctions............................ 12 Figure 6. Offshore wind turbine power curves corresponding to 2019, 2022, 2027, and 2032 ......... 17 Figure 7. Massachusetts WEA showing the annual average wind speed in 0.10-m/s increments... 20 Figure 8. LCOE trajectory for Aqua Ventus floating offshore wind technology at reference site .... 22 Figure 9. CapEx over time for the Aqua Ventus wind cost study reference site ............................... 24 Figure 10. OpEx over time for the Aqua Ventus cost study reference site ........................................ 24 Figure 11. Net capacity factors over time for the Aqua Ventus wind cost study reference site ...... 25
List of Tables Table 1. UMaine Summary of LCOE for Floating Wind Energy Systems .............................................. 4 Table 2. Maine’s Offshore Wind Technical Resource Potential by Energy and Capacity (Musial et
al. 2016) .................................................................................................................................................. 7 Table 3. Common LCOE Categories Between Commercial-Scale Fixed-Bottom and Floating
Offshore Wind Systems ..................................................................................................................... 11 Table 5. Technical Modeling Assumptions for Floating Wind Turbines and Substructures ............ 16 Table 7. Summary of Key Inputs for the Aqua Ventus Cost Analysis Scenarios ............................... 21 Table 8. Summary of Results for Aqua Ventus Cost Analysis Scenarios ........................................... 22
ix This report is available at no cost from the National Renewable Energy Laboratory (NREL) at www.nrel.gov/publications.
Table A.1. Summary of Cost Data for Aqua Ventus with a 10-MW Turbine ........................................ 31 Table A.2. Summary of Cost Data for Aqua Ventus with a 12-MW Turbine ........................................ 32 Table A.3. Summary of Cost Data for Aqua Ventus with a 15-MW Turbine ........................................ 33 Table B.1 Loss Assumptions for Aqua Ventus Technology Scenarios .............................................. 34
1 This report is available at no cost from the National Renewable Energy Laboratory (NREL) at www.nrel.gov/publications.
1 Introduction The purpose of this analysis is to estimate the future cost of commercial floating wind in the New England Outer Continental Shelf using engineering data from the New England Aqua Ventus (Aqua Ventus) project under development at the University of Maine (UMaine), coupled with technology trend and cost data for future floating wind technology up to 2032 (commercial operation date [COD]). The analysis was performed at the National Renewable Energy Laboratory (NREL) and funded by UMaine.
Another objective was to assess the cost differences due to project scale. Previous studies have focused on the cost of the pilot-scale 12-megawatt (MW) Aqua Ventus I project as part of the U.S. Department of Energy (DOE) Advanced Technology Demonstration (ATD) program but have not provided a full treatment of the technology at commercial scale. Because floating wind technology is still in a nascent stage of development, questions persist about the cost of floating wind and how it might evolve as the industry matures. Increased project scale has been documented to significantly reduce the levelized cost of energy (LCOE), especially when transitioning from pilot scale (10 to 50 MW) to utility scale (250 to 1,000 MW) (Maness 2017; Musial et al. 2019b). For UMaine, the need to explore benefits from project scaling is relevant because prospective investors need assurance from the pilot-scale project that the technology costs will be competitive at a commercial scale. This report provides more detailed information about how the Aqua Ventus technology unit costs are likely to change for commercial project scales of 600 MW or greater.
In the United States, more than 58% of the total technical offshore wind resource is in water depths greater than 60 meters (m), including most of the available resource off the coast of Maine (Musial et al. 2016a). Globally, the development of floating offshore wind technology is evolving quickly but it is too early to identify a commercially dominant substructure type. The Aqua Ventus technology has significant attributes that may enable it to compete in this emerging market. At the end of 2018, there were seven floating offshore wind projects installed around the world representing 44 MW of capacity. Four projects (34.5 MW) were installed in Europe and three (9 MW) in Asia. There are an additional 14 pilot-scale projects representing 203 MW that are currently under construction or have achieved either financial close or regulatory approval. Most of these projects are expected to be commissioned by 2022. Overall, the global pipeline for floating offshore wind reached approximately 4,888 MW in the operational and development pipeline, with the commercial phase expected to commence near the 2025 timeframe (Musial et al. 2019a).
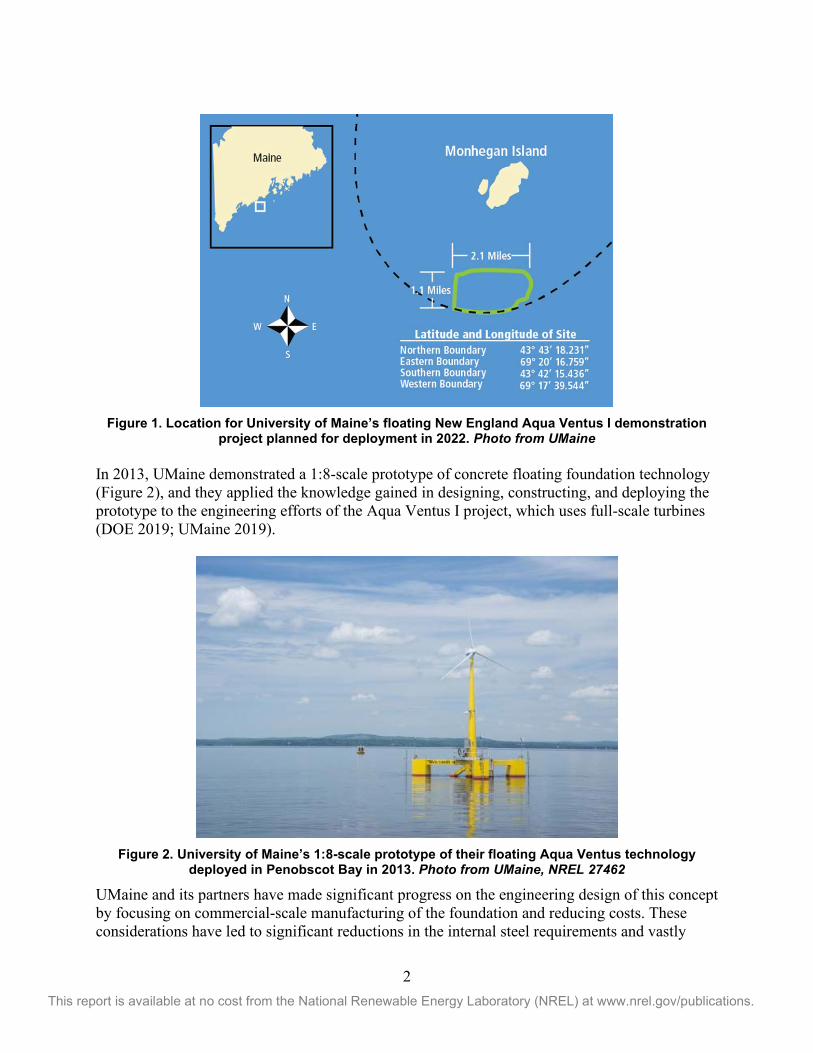
UMaine plans to install the 12-MW pilot-scale Aqua Ventus I project as a demonstration of the new Aqua Ventus floating wind technology. The original project plan called for two 6-MW wind turbines to be installed on adjacent platforms. However, to maintain relevance with commercial industry trends, the current plan for the Aqua Ventus demonstration project is to use a single turbine in the range of 9.5 MW to 12 MW. As a primary feature, the demonstration wind power plant will incorporate a novel full-scale concrete semisubmersible floating foundation developed at UMaine, which will be deployed at a test site off Monhegan Island, Maine, shown in Figure 1.
2 This report is available at no cost from the National Renewable Energy Laboratory (NREL) at www.nrel.gov/publications.
Figure 1. Location for University of Maine’s floating New England Aqua Ventus I demonstration
project planned for deployment in 2022. Photo from UMaine
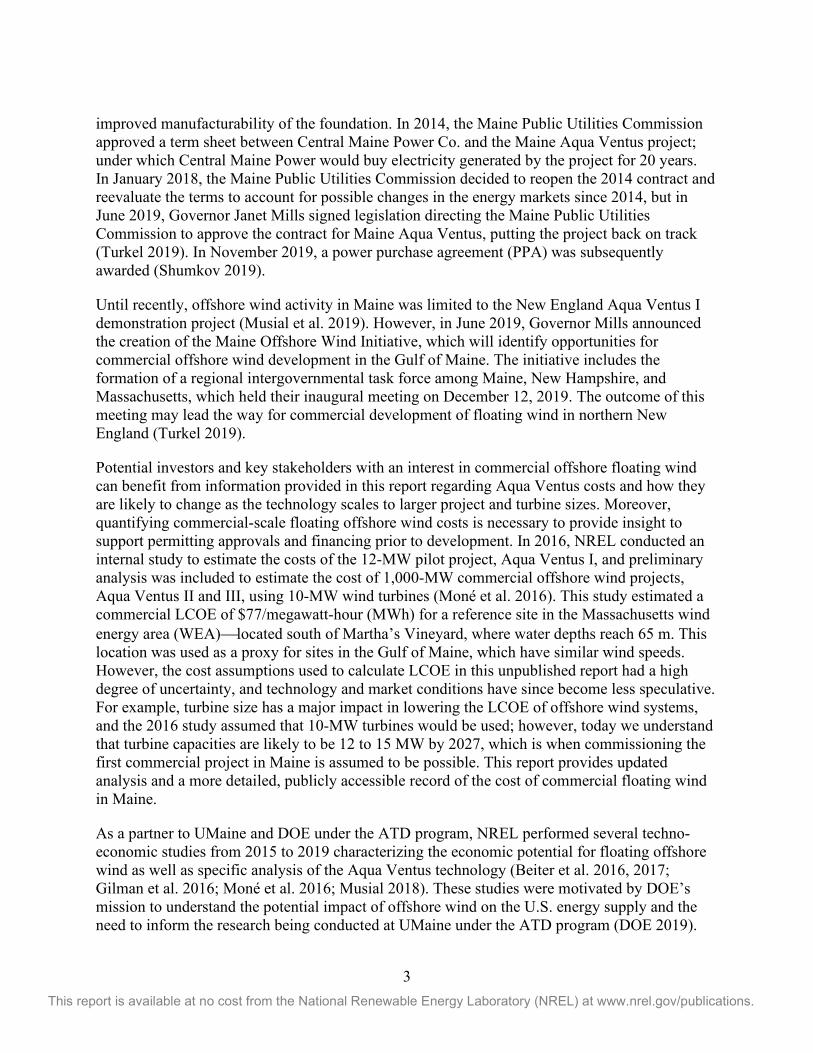
In 2013, UMaine demonstrated a 1:8-scale prototype of concrete floating foundation technology (Figure 2), and they applied the knowledge gained in designing, constructing, and deploying the prototype to the engineering efforts of the Aqua Ventus I project, which uses full-scale turbines (DOE 2019; UMaine 2019).
Figure 2. University of Maine’s 1:8-scale prototype of their floating Aqua Ventus technology
deployed in Penobscot Bay in 2013. Photo from UMaine, NREL 27462
UMaine and its partners have made significant progress on the engineering design of this concept by focusing on commercial-scale manufacturing of the foundation and reducing costs. These considerations have led to significant reductions in the internal steel requirements and vastly
3 This report is available at no cost from the National Renewable Energy Laboratory (NREL) at www.nrel.gov/publications.
improved manufacturability of the foundation. In 2014, the Maine Public Utilities Commission approved a term sheet between Central Maine Power Co. and the Maine Aqua Ventus project; under which Central Maine Power would buy electricity generated by the project for 20 years. In January 2018, the Maine Public Utilities Commission decided to reopen the 2014 contract and reevaluate the terms to account for possible changes in the energy markets since 2014, but in June 2019, Governor Janet Mills signed legislation directing the Maine Public Utilities Commission to approve the contract for Maine Aqua Ventus, putting the project back on track (Turkel 2019). In November 2019, a power purchase agreement (PPA) was subsequently awarded (Shumkov 2019).
Until recently, offshore wind activity in Maine was limited to the New England Aqua Ventus I demonstration project (Musial et al. 2019). However, in June 2019, Governor Mills announced the creation of the Maine Offshore Wind Initiative, which will identify opportunities for commercial offshore wind development in the Gulf of Maine. The initiative includes the formation of a regional intergovernmental task force among Maine, New Hampshire, and Massachusetts, which held their inaugural meeting on December 12, 2019. The outcome of this meeting may lead the way for commercial development of floating wind in northern New England (Turkel 2019).
Potential investors and key stakeholders with an interest in commercial offshore floating wind can benefit from information provided in this report regarding Aqua Ventus costs and how they are likely to change as the technology scales to larger project and turbine sizes. Moreover, quantifying commercial-scale floating offshore wind costs is necessary to provide insight to support permitting approvals and financing prior to development. In 2016, NREL conducted an internal study to estimate the costs of the 12-MW pilot project, Aqua Ventus I, and preliminary analysis was included to estimate the cost of 1,000-MW commercial offshore wind projects, Aqua Ventus II and III, using 10-MW wind turbines (Moné et al. 2016). This study estimated a commercial LCOE of $77/megawatt-hour (MWh) for a reference site in the Massachusetts wind energy area (WEA)located south of Martha’s Vineyard, where water depths reach 65 m. This location was used as a proxy for sites in the Gulf of Maine, which have similar wind speeds. However, the cost assumptions used to calculate LCOE in this unpublished report had a high degree of uncertainty, and technology and market conditions have since become less speculative. For example, turbine size has a major impact in lowering the LCOE of offshore wind systems, and the 2016 study assumed that 10-MW turbines would be used; however, today we understand that turbine capacities are likely to be 12 to 15 MW by 2027, which is when commissioning the first commercial project in Maine is assumed to be possible. This report provides updated analysis and a more detailed, publicly accessible record of the cost of commercial floating wind in Maine.
As a partner to UMaine and DOE under the ATD program, NREL performed several techno-economic studies from 2015 to 2019 characterizing the economic potential for floating offshore wind as well as specific analysis of the Aqua Ventus technology (Beiter et al. 2016, 2017; Gilman et al. 2016; Moné et al. 2016; Musial 2018). These studies were motivated by DOE’s mission to understand the potential impact of offshore wind on the U.S. energy supply and the need to inform the research being conducted at UMaine under the ATD program (DOE 2019).
4 This report is available at no cost from the National Renewable Energy Laboratory (NREL) at www.nrel.gov/publications.
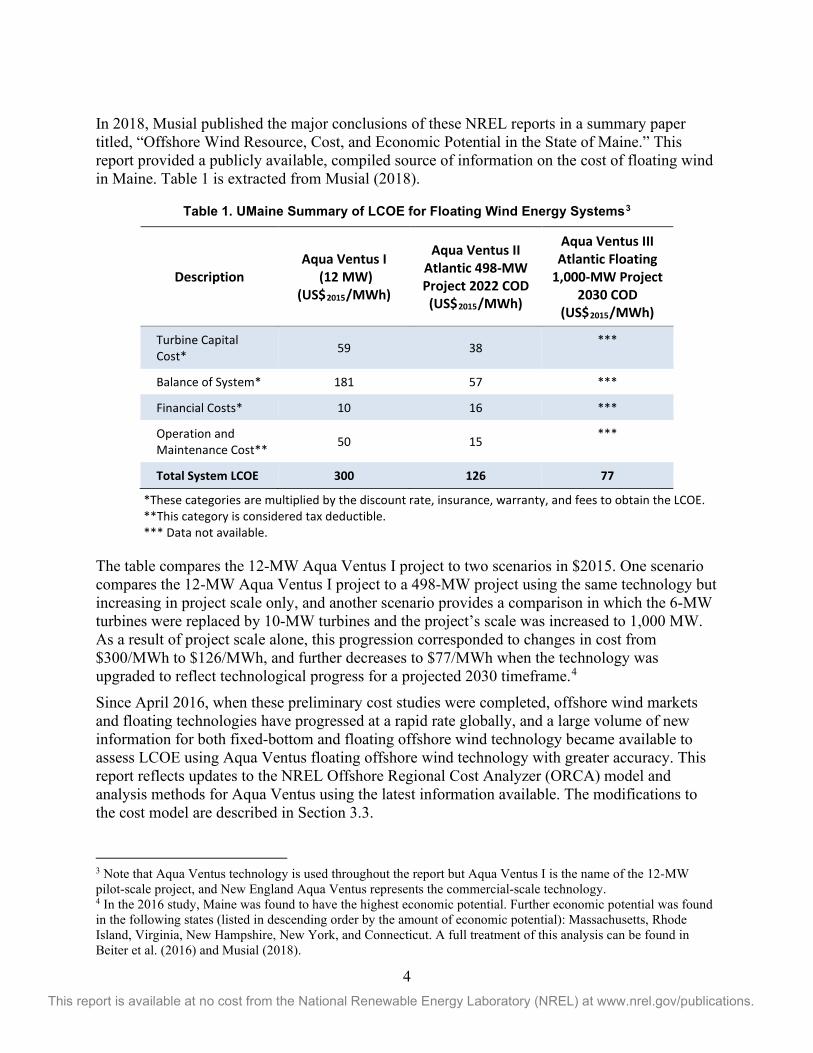
In 2018, Musial published the major conclusions of these NREL reports in a summary paper titled, “Offshore Wind Resource, Cost, and Economic Potential in the State of Maine.” This report provided a publicly available, compiled source of information on the cost of floating wind in Maine. Table 1 is extracted from Musial (2018).
Table 1. UMaine Summary of LCOE for Floating Wind Energy Systems3
Description Aqua Ventus I
(12 MW) (US$2015/MWh)
Aqua Ventus II Atlantic 498-MW Project 2022 COD (US$2015/MWh)
Aqua Ventus III Atlantic Floating
1,000-MW Project 2030 COD
(US$2015/MWh)
Turbine Capital Cost* 59 38 ***
Balance of System* 181 57 ***
Financial Costs* 10 16 ***
Operation and Maintenance Cost** 50 15 ***
Total System LCOE 300 126 77
*These categories are multiplied by the discount rate, insurance, warranty, and fees to obtain the LCOE. **This category is considered tax deductible. *** Data not available.
The table compares the 12-MW Aqua Ventus I project to two scenarios in $2015. One scenario compares the 12-MW Aqua Ventus I project to a 498-MW project using the same technology but increasing in project scale only, and another scenario provides a comparison in which the 6-MW turbines were replaced by 10-MW turbines and the project’s scale was increased to 1,000 MW. As a result of project scale alone, this progression corresponded to changes in cost from $300/MWh to $126/MWh, and further decreases to $77/MWh when the technology was upgraded to reflect technological progress for a projected 2030 timeframe.4 Since April 2016, when these preliminary cost studies were completed, offshore wind markets and floating technologies have progressed at a rapid rate globally, and a large volume of new information for both fixed-bottom and floating offshore wind technology became available to assess LCOE using Aqua Ventus floating offshore wind technology with greater accuracy. This report reflects updates to the NREL Offshore Regional Cost Analyzer (ORCA) model and analysis methods for Aqua Ventus using the latest information available. The modifications to the cost model are described in Section 3.3.
3 Note that Aqua Ventus technology is used throughout the report but Aqua Ventus I is the name of the 12-MW pilot-scale project, and New England Aqua Ventus represents the commercial-scale technology. 4 In the 2016 study, Maine was found to have the highest economic potential. Further economic potential was found in the following states (listed in descending order by the amount of economic potential): Massachusetts, Rhode Island, Virginia, New Hampshire, New York, and Connecticut. A full treatment of this analysis can be found in Beiter et al. (2016) and Musial (2018).
5 This report is available at no cost from the National Renewable Energy Laboratory (NREL) at www.nrel.gov/publications.
The remainder of this report covers:
• The general characteristics of the offshore wind resource in Maine • A detailed description of the ORCA model • A description of the cost modeling assumptions for Aqua Ventus • A summary of the results of the Aqua Ventus cost analysis.
6 This report is available at no cost from the National Renewable Energy Laboratory (NREL) at www.nrel.gov/publications.
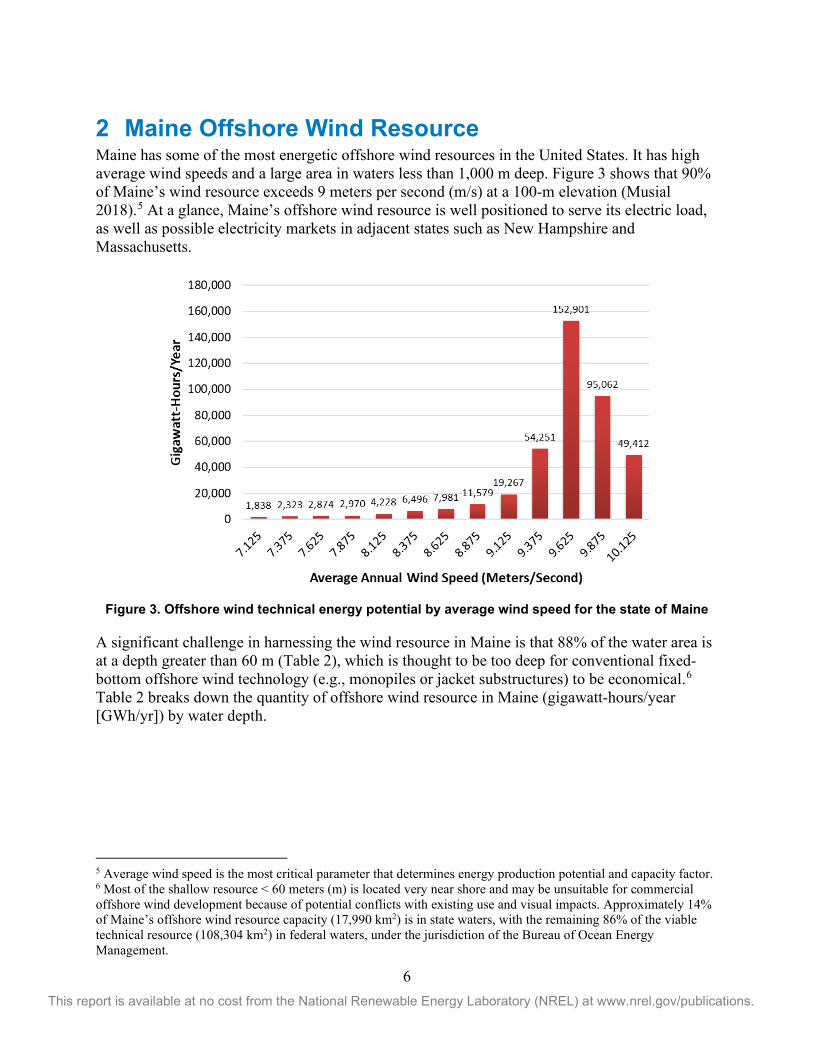
2 Maine Offshore Wind Resource Maine has some of the most energetic offshore wind resources in the United States. It has high average wind speeds and a large area in waters less than 1,000 m deep. Figure 3 shows that 90% of Maine’s wind resource exceeds 9 meters per second (m/s) at a 100-m elevation (Musial 2018).5 At a glance, Maine’s offshore wind resource is well positioned to serve its electric load, as well as possible electricity markets in adjacent states such as New Hampshire and Massachusetts.
Figure 3. Offshore wind technical energy potential by average wind speed for the state of Maine
A significant challenge in harnessing the wind resource in Maine is that 88% of the water area is at a depth greater than 60 m (Table 2), which is thought to be too deep for conventional fixed-bottom offshore wind technology (e.g., monopiles or jacket substructures) to be economical.6 Table 2 breaks down the quantity of offshore wind resource in Maine (gigawatt-hours/year [GWh/yr]) by water depth.
5 Average wind speed is the most critical parameter that determines energy production potential and capacity factor. 6 Most of the shallow resource < 60 meters (m) is located very near shore and may be unsuitable for commercial offshore wind development because of potential conflicts with existing use and visual impacts. Approximately 14% of Maine’s offshore wind resource capacity (17,990 km2) is in state waters, with the remaining 86% of the viable technical resource (108,304 km2) in federal waters, under the jurisdiction of the Bureau of Ocean Energy Management.
7 This report is available at no cost from the National Renewable Energy Laboratory (NREL) at www.nrel.gov/publications.
Table 2. Maine’s Offshore Wind Technical Resource Potential by Energy and Capacity (Musial et al. 2016a)
Water Depth Range (m) Technical Energy Potential (GWh/yr)
Technical Capacity Potential (MW)
0−30 23,902 6,935 31−60 20,120 4,972
61−700 367,162 82,591 Total 411,184 94,498
These available offshore wind resources can be compared to 11,214 GWh, which is the total 2017 retail electricity sales in Maine reported by the Energy Information Administration (2019). In other words, the offshore wind resource potential is 36 times greater than the state’s electric energy demand, which is proportionally greater with respect to load than any other state in the country.
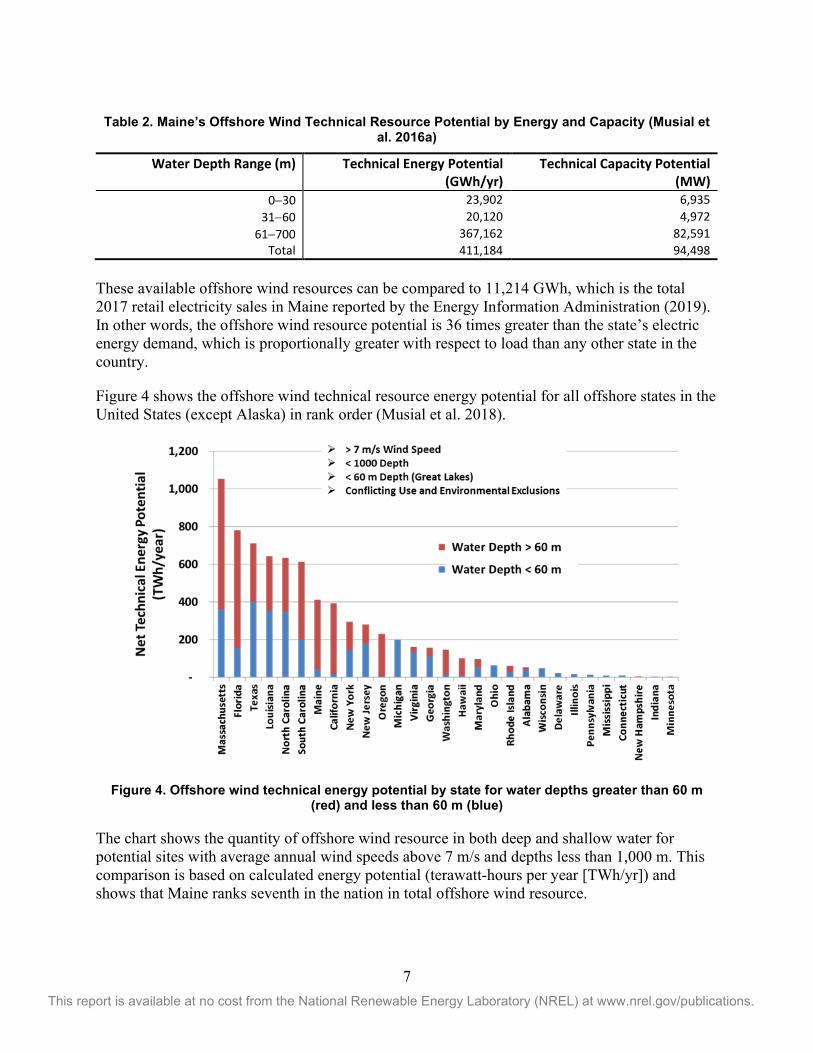
Figure 4 shows the offshore wind technical resource energy potential for all offshore states in the United States (except Alaska) in rank order (Musial et al. 2018).
Figure 4. Offshore wind technical energy potential by state for water depths greater than 60 m (red) and less than 60 m (blue)
The chart shows the quantity of offshore wind resource in both deep and shallow water for potential sites with average annual wind speeds above 7 m/s and depths less than 1,000 m. This comparison is based on calculated energy potential (terawatt-hours per year [TWh/yr]) and shows that Maine ranks seventh in the nation in total offshore wind resource.
8 This report is available at no cost from the National Renewable Energy Laboratory (NREL) at www.nrel.gov/publications.
3 ORCA Cost Model Description The ORCA model was used to estimate the Aqua Ventus costs reported in Section 5. This section provides details about the model and recent modifications that were implemented.
A fundamental challenge of modeling the future costs of commercial-scale floating offshore wind is the sparse cost data available from a few small-scale and pilot projects. The largest floating array to date was commissioned in October 2017 by Equinor off Peterhead, Scotland, using five 6-MW turbines on floating spar platforms. Other floating offshore wind deployments have been single prototypes. However, their early-stage commercial character and limited project size limits cost inferences for commercial-scale project costs.
In this version of ORCA, we performed the following steps to assess the cost of commercial-scale floating offshore wind projects:
1. Decomposed the fixed-bottom market price data to identify the technology and logistical cost categories that are common to both floating and fixed-bottom offshore wind technologies
2. Used vendor quotes and engineering estimates for bottom-up cost assessments of the technological and logistical aspects unique to floating offshore wind
3. Assessed future technology trajectories for wind turbine sizes (e.g., 10 MW in 2020, 12 MW in 2025, and 15 MW in 2030) and associated the turbine size increases with modeled cost reduction trajectories; note that this turbine growth and associated cost declines would be accelerated if larger turbines are available earlier
4. Scaled available cost data from pre to commercial-scale project size using empirical economies of scale and engineering relationships established by existing industries.
3.1 Cost of Energy ORCA follows the general definition of LCOE described in Beiter et al. (2016):
LCOE =
where: FCR = fixed charge rate (%) CapEx = capital expenditures ($/kilowatt [kW]) AEPnet = net average annual energy production (AEP) (kilowatt-hour [kWh]/yr) OpEx = average annual operational expenditures ($/kW/yr).
Further details about the bottom-up method for calculating CapEx, OpEx, and AEPnet from spatial parameters and financial parameters such as the FCR7 are documented in Beiter et al. (2016).
7 The fixed charge rate is used to approximate the average annual payment required to cover the carrying charges on investment and tax obligations.
AEPnet (FCR*CapEx) + OpEx

9 This report is available at no cost from the National Renewable Energy Laboratory (NREL) at www.nrel.gov/publications.
3.2 NREL’s Offshore Regional Cost Analyzer ORCA was developed and is maintained by NREL with funding from DOE. It was used as the principal tool for this analysis. Developed in 2015, the model estimates the cost of offshore wind generation in U.S. waters for fixed-bottom and floating offshore wind technologies and over time (2019−2032 COD) (Beiter et al. 2016, 2017; Maness et al. 2017). It was also used to perform the cost analysis in support of the 2016 “National Offshore Wind Strategy” (Gilman et al. 2016). ORCA is continuously updated as the industry evolves to evaluate the cost impact of technical innovation and assess regional offshore wind costs over time. The model is primarily a “bottom-up” offshore wind cost evaluation tool, which calculates project cost by summing the individual component costs of the wind power plant system. Its accuracy varies by cost component and the quality and availability of cost data that are from vendor- and literature-derived sources for validation. NREL cost modelers update ORCA when new data become available, but at any given moment some offshore wind cost areas may be better represented than others.
ORCA cost elements are divided into three categories: fixed, variable, and cost multipliers. Fixed costs refer to cost categories that do not have an empirically discernable relationship with the spatial parameters considered. Offshore wind turbine procurement costs, for example, are assumed to be site-independent, given that commercial turbines are typically designed for a single design class using International Electrotechnical Commission Class 1 standards (International Electrotechnical Commission 2019). In practice, however, wind turbine original equipment manufacturers hold liabilities associated with warranty provisions and may adjust the pricing structure for a given site to account for the perceived level of risk associated with varying levels of exposure to environmental conditions. Nevertheless, we assume that these costs are constant from one project to another.
Variable costs refer to categories of expenditures that have distinct relationships with spatial parameters. For example, installation costs are expected to vary with logistical distances from construction and service ports to site, water depth, and prevailing meteorological ocean conditions.
Cost multipliers vary with total project cost, reflecting the inherent complexity of certain cost items. For instance, engineering and management costs incurred from financial close through commercial operations are applied as a percentage of CapEx (see Beiter et al. 2016 for more details).
3.3 Cost Model Enhancements We considered information from the European auction price data (Musial et al. 2019) and analysis of the Vineyard Wind PPA (Beiter et al. 2019), which were not available for previous studies, for this version of ORCA. In addition, recent advancements made by UMaine in engineering and documenting floating-specific substructure components of turbine ratings up to 15 MW enabled consideration of turbine sizes of 12 and 15 MW. Based on market trends, these turbine sizes were assumed to be available for deployment in the 2027−2032 timeframe and were modeled accordingly in ORCA. We also verified results from ORCA against recent European floating offshore wind cost studies published in 2017 and 2018, which reached similar conclusions as the analysis herein (e.g., Hundleby et al. 2017; WindEurope 2018).
10 This report is available at no cost from the National Renewable Energy Laboratory (NREL) at www.nrel.gov/publications.
A summary of the major improvements that have been incorporated into ORCA since 2016 are:
• Consideration of European strike price declines of about 65% for fixed-bottom projects awarded between 2017 and 2025 (Musial et al. 2019a)
• Validation of cost modeling assumptions using insights from the PPA between Vineyard Wind and Massachusetts electric distribution companies (Beiter et al. 2019)
• More favorable financing terms on par with fixed-bottom projects (Gulliet 2018); if developed at a commercial scale, floating offshore wind is assumed in this study to carry a risk profile and financing rates similar to today’s fixed-bottom offshore wind projects
• Extension of cost trend projections to 2032
• Consideration of higher turbine ratings from 12 MW to 15 MW for 2027 and 2032 modeling time horizons, respectively (GE 2018; Hundleby et al. 2017)
• Addition of lower turbine costs per kilowatt, adjusted to reflect future cost trends and expected turbine upscaling
• Inclusion of updated cost data for the Aqua Ventus floating semisubmersible substructures up to the 15-MW turbine scale, assuming commercial-scale production volumes
• Addition of balance-of-plant cost benefits to reduce labor at sea, commissioning time, and operating costs (Villaespesa et al. 2015; Melis et al. 2016).
3.4 Application of Fixed-Bottom Market Data From 2015 to 2018, a downward trend in European offshore wind strike prices became evident in comparison to previous years. Despite this, many U.S. market observers believed that because of market immaturity and a lack of an established U.S. supply chain it might take U.S. projects several years to attain market prices similar to those in Europe. In 2018, the first U.S. price point for a commercial-scale project was established from the Vineyard Wind PPA (800 MW) with Massachusetts electric distribution companies. A detailed assessment of the Vineyard Wind PPA price was conducted by NREL adjusting the Vineyard Wind price for direct comparison with European winning bids (Beiter et al. 2019). This analysis indicated that the Vineyard Wind PPA price falls within the range of recent European projects with a similar COD. The NREL analysis of Vineyard Wind’s PPA price was critical to updating the ORCA model assumptions for floating offshore wind because many technology and commercial components (and associated costs and cost reductions) of fixed-bottom systems directly correspond to commercial floating system cost.
Inferring cost data from fixed-bottom to floating offshore wind structures required decomposing the cost structures for those two technology types and identifying the common cost line items
11 This report is available at no cost from the National Renewable Energy Laboratory (NREL) at www.nrel.gov/publications.
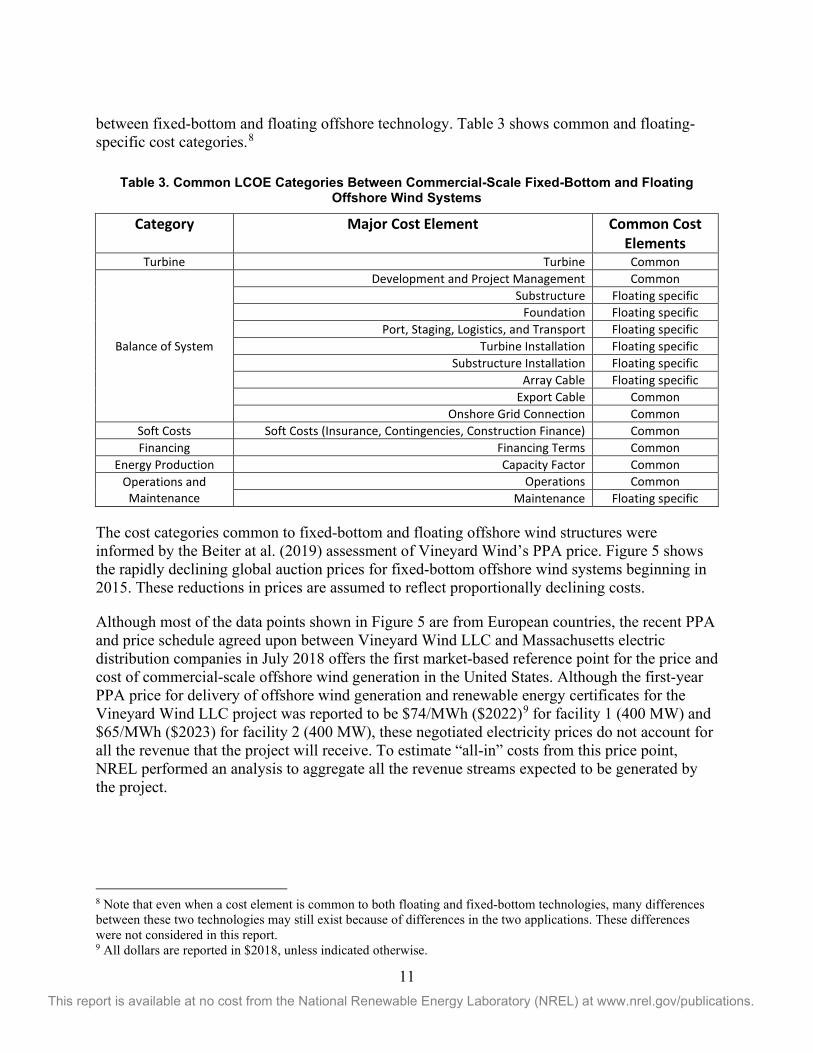
between fixed-bottom and floating offshore technology. Table 3 shows common and floating-specific cost categories.8
Table 3. Common LCOE Categories Between Commercial-Scale Fixed-Bottom and Floating Offshore Wind Systems
Category Major Cost Element Common Cost Elements
Turbine Turbine Common
Balance of System
Development and Project Management Common Substructure Floating specific
Foundation Floating specific Port, Staging, Logistics, and Transport Floating specific
Turbine Installation Floating specific Substructure Installation Floating specific
Array Cable Floating specific Export Cable Common
Onshore Grid Connection Common Soft Costs Soft Costs (Insurance, Contingencies, Construction Finance) Common Financing Financing Terms Common
Energy Production Capacity Factor Common Operations and
Maintenance Operations Common
Maintenance Floating specific
The cost categories common to fixed-bottom and floating offshore wind structures were informed by the Beiter at al. (2019) assessment of Vineyard Wind’s PPA price. Figure 5 shows the rapidly declining global auction prices for fixed-bottom offshore wind systems beginning in 2015. These reductions in prices are assumed to reflect proportionally declining costs.
Although most of the data points shown in Figure 5 are from European countries, the recent PPA and price schedule agreed upon between Vineyard Wind LLC and Massachusetts electric distribution companies in July 2018 offers the first market-based reference point for the price and cost of commercial-scale offshore wind generation in the United States. Although the first-year PPA price for delivery of offshore wind generation and renewable energy certificates for the Vineyard Wind LLC project was reported to be $74/MWh ($2022)9 for facility 1 (400 MW) and $65/MWh ($2023) for facility 2 (400 MW), these negotiated electricity prices do not account for all the revenue that the project will receive. To estimate “all-in” costs from this price point, NREL performed an analysis to aggregate all the revenue streams expected to be generated by the project.
8 Note that even when a cost element is common to both floating and fixed-bottom technologies, many differences between these two technologies may still exist because of differences in the two applications. These differences were not considered in this report. 9 All dollars are reported in $2018, unless indicated otherwise.

12 This report is available at no cost from the National Renewable Energy Laboratory (NREL) at www.nrel.gov/publications.
Figure 5. Adjusted strike prices from U.S. and European offshore wind auctions
Sources: 4C Offshore (2019) and NREL analysis (2019) Notes: *Grid and development costs added; **Grid costs added and contract length adjusted.
We derived the estimated (unsubsidized) cost from the PPA price of Vineyard Wind, accounting for the entire 20-year price schedule and the complete set of expected revenue sources and available tax benefits.
These estimated costs are documented in detail by Beiter et al. (2019) using the following steps:
• Calculate the present value of the revenue from delivery of electricity and renewable energy certificates under the negotiated PPA price schedule
• Account for the value of the investment tax credit to derive an LCOE that is free of direct subsidies
• Consider the revenue from the project’s ability to participate in the ISO-New England Forward-Capacity Market
• Discount all revenue to 2018 dollars. This analysis suggests that the reported first-year PPA price should be adjusted upward by 11 $/MWh for facility 1 and by $13/MWh for facility 2, resulting in a composite levelized revenue of energy of $85/MWh ($2018) for the combined facilities (800 MW).10 In Figure 5, these two
10 Note that in the Beiter et al. (2019) report, an error was included in the calculation of the real-dollar ($2018) values; the corrected values are included herein.

13 This report is available at no cost from the National Renewable Energy Laboratory (NREL) at www.nrel.gov/publications.
data points are labeled as Vineyard Wind I and Vineyard Wind II. The levelized revenue of energy provides a reference point for cost estimates of fixed-bottom technology. The adjusted Vineyard Wind prices are roughly in line with the other European offshore wind project prices that have the same COD. This result suggests that the cost structures and financing terms from European offshore wind projects to be commissioned in the early to mid-2020s could apply to Vineyard Wind, and possibly other early commercial-scale projects in the United States, without a substantial cost penalty as a result of U.S market and supply chain immaturity. The fixed-bottom project cost categories that were adopted for floating offshore from trends observed in the fixed-bottom offshore wind market include new financing terms reported for European fixed-bottom systems, turbine CapEx, development, project management, and soft costs.
3.5 Floating-Specific Costs For this study, we assessed floating-specific cost elements through market research and consultation with floating offshore wind developers, including UMaine. These elements were assigned to the ORCA model base year of 2019 (COD).
In Table 3, the cost categories for floating-specific elements are identified. Most notable are the substructure and foundation costs for dynamic array cables, installation, and maintenance that are not directly transferable to floating. In most cases, these specific cost areas are approximated from proprietary industry data. The full cost breakdown of the system for each turbine size is provided in Appendix A.
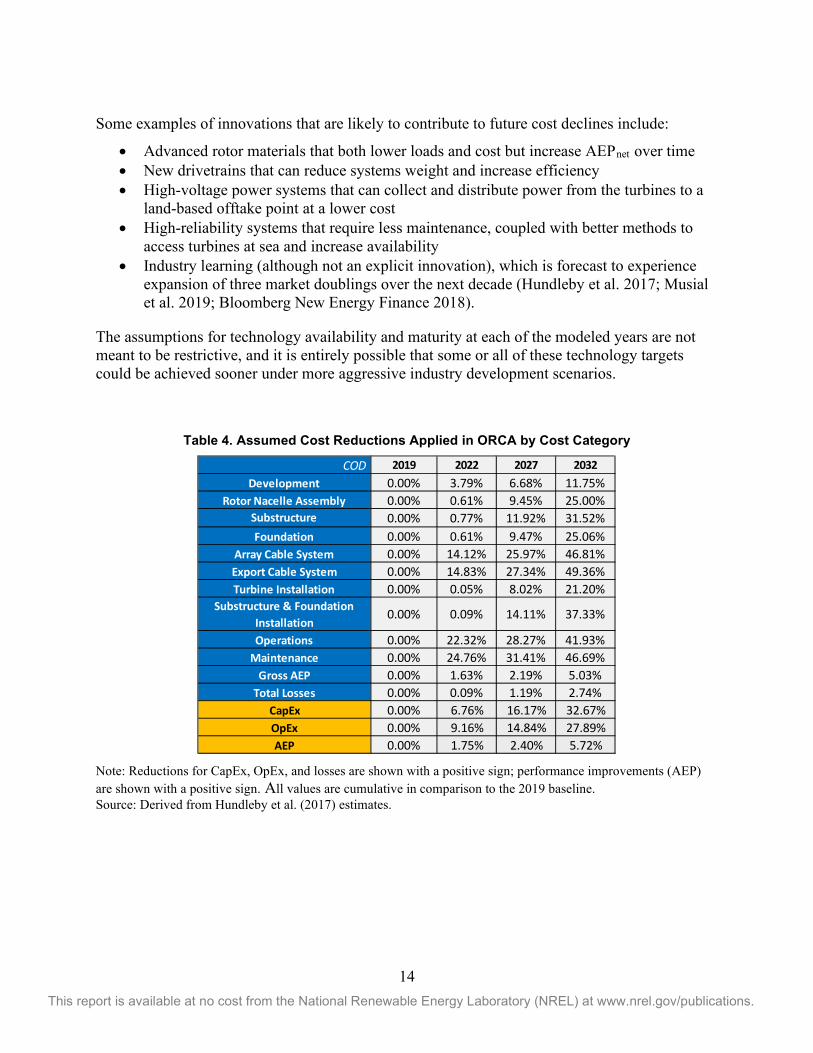
3.6 Temporal Cost Reductions ORCA’s method of cost projections that result from technology innovation, supply chain maturity, and learning curve effects resulting from cumulative deployment of offshore wind between 2019 and 2032 (COD) are described in detail in Beiter et al. (2016). ORCA reflects cost reductions that were derived from Hundleby et al. (2017). These estimated cost reductions are based on an expert elicitation. Cost projections are associated with model years 2022, 2027, and 2032. Hundleby et al. (2017) consider the degree of commercial readiness of an innovation and its “market share” for a given year. Market share accounts for the incompatibility of different innovations on the same platform, in which only one innovation can be implemented for a particular component or subsystem. For example, a direct-drive permanent-magnet generator cannot be combined with a super-conducting generator. The strategy of combining a diverse set of innovations creates technology scenarios for different system designs and installation strategies that lead to the future cost reductions. The estimated cost reductions derived from Hundleby et al. (2017) are shown in Table 4 by cost category.11 The change in costs for all innovation areas is cumulative in comparison to the baseline and show a net cost reduction.
11 The floating innovation and cost reduction assessment used in Beiter et al. (2016) was originally derived from the 2012 DELPHOS model published by BVG Associates in 2014 (Valpy 2014; Beiter et al. 2016) in combination with NREL research and analysis. BVG recently published an updated (Hundleby et al. 2017) assessment for floating technology, which covers the period from 2019 to 2032 (COD). This recent study from Hundleby et al. was used to inform this analysis and help derive innovation areas and their associated cost reduction potential.
14 This report is available at no cost from the National Renewable Energy Laboratory (NREL) at www.nrel.gov/publications.
Some examples of innovations that are likely to contribute to future cost declines include:
• Advanced rotor materials that both lower loads and cost but increase AEPnet over time • New drivetrains that can reduce systems weight and increase efficiency • High-voltage power systems that can collect and distribute power from the turbines to a
land-based offtake point at a lower cost • High-reliability systems that require less maintenance, coupled with better methods to
access turbines at sea and increase availability • Industry learning (although not an explicit innovation), which is forecast to experience
expansion of three market doublings over the next decade (Hundleby et al. 2017; Musial et al. 2019; Bloomberg New Energy Finance 2018).
The assumptions for technology availability and maturity at each of the modeled years are not meant to be restrictive, and it is entirely possible that some or all of these technology targets could be achieved sooner under more aggressive industry development scenarios.
Table 4. Assumed Cost Reductions Applied in ORCA by Cost Category
Note: Reductions for CapEx, OpEx, and losses are shown with a positive sign; performance improvements (AEP) are shown with a positive sign. All values are cumulative in comparison to the 2019 baseline. Source: Derived from Hundleby et al. (2017) estimates.
COD 2019 2022 2027 2032Development 0.00% 3.79% 6.68% 11.75%
Rotor Nacelle Assembly 0.00% 0.61% 9.45% 25.00%Substructure 0.00% 0.77% 11.92% 31.52%Foundation 0.00% 0.61% 9.47% 25.06%
Array Cable System 0.00% 14.12% 25.97% 46.81%Export Cable System 0.00% 14.83% 27.34% 49.36%Turbine Installation 0.00% 0.05% 8.02% 21.20%
Substructure & Foundation Installation
0.00% 0.09% 14.11% 37.33%
Operations 0.00% 22.32% 28.27% 41.93%Maintenance 0.00% 24.76% 31.41% 46.69%
Gross AEP 0.00% 1.63% 2.19% 5.03%Total Losses 0.00% 0.09% 1.19% 2.74%
CapEx 0.00% 6.76% 16.17% 32.67%OpEx 0.00% 9.16% 14.84% 27.89%AEP 0.00% 1.75% 2.40% 5.72%
15 This report is available at no cost from the National Renewable Energy Laboratory (NREL) at www.nrel.gov/publications.
4 Aqua Ventus Modeling and Site Assumptions This section provides the specific technical assumptions for turbines, substructures, the wind power plant, site characteristics, and energy calculations used in the cost model to assess Aqua Ventus. Aqua Ventus assumptions include technology innovations for large-scale turbines up to 15 MW, updated loss model assumptions, supply chain maturation, and industry learning and experience.
4.1 Turbine Technology Assumptions One of the major technology cost drivers for floating wind is the introduction of larger turbines. Recent declines in industry strike prices and commensurate cost declines can, in part, be attributed to the use of larger offshore-specific wind turbines (Musial et al. 2019). Current market data indicate that the trend toward larger machines is likely to continue (Musial et al. 2019). The largest turbine on the market today is the Vestas 9.5-MW wind turbine (MHI-Vestas 2018). However, GE and Siemens have announced 12-MW and 10-MW turbines for the commercial market, respectively, by 2022 (GE 2018; Siemens 2019). Based on these observed market trends, an increasing turbine size was assumed over time for this study for each of the four modeled years: 2019, 2022, 2027, and 2032.
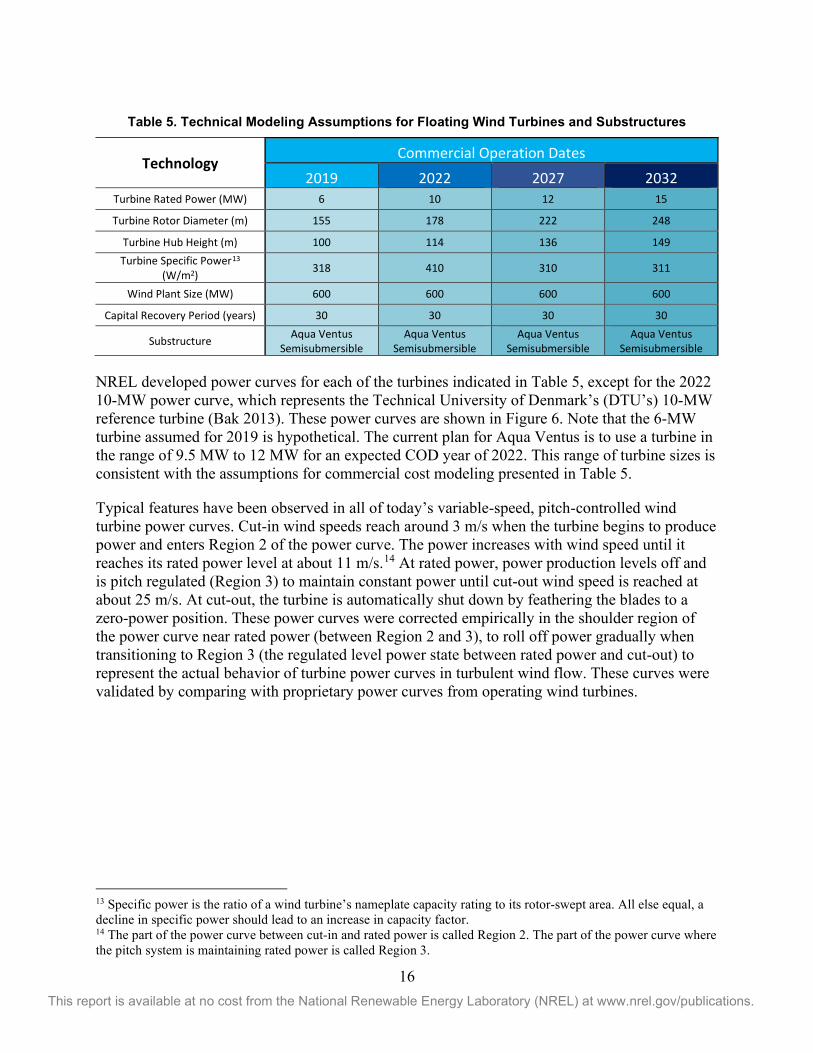
Table 5 shows the cost modeling assumptions for these larger turbines. We assume that by 2022 the industry will be able to deploy a 10-MW turbine with a 178-m rotor because these turbines are ready for the market today (Richard 2019). In 2027, we assume that a 12-MW commercial wind turbine could be deployed using Aqua Ventus technology. GE reported that their prototype 12-MW turbine was installed in 2019, and it will be commercially available in 2022. This assumption is entirely realistic given that in September 2019, Ørsted announced agreements to purchase 12-MW GE turbines for its two Atlantic-based projects (Stromsta 2019). In 2032, we assume that 15-MW turbines could be operational in a commercial utility-scale wind power plant. Some turbine manufacturers are already planning turbines as large as 15 MW. These assumptions account for the fact that the turbine must be on the market at financial close, which is 2 years before COD.
Table 5 also indicates a trend toward lower specific power ratings12 (i.e., larger rotors). In addition, tower height for offshore turbines is expected to increase to accommodate longer blade lengths, maintaining tip clearances of about 25 to 30 m above the flat-water surface. Although the increases in hub height are relatively small, they have a net positive impact on AEP because of positive vertical wind shear, which is assumed to follow a power law coefficient of 0.115.
12 A wind turbine’s specific power is the ratio of its nameplate capacity rating to its rotor-swept area. All else being equal, a decline in specific power should lead to an increase in capacity factor.
16 This report is available at no cost from the National Renewable Energy Laboratory (NREL) at www.nrel.gov/publications.
Table 5. Technical Modeling Assumptions for Floating Wind Turbines and Substructures
Technology Commercial Operation Dates
2019 2022 2027 2032 Turbine Rated Power (MW) 6 10 12 15
Turbine Rotor Diameter (m) 155 178 222 248
Turbine Hub Height (m) 100 114 136 149 Turbine Specific Power13
(W/m2) 318 410 310 311
Wind Plant Size (MW) 600 600 600 600
Capital Recovery Period (years) 30 30 30 30
Substructure Aqua Ventus Semisubmersible
Aqua Ventus Semisubmersible
Aqua Ventus Semisubmersible
Aqua Ventus Semisubmersible
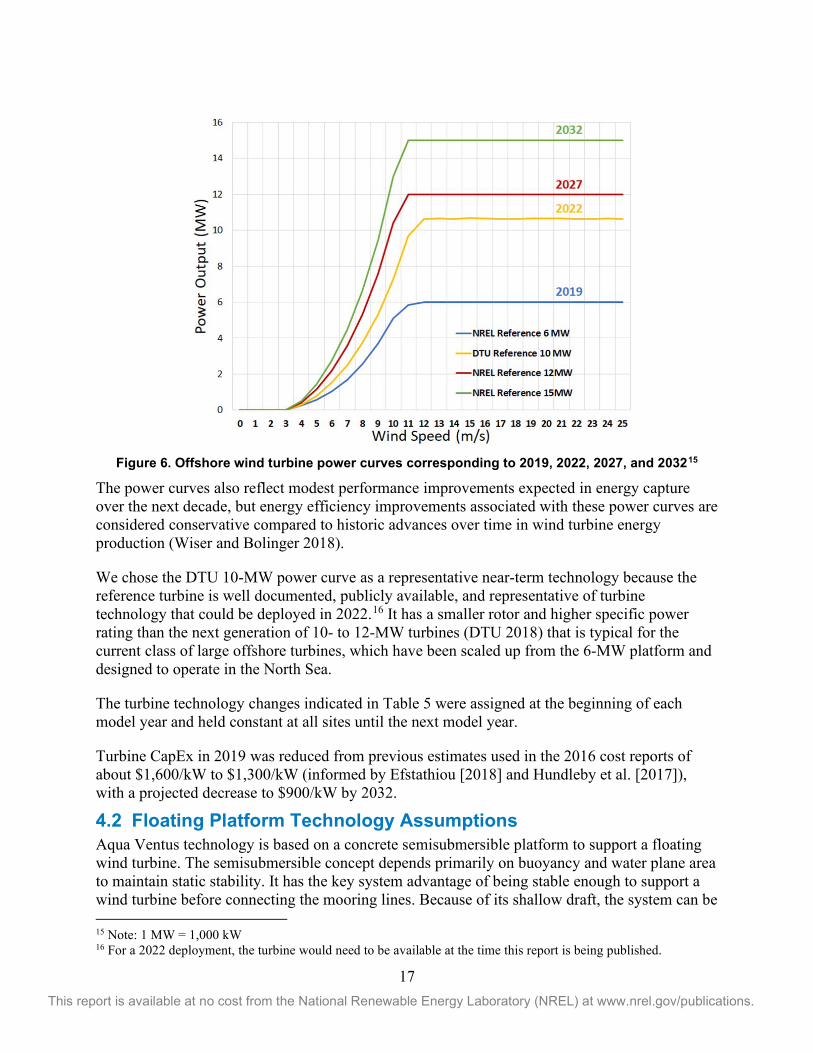
NREL developed power curves for each of the turbines indicated in Table 5, except for the 2022 10-MW power curve, which represents the Technical University of Denmark’s (DTU’s) 10-MW reference turbine (Bak 2013). These power curves are shown in Figure 6. Note that the 6-MW turbine assumed for 2019 is hypothetical. The current plan for Aqua Ventus is to use a turbine in the range of 9.5 MW to 12 MW for an expected COD year of 2022. This range of turbine sizes is consistent with the assumptions for commercial cost modeling presented in Table 5.
Typical features have been observed in all of today’s variable-speed, pitch-controlled wind turbine power curves. Cut-in wind speeds reach around 3 m/s when the turbine begins to produce power and enters Region 2 of the power curve. The power increases with wind speed until it reaches its rated power level at about 11 m/s.14 At rated power, power production levels off and is pitch regulated (Region 3) to maintain constant power until cut-out wind speed is reached at about 25 m/s. At cut-out, the turbine is automatically shut down by feathering the blades to a zero-power position. These power curves were corrected empirically in the shoulder region of the power curve near rated power (between Region 2 and 3), to roll off power gradually when transitioning to Region 3 (the regulated level power state between rated power and cut-out) to represent the actual behavior of turbine power curves in turbulent wind flow. These curves were validated by comparing with proprietary power curves from operating wind turbines.
13 Specific power is the ratio of a wind turbine’s nameplate capacity rating to its rotor-swept area. All else equal, a decline in specific power should lead to an increase in capacity factor. 14 The part of the power curve between cut-in and rated power is called Region 2. The part of the power curve where the pitch system is maintaining rated power is called Region 3.
17 This report is available at no cost from the National Renewable Energy Laboratory (NREL) at www.nrel.gov/publications.
Figure 6. Offshore wind turbine power curves corresponding to 2019, 2022, 2027, and 203215
The power curves also reflect modest performance improvements expected in energy capture over the next decade, but energy efficiency improvements associated with these power curves are considered conservative compared to historic advances over time in wind turbine energy production (Wiser and Bolinger 2018).
We chose the DTU 10-MW power curve as a representative near-term technology because the reference turbine is well documented, publicly available, and representative of turbine technology that could be deployed in 2022.16 It has a smaller rotor and higher specific power rating than the next generation of 10- to 12-MW turbines (DTU 2018) that is typical for the current class of large offshore turbines, which have been scaled up from the 6-MW platform and designed to operate in the North Sea.
The turbine technology changes indicated in Table 5 were assigned at the beginning of each model year and held constant at all sites until the next model year.
Turbine CapEx in 2019 was reduced from previous estimates used in the 2016 cost reports of about $1,600/kW to $1,300/kW (informed by Efstathiou [2018] and Hundleby et al. [2017]), with a projected decrease to $900/kW by 2032.
4.2 Floating Platform Technology Assumptions Aqua Ventus technology is based on a concrete semisubmersible platform to support a floating wind turbine. The semisubmersible concept depends primarily on buoyancy and water plane area to maintain static stability. It has the key system advantage of being stable enough to support a wind turbine before connecting the mooring lines. Because of its shallow draft, the system can be
15 Note: 1 MW = 1,000 kW 16 For a 2022 deployment, the turbine would need to be available at the time this report is being published.
18 This report is available at no cost from the National Renewable Energy Laboratory (NREL) at www.nrel.gov/publications.
fully assembled at quayside and towed to its open-ocean operating site with a minimal amount of expensive labor at sea. Semisubmersibles might also have an advantage with service as their mooring lines can be disconnected at sea and the entire system towed to shore for maintenance, thereby avoiding expensive lift vessels that may otherwise be required for repair of major components. Compared to a steel substructure, the concrete base material of a semisubmersible enables both local fabrication and increased tolerance to the corrosive environment at sea.
New concepts are under development that emulate some of the favorable deployment characteristics of the semisubmersible, which include stable turbine assembly, shallow draft access to coastal port facilities, and lower labor at sea (Weston 2019; Melis 2016). However, at the current state of the floating wind industry, the semisubmersible appears to be favored by many technology developers because of its simplicity in overcoming these fundamental deployment and assembly challenges. As of 2019, 94% of proposed floating projects globally are using semisubmersibles (Musial et al. 2019). In the long term, the optimum platform configuration for a given project will depend on site-specific variables, such as bathymetry, soil conditions, competing use constraints, and availability of vessels and infrastructure. As the market matures, the platform design that can deliver the lowest overall project costs will be favored.
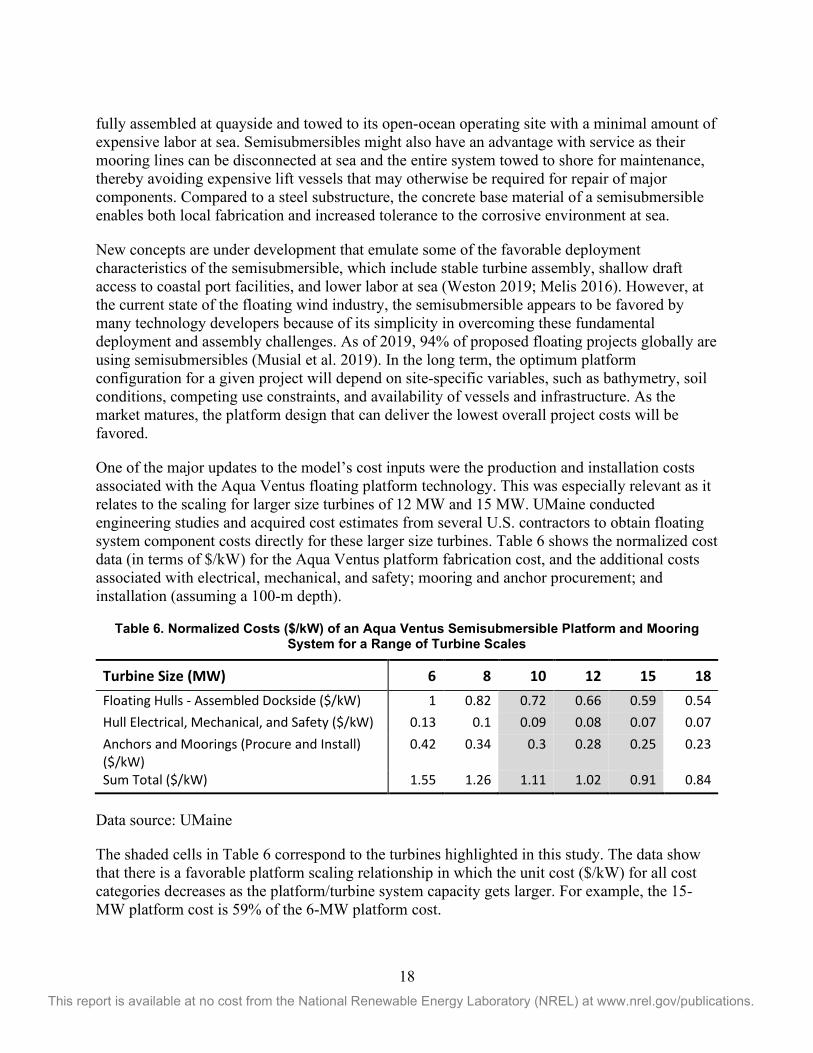
One of the major updates to the model’s cost inputs were the production and installation costs associated with the Aqua Ventus floating platform technology. This was especially relevant as it relates to the scaling for larger size turbines of 12 MW and 15 MW. UMaine conducted engineering studies and acquired cost estimates from several U.S. contractors to obtain floating system component costs directly for these larger size turbines. Table 6 shows the normalized cost data (in terms of $/kW) for the Aqua Ventus platform fabrication cost, and the additional costs associated with electrical, mechanical, and safety; mooring and anchor procurement; and installation (assuming a 100-m depth).
Table 6. Normalized Costs ($/kW) of an Aqua Ventus Semisubmersible Platform and Mooring System for a Range of Turbine Scales
Turbine Size (MW) 6 8 10 12 15 18 Floating Hulls - Assembled Dockside ($/kW) 1 0.82 0.72 0.66 0.59 0.54 Hull Electrical, Mechanical, and Safety ($/kW) 0.13 0.1 0.09 0.08 0.07 0.07 Anchors and Moorings (Procure and Install) ($/kW)
0.42 0.34 0.3 0.28 0.25 0.23
Sum Total ($/kW) 1.55 1.26 1.11 1.02 0.91 0.84
Data source: UMaine
The shaded cells in Table 6 correspond to the turbines highlighted in this study. The data show that there is a favorable platform scaling relationship in which the unit cost ($/kW) for all cost categories decreases as the platform/turbine system capacity gets larger. For example, the 15-MW platform cost is 59% of the 6-MW platform cost.
19 This report is available at no cost from the National Renewable Energy Laboratory (NREL) at www.nrel.gov/publications.
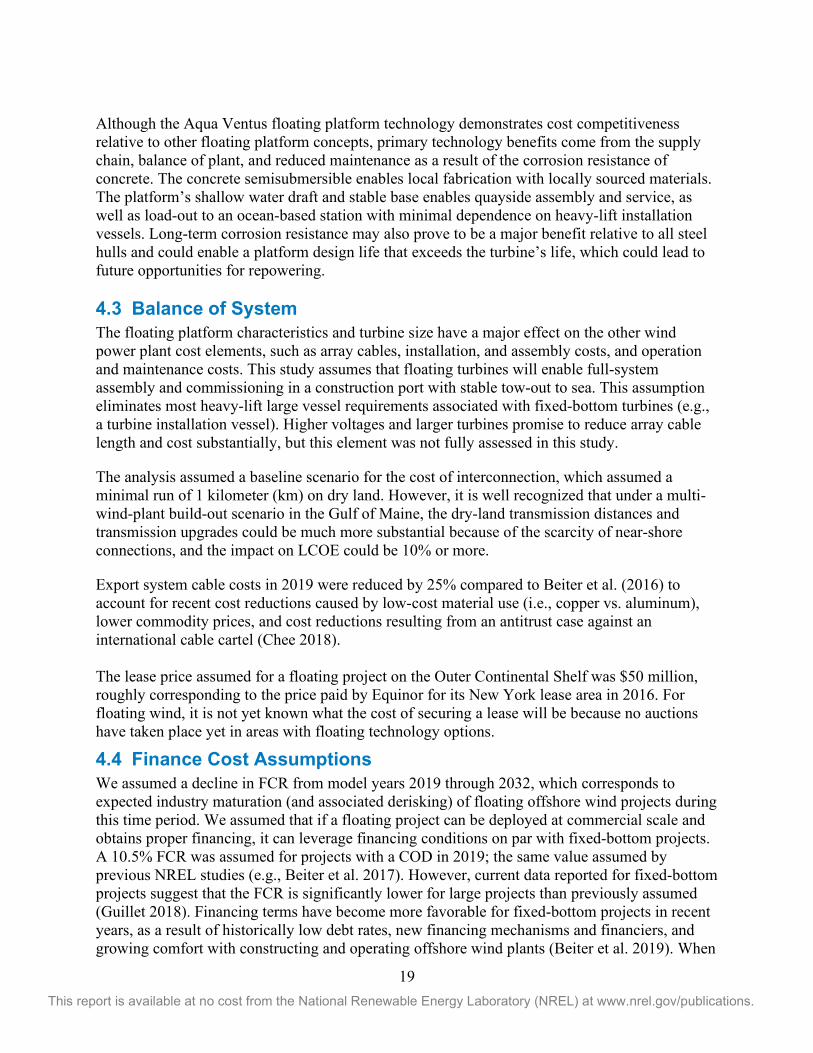
Although the Aqua Ventus floating platform technology demonstrates cost competitiveness relative to other floating platform concepts, primary technology benefits come from the supply chain, balance of plant, and reduced maintenance as a result of the corrosion resistance of concrete. The concrete semisubmersible enables local fabrication with locally sourced materials. The platform’s shallow water draft and stable base enables quayside assembly and service, as well as load-out to an ocean-based station with minimal dependence on heavy-lift installation vessels. Long-term corrosion resistance may also prove to be a major benefit relative to all steel hulls and could enable a platform design life that exceeds the turbine’s life, which could lead to future opportunities for repowering. 4.3 Balance of System The floating platform characteristics and turbine size have a major effect on the other wind power plant cost elements, such as array cables, installation, and assembly costs, and operation and maintenance costs. This study assumes that floating turbines will enable full-system assembly and commissioning in a construction port with stable tow-out to sea. This assumption eliminates most heavy-lift large vessel requirements associated with fixed-bottom turbines (e.g., a turbine installation vessel). Higher voltages and larger turbines promise to reduce array cable length and cost substantially, but this element was not fully assessed in this study.
The analysis assumed a baseline scenario for the cost of interconnection, which assumed a minimal run of 1 kilometer (km) on dry land. However, it is well recognized that under a multi-wind-plant build-out scenario in the Gulf of Maine, the dry-land transmission distances and transmission upgrades could be much more substantial because of the scarcity of near-shore connections, and the impact on LCOE could be 10% or more.
Export system cable costs in 2019 were reduced by 25% compared to Beiter et al. (2016) to account for recent cost reductions caused by low-cost material use (i.e., copper vs. aluminum), lower commodity prices, and cost reductions resulting from an antitrust case against an international cable cartel (Chee 2018). The lease price assumed for a floating project on the Outer Continental Shelf was $50 million, roughly corresponding to the price paid by Equinor for its New York lease area in 2016. For floating wind, it is not yet known what the cost of securing a lease will be because no auctions have taken place yet in areas with floating technology options.
4.4 Finance Cost Assumptions We assumed a decline in FCR from model years 2019 through 2032, which corresponds to expected industry maturation (and associated derisking) of floating offshore wind projects during this time period. We assumed that if a floating project can be deployed at commercial scale and obtains proper financing, it can leverage financing conditions on par with fixed-bottom projects. A 10.5% FCR was assumed for projects with a COD in 2019; the same value assumed by previous NREL studies (e.g., Beiter et al. 2017). However, current data reported for fixed-bottom projects suggest that the FCR is significantly lower for large projects than previously assumed (Guillet 2018). Financing terms have become more favorable for fixed-bottom projects in recent years, as a result of historically low debt rates, new financing mechanisms and financiers, and growing comfort with constructing and operating offshore wind plants (Beiter et al. 2019). When
20 This report is available at no cost from the National Renewable Energy Laboratory (NREL) at www.nrel.gov/publications.
the floating wind market reaches the same level of maturity, demonstrated by projects that are planned, permitted, approved, and financed on the same scale as current fixed-bottom wind projects, we assume that the technology will have achieved the same investment risk profile. Currently, this risk profile is reported to attract FCRs as low as 7%. Therefore, in this analysis, the FCR was reduced to 7.18% for large-scale, commercial floating projects installed in 2022, 2027, or 2032.
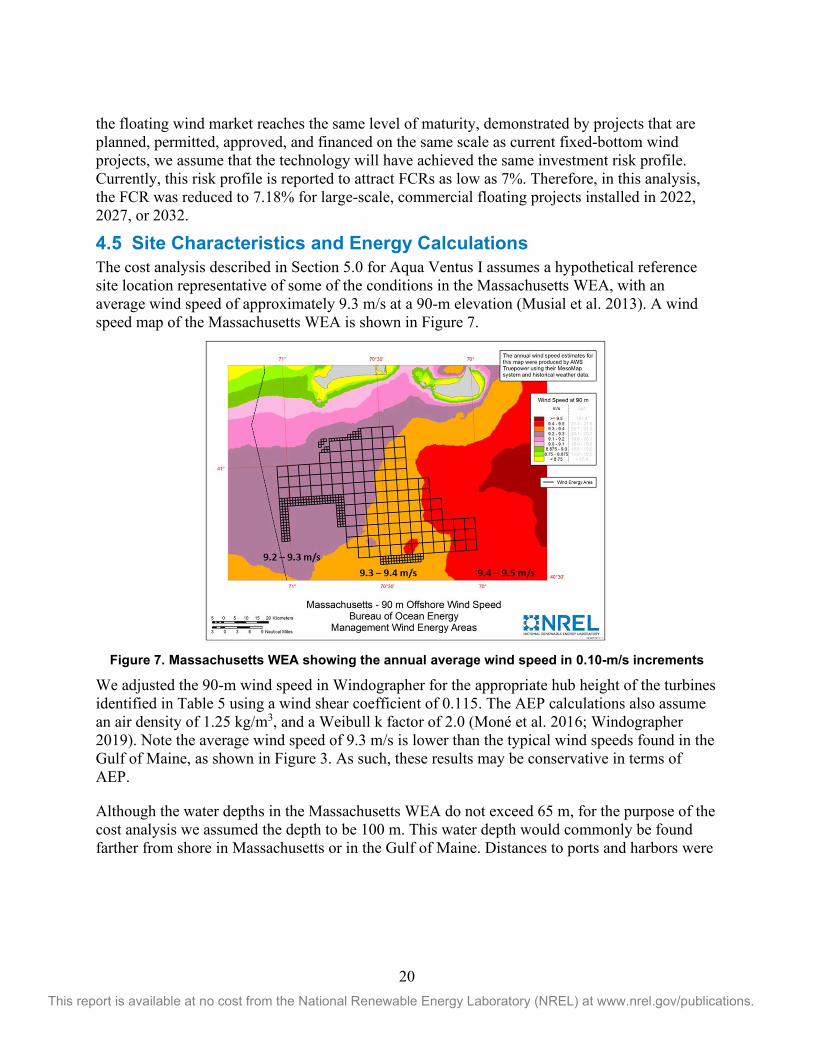
4.5 Site Characteristics and Energy Calculations The cost analysis described in Section 5.0 for Aqua Ventus I assumes a hypothetical reference site location representative of some of the conditions in the Massachusetts WEA, with an average wind speed of approximately 9.3 m/s at a 90-m elevation (Musial et al. 2013). A wind speed map of the Massachusetts WEA is shown in Figure 7.
Figure 7. Massachusetts WEA showing the annual average wind speed in 0.10-m/s increments
We adjusted the 90-m wind speed in Windographer for the appropriate hub height of the turbines identified in Table 5 using a wind shear coefficient of 0.115. The AEP calculations also assume an air density of 1.25 kg/m3, and a Weibull k factor of 2.0 (Moné et al. 2016; Windographer 2019). Note the average wind speed of 9.3 m/s is lower than the typical wind speeds found in the Gulf of Maine, as shown in Figure 3. As such, these results may be conservative in terms of AEP.
Although the water depths in the Massachusetts WEA do not exceed 65 m, for the purpose of the cost analysis we assumed the depth to be 100 m. This water depth would commonly be found farther from shore in Massachusetts or in the Gulf of Maine. Distances to ports and harbors were
21 This report is available at no cost from the National Renewable Energy Laboratory (NREL) at www.nrel.gov/publications.
taken directly from cost assessments made in earlier studies and are representative of a project in either the Gulf of Maine or the Massachusetts WEA (Moné et al. 2016).17
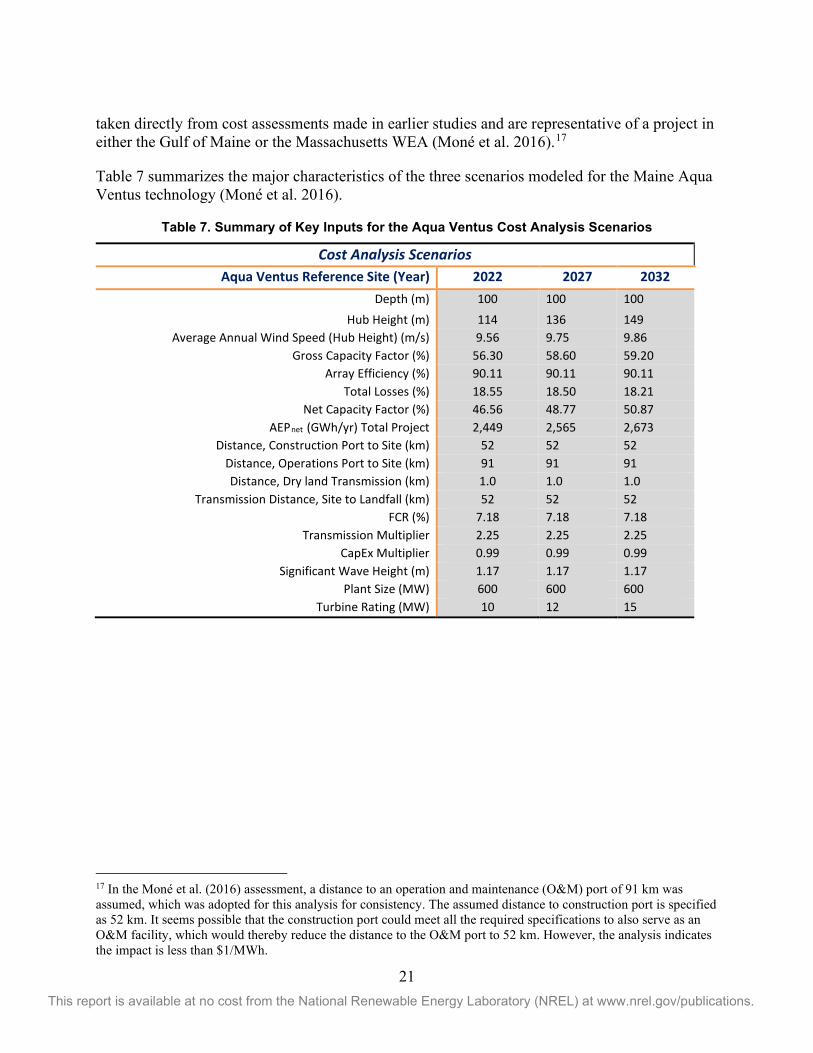
Table 7 summarizes the major characteristics of the three scenarios modeled for the Maine Aqua Ventus technology (Moné et al. 2016).
Table 7. Summary of Key Inputs for the Aqua Ventus Cost Analysis Scenarios
Cost Analysis Scenarios Aqua Ventus Reference Site (Year) 2022 2027 2032
Depth (m) 100 100 100 Hub Height (m) 114 136 149
Average Annual Wind Speed (Hub Height) (m/s) 9.56 9.75 9.86 Gross Capacity Factor (%) 56.30 58.60 59.20
Array Efficiency (%) 90.11 90.11 90.11 Total Losses (%) 18.55 18.50 18.21
Net Capacity Factor (%) 46.56 48.77 50.87 AEPnet (GWh/yr) Total Project 2,449 2,565 2,673
Distance, Construction Port to Site (km) 52 52 52 Distance, Operations Port to Site (km) 91 91 91 Distance, Dry land Transmission (km) 1.0 1.0 1.0
Transmission Distance, Site to Landfall (km) 52 52 52 FCR (%) 7.18 7.18 7.18
Transmission Multiplier 2.25 2.25 2.25 CapEx Multiplier 0.99 0.99 0.99
Significant Wave Height (m) 1.17 1.17 1.17 Plant Size (MW) 600 600 600
Turbine Rating (MW) 10 12 15
17 In the Moné et al. (2016) assessment, a distance to an operation and maintenance (O&M) port of 91 km was assumed, which was adopted for this analysis for consistency. The assumed distance to construction port is specified as 52 km. It seems possible that the construction port could meet all the required specifications to also serve as an O&M facility, which would thereby reduce the distance to the O&M port to 52 km. However, the analysis indicates the impact is less than $1/MWh.
22 This report is available at no cost from the National Renewable Energy Laboratory (NREL) at www.nrel.gov/publications.
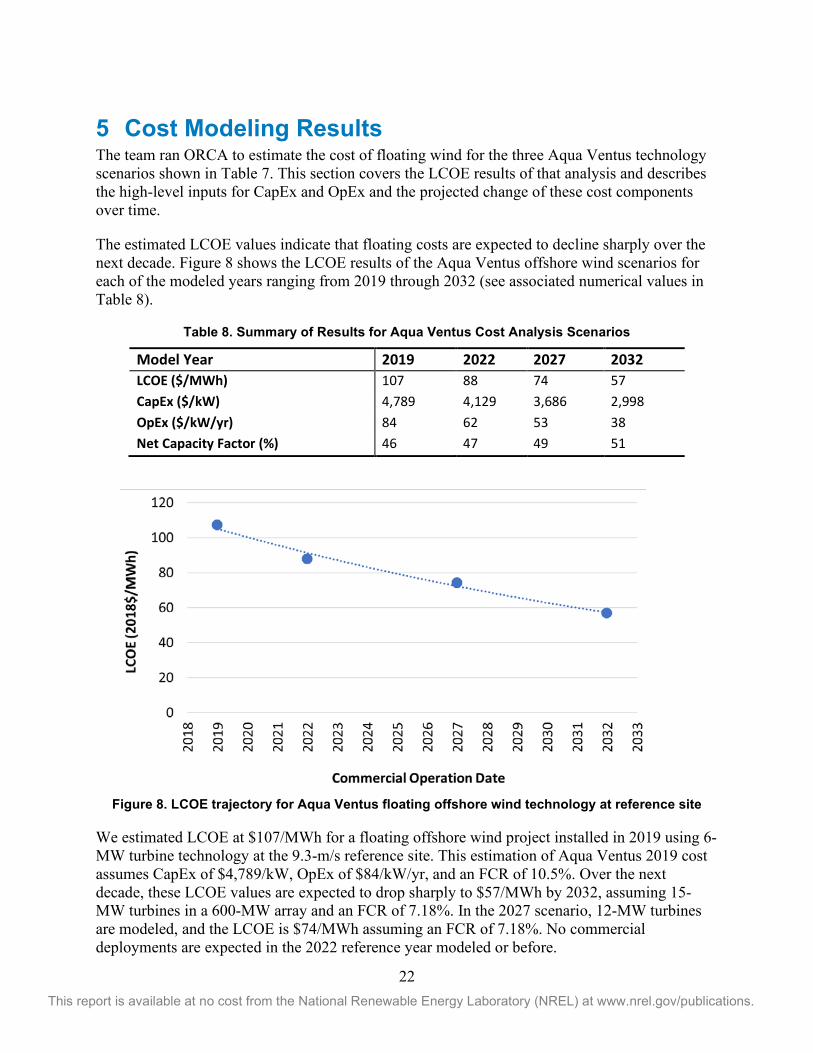
5 Cost Modeling Results The team ran ORCA to estimate the cost of floating wind for the three Aqua Ventus technology scenarios shown in Table 7. This section covers the LCOE results of that analysis and describes the high-level inputs for CapEx and OpEx and the projected change of these cost components over time.
The estimated LCOE values indicate that floating costs are expected to decline sharply over the next decade. Figure 8 shows the LCOE results of the Aqua Ventus offshore wind scenarios for each of the modeled years ranging from 2019 through 2032 (see associated numerical values in Table 8).
Table 8. Summary of Results for Aqua Ventus Cost Analysis Scenarios
Model Year 2019 2022 2027 2032 LCOE ($/MWh) 107 88 74 57 CapEx ($/kW) 4,789 4,129 3,686 2,998 OpEx ($/kW/yr) 84 62 53 38 Net Capacity Factor (%) 46 47 49 51
Figure 8. LCOE trajectory for Aqua Ventus floating offshore wind technology at reference site
We estimated LCOE at $107/MWh for a floating offshore wind project installed in 2019 using 6-MW turbine technology at the 9.3-m/s reference site. This estimation of Aqua Ventus 2019 cost assumes CapEx of $4,789/kW, OpEx of $84/kW/yr, and an FCR of 10.5%. Over the next decade, these LCOE values are expected to drop sharply to $57/MWh by 2032, assuming 15-MW turbines in a 600-MW array and an FCR of 7.18%. In the 2027 scenario, 12-MW turbines are modeled, and the LCOE is $74/MWh assuming an FCR of 7.18%. No commercial deployments are expected in the 2022 reference year modeled or before.
23 This report is available at no cost from the National Renewable Energy Laboratory (NREL) at www.nrel.gov/publications.
These modeled cost assumptions may be conservative for a few reasons:
• Array losses are likely to be lower than predicted, which should result in higher AEPnet. Turbine and wind plant technology are advancing rapidly, and turbine accessibility (e.g., availability) is expected to improve. Therefore, future wind plant energy gains may not be fully captured in the model, which assumes 18.7% losses for all years.
• Wind power plant scale was held at 600 MW because the spatial relationships in ORCA were originally based on this project size. Preliminary sensitivity analysis conducted by NREL suggests that the difference between a 600-MW and 1,000-MW wind farm could reduce LCOE by approximately 3%−6%. These scaling changes were not included in this version of the model.
• Wind speeds in the Gulf of Maine may be higher in some sites than the modeled reference site (see Figure 3).
• Wind turbine technology may advance faster than anticipated by this analysis. The timeline used is based on NREL’s best engineering judgment given previous market trends, but recent bullish market behavior could indicate accelerated technology development.
Other considerations that create model uncertainty or could increase the costs include the following:
• Cost projections (i.e., 2019 through 2032) are linked to a set of technology innovations that are not yet commercially available.
• Speculation over offshore wind cost depends on future European market price points that have not yet been realized. Costs are assumed to be at or below the adjusted price points shown in Figure 5, but hidden market factors could reduce the validity of this assumption.
• Interconnection upgrades and grid integration costs have not been included in the model beyond the 1 km of land-based transmission infrastructure from cable landfall to a point of interconnection. Transmission costs would add significant increases to the LCOE if they were included in the project development costs.
• No market data exist to support the $50 million cost of securing site control for a floating lease area in the United States.
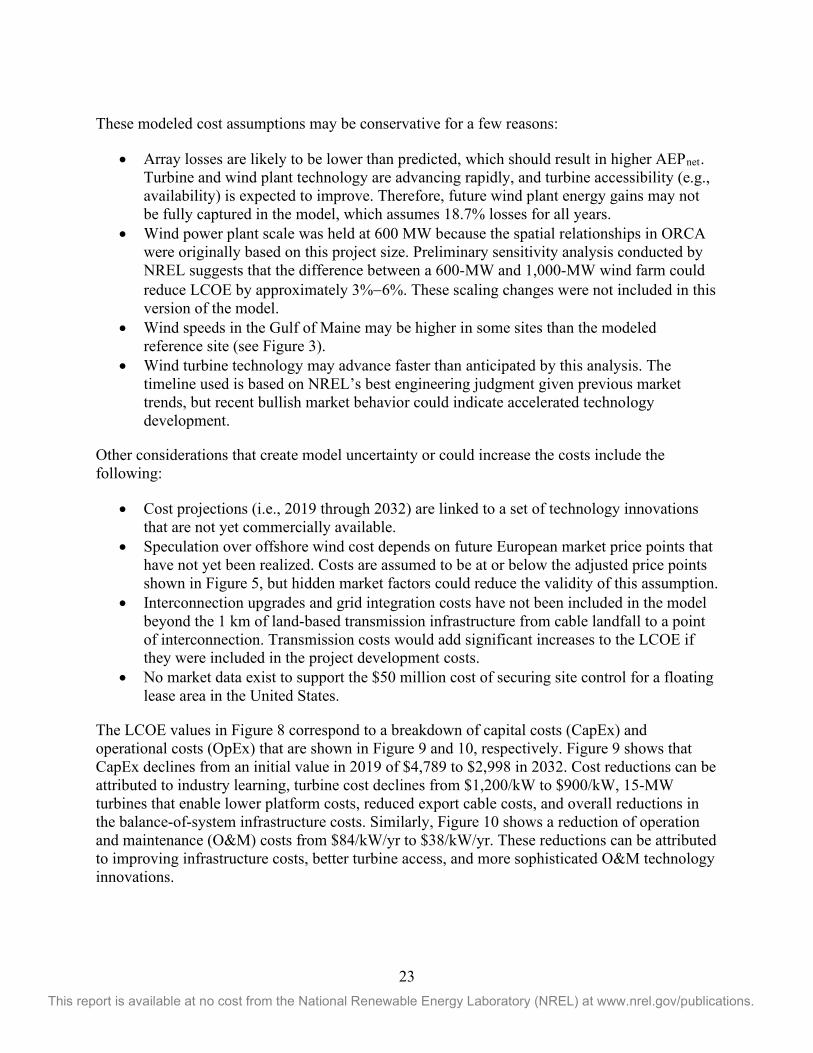
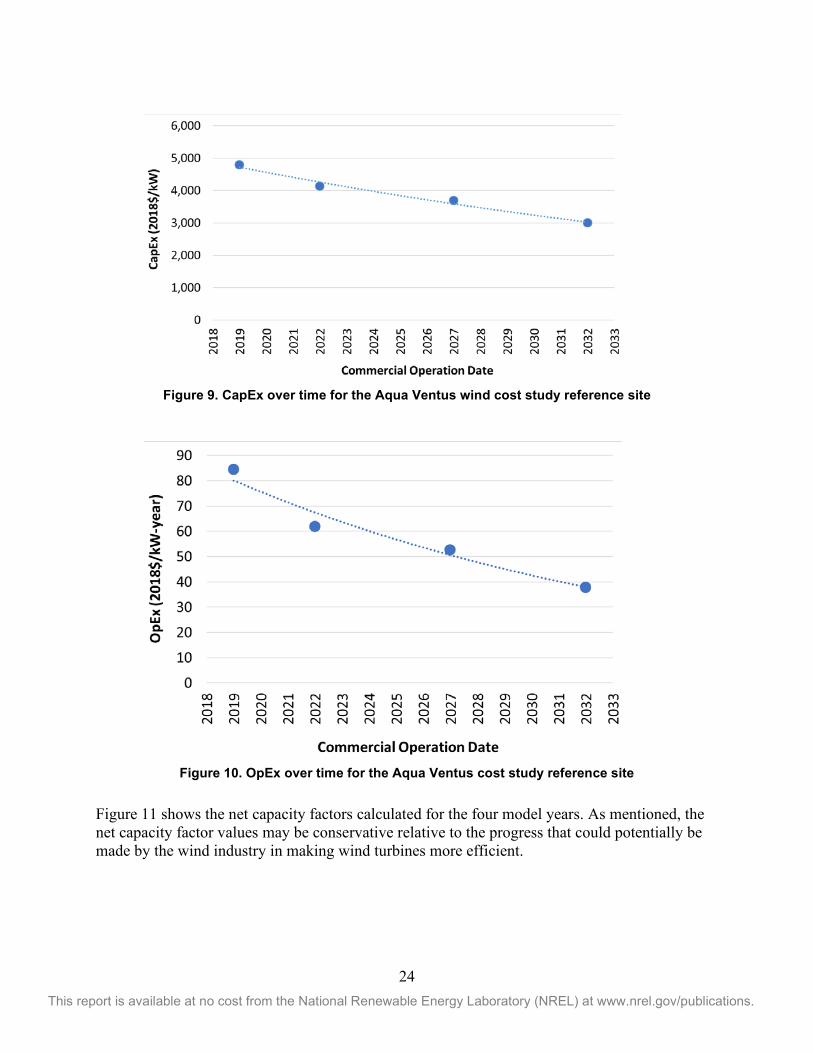
The LCOE values in Figure 8 correspond to a breakdown of capital costs (CapEx) and operational costs (OpEx) that are shown in Figure 9 and 10, respectively. Figure 9 shows that CapEx declines from an initial value in 2019 of $4,789 to $2,998 in 2032. Cost reductions can be attributed to industry learning, turbine cost declines from $1,200/kW to $900/kW, 15-MW turbines that enable lower platform costs, reduced export cable costs, and overall reductions in the balance-of-system infrastructure costs. Similarly, Figure 10 shows a reduction of operation and maintenance (O&M) costs from $84/kW/yr to $38/kW/yr. These reductions can be attributed to improving infrastructure costs, better turbine access, and more sophisticated O&M technology innovations.
24 This report is available at no cost from the National Renewable Energy Laboratory (NREL) at www.nrel.gov/publications.
Figure 9. CapEx over time for the Aqua Ventus wind cost study reference site
Figure 10. OpEx over time for the Aqua Ventus cost study reference site
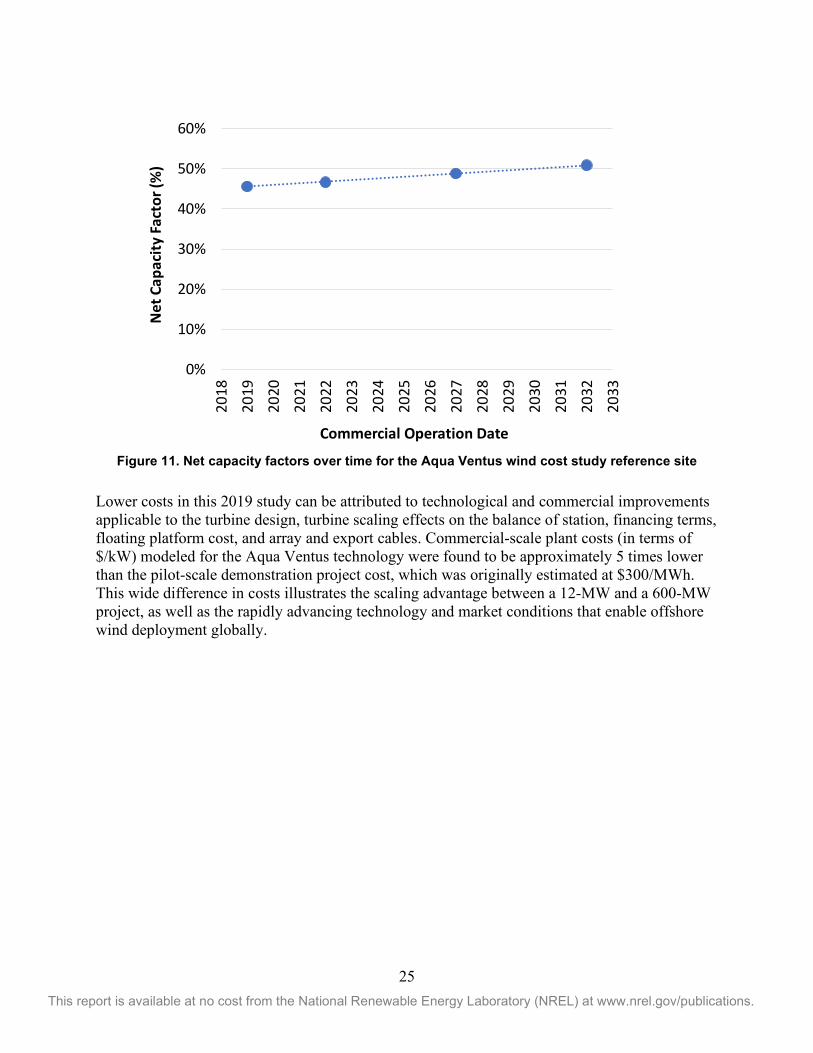
Figure 11 shows the net capacity factors calculated for the four model years. As mentioned, the net capacity factor values may be conservative relative to the progress that could potentially be made by the wind industry in making wind turbines more efficient.
25 This report is available at no cost from the National Renewable Energy Laboratory (NREL) at www.nrel.gov/publications.
Figure 11. Net capacity factors over time for the Aqua Ventus wind cost study reference site
Lower costs in this 2019 study can be attributed to technological and commercial improvements applicable to the turbine design, turbine scaling effects on the balance of station, financing terms, floating platform cost, and array and export cables. Commercial-scale plant costs (in terms of $/kW) modeled for the Aqua Ventus technology were found to be approximately 5 times lower than the pilot-scale demonstration project cost, which was originally estimated at $300/MWh. This wide difference in costs illustrates the scaling advantage between a 12-MW and a 600-MW project, as well as the rapidly advancing technology and market conditions that enable offshore wind deployment globally.
0%
10%
20%
30%
40%
50%
60%
2018
2019
2020
2021
2022
2023
2024
2025
2026
2027
2028
2029
2030
2031
2032
2033
Net
Cap
acity
Fac
tor (
%)
Commercial Operation Date
26 This report is available at no cost from the National Renewable Energy Laboratory (NREL) at www.nrel.gov/publications.
6 Conclusions From the cost analysis presented in this report, we highlight the following key conclusions:
• The offshore wind resource in the state of Maine exceeds 94 gigawatts of capacity, with about 88% in waters deeper than 60 m.
• Maine offshore wind resources could potentially provide significant power to the New England power grid to serve load in northern Massachusetts, New Hampshire, and Maine.
• Floating technology is needed if wind energy is to develop significantly in Maine because
shallow offshore wind resources (< 60-m depth) are close to shore and would be more severely impacted by competing use and coastal viewshed issues.
• The modeled levelized cost of energy for floating wind in Maine using the Aqua Ventus technology declined to $74/MWh by 2027 and $57/MWh by 2032 for a 600-MW floating wind power plant at a 9.3-m/s wind reference site. These costs may be competitive with other electric generation sources in Maine, but further analysis would be needed to assess economic potential. The years that these costs are realized are based on NREL assumptions for turbine growth and could change.
• The floating wind costs modeled in this report are lower than previous estimates made for Aqua Ventus in 2016 (e.g., $77/MWh for a 10-MW turbine operating in a 1,000-MW wind plant [Moné et al. 2016]) because of technological and commercial advances related to turbine cost, turbine scale, financing terms, platform cost, turbine availability, and many other system cost elements that have declined since 2016.
• Costs modeled for the commercial-scale Aqua Ventus technology operating with a 15-MW turbine are approximately 5 times lower than the pilot-scale demonstration cost that was calculated previously to be $300/MWh. This wide difference in cost reflects the advantage of the 600-MW commercial-scale project, as well as the rapidly advancing technology and market conditions that are enabling offshore wind globally.
• Aqua Ventus floating platform technology demonstrated cost competitiveness relative to other floating platform concepts; however, the low cost of the platform is not the primary technology driver. The concrete semisubmersible enables local fabrication with locally sourced materials. The platform’s shallow water draft and stable base enables quayside assembly and service, as well as load-out to an ocean-based station with minimal dependence on heavy-lift installation vessels. Long-term corrosion resistance offered by concrete may also prove to be a major benefit.
27 This report is available at no cost from the National Renewable Energy Laboratory (NREL) at www.nrel.gov/publications.
References 4C Offshore. 2019. Global Offshore Wind Farms Intelligence. http://www.4coffshore.com/windfarms/request.aspx?id=owfdb.
AWS Truepower, LLC. 2014. “AWS Truepower Loss and Uncertainty Methods.” Memorandum. June 5, 2014. https://www.awstruepower.com/assets/AWS-Truepower-Loss-and-Uncertainty-Memorandum-5-Jun-2014.pdf.
Bak, C., F. Zahle, R. Bitsche, T. Kim, A. Yde, L. C. Henriksen, A. Natarajan. 2013. The DTU 10 MW Reference Wind Turbine. Danish Technical University. http://orbit.dtu.dk/files/55645274/The_DTU_10MW_Reference_Turbine_Christian_Bak.pdf.
Beiter, P., W. Musial, A. Smith, L. Kilcher, R. Damiani, M. Maness, S. Sirnivas, T. Stehly, V. Gevorgian, M. Mooney, G. Scott. 2016. A Spatial-Economic Cost Reduction Pathway Analysis for U.S. Offshore Wind Energy Development from 2015–2030 (Technical Report). NREL/TP-6A20-66579. National Renewable Energy Laboratory (NREL), Golden, CO (US). nrel.gov/docs/fy16/66579.pdf.
Beiter P., W. Musial, L. Kilcher, M. Maness, A. Smith. 2017. An Assessment of the Economic Potential of Offshore Wind in the United States from 2015 to 2030 (Technical Report). NREL/TP-6A20-67675. National Renewable Energy Laboratory, Golden, CO (US). http://www.nrel.gov/docs/fy17osti/67675.pdf.
Beiter, P., P. Spitsen, W. Musial, and E. Lantz. 2019. The Vineyard Wind Power Purchase Agreement: Insights for Estimating Costs of U.S. Offshore Wind Projects (Technical Report). NREL/TP-5000-72981. National Renewable Energy Laboratory. https://www.nrel.gov/docs/fy19osti/72981.pdf.
Bloomberg New Energy Finance. 2018. 2H 2018 Offshore Wind Market Outlook. https://about.bnef.com/.
Chee, F. Y. 2018. “Goldman Sachs, Prysmian, Others Lose Challenge against EU Cartel Fine.” Reuters, July 12, 2018. https://www.reuters.com/article/us-eu-cartel-court/goldman-sachs-prysmian-others-lose-challenge-against-eu-cartel-fine-idUSKBN1K21DY.
Energy Information Administration. 2019. “State Electricity Profiles.” Data for 2017. Release Date: January 8, 2019. https://www.eia.gov/electricity/state/.
Efstathiou, Jim. 2018. “First Big U.S. Offshore Wind Farm Offers $1.4 Billion to Customers.” Bloomberg New Energy Finance, August 1, 2018. https://www.bloomberg.com/news/articles/2018-08-01/first-big-u-s-offshore-wind-offers-1-4-billion-to-customers.
GE Renewable Energy. 2018. “Driving efficiency and decreasing the cost of offshore wind energy.” Accessed May 2018. https://www.ge.com/renewableenergy/wind-energy/turbines/haliade-x-offshore-turbine.
28 This report is available at no cost from the National Renewable Energy Laboratory (NREL) at www.nrel.gov/publications.
Gilman, P., B. Maurer, L. Feinberg, A. Duerr, L. Peterson, W. Musial, P. Beiter, J. Golladay, J. Stromberg, I. Johnson, D. Boren, A. Moore. 2016. National Offshore Wind Strategy; Facilitating the Development of the Offshore Wind Industry in the United States. DOE/GO-102016-4866. Washington, D.C.: U.S. Department of Energy Office of Energy Efficiency & Renewable Energy; U.S. Department of the Interior. https://energy.gov/sites/prod/files/2016/09/f33/National-Offshore-Wind-Strategy-report-09082016.pdf.
Guillet, Jerome. 2018. “Who will fund U.S. Offshore Wind and on what terms?” presented at the Offshore Wind Implementation Summit, Teaneck, New Jersey, September 7. https://green-giraffe.eu/presentations/who-will-fund-us-offshore-wind-%E2%80%93-and-what-terms.
Hundleby, G, K. Freeman, A. Logan, and C. Frost. 2017. “Floating Offshore: 55 Technology Innovations That Will Have Greater Impact on Reducing the Cost of Electricity from European Floating Offshore Wind Farms.” KiC InnoEnergy and BVG Associates. https://bvgassociates.com/new-floating-offshore-wind-report/.
International Electrotechnical Commission (IEC) 2019. IEC 61400-1 Edition 3, Wind turbines—Part 1: Design requirements. https://www.iec.ch/dyn/www/f?p=103:23:27965083281002::::FSP_ORG_ID,FSP_LANG_ID:1282,25.
Maness, M., B. Maples, A. Smith. 2017. NREL Offshore Balance-of-System Model (Technical Report). NREL/TP-6A20-66874. National Renewable Energy Laboratory (NREL), Golden, CO (US). www.nrel.gov/docs/fy17osti/66874.pdf.
Melis, C., C. Bauduin, A. Wattez, A. Newport, Y. Poirette, T. Perdrizet, T., et al. 2016. “Adapting tension leg technology to provide an economical solution for floating wind power.” In: Offshore Technology Conference. OTC-27153-MS; 2016. https://www.onepetro.org/conference-paper/OTC-27153-MS.
Mills, J. 2019. “An Order Concluding the Maine Wind Advisory Commission and Wind Permit Moratorium.” Office of the Governor. February 14, 2019. https://www.maine.gov/governor/mills/sites/maine.gov.governor.mills/files/inline-files/EO%20Wind.pdf .
Moné, C., T. Stehly, and W. Musial. 2016. Levelized Cost of Energy Analysis using a Floating Concrete Semi-submersible Foundation for the University of Maine, Unpublished contractor report, April 24, 2016.
MHI Vestas. 2018. “Vineyard Wind Selects MHI Vestas as Preferred Supplier for First Large-scale Offshore Wind Project in the United States.” November 27, 2018. http://www.mhivestasoffshore.com.
Musial, W., Z. Parker, J. Fields, G. Scott, and C. Draxl. 2013. Assessment of Offshore Wind Energy Leasing Areas for the BOEM Massachusetts Wind Energy Area (Technical Report).
29 This report is available at no cost from the National Renewable Energy Laboratory (NREL) at www.nrel.gov/publications.
National Renewable Energy Laboratory (NREL), Golden, CO. NREL/TP-5000-60942. http://www.nrel.gov/docs/fy14osti/60942.pdf.
Musial, W., P. Beiter, D. Heimiller, and G. Scott. 2016a. 2016 Offshore Wind Energy Resource Assessment for the United States (Technical Report). NREL/TP-5000-66599. National Renewable Energy Laboratory (NREL), Golden, CO (US). http://www.nrel.gov/docs/fy16osti/66599.pdf.
Musial, Walt, P. Beiter, S. Tegen, and A. Smith. 2016b. Potential Offshore Wind Energy Areas in California: An Assessment of Locations, Technology, and Costs (Technical Report). NREL/TP-5000-67414. National Renewable Energy Laboratory. Golden, CO. https://www.boem.gov/2016-074/.
Musial, W. 2018. Offshore Wind Resource, Cost, and Economic Potential in the State of Maine (Technical Report). NREL/TP-5000-70907. National Renewable Energy Laboratory. Golden, CO. https://www.nrel.gov/docs/fy18osti/70907.pdf.
Musial, W., P. Beiter, P. Spitsen, J. Nunemaker, and V. Gevorgian. 2019a. 2018 Offshore Wind Technologies Market Report (Technical Report). Washington, D.C.: U.S. Department of Energy Office of Energy Efficiency & Renewable Energy. https://www.energy.gov/eere/wind/downloads/2018-offshore-wind-market-report.
Musial, W., P. Beiter, J. Nunemaker, D. Heimiller, J. Ahmann, and J. Busch. 2019b. Oregon Offshore Wind Site Feasibility and Cost Study. NREL/TP-5000-74597. nrel.gov/docs/fy20osti/74597.pdf.
Richard, C. 2019. “MHI Vestas in line to supply first V174 turbines,” Windpower Offshore, February 2019. https://www.windpoweroffshore.com/article/1525372/mhi-vestas-line-supply-first-v174-turbines.
Shumkov, I. 2019. “Maine's PUC greenlights PPA for 12-MW floating wind demonstrator.” Renewables Now. November 6, 2019. https://renewablesnow.com/news/maines-puc-greenlights-ppa-for-12-mw-floating-wind-demonstrator-675266/.
Siemens. 2019. “Siemens Gamesa launches 10 MW offshore wind turbine; annual energy production (AEP) increase of 30% vs. predecessor.” https://www.siemensgamesa.com/en-int/newsroom/2019/01/new-siemens-gamesa-10-mw-offshore-wind-turbine-sg-10-0-193-dd.
Stromsta, K.-E. 2019. “GE Lands First Orders for 12MW Offshore Wind Turbine, and They’re Huge.” Greentech Media, September 19, 2019. https://www.greentechmedia.com/articles/read/ge-wins-lands-first-big-deals-for-12mw-offshore-wind-turbine#gs.55ncxk.
Turkel, T. 2019. “Mills signs wind bill, announces plans to advance offshore energy.” https://www.pressherald.com/2019/06/19/mills-signs-wind-bill-announces-plans-to-advance-offshore-energy.
30 This report is available at no cost from the National Renewable Energy Laboratory (NREL) at www.nrel.gov/publications.
University of Maine. 2019. Aqua Ventus home page. Accessed June 2019. http://maineaquaventus.com.
U.S. Department of Energy. 2019. “Advanced Technology Demonstration Projects.” Accessed June 15, 2019. https://www.energy.gov/eere/wind/offshore-wind-advanced-technology-demonstration-projects. Valpy, B., P. English, A. Martínez, and E. Simonot. 2014. Future Renewable Energy Costs: Offshore Wind (Technical Report). Cricklade, U.K.: BVG Associates. http://www.kic-innoenergy.com/wpcontent/uploads/2014/09/KIC_IE_OffshoreWind_anticipated_innovations_impact1.pdf.
Villaespesa, E. B., Gonzalez, C. M., Martin, N. G. K. 2015. Transportation and Installation of the Tetraspar Floating Offshore Wind Turbine. Tech. Rep.; Aalborg University; Aalborg, Denmark. https://projekter.aau.dk/projekter/files/281663582/Master_Thesis.pdf.
Weston, D. 2019. “Stiesdal’s TetraSpar demo gets go-ahead.” WindPower Offshore. February 13, 2019. https://www.windpoweroffshore.com/article/1525677/stiesdals-tetraspar-demo-gets-go-ahead.
Wind Europe. 2018. “Floating Offshore Wind Energy: A Policy Blueprint for Europe.” https://windeurope.org/wp-content/uploads/files/policy/position-papers/Floating-offshore-wind-energy-a-policy-blueprint-for-Europe.pdf.
Windographer. 2019. Windographer Resource Assessment Software. Accessed June 2019. https://www.windographer.com.
Wiser, R., and M. Bolinger. 2018. “2017 Wind Technologies Market Report.” DOE/EE-1798. U.S. Department of Energy Office of Energy Efficiency and Renewable Energy. https://emp.lbl.gov/sites/default/files/2017_wind_technologies_market_report.pdf.

31 This report is available at no cost from the National Renewable Energy Laboratory (NREL) at www.nrel.gov/publications.
Appendix A – Cost Data Tables A.1–A.3 contain the cost values used for the Aqua Ventus cost analysis for the 10-MW, 12-MW, and 15-MW turbines, respectively.
Table A.1. Summary of Cost Data for Aqua Ventus with a 10-MW Turbine
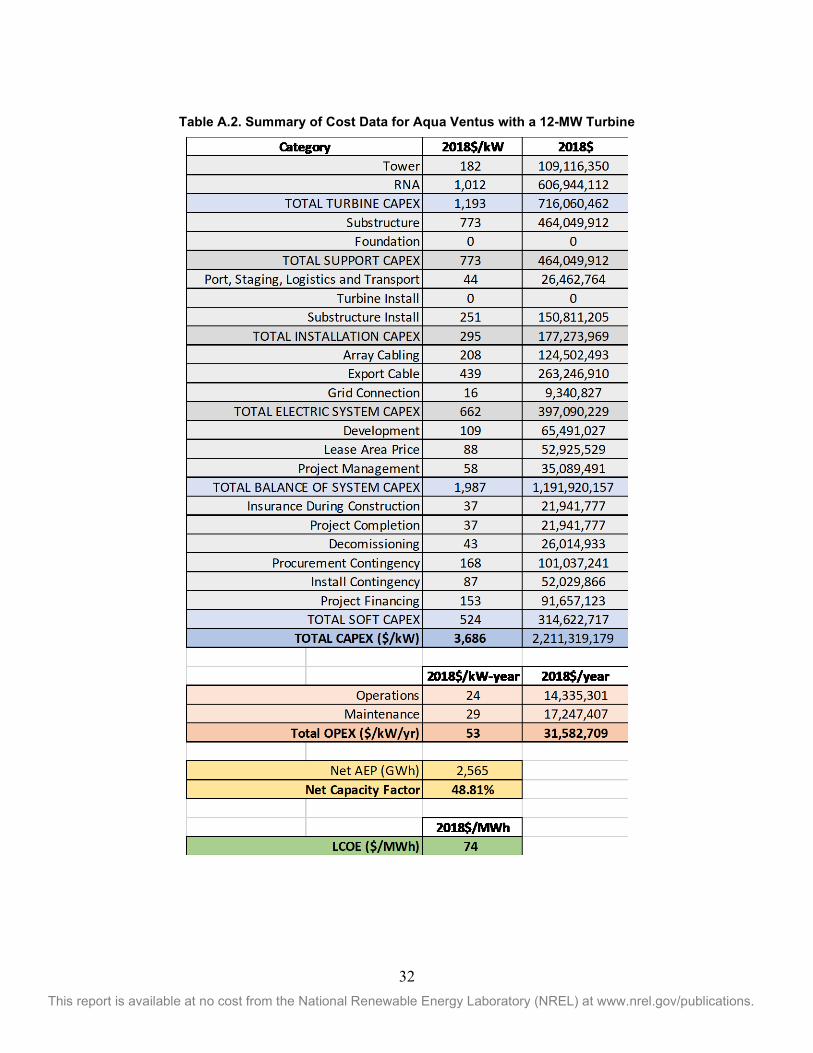
32 This report is available at no cost from the National Renewable Energy Laboratory (NREL) at www.nrel.gov/publications.
Table A.2. Summary of Cost Data for Aqua Ventus with a 12-MW Turbine
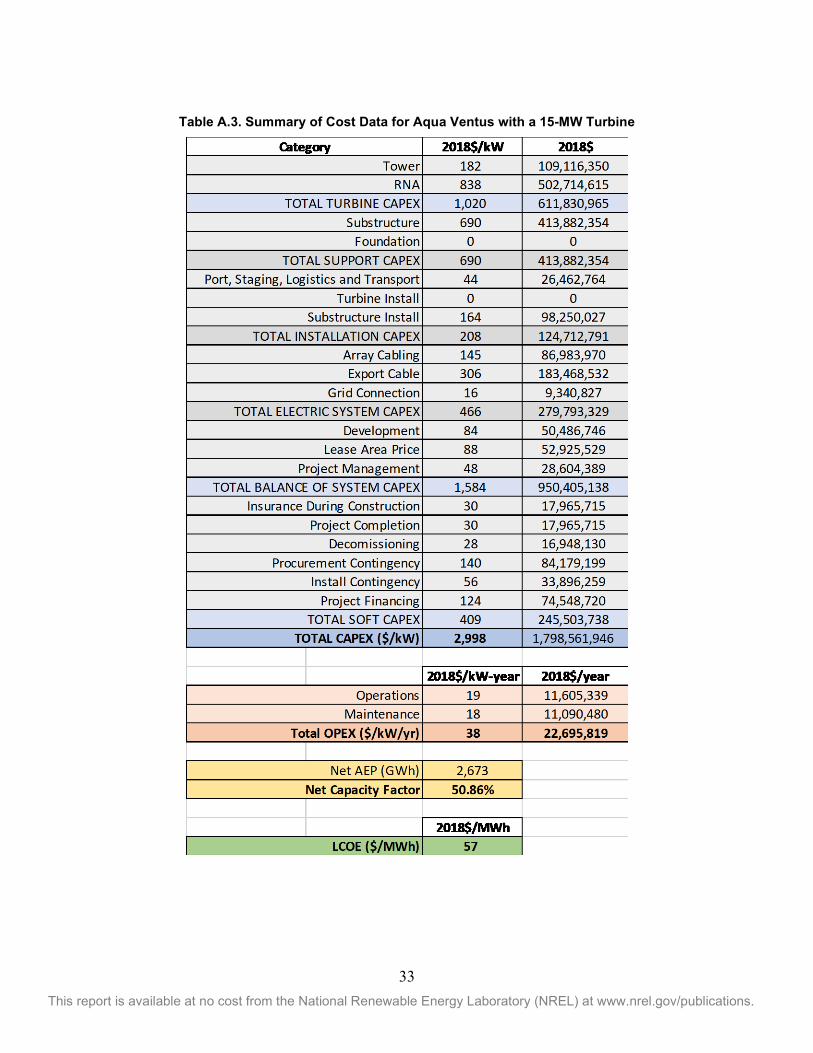
33 This report is available at no cost from the National Renewable Energy Laboratory (NREL) at www.nrel.gov/publications.
Table A.3. Summary of Cost Data for Aqua Ventus with a 15-MW Turbine
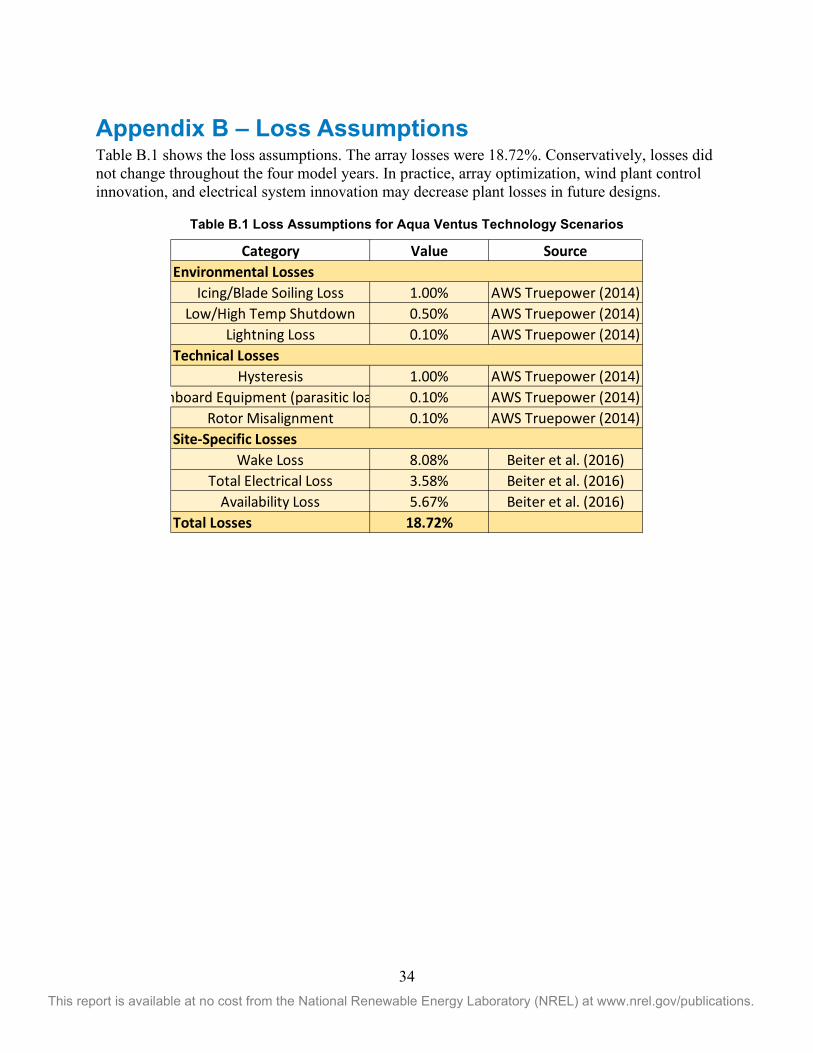
34 This report is available at no cost from the National Renewable Energy Laboratory (NREL) at www.nrel.gov/publications.
Appendix B – Loss Assumptions Table B.1 shows the loss assumptions. The array losses were 18.72%. Conservatively, losses did not change throughout the four model years. In practice, array optimization, wind plant control innovation, and electrical system innovation may decrease plant losses in future designs.
Table B.1 Loss Assumptions for Aqua Ventus Technology Scenarios
Category Value Source
Icing/Blade Soiling Loss 1.00% AWS Truepower (2014)Low/High Temp Shutdown 0.50% AWS Truepower (2014)
Lightning Loss 0.10% AWS Truepower (2014)
Hysteresis 1.00% AWS Truepower (2014)nboard Equipment (parasitic loa 0.10% AWS Truepower (2014)
Rotor Misalignment 0.10% AWS Truepower (2014)
Wake Loss 8.08% Beiter et al. (2016)Total Electrical Loss 3.58% Beiter et al. (2016)
Availability Loss 5.67% Beiter et al. (2016)Total Losses 18.72%
Site-Specific Losses
Environmental Losses
Technical Losses