cost competitiveness german export surges
TRANSCRIPT
Dullien/Joebges/Palazzo German export surges September 24, 2019
1
Cost competitiveness and German export surges Sebastian Dullien,1 Heike Joebges,2 Gabriel Palazzo3
Preliminary draft, please do not cite without permission!
Abstract
Explanations for German export success remain an intensely debated topic. While there seems to be
a general agreement that demand developments in German export destination countries play a
relevant role, next to the specific composition of German export products, the relevance of cost
competitiveness of German exports is more controversial. Some extreme positions identify one
component of it, low unit labour cost developments, as the main factor behind German export
success (Flassbeck/Lapavitsas 2013, Dustmann et al. 2014). Others judge the influence of cost
competitiveness as negligible (Storm/Naastepad 2015) compared to world demand for German
export products and export composition. Yet, most econometric approaches find a statistically
significant role for the effect of cost competitiveness on exports (see e.g. Deutsche Bundesbank
2016).
Econometric approaches may even underrate the role of cost competitiveness as they assume a
linear relationship. Our approach tries to show that periods of competitive real exchange rates are
important for increasing export market shares, leading to a lasting positive effect on exports. We
follow an approach by Palazzo and Rapetti (2017), originally developed by Freund and Pierola (2012),
that relates export surges to periods of stable and competitive real effective exchange rates. Surges
are periods of several years where exports of an industry increase at higher rates than world demand
for the industry and at higher rates than in the past, excluding simple recoveries from former
troughs. Using this approach, we can show that German exports developed better than demand from
the rest of the world would justify. We find several episodes of export surges that relate to periods
with a stable real competitive exchange rate, stressing the role of cost competitiveness.
Key Words
Export success, price competitiveness, Germany, REER
JEL classification
F14, F16
1 HTW Berlin, university of applied sciences, and director of the Macroeconomic Policy Institute at the Hans‐Boeckler‐Foundation, Sebastian‐[email protected] 2 HTW Berlin, university of applied sciences, Heike.Joebges@htw‐berlin.de 3 The Centre for the Study of State and Society (CEDES), CONICET and University of Buenos Aires.
Dullien/Joebges/Palazzo German export surges September 24, 2019
2
Outline 1. Introduction ..................................................................................................................................... 3
2. Developments of cost competitiveness of German exports ........................................................... 5
3. Measuring export surges ................................................................................................................. 7
4. Findings for export surges ............................................................................................................... 9
5. Intensive margins and hysteresis in exports ................................................................................. 13
6. Robustness checks ......................................................................................................................... 14
7. Conclusions .................................................................................................................................... 15
Appendix ................................................................................................................................................ 16
A1: Composition of countries in the two samples ............................................................................ 16
A2: Lall’s (2000) sector classification ................................................................................................. 17
A3: Export surges for the sample of 46 countries starting in 1987, with and without China ........... 20
References ............................................................................................................................................. 22
Dullien/Joebges/Palazzo German export surges September 24, 2019
3
1. Introduction Export growth depends on several factors like the structure of export products, growth in export
destination countries, price (or cost) competitiveness, and non‐price competitiveness (see Altomonte
et al. 2013, Karadeloglou/Benkovskis 2015 for overviews). According to Altomonte et al., non‐price
competitiveness comprises the size of firms and technological capacities, taxation, access to finance,
public support for research and development, and the location of the country that can explain
geographical as well as product specialization (Altomonte et al. 2013).
Cost (or price) competitiveness relates to relative cost (or price) developments in a country in
relation to its trading partners. The standard indicator is the real effective exchange rate (REER): the
nominal effective exchange rate (NEER), a weighted index of bilateral exchange rates for the most
important trading partners, weighted by trade volumes, and corrected for relative cost (or price)
developments in the respective countries. Yet, alternative indicators for price or cost
competitiveness lead to different conclusions about the development of competitiveness, even
differing over countries (see Bayoumi et al. 2011). The most prevailing indicators offered by
international institutions like the IMF are REER based on a CPI correction or based on a ULC
correction.
A recent study by Deutsche Bundesbank (2016) suggests using broad price (e.g. GDP deflator instead
of CPI) or cost aggregates (total unit labour costs) for REER correction in order to judge
competitiveness of German exports. Similarly, Leigh et al. (2017: 5 and appendix B) consider REER
based on CPI as misleading for a large sample of countries. We will therefore concentrate on
indicators based on total unit labour costs, and rather call it cost competitiveness instead of price
competitiveness, even though price competitiveness is also commonly used in the literature. We
consider ULC developments as more telling for Germany, as we assume that a relevant share of
German companies are not price takers, yet, price setters. Studies analysing the degree of pricing to
market strategies (see e.g. Krugman 1986 for the theoretical considerations) of German exporters
are not conclusive: While Stahn (2006) finds evidence that pricing to market strategies of German
companies have increased since the 1990s,4 Stephan (2005) finds evidence that German exporters
allow for a full pass‐through of currency movements, not in line with pricing to market strategies.
Most empirical studies find a statistically significant effect of cost competitiveness on export success,
yet, at the same time, point to higher income elasticities of exports compared to cost elasticity in
absolute terms, see Leigh et al. (2017) for a general overview for a large country panel and
Danninger/Joutz (2007) for Germany. Both studies use REER based on unit labour costs. The findings
of Leigh et al. are in line with Bayoumi et al. (2011), Deutsche Bundesbank (2016), Cerra et al. (2003),
and Neary (2006), at least for manufacturing exports. Results mainly differ in the magnitude of the
effect.
Most findings for German export success attribute an important role to the growth in export
destination countries, especially regarding the period from 2003 up to the financial crisis (see e.g.
Allard et al. 2005, Horn et al. 2017), next to the specific composition of German export products
(Storm/Naastepad 2015). In addition, an important driver of high growth rates in world trade in
recent decades has been a global trend towards greater world trade integration via global and
regional value chains, export processing, and other forms of trade integration that also affect
4 Yet, Stahn’s (2006) approach cannot directly be linked to unit labour costs, as she concentrates on the question if exporters pass‐through production costs measured by commodity and producer prices to final export markets.
Dullien/Joebges/Palazzo German export surges September 24, 2019
4
German exports. Consequently, the contribution of imported inputs to value added of exports and
imports for re‐exports increased from 30% in 1995 to about 44% in 2006 (Loschky/Ritter 2007: 485).
Yet, the role of cost competitiveness remains more controversial. Estimates for the cost elasticity of
German exports find a significant effect (Deutsche Bundesbank 2016), but calculate lower values
than for exports of other European (Monetary) Union countries, and generally lower cost sensitivity
for high tech exports (Carlin et al. 2001). Since the introduction of the euro in 1999, the focus
regarding cost competitiveness has shifted from exchange rate developments to unit labour costs
developments as the element in cost competitiveness that remains under national influence. Some
extreme positions identify low and decreasing unit labour cost developments in the exporting
manufacturing sector as the main factor behind the German export success (see e.g.
Flassbeck/Lapavitsas 2013, Dustmann et al. 2014). Others judge their influence as negligible
compared to factors like non‐cost competitiveness and world demand for German export products
(Storm/Naastepad 2015).5
The starting point of this paper is the idea that prevailing approaches may underestimate the
importance of cost competitiveness, as they calculate cost elasticities based on an (vector) error‐
correction model or VAR approaches, implicitly assuming a linear relationship between cost
competitiveness and exports. Instead, temporary, but sufficiently long periods with a competitive
real exchange rate may be relevant for gaining export market shares. The effect of increased
competitiveness may take time to materialize, but may have long‐run effects for manufacturing
exports due to high levels of sunk costs in technologically advanced products. In addition, the effect
may vary over industries. We therefore try to analyse the effect of periods of a competitive real
effective exchange rate for different sectors of German exports.
In order to analyse the relationship between periods of competitive real exchange rates and export
market shares, we follow an approach used by Palazzo and Rapetti (2017) that was originally
developed by Freund and Pierola (2012). The approach relates export surges to periods of stable and
competitive real exchange rates. The authors define export surges as periods of six years where
exports of an industry increase at higher rates than world demand for the industry and at higher
rates than in the past, excluding simple recoveries from former troughs.
Palazzo and Rapetti (2017) have applied this approach to Argentina, a commodity exporting country
where most firms are price‐takers. They stress the role of a stable and competitive real exchange rate
for labour intensive exports. For the German case, we will show that the approach also leads to
interesting results for German high technology exports, albeit for probably different reasons. For
German manufacturing exports, cost competitiveness is a relevant factor, even for high technology
goods. Underlying mechanisms might be that the need to establish new transport and trade relations
for entering new markets or for entering old markets with new products may imply high fix costs.
Firms may only engage in these activities when they trust that the competitive cost advantage will
continue. Additionally, higher profit margins during periods of a competitive real exchange rate may
allow for increased research and development. As research and development are difficult to cover by
bank credits, companies mainly rely on profits for financing it. The increase of profits during times of
a stable competitive exchange rate might support increasing export market shares and stabilize them
even in times of decreasing cost competitiveness, leading to long‐lasting effects on export levels.
5 Publications focussing on net exports like Schröder (2011) neither find a role for relative cost developments, yet, this might be due to the problem that unit labour costs enter as a positive factor for imports but as a negative one for exports, thus, potentially cancelling out.
Dullien/Joebges/Palazzo German export surges September 24, 2019
5
We will not provide a theoretical model for the mentioned links, as the focus of this paper is on
empirical findings for the role of cost competitiveness on export developments. Using this approach,
we can show that cost competitiveness seems to play an important role for German export
developments, as we find several episodes of export surges that relate to periods with a stable real
competitive exchange rate. We think that this approach can clarify some discussions about the role
of cost competitiveness.
Before explaining the approach, we will first provide an overview on cost competitiveness
developments of German exports since 1995. We will then explain method and data used, and
provide the main results followed by robustness checks regarding the period length, export
destination country sample, and different industries. The pre‐last section discusses the findings. The
last section concludes.
2. Developments of cost competitiveness of German exports Figure 1 shows the development of cost competitiveness of German exports. The presented
indicators for cost competitiveness follow recommendations of Deutsche Bundesbank (2016): Even
though Dustmann et al. suggest concentrating on the cost of the exporting manufacturing sector for
German exports (Dustmann et al. 2014), Deutsche Bundesbank shows that NEER corrected for broad
based cost (or price) indicators perform better in explaining and forecasting export developments
(Deutsche Bundesbank 2016). The better performance of broad indicators can be explained by
outsourcing activities of the manufacturing sector to other sectors (Albu et al. 2018). The REER based
on CPI, even though conveniently available, is outperformed by broad aggregates like the GDP
deflator or the one based on unit labour costs (Deutsche Bundesbank 2016). In the following, we will
stick to the more common ULC corrections, a cost competitiveness indicator. Yet, we will likewise use
the word price competitiveness for this indicator.
According to figure 1, relative cost competitiveness of German exports improved until the mid‐1980s
and worsened markedly from then on until the mid‐1990s, bottoming out in 1995 and indicating
increasing competitiveness problems for German exporters. After the mid‐1990s, competitiveness
improved strongly up to the start of the 2000s, fluctuating since then.
Behind the strong deterioration in competitiveness during the mid‐1990s is a combination of effects
related to German re‐unification. Re‐unification supported a boom in West Germany that provoked
interest rate hikes by the German Bundesbank. As other countries in Europe suffered from a bust
during this time, the European Monetary System (EMS) of fixed exchange rates suffered from
speculative attacks. The resulting crisis in the EMS in 1992/3 led to an appreciation of the D‐Mark
against the other European currencies. In addition, German unification resulted in an increase in
wage and non‐wage labour costs: First, trade unions tried to align wage levels in East Germany with
those in West Germany. Second, rising social security contributions, owing to jumps in
unemployment and massive recourse to early retirement schemes, increased non‐wage labour costs
(Meinhardt/Zwiener 2005, Albu et al. 2018). The combination of the nominal appreciation of the
German Mark, no‐longer counteracting wage developments and non‐wage labour cost increases,
brought about a soaring real effective exchange rate (figure 1).
Debates about increased unemployment rates, excessive labour costs, and the disadvantages of
producing in Germany in the mid‐1990s encouraged several labour market reforms. Coupled with
(the thread of) outsourcing activities to Eastern Europe (Baccaro 2018), this provoked decreasing unit
labour costs. Due to the introduction of the euro in 1999, and already fixed exchange rates for
accession countries from 1997 onwards, this directly translated into increasing competitiveness as
reflected in a lower REER.
Dullien/Joebges/Palazzo German export surges September 24, 2019
6
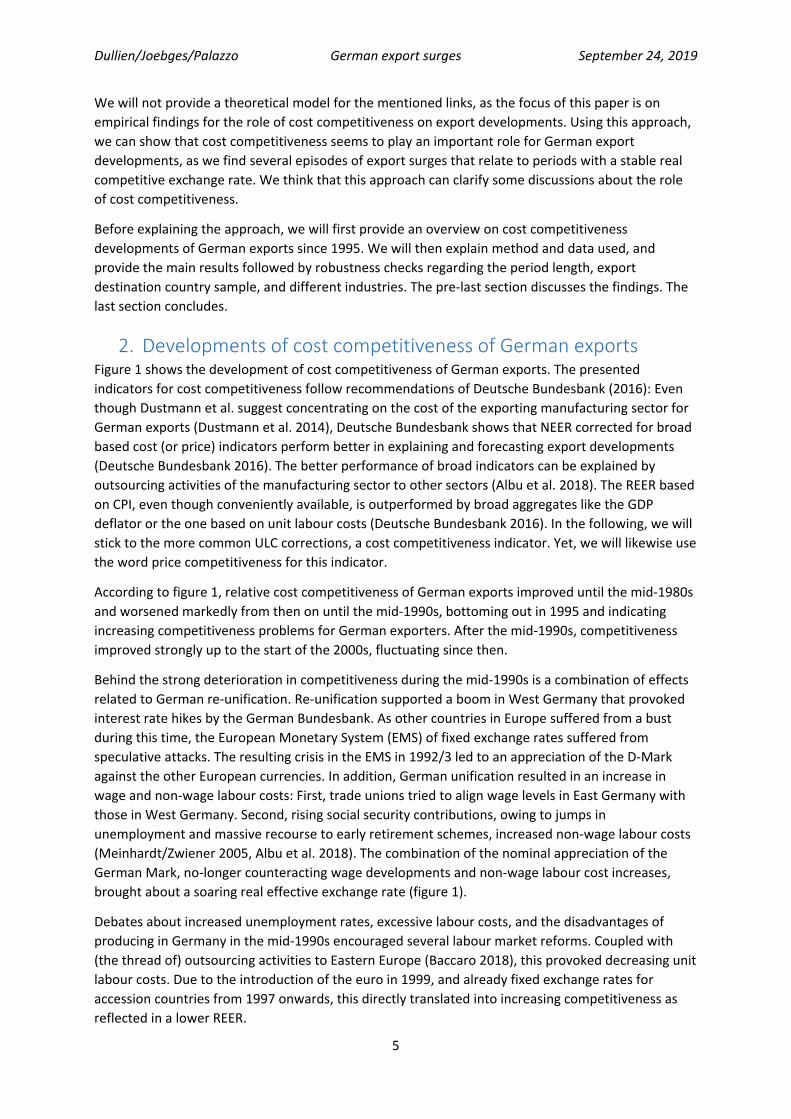
Figure 1: REER based on ULC (bold) and relative unit labour costs (dotted) for Germany
Notes: The bold line represents competitiveness‐weighted relative unit labour costs for the overall economy in dollar terms, an OECD indicator. Competitiveness weights take into account the structure of competition in both export and import markets of the goods sector of 49 countries. An increase in the index indicates a real effective appreciation and a corresponding deterioration of the competitive position. The dotted line represents REER based on ULC from IMF IFS. Based on figure 1, we identify an important improvement in cost competitiveness since the year
19976 onwards. Even though improvements have been interrupted during 2002 to 2003, 2008 to
2009, and 2012 to 2013, cost competitiveness continued to improve according to the OECD measure
or stayed at rather stable levels according to IMF IFS data7 According to the approach, the period
since 1997 should generally support export success.
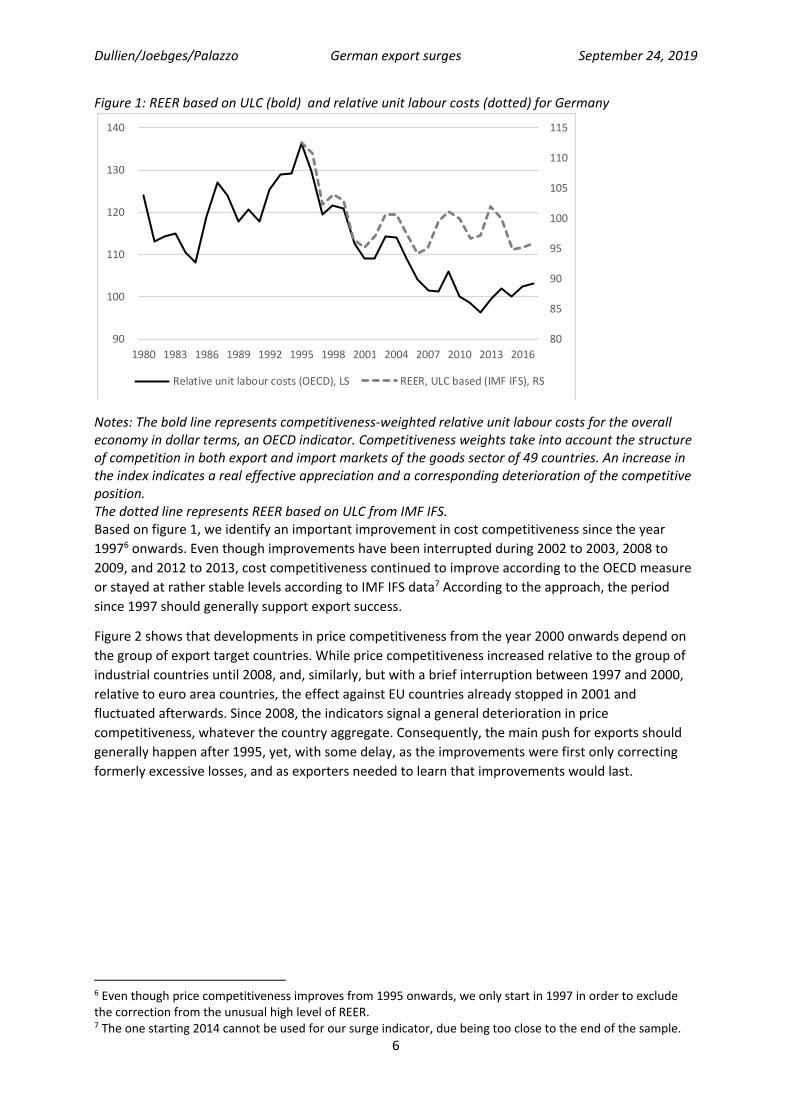
Figure 2 shows that developments in price competitiveness from the year 2000 onwards depend on
the group of export target countries. While price competitiveness increased relative to the group of
industrial countries until 2008, and, similarly, but with a brief interruption between 1997 and 2000,
relative to euro area countries, the effect against EU countries already stopped in 2001 and
fluctuated afterwards. Since 2008, the indicators signal a general deterioration in price
competitiveness, whatever the country aggregate. Consequently, the main push for exports should
generally happen after 1995, yet, with some delay, as the improvements were first only correcting
formerly excessive losses, and as exporters needed to learn that improvements would last.
6 Even though price competitiveness improves from 1995 onwards, we only start in 1997 in order to exclude the correction from the unusual high level of REER. 7 The one starting 2014 cannot be used for our surge indicator, due being too close to the end of the sample.
80
85
90
95
100
105
110
115
90
100
110
120
130
140
1980 1983 1986 1989 1992 1995 1998 2001 2004 2007 2010 2013 2016
Relative unit labour costs (OECD), LS REER, ULC based (IMF IFS), RS
Dullien/Joebges/Palazzo German export surges September 24, 2019
7
Figure 2: Real effective exchange rate (REER) based on ULC for different country groups
Notes: An increase of the REER implies decreasing competitiveness, and vice versa. REER‐19: for euro area countries, REER‐28: for EU countries, REER‐37: for industrial countries. Source: Eurostat.
3. Measuring export surges Our goal is to evaluate whether the improvement in price competitiveness of German exports
measured by REER based on unit labour costs after the mid‐1990s has caused a significant number of
export surges, i.e. temporary episodes of export accelerations that are higher than in the past and
not just due to world demand growth. To study the behaviour of exports of goods, we follow the
methodology used by Palazzo and Rapetti (2017). This methodology builds on the one developed by
Freund and Pierola (2012). The authors construct an algorithm to detect episodes of significant
increases of export growth by sectors that continue for at least six years. As a check for robustness,
we also use 4, 5, and 7 year periods (see robustness checks below).
As in Palazzo and Rapetti (2017) we use COMTRADE data for exports, organized by the 4‐digit
Standard International Trade Classification (SITC), Revision 2. We have converted the nominal export
goods data in COMTRADE from US dollar values to euro‐values and deflated it. We follow the
definition of export surges in Palazzo/Rapetti (2017: 9‐10):
1) Export growth is higher than average growth of this product over a rolling windows of 20
years growth. This request that German exports of product j in period “T” (T=[t;t+5]), for
example 2003‐2008, grew at an annual rate at least 33% higher than the long‐term rate of
growth of world exports of product j. The latter, in this example, is defined as the average
rate of growth during the 20‐year period from 1996 to 2015.
2) Export growth accelerates during the selected compared to the previous period. This
requires, for example, that the rate of growth of exports of product j between 2003 and 2008
accelerated if its annual growth rate was at least 33% higher and was at least 3 percentage
points (pp) higher than the rate of growth during the previous comparable six‐year period
(i.e., 1997‐2002). The requirement of a difference of at least 3pp is in order to avoid cases of
acceleration from very low or negative growth.
3) The export surge is not a recovery. This requires that the peak of exports of product j at the
end of the period is at least x% higher than the preceding peak from the comparable period.
The x% threshold represents the accumulated real growth of world exports of goods
70
75
80
85
90
95
100
1995 1998 2001 2004 2007 2010 2013 2016
REER‐19 (Euroraum, ULC) REER‐28 (EU, ULC)
REER‐37 (Industrieländer, ULC)
Dullien/Joebges/Palazzo German export surges September 24, 2019
8
between the last year of the previous period and the end of the current period. This
threshold indicates the level that exports of product j would have reached, had they grown
without interruption at the same rate as world trade grew during the period.
4) Export growth is not demand‐led. This requirement establishes that German exports of
product j between t and t+5 grew at an annual rate higher than the growth of world exports
of product j during the same period. A higher growth rate than world exports of the same
product implies an increase in the market share and guarantees that the export surge was
neither due to faster growth of the export‐market economies, nor due to changes of global
demand in favour of product j.
The four requirements can be stated formally as follows:
1) , 1 , ∗
2) , 1 , and , , 3%
3) , , , 1 % , , ,
4) , ,
where j represents the export industry, x the rate of export growth, D stands for Germany and W for
world, T represents the current period (i.e. 2003‐2008), T‐1 the previous period (i.e. 1996‐2001), ∗
the long term period (i.e. 1996‐2015), t is the year of the beginning of period T, and X is the quantum
of export.
We constructed an algorithm that demands the simultaneous fulfilment of requirements R1‐R4 to
detect episodes of export surges by sectors in Germany. We are interested in comparing the export
performance for the entire sample period for which data is available (1981‐2015). World exports are
composed by a group of 37 countries for which we have reliable data for the whole sample. This
sample may overstate German the relevance of German exports in world trade.8 As a robustness
check, we also use a bigger sample of countries for a shorter period, starting in 1987 (see robustness
checks).
As in Palazzo and Rapetti (2017), we first present the findings of export surges for all industries, before
showing the effects for subgroups of industries, following Lall’s classification. Lall (2000) distinguishes
between five groups of industries: 1) primary products, 2) resource‐based manufactures, 3) low‐
technology manufactures, 4) medium‐technology manufactures and 5) high‐technology manufactures
(see appendix 1 for details). We use Lall’s classification because it is widely used and therefore makes
our study comparable to others, but more importantly because is straightforward to argue that
Germany has some technological advantage in the medium and high technology manufacturers.
We analyse an average of 771 sectors by year. Table 1 shows the euro amount traded in the five
industry categories based on Lall’s classification and the shares of these industry classifications in total
exports for selected years over the sample period (for every five years). Table 2 calculates the same
for the number of industries in one category, and the share in total exports of that category based on
numbers, instead of basing it on the trade values in euros.
8 See the table of countries in the appendix. In our database, during 2015, the export of Germany represents 16% of world exports. However, in an unrestricted sample of countries, Germany exports represent 8% of world exports (using World Bank database).
Dullien/Joebges/Palazzo German export surges September 24, 2019
9
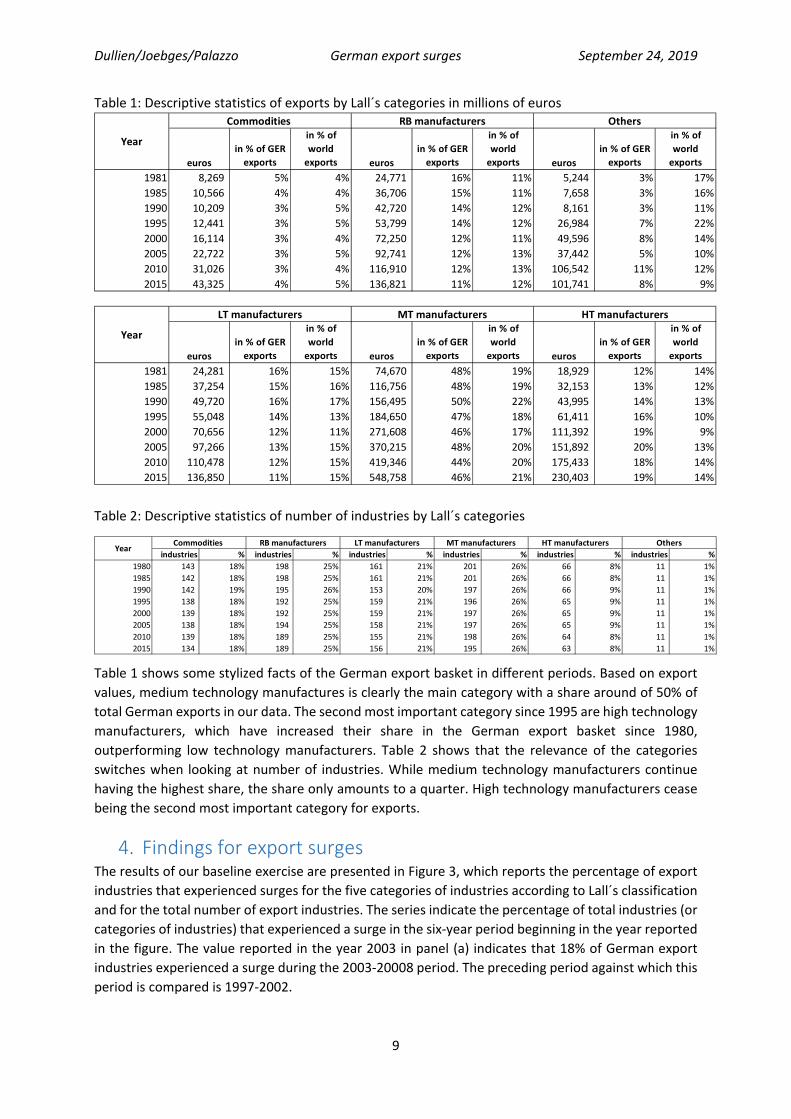
Table 1: Descriptive statistics of exports by Lall´s categories in millions of euros
Table 2: Descriptive statistics of number of industries by Lall´s categories
Table 1 shows some stylized facts of the German export basket in different periods. Based on export
values, medium technology manufactures is clearly the main category with a share around of 50% of
total German exports in our data. The second most important category since 1995 are high technology
manufacturers, which have increased their share in the German export basket since 1980,
outperforming low technology manufacturers. Table 2 shows that the relevance of the categories
switches when looking at number of industries. While medium technology manufacturers continue
having the highest share, the share only amounts to a quarter. High technology manufacturers cease
being the second most important category for exports.
4. Findings for export surges The results of our baseline exercise are presented in Figure 3, which reports the percentage of export
industries that experienced surges for the five categories of industries according to Lall´s classification
and for the total number of export industries. The series indicate the percentage of total industries (or
categories of industries) that experienced a surge in the six‐year period beginning in the year reported
in the figure. The value reported in the year 2003 in panel (a) indicates that 18% of German export
industries experienced a surge during the 2003‐20008 period. The preceding period against which this
period is compared is 1997‐2002.
euros
in % of GER
exports
in % of
world
exports euros
in % of GER
exports
in % of
world
exports euros
in % of GER
exports
in % of
world
exports
1981 8,269 5% 4% 24,771 16% 11% 5,244 3% 17%
1985 10,566 4% 4% 36,706 15% 11% 7,658 3% 16%
1990 10,209 3% 5% 42,720 14% 12% 8,161 3% 11%
1995 12,441 3% 5% 53,799 14% 12% 26,984 7% 22%
2000 16,114 3% 4% 72,250 12% 11% 49,596 8% 14%
2005 22,722 3% 5% 92,741 12% 13% 37,442 5% 10%
2010 31,026 3% 4% 116,910 12% 13% 106,542 11% 12%
2015 43,325 4% 5% 136,821 11% 12% 101,741 8% 9%
euros
in % of GER
exports
in % of
world
exports euros
in % of GER
exports
in % of
world
exports euros
in % of GER
exports
in % of
world
exports
1981 24,281 16% 15% 74,670 48% 19% 18,929 12% 14%
1985 37,254 15% 16% 116,756 48% 19% 32,153 13% 12%
1990 49,720 16% 17% 156,495 50% 22% 43,995 14% 13%
1995 55,048 14% 13% 184,650 47% 18% 61,411 16% 10%
2000 70,656 12% 11% 271,608 46% 17% 111,392 19% 9%
2005 97,266 13% 15% 370,215 48% 20% 151,892 20% 13%
2010 110,478 12% 15% 419,346 44% 20% 175,433 18% 14%
2015 136,850 11% 15% 548,758 46% 21% 230,403 19% 14%
LT manufacturers MT manufacturers HT manufacturers
Others
Year
Year
Commodities RB manufacturers
industries % industries % industries % industries % industries % industries %
1980 143 18% 198 25% 161 21% 201 26% 66 8% 11 1%
1985 142 18% 198 25% 161 21% 201 26% 66 8% 11 1%
1990 142 19% 195 26% 153 20% 197 26% 66 9% 11 1%
1995 138 18% 192 25% 159 21% 196 26% 65 9% 11 1%
2000 139 18% 192 25% 159 21% 197 26% 65 9% 11 1%
2005 138 18% 194 25% 158 21% 197 26% 65 9% 11 1%
2010 139 18% 189 25% 155 21% 198 26% 64 8% 11 1%
2015 134 18% 189 25% 156 21% 195 26% 63 8% 11 1%
HT manufacturers OthersYear
Commodities RB manufacturers LT manufacturers MT manufacturers
Dullien/Joebges/Palazzo German export surges September 24, 2019
10
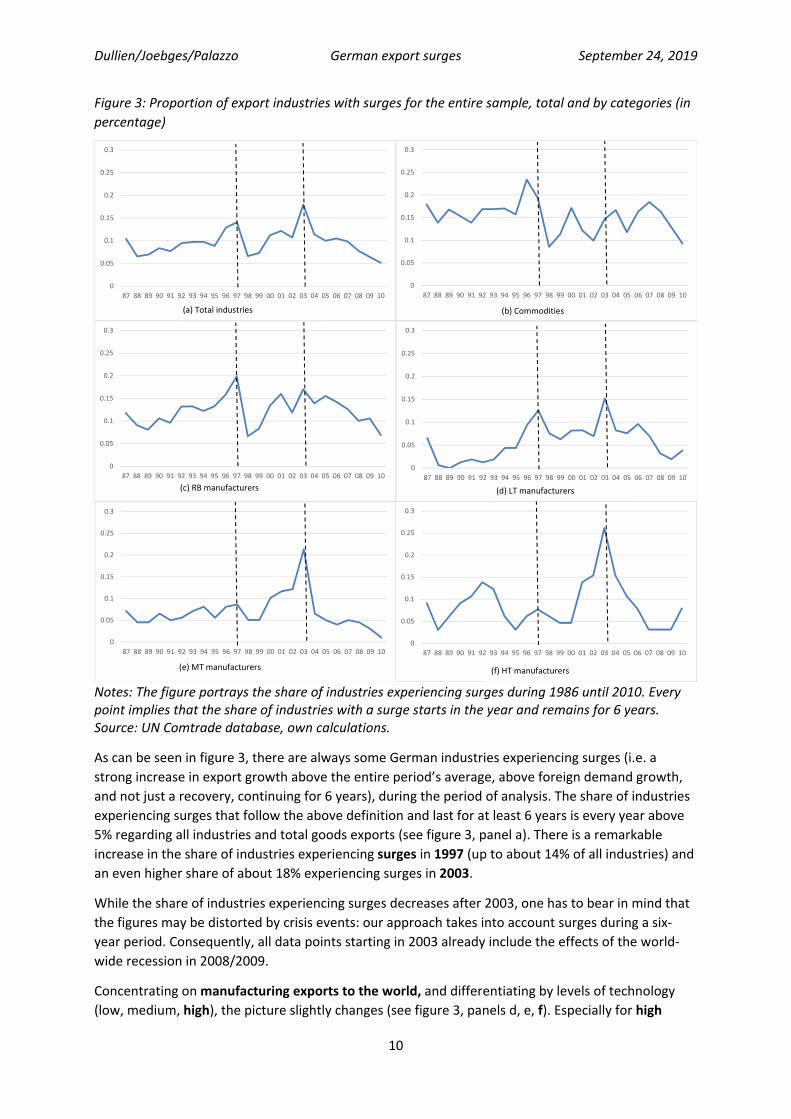
Figure 3: Proportion of export industries with surges for the entire sample, total and by categories (in
percentage)
Notes: The figure portrays the share of industries experiencing surges during 1986 until 2010. Every point implies that the share of industries with a surge starts in the year and remains for 6 years. Source: UN Comtrade database, own calculations.
As can be seen in figure 3, there are always some German industries experiencing surges (i.e. a
strong increase in export growth above the entire period’s average, above foreign demand growth,
and not just a recovery, continuing for 6 years), during the period of analysis. The share of industries
experiencing surges that follow the above definition and last for at least 6 years is every year above
5% regarding all industries and total goods exports (see figure 3, panel a). There is a remarkable
increase in the share of industries experiencing surges in 1997 (up to about 14% of all industries) and
an even higher share of about 18% experiencing surges in 2003.
While the share of industries experiencing surges decreases after 2003, one has to bear in mind that
the figures may be distorted by crisis events: our approach takes into account surges during a six‐
year period. Consequently, all data points starting in 2003 already include the effects of the world‐
wide recession in 2008/2009.
Concentrating on manufacturing exports to the world, and differentiating by levels of technology
(low, medium, high), the picture slightly changes (see figure 3, panels d, e, f). Especially for high
0
0.05
0.1
0.15
0.2
0.25
0.3
87 88 89 90 91 92 93 94 95 96 97 98 99 00 01 02 03 04 05 06 07 08 09 10
(a) Total industries
0
0.05
0.1
0.15
0.2
0.25
0.3
87 88 89 90 91 92 93 94 95 96 97 98 99 00 01 02 03 04 05 06 07 08 09 10
(b) Commodities
0
0.05
0.1
0.15
0.2
0.25
0.3
87 88 89 90 91 92 93 94 95 96 97 98 99 00 01 02 03 04 05 06 07 08 09 10
(c) RB manufacturers
0
0.05
0.1
0.15
0.2
0.25
0.3
87 88 89 90 91 92 93 94 95 96 97 98 99 00 01 02 03 04 05 06 07 08 09 10
(d) LT manufacturers
0
0.05
0.1
0.15
0.2
0.25
0.3
87 88 89 90 91 92 93 94 95 96 97 98 99 00 01 02 03 04 05 06 07 08 09 10
(e) MT manufacturers
0
0.05
0.1
0.15
0.2
0.25
0.3
87 88 89 90 91 92 93 94 95 96 97 98 99 00 01 02 03 04 05 06 07 08 09 10
(f) HT manufacturers
Dullien/Joebges/Palazzo German export surges September 24, 2019
11
technology manufacturing exports, the share of industries experiencing surges is more pronounced
in the early 1990s (1992: about 13%) than the one after the mid‐1990s (7‐8% in 1997), and surges
from the early 2000s onwards are even more pronounced. The share of industries benefitting from
surges increases from about 5% in 2000 to more than 26% in 2003 before dropping again to levels
below 5% in 2007. This pattern holds even for the exclusion of exports to China and demand from
China (see appendix).
The introduction of the euro in 1999 does not seem to have a systematic influence, at least
according to figure 3. During the period from 2000 up to the start of the financial crisis in 2007, the
share of industries experiencing surges stays at elevated levels (above 10%, see figure 3). In order to
check this impression, we perform our algorithm splitting exports from Germany to Eurozone
countries and to non‐Eurozone countries. The difference is that now we are looking at the evolution
of exports from Germany to Eurozone countries. Since we want to keep the sample of countries
fixed, we include only the exports to the former countries of the Eurozone since 1999 and Greece
which joined in 20019.
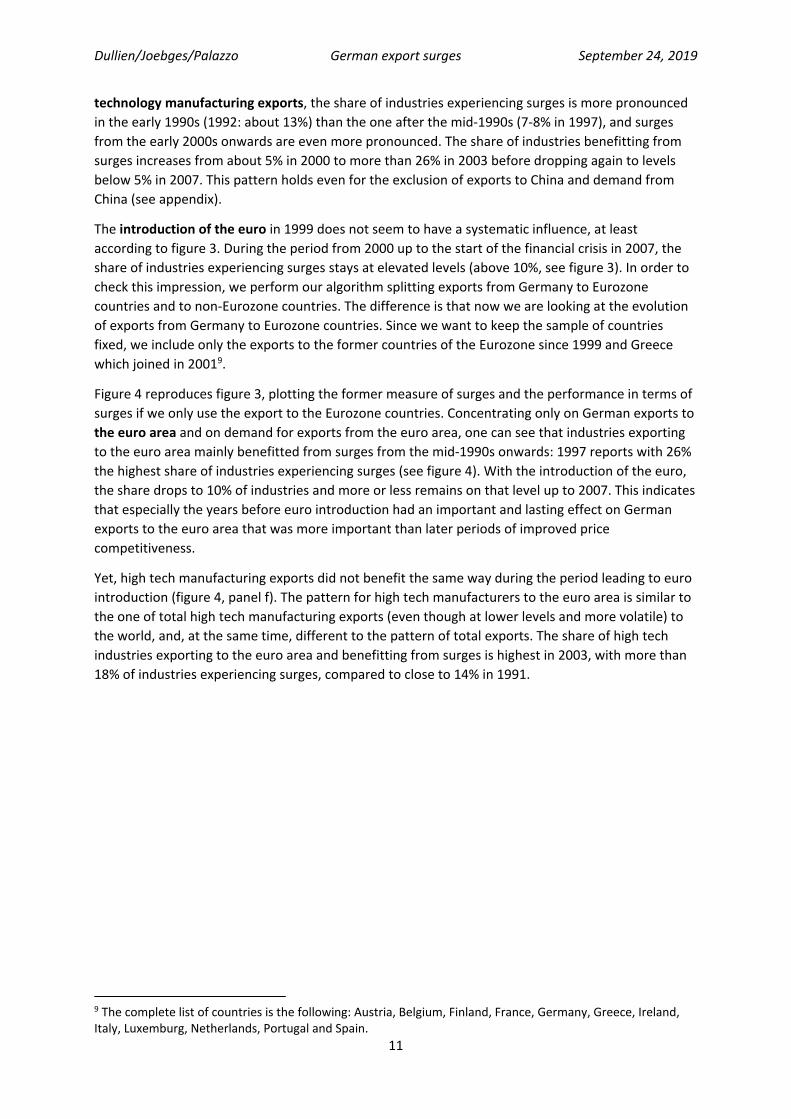
Figure 4 reproduces figure 3, plotting the former measure of surges and the performance in terms of
surges if we only use the export to the Eurozone countries. Concentrating only on German exports to
the euro area and on demand for exports from the euro area, one can see that industries exporting
to the euro area mainly benefitted from surges from the mid‐1990s onwards: 1997 reports with 26%
the highest share of industries experiencing surges (see figure 4). With the introduction of the euro,
the share drops to 10% of industries and more or less remains on that level up to 2007. This indicates
that especially the years before euro introduction had an important and lasting effect on German
exports to the euro area that was more important than later periods of improved price
competitiveness.
Yet, high tech manufacturing exports did not benefit the same way during the period leading to euro
introduction (figure 4, panel f). The pattern for high tech manufacturers to the euro area is similar to
the one of total high tech manufacturing exports (even though at lower levels and more volatile) to
the world, and, at the same time, different to the pattern of total exports. The share of high tech
industries exporting to the euro area and benefitting from surges is highest in 2003, with more than
18% of industries experiencing surges, compared to close to 14% in 1991.
9 The complete list of countries is the following: Austria, Belgium, Finland, France, Germany, Greece, Ireland, Italy, Luxemburg, Netherlands, Portugal and Spain.
Dullien/Joebges/Palazzo German export surges September 24, 2019
12
Figure 4: Proportion of export industries with surges for exports to the euro area and demand from
the euro area only (in percentage)
Notes: The figure portrays the share of industries experiencing surges during 1986 until 2010, yet, with the additional information about exports to and demand from the euro area only. Every point implies that the share of industries with a surge starts in the year and remains for 6 years. Source: UN Comtrade database, own calculations.
Our results seem to confirm that a period of stable (or even improving) price competitiveness
measured here by the REER based on relative unit labour costs is favourable for trade activities. Our
prior is confirmed with figure 3, since we find export surges for total exports (figure 3, panel a) as well
as for all categories of industries (except commodities, panel b‐f). As the peak of export surges seems
to take place around the period 2003‐2008, after the introduction of the euro, our findings are in line
with authors stressing the competitiveness enhancing effect of the euro coupled with relatively low
unit labour costs developments. As one can see in the figures, this effect seems to be especially
important for sectors where Germany has some kind of technological or institutional advantage
(medium and high technology). High technology manufacturers with surges reach a share of 26.2%
during the period 2003‐2008. High tech manufacturers are the category with the highest reaction to
the improvement of price competitiveness, followed by medium technology manufacturers, where
21.3% of industries experience surges.
0.0%
5.0%
10.0%
15.0%
20.0%
25.0%
30.0%
35.0%
40.0%
87 88 89 90 91 92 93 94 95 96 97 98 99 00 01 02 03 04 05 06 07 08 09 10
To Eurozone World
(a) Total industries
0.0%
5.0%
10.0%
15.0%
20.0%
25.0%
30.0%
35.0%
40.0%
87 88 89 90 91 92 93 94 95 96 97 98 99 00 01 02 03 04 05 06 07 08 09 10
To Eurozone World
(b) Commodities
0.0%
5.0%
10.0%
15.0%
20.0%
25.0%
30.0%
35.0%
40.0%
87 88 89 90 91 92 93 94 95 96 97 98 99 00 01 02 03 04 05 06 07 08 09 10
To Eurozone World
(c) RB manufacturers
0.0%
5.0%
10.0%
15.0%
20.0%
25.0%
30.0%
35.0%
40.0%
87 88 89 90 91 92 93 94 95 96 97 98 99 00 01 02 03 04 05 06 07 08 09 10
To Eurozone World
(d) LT manufacturers
0.0%
5.0%
10.0%
15.0%
20.0%
25.0%
30.0%
35.0%
40.0%
87 88 89 90 91 92 93 94 95 96 97 98 99 00 01 02 03 04 05 06 07 08 09 10
To Eurozone World
(e) MT manufacturers
0.0%
5.0%
10.0%
15.0%
20.0%
25.0%
30.0%
35.0%
40.0%
87 88 89 90 91 92 93 94 95 96 97 98 99 00 01 02 03 04 05 06 07 08 09 10
To Eurozone World
(f) HT manufacturers
Dullien/Joebges/Palazzo German export surges September 24, 2019
13
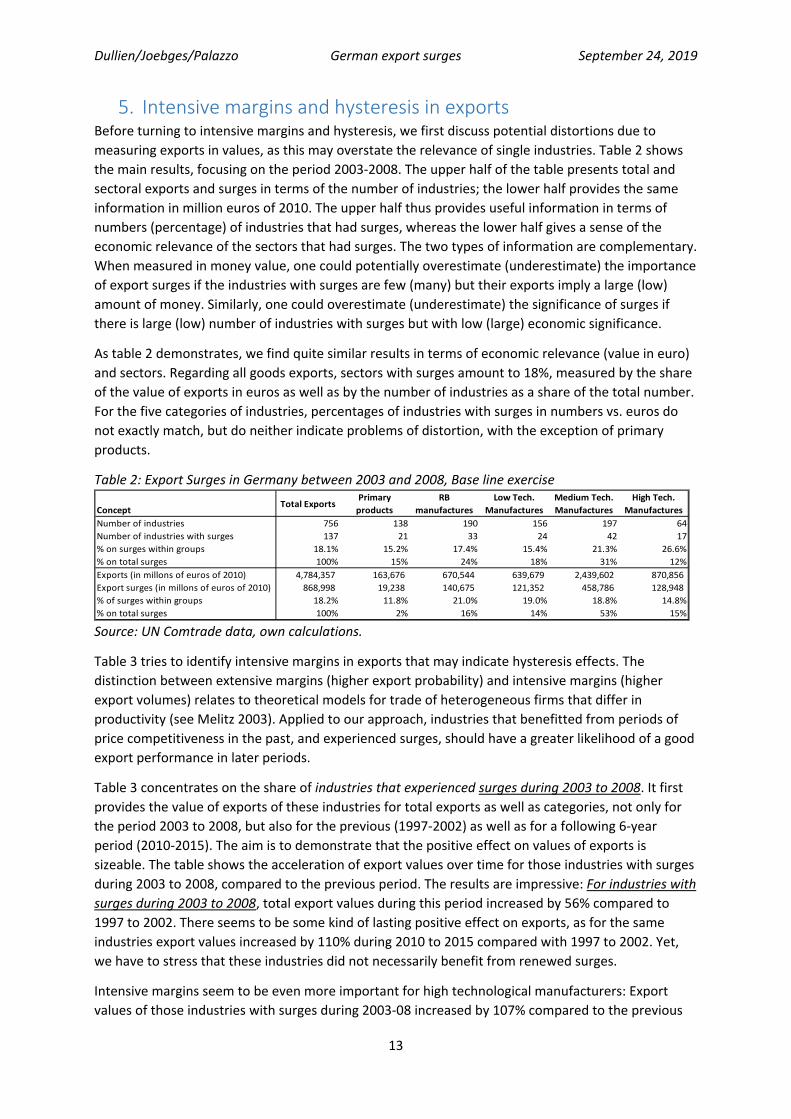
5. Intensive margins and hysteresis in exports Before turning to intensive margins and hysteresis, we first discuss potential distortions due to
measuring exports in values, as this may overstate the relevance of single industries. Table 2 shows
the main results, focusing on the period 2003‐2008. The upper half of the table presents total and
sectoral exports and surges in terms of the number of industries; the lower half provides the same
information in million euros of 2010. The upper half thus provides useful information in terms of
numbers (percentage) of industries that had surges, whereas the lower half gives a sense of the
economic relevance of the sectors that had surges. The two types of information are complementary.
When measured in money value, one could potentially overestimate (underestimate) the importance
of export surges if the industries with surges are few (many) but their exports imply a large (low)
amount of money. Similarly, one could overestimate (underestimate) the significance of surges if
there is large (low) number of industries with surges but with low (large) economic significance.
As table 2 demonstrates, we find quite similar results in terms of economic relevance (value in euro)
and sectors. Regarding all goods exports, sectors with surges amount to 18%, measured by the share
of the value of exports in euros as well as by the number of industries as a share of the total number.
For the five categories of industries, percentages of industries with surges in numbers vs. euros do
not exactly match, but do neither indicate problems of distortion, with the exception of primary
products.
Table 2: Export Surges in Germany between 2003 and 2008, Base line exercise
ConceptTotal Exports
Primary
products
RB
manufactures
Low Tech.
Manufactures
Medium Tech.
Manufactures
High Tech.
Manufactures
Number of industries 756 138 190 156 197 64
Number of industries with surges 137 21 33 24 42 17
% on surges within groups 18.1% 15.2% 17.4% 15.4% 21.3% 26.6%
% on total surges 100% 15% 24% 18% 31% 12%
Exports (in millons of euros of 2010) 4,784,357 163,676 670,544 639,679 2,439,602 870,856
Export surges (in millons of euros of 2010) 868,998 19,238 140,675 121,352 458,786 128,948
% of surges within groups 18.2% 11.8% 21.0% 19.0% 18.8% 14.8%
% on total surges 100% 2% 16% 14% 53% 15% Source: UN Comtrade data, own calculations.
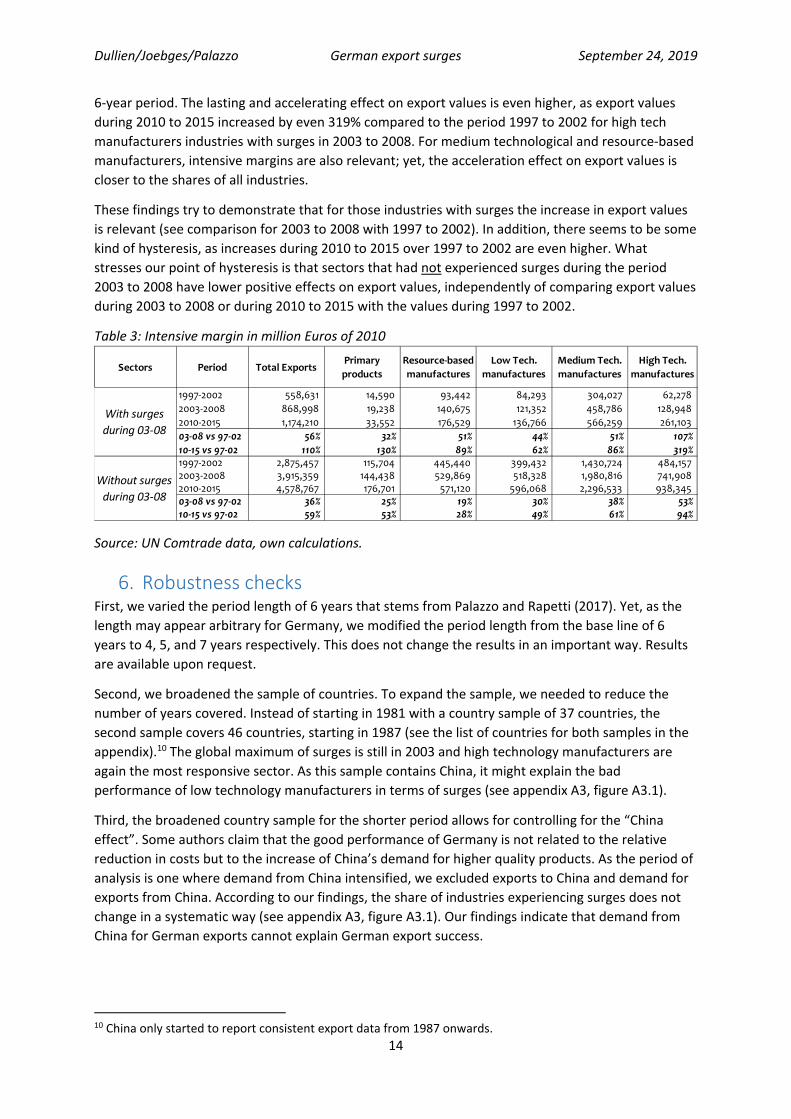
Table 3 tries to identify intensive margins in exports that may indicate hysteresis effects. The
distinction between extensive margins (higher export probability) and intensive margins (higher
export volumes) relates to theoretical models for trade of heterogeneous firms that differ in
productivity (see Melitz 2003). Applied to our approach, industries that benefitted from periods of
price competitiveness in the past, and experienced surges, should have a greater likelihood of a good
export performance in later periods.
Table 3 concentrates on the share of industries that experienced surges during 2003 to 2008. It first
provides the value of exports of these industries for total exports as well as categories, not only for
the period 2003 to 2008, but also for the previous (1997‐2002) as well as for a following 6‐year
period (2010‐2015). The aim is to demonstrate that the positive effect on values of exports is
sizeable. The table shows the acceleration of export values over time for those industries with surges
during 2003 to 2008, compared to the previous period. The results are impressive: For industries with
surges during 2003 to 2008, total export values during this period increased by 56% compared to
1997 to 2002. There seems to be some kind of lasting positive effect on exports, as for the same
industries export values increased by 110% during 2010 to 2015 compared with 1997 to 2002. Yet,
we have to stress that these industries did not necessarily benefit from renewed surges.
Intensive margins seem to be even more important for high technological manufacturers: Export
values of those industries with surges during 2003‐08 increased by 107% compared to the previous
Dullien/Joebges/Palazzo German export surges September 24, 2019
14
6‐year period. The lasting and accelerating effect on export values is even higher, as export values
during 2010 to 2015 increased by even 319% compared to the period 1997 to 2002 for high tech
manufacturers industries with surges in 2003 to 2008. For medium technological and resource‐based
manufacturers, intensive margins are also relevant; yet, the acceleration effect on export values is
closer to the shares of all industries.
These findings try to demonstrate that for those industries with surges the increase in export values
is relevant (see comparison for 2003 to 2008 with 1997 to 2002). In addition, there seems to be some
kind of hysteresis, as increases during 2010 to 2015 over 1997 to 2002 are even higher. What
stresses our point of hysteresis is that sectors that had not experienced surges during the period
2003 to 2008 have lower positive effects on export values, independently of comparing export values
during 2003 to 2008 or during 2010 to 2015 with the values during 1997 to 2002.
Table 3: Intensive margin in million Euros of 2010
Source: UN Comtrade data, own calculations.
6. Robustness checks First, we varied the period length of 6 years that stems from Palazzo and Rapetti (2017). Yet, as the
length may appear arbitrary for Germany, we modified the period length from the base line of 6
years to 4, 5, and 7 years respectively. This does not change the results in an important way. Results
are available upon request.
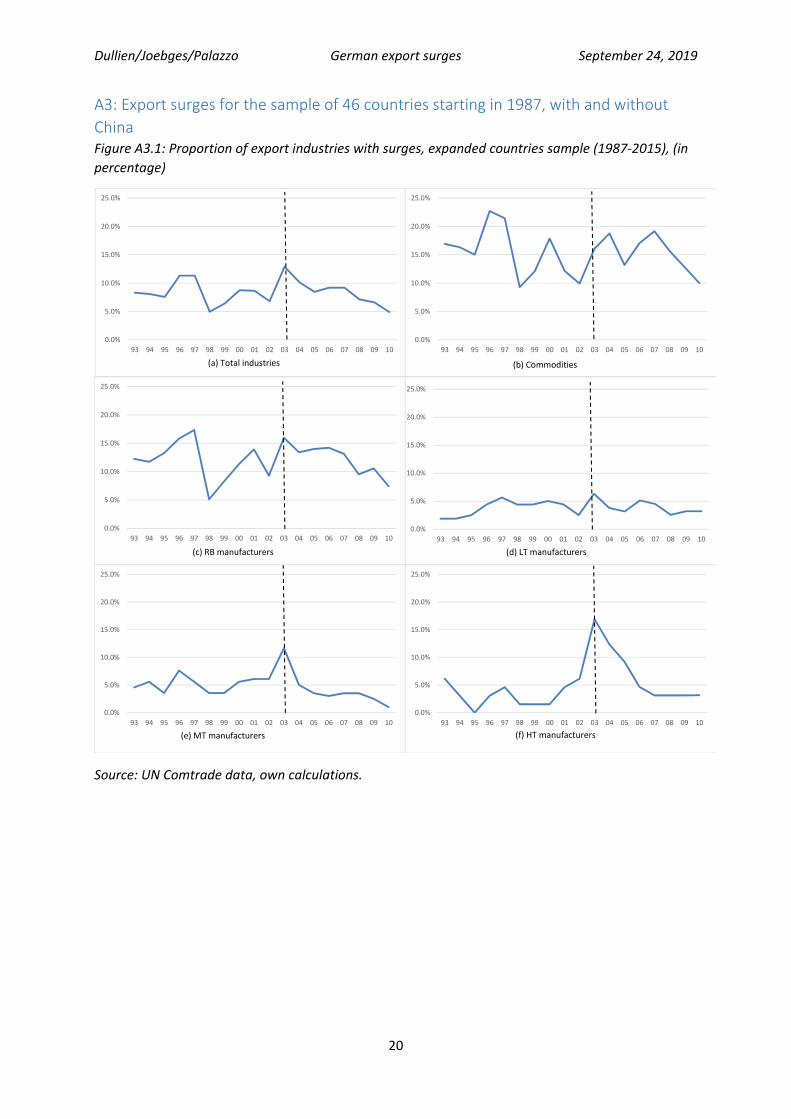
Second, we broadened the sample of countries. To expand the sample, we needed to reduce the
number of years covered. Instead of starting in 1981 with a country sample of 37 countries, the
second sample covers 46 countries, starting in 1987 (see the list of countries for both samples in the
appendix).10 The global maximum of surges is still in 2003 and high technology manufacturers are
again the most responsive sector. As this sample contains China, it might explain the bad
performance of low technology manufacturers in terms of surges (see appendix A3, figure A3.1).
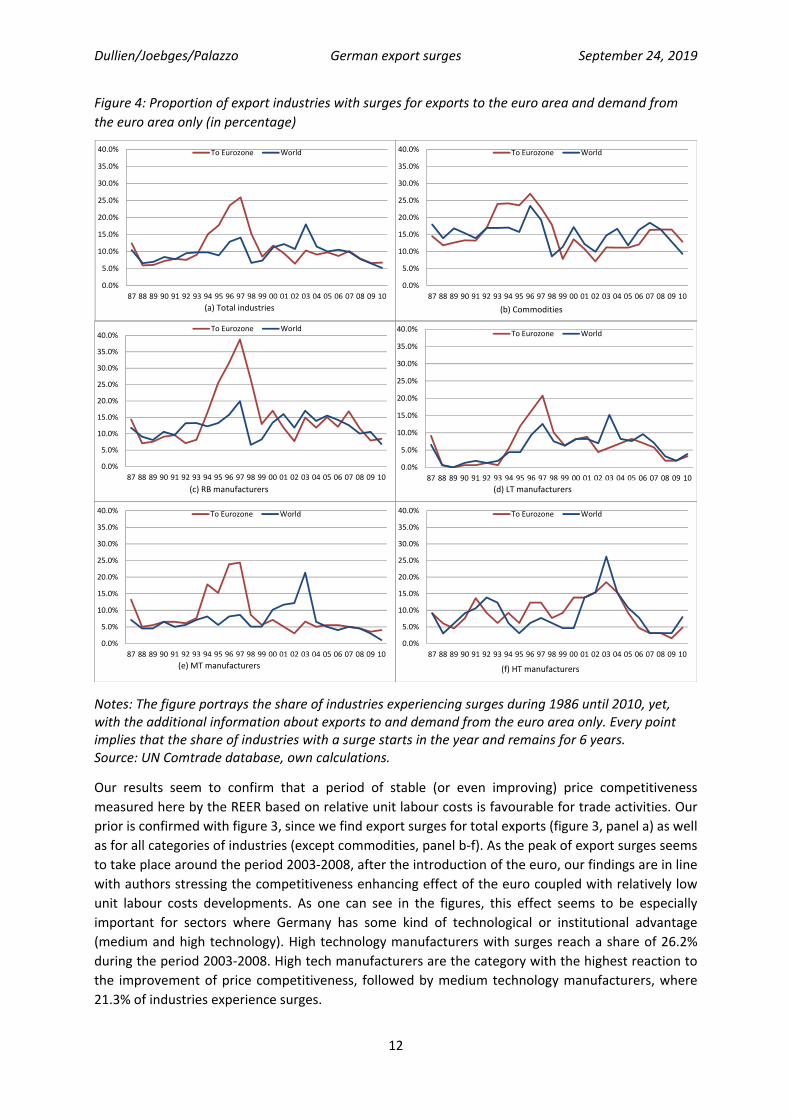
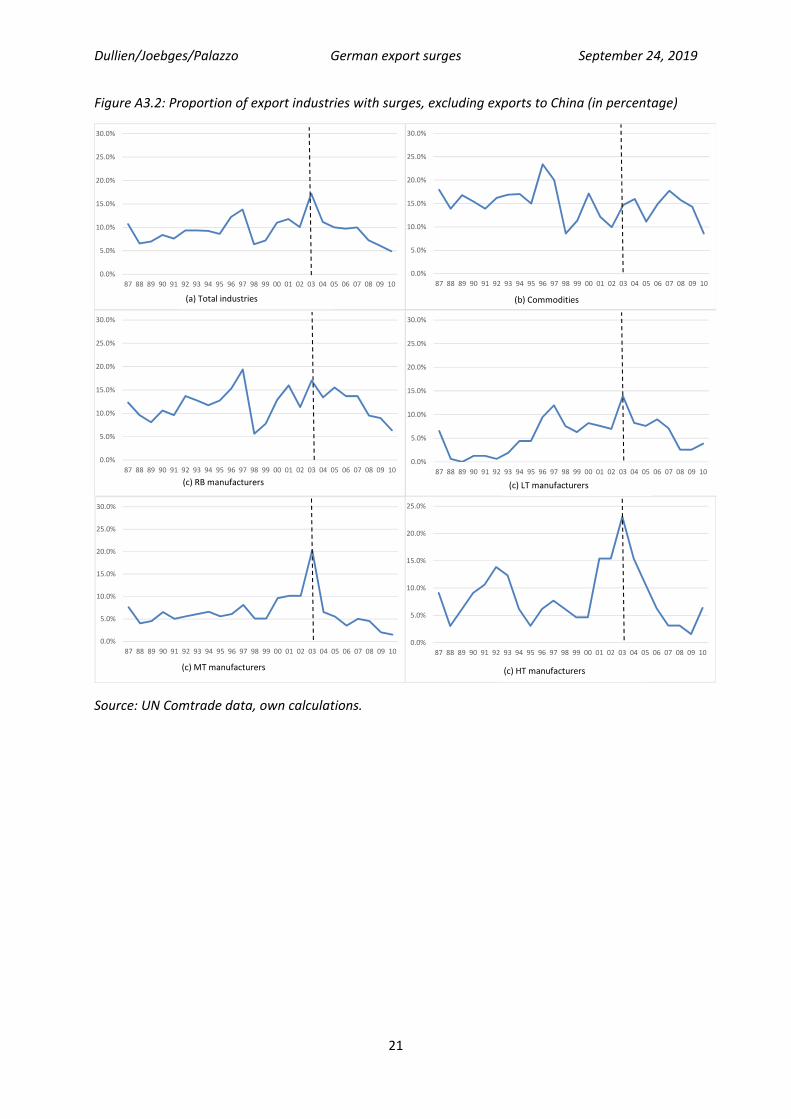
Third, the broadened country sample for the shorter period allows for controlling for the “China
effect”. Some authors claim that the good performance of Germany is not related to the relative
reduction in costs but to the increase of China’s demand for higher quality products. As the period of
analysis is one where demand from China intensified, we excluded exports to China and demand for
exports from China. According to our findings, the share of industries experiencing surges does not
change in a systematic way (see appendix A3, figure A3.1). Our findings indicate that demand from
China for German exports cannot explain German export success.
10 China only started to report consistent export data from 1987 onwards.
Sectors Period Total ExportsPrimary
products
Resource‐based
manufactures
Low Tech.
manufactures
Medium Tech.
manufactures
High Tech.
manufactures
1997‐2002 558,631 14,590 93,442 84,293 304,027 62,278
2003‐2008 868,998 19,238 140,675 121,352 458,786 128,948
2010‐2015 1,174,210 33,552 176,529 136,766 566,259 261,103
03‐08 vs 97‐02 56% 32% 51% 44% 51% 107%
10‐15 vs 97‐02 110% 130% 89% 62% 86% 319%1997‐2002 2,875,457 115,704 445,440 399,432 1,430,724 484,157 2003‐2008 3,915,359 144,438 529,869 518,328 1,980,816 741,908 2010‐2015 4,578,767 176,701 571,120 596,068 2,296,533 938,345 03‐08 vs 97‐02 36% 25% 19% 30% 38% 53%10‐15 vs 97‐02 59% 53% 28% 49% 61% 94%
With surges
during 03‐08
Without surges
during 03‐08
Dullien/Joebges/Palazzo German export surges September 24, 2019
15
7. Conclusions As the debate about the role of price competitiveness for German export success continues, this
approach tries to provide evidence that empirical approaches – even though finding a statistically
significant effect – might even underrate the role of price competitiveness as they mostly assume a
linear relationship. Our approach tries to show that periods of competitive real exchange rates are
important for increasing export market shares, leading to a lasting positive effect on exports.
Using the approach of Palazzo and Rapetti (2017), we find evidence for German export surges after
periods of increasing price competitiveness. Surges are periods of several years where exports of an
industry increase at higher rates than world demand for the industry, and at higher rates than in the
past, excluding simple recoveries from former troughs. Using this approach, we can show that
German exports developed better than demand from the rest of the world would justify, yet, that
the relevance of this effect differs between industries. High technology manufacturers seem to
benefit the most, in contrast to findings by Carlin et al. (2001).
We even find evidence for surges when isolating demand effects from and (total and high‐
technological manufacturers) exports to China, which questions the argument that China’s demand
has been driving German export success. We find several episodes of export surges that relate to
periods with a stable real competitive exchange rate, stressing the role of price competitiveness.
In addition, we find evidence that those industries that benefitted from surges in the past are likely
to benefit from successful export developments (not necessarily additional surges) in later periods.
This might finding might indicate hysteresis in export success, in line with theoretical models like
Melitz (2003).
Yet, we have to admit that we can only provide evidence for coincidence of improved price
competitiveness and export surges. We cannot prove our point, and we do neither control for
alternative explanations.
Dullien/Joebges/Palazzo German export surges September 24, 2019
16
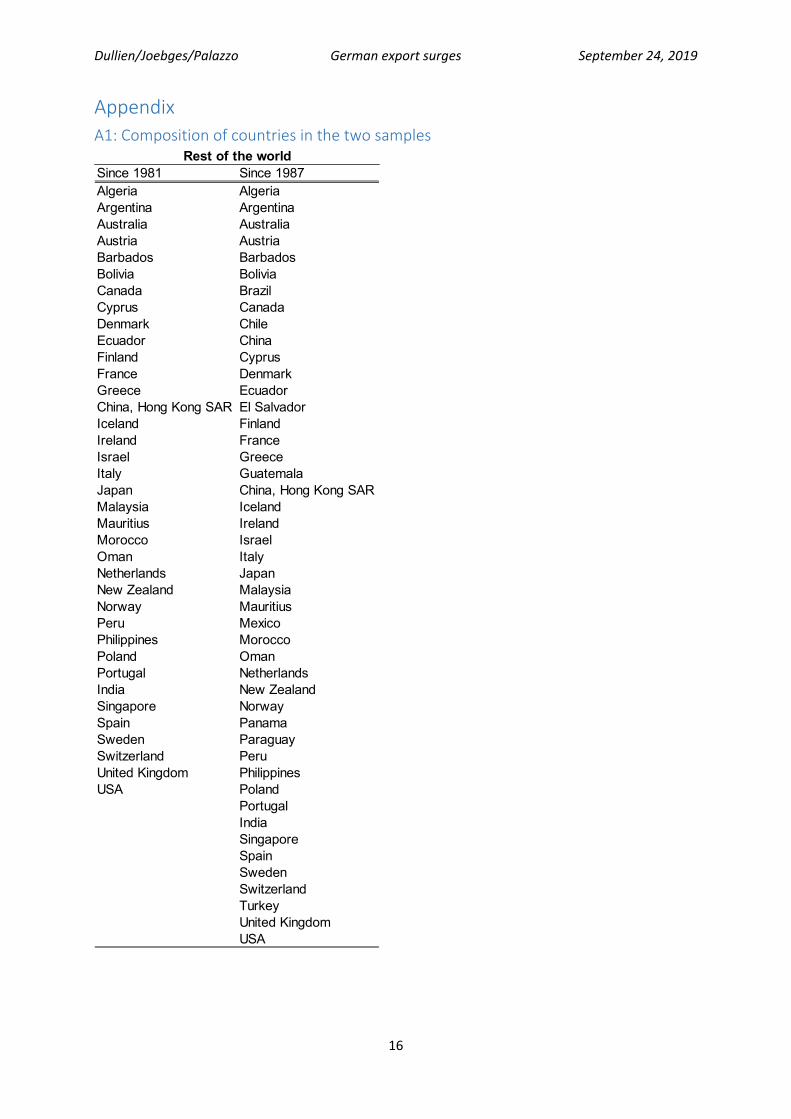
Appendix
A1: Composition of countries in the two samples
Since 1981 Since 1987Algeria AlgeriaArgentina ArgentinaAustralia AustraliaAustria AustriaBarbados BarbadosBolivia BoliviaCanada BrazilCyprus CanadaDenmark ChileEcuador ChinaFinland CyprusFrance DenmarkGreece EcuadorChina, Hong Kong SAR El SalvadorIceland FinlandIreland FranceIsrael GreeceItaly GuatemalaJapan China, Hong Kong SARMalaysia IcelandMauritius IrelandMorocco IsraelOman ItalyNetherlands JapanNew Zealand MalaysiaNorway MauritiusPeru MexicoPhilippines MoroccoPoland OmanPortugal NetherlandsIndia New ZealandSingapore NorwaySpain PanamaSweden ParaguaySwitzerland PeruUnited Kingdom PhilippinesUSA Poland
PortugalIndiaSingaporeSpainSwedenSwitzerlandTurkeyUnited KingdomUSA
Rest of the world
Dullien/Joebges/Palazzo German export surges September 24, 2019
17
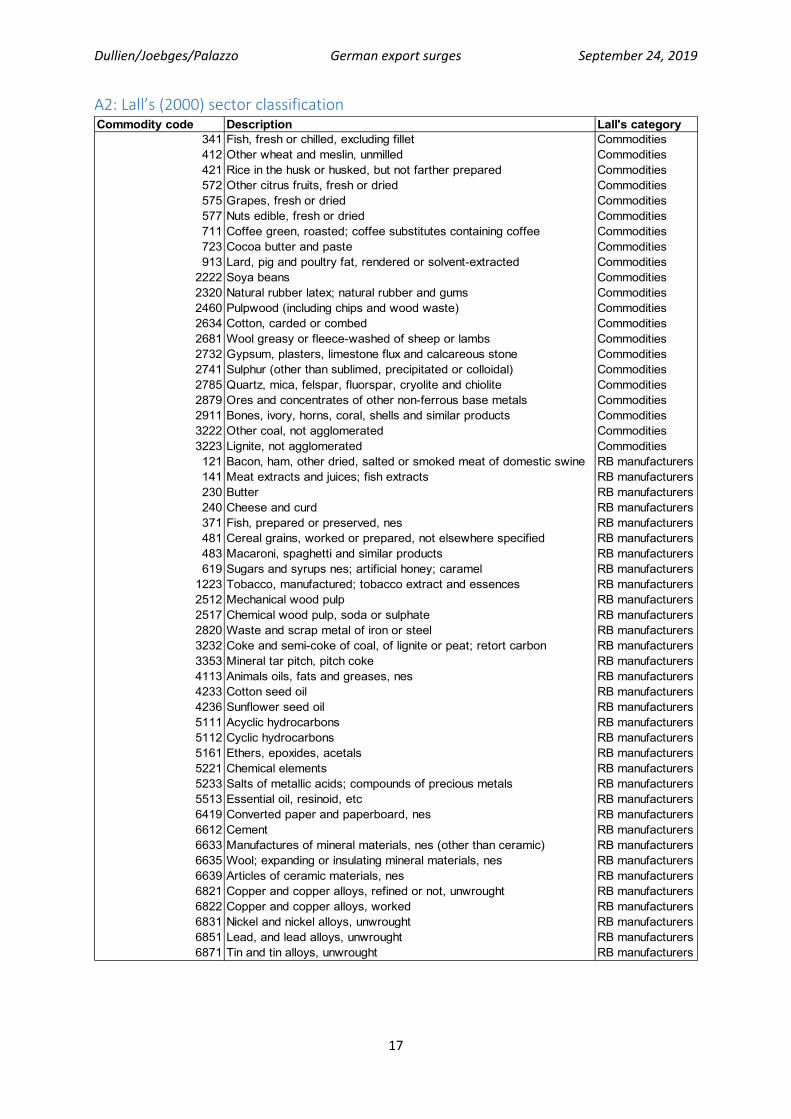
A2: Lall’s (2000) sector classification Commodity code Description Lall's category
341 Fish, fresh or chilled, excluding fillet Commodities412 Other wheat and meslin, unmilled Commodities421 Rice in the husk or husked, but not farther prepared Commodities572 Other citrus fruits, fresh or dried Commodities575 Grapes, fresh or dried Commodities577 Nuts edible, fresh or dried Commodities711 Coffee green, roasted; coffee substitutes containing coffee Commodities723 Cocoa butter and paste Commodities913 Lard, pig and poultry fat, rendered or solvent-extracted Commodities
2222 Soya beans Commodities2320 Natural rubber latex; natural rubber and gums Commodities2460 Pulpwood (including chips and wood waste) Commodities2634 Cotton, carded or combed Commodities2681 Wool greasy or fleece-washed of sheep or lambs Commodities2732 Gypsum, plasters, limestone flux and calcareous stone Commodities2741 Sulphur (other than sublimed, precipitated or colloidal) Commodities2785 Quartz, mica, felspar, fluorspar, cryolite and chiolite Commodities2879 Ores and concentrates of other non-ferrous base metals Commodities2911 Bones, ivory, horns, coral, shells and similar products Commodities3222 Other coal, not agglomerated Commodities3223 Lignite, not agglomerated Commodities121 Bacon, ham, other dried, salted or smoked meat of domestic swine RB manufacturers141 Meat extracts and juices; fish extracts RB manufacturers230 Butter RB manufacturers240 Cheese and curd RB manufacturers371 Fish, prepared or preserved, nes RB manufacturers481 Cereal grains, worked or prepared, not elsewhere specified RB manufacturers483 Macaroni, spaghetti and similar products RB manufacturers619 Sugars and syrups nes; artificial honey; caramel RB manufacturers
1223 Tobacco, manufactured; tobacco extract and essences RB manufacturers2512 Mechanical wood pulp RB manufacturers2517 Chemical wood pulp, soda or sulphate RB manufacturers2820 Waste and scrap metal of iron or steel RB manufacturers3232 Coke and semi-coke of coal, of lignite or peat; retort carbon RB manufacturers3353 Mineral tar pitch, pitch coke RB manufacturers4113 Animals oils, fats and greases, nes RB manufacturers4233 Cotton seed oil RB manufacturers4236 Sunflower seed oil RB manufacturers5111 Acyclic hydrocarbons RB manufacturers5112 Cyclic hydrocarbons RB manufacturers5161 Ethers, epoxides, acetals RB manufacturers5221 Chemical elements RB manufacturers5233 Salts of metallic acids; compounds of precious metals RB manufacturers5513 Essential oil, resinoid, etc RB manufacturers6419 Converted paper and paperboard, nes RB manufacturers6612 Cement RB manufacturers6633 Manufactures of mineral materials, nes (other than ceramic) RB manufacturers6635 Wool; expanding or insulating mineral materials, nes RB manufacturers6639 Articles of ceramic materials, nes RB manufacturers6821 Copper and copper alloys, refined or not, unwrought RB manufacturers6822 Copper and copper alloys, worked RB manufacturers6831 Nickel and nickel alloys, unwrought RB manufacturers6851 Lead, and lead alloys, unwrought RB manufacturers6871 Tin and tin alloys, unwrought RB manufacturers
Dullien/Joebges/Palazzo German export surges September 24, 2019
18
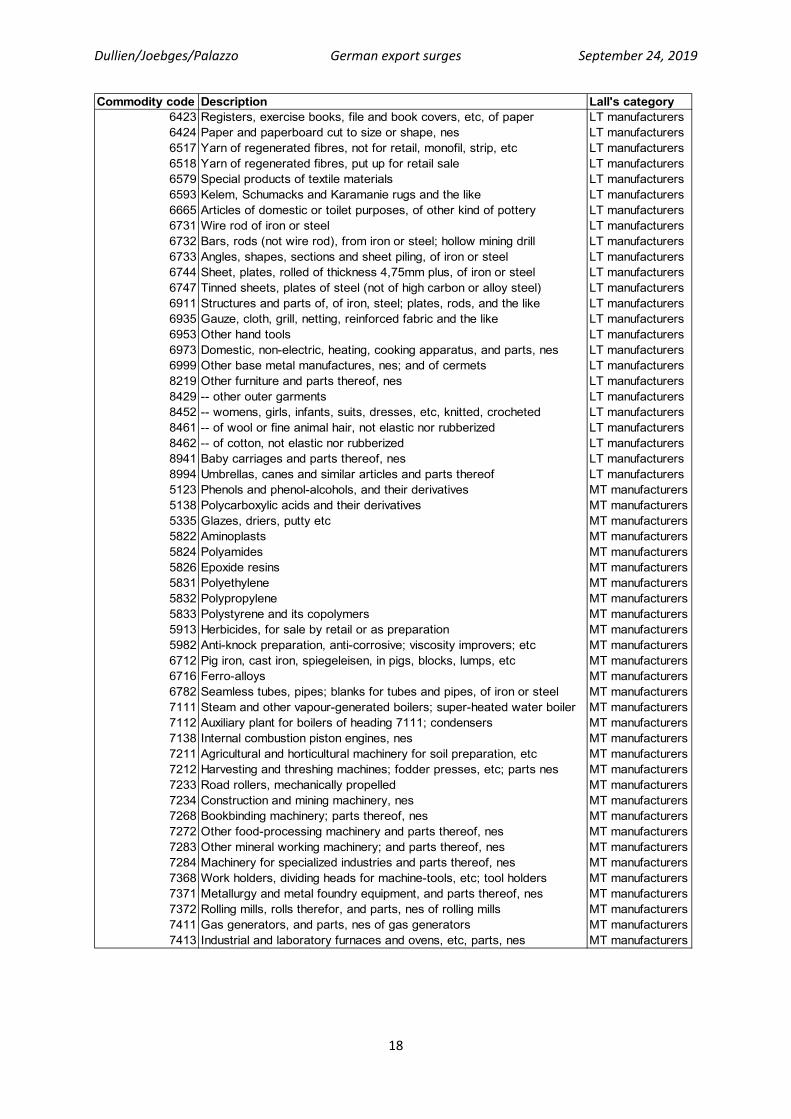
Commodity code Description Lall's category6423 Registers, exercise books, file and book covers, etc, of paper LT manufacturers6424 Paper and paperboard cut to size or shape, nes LT manufacturers6517 Yarn of regenerated fibres, not for retail, monofil, strip, etc LT manufacturers6518 Yarn of regenerated fibres, put up for retail sale LT manufacturers6579 Special products of textile materials LT manufacturers6593 Kelem, Schumacks and Karamanie rugs and the like LT manufacturers6665 Articles of domestic or toilet purposes, of other kind of pottery LT manufacturers6731 Wire rod of iron or steel LT manufacturers6732 Bars, rods (not wire rod), from iron or steel; hollow mining drill LT manufacturers6733 Angles, shapes, sections and sheet piling, of iron or steel LT manufacturers6744 Sheet, plates, rolled of thickness 4,75mm plus, of iron or steel LT manufacturers6747 Tinned sheets, plates of steel (not of high carbon or alloy steel) LT manufacturers6911 Structures and parts of, of iron, steel; plates, rods, and the like LT manufacturers6935 Gauze, cloth, grill, netting, reinforced fabric and the like LT manufacturers6953 Other hand tools LT manufacturers6973 Domestic, non-electric, heating, cooking apparatus, and parts, nes LT manufacturers6999 Other base metal manufactures, nes; and of cermets LT manufacturers8219 Other furniture and parts thereof, nes LT manufacturers8429 -- other outer garments LT manufacturers8452 -- womens, girls, infants, suits, dresses, etc, knitted, crocheted LT manufacturers8461 -- of wool or fine animal hair, not elastic nor rubberized LT manufacturers8462 -- of cotton, not elastic nor rubberized LT manufacturers8941 Baby carriages and parts thereof, nes LT manufacturers8994 Umbrellas, canes and similar articles and parts thereof LT manufacturers5123 Phenols and phenol-alcohols, and their derivatives MT manufacturers5138 Polycarboxylic acids and their derivatives MT manufacturers5335 Glazes, driers, putty etc MT manufacturers5822 Aminoplasts MT manufacturers5824 Polyamides MT manufacturers5826 Epoxide resins MT manufacturers5831 Polyethylene MT manufacturers5832 Polypropylene MT manufacturers5833 Polystyrene and its copolymers MT manufacturers5913 Herbicides, for sale by retail or as preparation MT manufacturers5982 Anti-knock preparation, anti-corrosive; viscosity improvers; etc MT manufacturers6712 Pig iron, cast iron, spiegeleisen, in pigs, blocks, lumps, etc MT manufacturers6716 Ferro-alloys MT manufacturers6782 Seamless tubes, pipes; blanks for tubes and pipes, of iron or steel MT manufacturers7111 Steam and other vapour-generated boilers; super-heated water boiler MT manufacturers7112 Auxiliary plant for boilers of heading 7111; condensers MT manufacturers7138 Internal combustion piston engines, nes MT manufacturers7211 Agricultural and horticultural machinery for soil preparation, etc MT manufacturers7212 Harvesting and threshing machines; fodder presses, etc; parts nes MT manufacturers7233 Road rollers, mechanically propelled MT manufacturers7234 Construction and mining machinery, nes MT manufacturers7268 Bookbinding machinery; parts thereof, nes MT manufacturers7272 Other food-processing machinery and parts thereof, nes MT manufacturers7283 Other mineral working machinery; and parts thereof, nes MT manufacturers7284 Machinery for specialized industries and parts thereof, nes MT manufacturers7368 Work holders, dividing heads for machine-tools, etc; tool holders MT manufacturers7371 Metallurgy and metal foundry equipment, and parts thereof, nes MT manufacturers7372 Rolling mills, rolls therefor, and parts, nes of rolling mills MT manufacturers7411 Gas generators, and parts, nes of gas generators MT manufacturers7413 Industrial and laboratory furnaces and ovens, etc, parts, nes MT manufacturers
Dullien/Joebges/Palazzo German export surges September 24, 2019
19
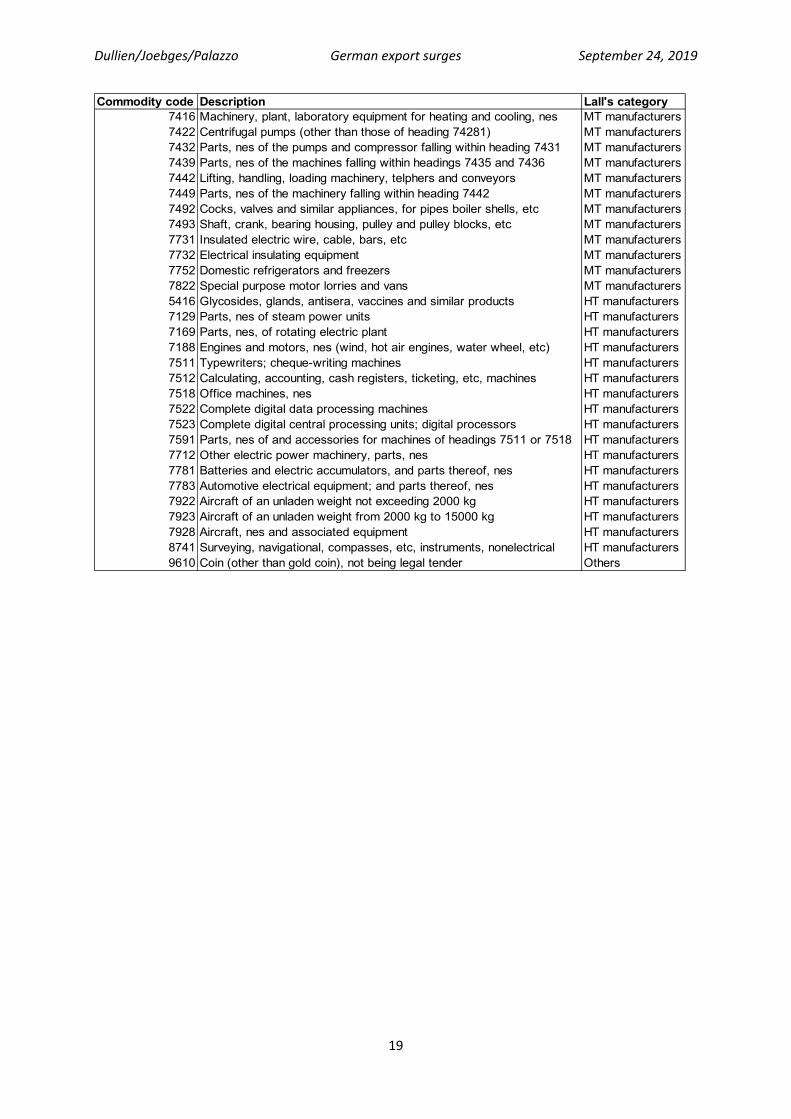
Commodity code Description Lall's category7416 Machinery, plant, laboratory equipment for heating and cooling, nes MT manufacturers7422 Centrifugal pumps (other than those of heading 74281) MT manufacturers7432 Parts, nes of the pumps and compressor falling within heading 7431 MT manufacturers7439 Parts, nes of the machines falling within headings 7435 and 7436 MT manufacturers7442 Lifting, handling, loading machinery, telphers and conveyors MT manufacturers7449 Parts, nes of the machinery falling within heading 7442 MT manufacturers7492 Cocks, valves and similar appliances, for pipes boiler shells, etc MT manufacturers7493 Shaft, crank, bearing housing, pulley and pulley blocks, etc MT manufacturers7731 Insulated electric wire, cable, bars, etc MT manufacturers7732 Electrical insulating equipment MT manufacturers7752 Domestic refrigerators and freezers MT manufacturers7822 Special purpose motor lorries and vans MT manufacturers5416 Glycosides, glands, antisera, vaccines and similar products HT manufacturers7129 Parts, nes of steam power units HT manufacturers7169 Parts, nes, of rotating electric plant HT manufacturers7188 Engines and motors, nes (wind, hot air engines, water wheel, etc) HT manufacturers7511 Typewriters; cheque-writing machines HT manufacturers7512 Calculating, accounting, cash registers, ticketing, etc, machines HT manufacturers7518 Office machines, nes HT manufacturers7522 Complete digital data processing machines HT manufacturers7523 Complete digital central processing units; digital processors HT manufacturers7591 Parts, nes of and accessories for machines of headings 7511 or 7518 HT manufacturers7712 Other electric power machinery, parts, nes HT manufacturers7781 Batteries and electric accumulators, and parts thereof, nes HT manufacturers7783 Automotive electrical equipment; and parts thereof, nes HT manufacturers7922 Aircraft of an unladen weight not exceeding 2000 kg HT manufacturers7923 Aircraft of an unladen weight from 2000 kg to 15000 kg HT manufacturers7928 Aircraft, nes and associated equipment HT manufacturers8741 Surveying, navigational, compasses, etc, instruments, nonelectrical HT manufacturers9610 Coin (other than gold coin), not being legal tender Others
Dullien/Joebges/Palazzo German export surges September 24, 2019
20
A3: Export surges for the sample of 46 countries starting in 1987, with and without
China Figure A3.1: Proportion of export industries with surges, expanded countries sample (1987‐2015), (in
percentage)
Source: UN Comtrade data, own calculations.
0.0%
5.0%
10.0%
15.0%
20.0%
25.0%
93 94 95 96 97 98 99 00 01 02 03 04 05 06 07 08 09 10
(a) Total industries
0.0%
5.0%
10.0%
15.0%
20.0%
25.0%
93 94 95 96 97 98 99 00 01 02 03 04 05 06 07 08 09 10
(b) Commodities
0.0%
5.0%
10.0%
15.0%
20.0%
25.0%
93 94 95 96 97 98 99 00 01 02 03 04 05 06 07 08 09 10
(c) RB manufacturers
0.0%
5.0%
10.0%
15.0%
20.0%
25.0%
93 94 95 96 97 98 99 00 01 02 03 04 05 06 07 08 09 10
(d) LT manufacturers
0.0%
5.0%
10.0%
15.0%
20.0%
25.0%
93 94 95 96 97 98 99 00 01 02 03 04 05 06 07 08 09 10
(e) MT manufacturers
0.0%
5.0%
10.0%
15.0%
20.0%
25.0%
93 94 95 96 97 98 99 00 01 02 03 04 05 06 07 08 09 10
(f) HT manufacturers
Dullien/Joebges/Palazzo German export surges September 24, 2019
21
Figure A3.2: Proportion of export industries with surges, excluding exports to China (in percentage)
Source: UN Comtrade data, own calculations.
0.0%
5.0%
10.0%
15.0%
20.0%
25.0%
30.0%
87 88 89 90 91 92 93 94 95 96 97 98 99 00 01 02 03 04 05 06 07 08 09 10
(a) Total industries
0.0%
5.0%
10.0%
15.0%
20.0%
25.0%
30.0%
87 88 89 90 91 92 93 94 95 96 97 98 99 00 01 02 03 04 05 06 07 08 09 10
(b) Commodities
0.0%
5.0%
10.0%
15.0%
20.0%
25.0%
30.0%
87 88 89 90 91 92 93 94 95 96 97 98 99 00 01 02 03 04 05 06 07 08 09 10
(c) RB manufacturers
0.0%
5.0%
10.0%
15.0%
20.0%
25.0%
30.0%
87 88 89 90 91 92 93 94 95 96 97 98 99 00 01 02 03 04 05 06 07 08 09 10
(c) LT manufacturers
0.0%
5.0%
10.0%
15.0%
20.0%
25.0%
30.0%
87 88 89 90 91 92 93 94 95 96 97 98 99 00 01 02 03 04 05 06 07 08 09 10
(c) MT manufacturers
0.0%
5.0%
10.0%
15.0%
20.0%
25.0%
87 88 89 90 91 92 93 94 95 96 97 98 99 00 01 02 03 04 05 06 07 08 09 10
(c) HT manufacturers
Dullien/Joebges/Palazzo German export surges September 24, 2019
22
References Albu, Nora; Joebges, Heike; Zwiener, Rudolf (2018): A dispute with Dustmann et al. (2014): ‘From Sick
Man of Europe to Economic Superstar: Germany's Resurgent Economy’. IMK Working Paper,
Nr. 192. Düsseldorf, pp. 1‐33.
Allard, C.; Catalan, M.; Everaert, L.; Sgherri, S. (2005): France, Germany, Italy and Spain: Explaining
Differences in External Sector Performance among Large Euro Area Countries. IMF Country
Report, No. 05/401.
Altomonte, C.; di Mauro, F.; Osbat, C. I.: (2013): Going beyond labour costs: how and why ‘structural’
and microbased factors can help explaining export performance? COMPNET Policy Brief, No.
01.
Baccaro, L. (2018): The Flexibilisation of German Industrial Relations, in: Marin, D. (ed.): Explaining
Germany’s Exceptional Recovery. A VoxEU.org eBook. London: CEPR Press, pp. 31‐37.
Bayoumi, T.; Harmsen, R.; Turunen, J. (2011): Euro Area Export Performance and Competitiveness,
IMF Working Paper, WP/11/140.
Carlin, W.; Glyn, A.; Van Reenan, J. (2001): Export Market Performance of OECD countries: An
Empirical Examination of the Role of Cost Competitiveness. The Economic Journal, Vol. 111,
issue 468, pp. 128‐162.
Cerra, V.; Soikkeli, J.; Saxena, S. C. (2003): How Competitive is Irish Manufacturing? Economic and
Social Review, Vol. 34 (2), pp. 173‐193.
Danninger, S.; Joutz, F. (2007): What Explains Germany’s Rebounding Export Market Share?, IMF
Working Paper WP/07/24
Deutsche Bundesbank (2016): The impact of alternative indicators of price competitiveness on real
exports of goods and services. Deutsche Bundesbank, Monthly Report No. 1, Frankfurt/Main,
January, pp. 13‐24.
Dustmann, C.; Fitzenberger, B.; Schönberg, U.; Spitz‐Oener, A. (2014): From Sick Man of Europe to
Economic Superstar: Germany’s Resurgent Economy. Journal of Economic Perspectives, Vol.
28 (1), pp. 167‐188.
Flassbeck, H.; Lapavitsas, C. (2013): The Systemic Crisis of the Euro: True Causes and Effective
Therapies, Rosa Luxemburg Stiftung Studien,
http://www.rosalux.de/fileadmin/rls_uploads/pdfs/Studien/Studien_The_systemic_crisis_we
b.pdf
Freund, C.; Pierola, M. D. (2012): Export surges, Journal of Development Economics, Vol. 97, issue 2,
pp. 387‐395.
Horn, G. A.; Lindner, F.; Stephan, S.; Zwiener, R. (2017): The role of nominal wages in trade and
current account surpluses. IMK Report, No. 125e.
Karadeloglou, P.; Benkovskis, K. (eds.) and the CompNet Task Force (2015): Compendium on the
diagnostic toolkit for competitiveness. ECB Occasional Paper Series, No. 163.
Lall, S. (2000): The technological structure and performance of developing country manufactured
exports, 1985‐1998, QEH Working Paper Series, No. 44.
Leigh, D.; Lian, W.; Poplawski‐Ribeiro, M.; Szymanski, R.; Tsyrennikov, V.; Yang, H. (2017): Exchange
Rates and Trade: A Disconnect? IMF Working Paper, WP/17/58
Dullien/Joebges/Palazzo German export surges September 24, 2019
23
Loschky, A.; Ritter, L. (2007): Konjunkturmotor Export. Statistisches Bundesamt: Wirtschaft und
Statistik, Issue 5, pp. 478‐488.
Meinhardt, V.; Zwiener, R. (2005): Gesamtwirtschaftliche Wirkungen einer Steuerfinanzierung
versicherungsfremder Leistungen in der Sozialversicherung: Endbericht. DIW Berlin:
Politikberatung Kompakt, Vol. 7.
Melitz, M. J. (2003): The Impact of Trade on Intra‐Industry Reallocations and Aggregate Industry
Productivity, Econometrica, Vol. 71, pp. 1695‐1725.
Neary, J. P. (2006): Measuring competitiveness. IMF Working Paper, WP/06/209.
Palazzo, G.; Rapetti, M. (2017): Real exchange rate and export performance in Argentina, 2002–2008,
Journal of Post Keynesian Economics, Vol. 40, Issue 1, pp.1‐20
Schröder, E. (2011): Trade balances in Germany and the United States: Demand dominates price.
Term Paper for Advanced Macroeconomics. Department of Economics, New School for Social
Research, New York.
Stahn, K. (2006): Has the export pricing behaviour of German enterprises changed? Empirical
evidence from German sectoral export prices, Deutsche Bank Discussion Paper Series 1:
Economic Studies, No, 37.
Sabine S. (2005): Pricing‐to‐Market Effects in Foreign Trade Prices. Evidence from a Cointegration
Approach for Germany, IMK Working Paper, 07‐2005, IMK at the Hans Boeckler Foundation,
Macroeconomic Policy Institute.
Storm, S.; Naastepad, C. W. M. (2015): Crisis and recovery in the German economy: The real lessons.
Structural Change and Economic Dynamics, Vol. 32, pp. 11‐24.