cost accounting part 2
TRANSCRIPT
CA-CMA Inter
Cost Accounting
Part 2
Dr CMA T K Sridhar
Edition: September, 2021
Price: ₹250 [for volumes I and II]
For users who are benefited, pay to…
Account holder name: Singar Educational and Charitable Trust
Account number: 1262 1150 0000 9481
IFSC code: KVBL0001262
Bank name: Karur Vysya Bank
CALL OR VISIT FOR COPIES
Published by
SINGAR BOOKS AND PUBLICATIONS
Head Office: 32-B, Vivekananda Nagar, Ramalinga Nagar, Woriur, Trichy 620 003, TN
Branch Office: 76/1, New Street, Valluvar Kottam High Road,
Nungambakkam, Chennai – 600 034
Ph: Trichy: 93451 22645 | Chennai: 93453 96855
www.singaracademy.in | [email protected]

CONTENT
Page
Cost Accounting
1 Cost Book Keeping 1
2 Methods of Costing
2.1 Job Costing 12
2.2 Batch Costing 19
2.3 Contract Costing 21
2.4 Process Costing 34
2.5 Joint Products & By Products 57
2.6 Service Costing / Operating Costing 64
3 Cost Accounting Technique
3.1 Marginal Costing 74
3.2 Standard Costing – Variance Analysis 95
3.3 Budget and Budgetary Control 109


Cost Book Keeping 1
1. COST BOOK KEEPING
1. Cost Control Accounts: These are accounts maintained for the purpose of exercising control over
the costing ledgers and also to complete the double entry in cost accounts.
2. Integral System of Accounting – A system of accounting where both costing and financial
transactions are recorded in the same set of books.
3. Non-Integral System of Accounting – A system of accounting where two sets of books are
maintained – (i) for costing transactions and (ii) for financial transactions.
4. Reconciliation – In the Non-Integral System of Accounting, since the cost and financial accounts
are kept separately, it is needed for reconciliation.
Format a Reconciliation Statement
Particulars ₹ ₹
Profit as per Cost Accounts ××××
Add Items increases profit in financial accounts:
Over-absorption of OH ××××
Over-valuation of Opening Stock in Costing ××××
Under-valuation of Closing Stock in Costing ××××
Financial Incomes: (e.g.) Interest & Dividend ×××× ××××
Less Items decreases profit in financial accounts:
Under-absorption of OH ××××
Under-valuation of Opening Stock in Costing ××××
Over-valuation of Closing Stock in Costing ××××
Financial Expenses: Bad Debts ×××× ××××
Profit as per Financial Accounts (A + B +C) ××××
PRACTICAL PROBLEMS
Non-Integration or Inter Locking Method
Question 1: The following balances appeared in the books on 1.1.2019:
General Ledger Adjustment A/c 15,200
Stores Ledger Control Account 8,750
Work-in-progress Ledger Control A/c 4,280
Finished Goods Ledger Control A/c 2,170 15,200
On 31.12.2019 the following information were supplied
Purchases for stores 60,640
Purchases for special job 1,950
Cost Accounting 2
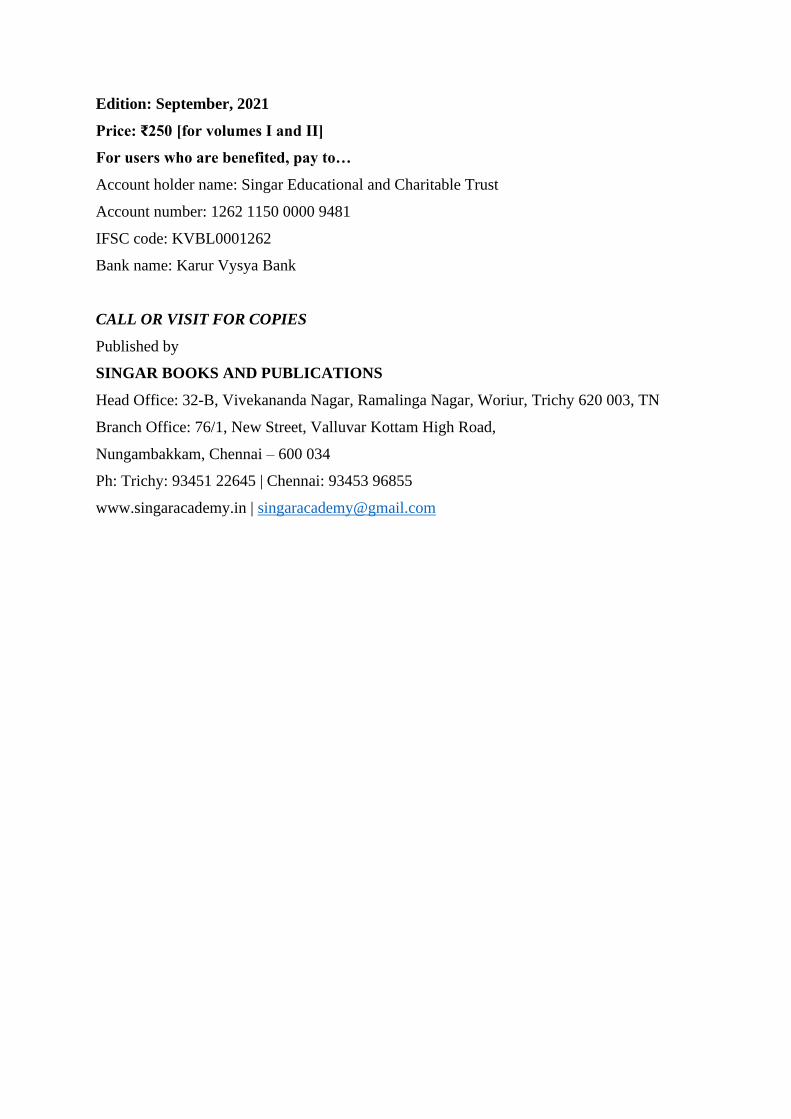
Direct wages 38,627
Indirect factory wages 9,543
Administration salaries 6,731
Selling and distribution salaries 4,252 59,153
Production expenses 10,432
Administrative expenses 9,546
Selling and distribution expenses 6,430
Stores issued to production 56,501
Stores issued to maintenance account 2,586
Returns to supplier 312
Production overhead absorbed by production 23,410
Administrative OH absorbed by finished goods 15,150
Selling overhead recovered on sales 9,515
Production finished during the year 1,18,517
Finished goods sold at cost 1,33,382
Sales 1,55,000
You are required to record the entries in cost ledger for the year 2001 and prepare a TB.
Answer: M.K. Company Ltd. – COST LEDGER
General Ledger Adjustment A/c
To Stores Ledger Control A/c 312 By Balance b/d 15,200
Sales A/c 1,55,000 Stores Ledger Control A/c 60,640
Balance c/d 18,697 Work-in-progress Control A/c 1,950
Wages Control A/c 59,153
Production OH Control A/c 10,432
Administration OH Control A/c 9,546
Selling OH Control A/c 6,430
Costing P & L A/c 10,658
1,74,009 1,74,009
Stores Ledger Control A/c
To Balance b/d 8,750 By Work-in-progress C A/c 56,501
General Ledger Adj. A/c 60,640 Production OH C A/c 2,586
General Ledger Adj. A/c 312

Cost Book Keeping 3
Balance c/d 9,991
69,390 69,390
Stores Ledger Control A/c
To Balance b/d 8,750 By Work-in-progress Control A/c 56,501
General Ledger Adj. A/c 60,640 Production OH Control A/c 2,586
General Ledger Adj. A/c 312
Balance c/d 9,991
69,390 69,390
Wages Control A/c
To General Ledger Adj. A/c 59,153 By Work-in-progress C A/c 38,627
Production OH C A/c 9,543
AOH C A/c 6,731
Selling OH C A/c 4,252
59,153 59,153
Production OH Control A/c
To General Ledger Adj. A/c 10,432 By Work-in-progress C A/c 23,410
Stores Ledger C A/c 2,586
Wages C A/c 9,543
Costing P & L A/c (OA) 849
23,410 23,410
Work-in-progress Control A/c
To Balance b/d 4,280 By FG Control A/c 1,18,517
General Ledger Adj. A/c 1,950 Balance c/d 6,251
Stores Ledger Control A/c 56,501
Wages Control A/c 38,627
Production OH C A/c 23,410
1,24,768 1,24,768
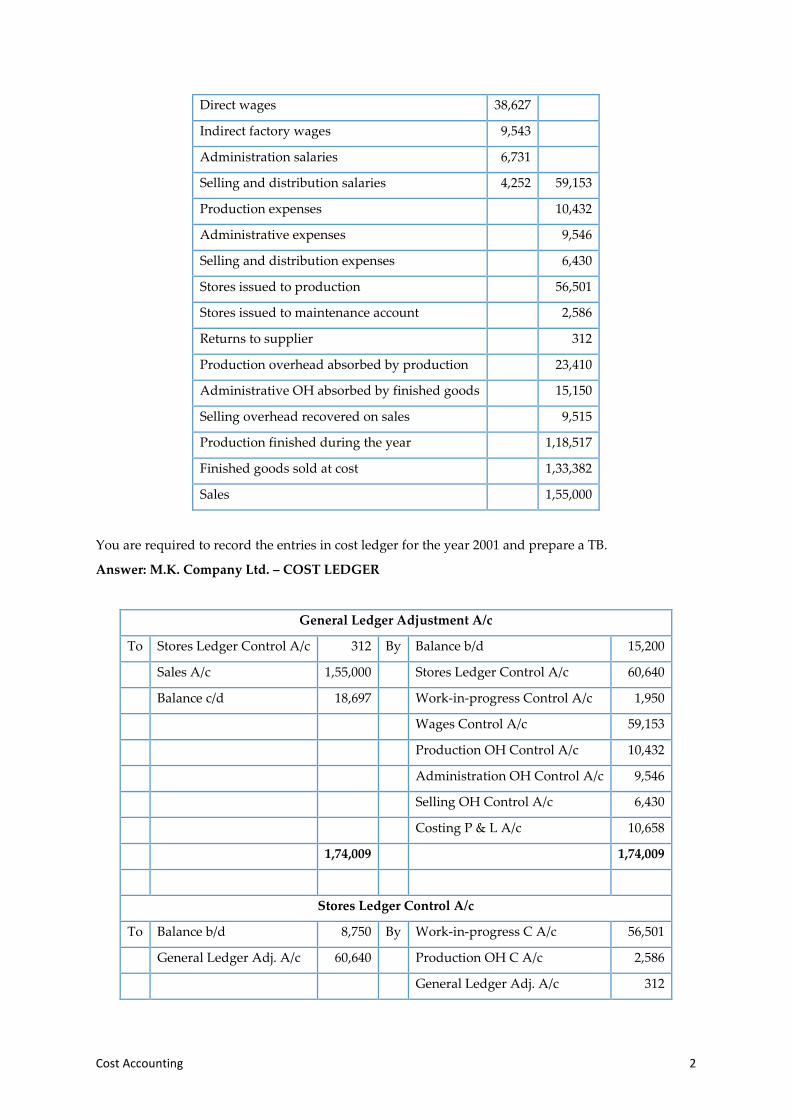
Administration Overhead Control A/c
To General Ledger Adj. A/c 9,546 By FG Control A/c 15,150
Wages Control A/c 6,731 Costing P/L (UA) 1,127
Cost Accounting 4
16,277 16,277
Finished Goods Control A/c
To Balance b/d 2,170 By Cost of Sales a/c 1,33,382
WIP Control A/c 1,18,517 Balance c/d 2,455
AOH Control a/c 15,150
1,35,837 1,35,837
Selling Overhead Control A/c
To General Ledger Adj. a/c 6,430 By Cost of Sales a/c 9,515
Wages Control a/c 4,252 Costing P/L (UA) 1,167
10,682 10,682
Cost of Sales A/c
To FG Control a/c 1,33,382 By Sales A/c 1,42,897
Selling OH Control a/c 9,515
1,42,897 1,42,897
Costing P/L A/c
To Cost of Sales A/c 1,42,897 By General Ledger Adj. A/c 1,55,000
AOH Control A/c 1,127 Production OH Control A/c 849
Selling OH Control a/c 1,167
General Ledger Adj. A/c 10,658
1,55,849 1,55,849
Trail Balance
Stores Ledger Control A/c 9,991 General Ledger Adj. A/c 18,697
WIP Ledger Control A/c 6,251
FG Ledger Control A/c 2,455
18,697 18,967
Cost Book Keeping 5
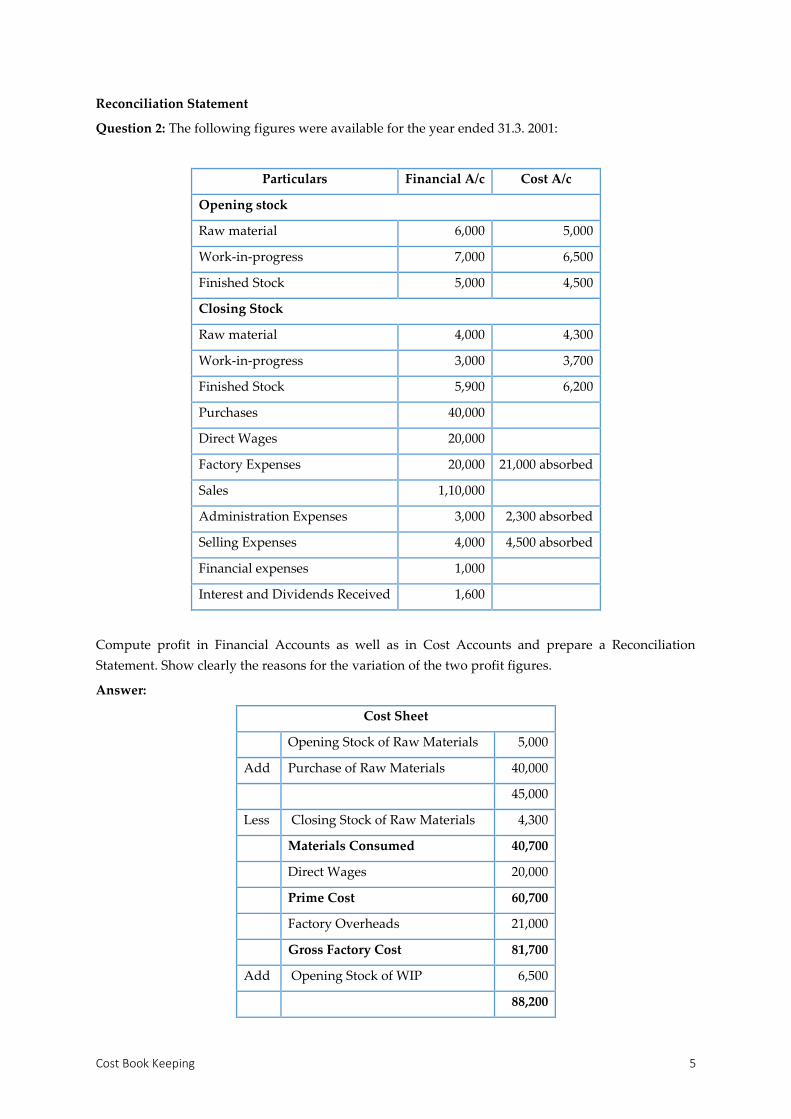
Reconciliation Statement
Question 2: The following figures were available for the year ended 31.3. 2001:
Particulars Financial A/c Cost A/c
Opening stock
Raw material 6,000 5,000
Work-in-progress 7,000 6,500
Finished Stock 5,000 4,500
Closing Stock
Raw material 4,000 4,300
Work-in-progress 3,000 3,700
Finished Stock 5,900 6,200
Purchases 40,000
Direct Wages 20,000
Factory Expenses 20,000 21,000 absorbed
Sales 1,10,000
Administration Expenses 3,000 2,300 absorbed
Selling Expenses 4,000 4,500 absorbed
Financial expenses 1,000
Interest and Dividends Received 1,600
Compute profit in Financial Accounts as well as in Cost Accounts and prepare a Reconciliation
Statement. Show clearly the reasons for the variation of the two profit figures.
Answer:
Cost Sheet
Opening Stock of Raw Materials 5,000
Add Purchase of Raw Materials 40,000
45,000
Less Closing Stock of Raw Materials 4,300
Materials Consumed 40,700
Direct Wages 20,000
Prime Cost 60,700
Factory Overheads 21,000
Gross Factory Cost 81,700
Add Opening Stock of WIP 6,500
88,200
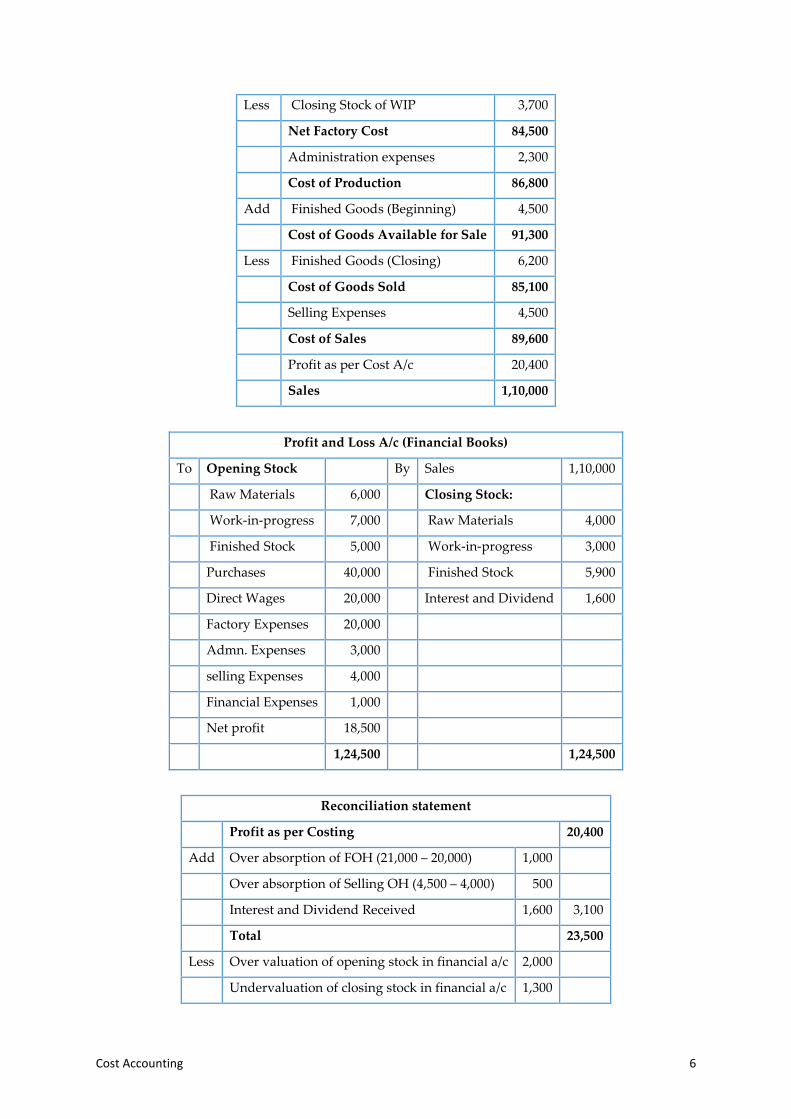
Cost Accounting 6
Less Closing Stock of WIP 3,700
Net Factory Cost 84,500
Administration expenses 2,300
Cost of Production 86,800
Add Finished Goods (Beginning) 4,500
Cost of Goods Available for Sale 91,300
Less Finished Goods (Closing) 6,200
Cost of Goods Sold 85,100
Selling Expenses 4,500
Cost of Sales 89,600
Profit as per Cost A/c 20,400
Sales 1,10,000
Profit and Loss A/c (Financial Books)
To Opening Stock By Sales 1,10,000
Raw Materials 6,000 Closing Stock:
Work-in-progress 7,000 Raw Materials 4,000
Finished Stock 5,000 Work-in-progress 3,000
Purchases 40,000 Finished Stock 5,900
Direct Wages 20,000 Interest and Dividend 1,600
Factory Expenses 20,000
Admn. Expenses 3,000
selling Expenses 4,000
Financial Expenses 1,000
Net profit 18,500
1,24,500 1,24,500
Reconciliation statement
Profit as per Costing 20,400
Add Over absorption of FOH (21,000 – 20,000) 1,000
Over absorption of Selling OH (4,500 – 4,000) 500
Interest and Dividend Received 1,600 3,100
Total 23,500
Less Over valuation of opening stock in financial a/c 2,000
Undervaluation of closing stock in financial a/c 1,300

Cost Book Keeping 7
Financial expenses charged in financial a/c 1,000
Under absorption of AOH 700 5,000
Profit as per Financial A/c 18,500
Question 3: A manufacturing company disclosed a net loss of ₹3,47,000 as per their cost accounts for
the year ended 31.3.2003. The financial accounts however disclosed a net loss of ₹5,10,000 for the same
period. The following information was revealed as a result of scrutiny of the figures of both the sets of
accounts.
Particulars ₹
(i) Factory Overheads under-absorbed 40,000
(ii) Administration Overheads over-absorbed 60,000
(iii) Depreciation charged in Financial Accounts 3,25,000
(iv) Depreciation charged in Cost Accounts 2,75,000
(v) Interest on investments not included in Cost Accounts 96,000
(vi) Income-tax provided 54,000
(vii) Interest on loan funds in Financial Accounts 2,45,000
(viii) Transfer fees (credit in financial books) 24,000
(ix) Stores adjustment (credit in financial books) 14,000
(x) Dividend received 32,000
Prepare a memorandum Reconciliation A/c
Answer:
Memorandum Reconciliation A/c
Particulars ₹ Particulars ₹
To Net loss as per costing 3,47,000 By Over absorption of AOH 60,000
Under absorption of FOH 40,000 Financial items (Credits)
Depreciation charged less in Costing 50,000 Interest on investment 96,000
Financial items (Debits) Transfer fees 24,000
Income tax 54,000 Stores adjustment 14,000
Interest on loan 2,45,000 Dividend received 32,000
Net loss as per financial a/c 5,10,000
7,36,000 7,36,000

Cost Accounting 8
Integrated A/c
Question 4: The extract of balances of integrated ledger on 31.3.2020 is given below:
Particulars Dr Cr
Stores Control A/c 3,600
FG A/c 2,600
WIP A/c 3,400
Creditors A/c 1,600
Cash at Bank 2,000
Debtors A/c 2,400
Fixed Assets A/c 11,000
P/L A/c 6,400
Depreciation Provision A/c 1,000
Share Capital A/c 16,000
Total 25,000 25,000
Transactions for the year ending 31st March, 2020 were:
Particulars ₹ Particulars ₹
Wages-indirect 1,000 Selling and distribution OH – cheque 2,800
Wages-direct 17,400 Depreciation (works) 260
Stores purchased on credit 20,000 Payment from customers 58,000
Stores issued to production 22,000 Payment to suppliers 20,200
Stores issued to repair order 400 Purchases of fixed assets in cash 400
Goods finished during the period 43,000 Fines paid 100
Goods sold at cost 46,400 Income Tax 4,000
Goods sold at sales value (on credit) 60,000 Charitable donations 200
Production overhead recovered 9,600 Prepaid rent in production OH 60
Production overhead Paid –Cheque 8,000 Interest on Bank Loan 20
Administration overhead –Cheque 2,400
You are required to write up the a/c in integral ledger and take out a TB.
Answer:
Stores Ledger Control A/c
Particulars ₹ Particulars ₹
To Balance b/d 3,600 By WIP Control A/c 22,000
Creditors A/c 20,000 POH Control A/c 400
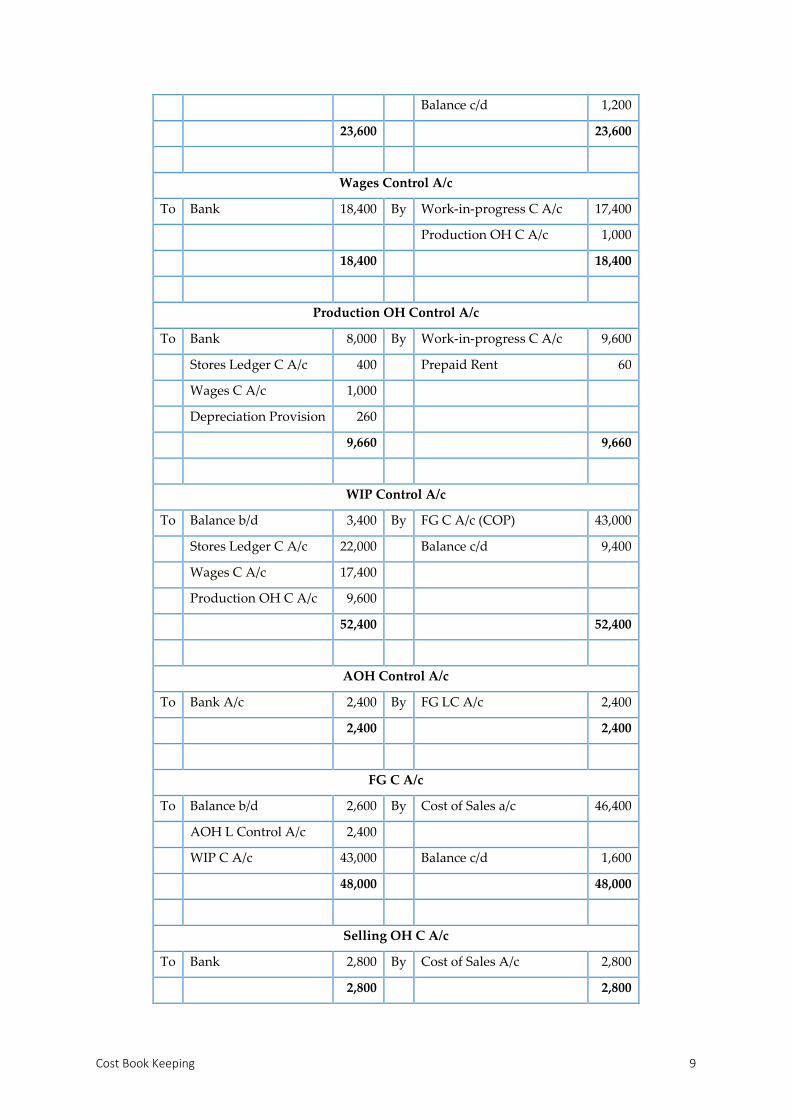
Cost Book Keeping 9
Balance c/d 1,200
23,600 23,600
Wages Control A/c
To Bank 18,400 By Work-in-progress C A/c 17,400
Production OH C A/c 1,000
18,400 18,400
Production OH Control A/c
To Bank 8,000 By Work-in-progress C A/c 9,600
Stores Ledger C A/c 400 Prepaid Rent 60
Wages C A/c 1,000
Depreciation Provision 260
9,660 9,660
WIP Control A/c
To Balance b/d 3,400 By FG C A/c (COP) 43,000
Stores Ledger C A/c 22,000 Balance c/d 9,400
Wages C A/c 17,400
Production OH C A/c 9,600
52,400 52,400
AOH Control A/c
To Bank A/c 2,400 By FG LC A/c 2,400
2,400 2,400
FG C A/c
To Balance b/d 2,600 By Cost of Sales a/c 46,400
AOH L Control A/c 2,400
WIP C A/c 43,000 Balance c/d 1,600
48,000 48,000
Selling OH C A/c
To Bank 2,800 By Cost of Sales A/c 2,800
2,800 2,800
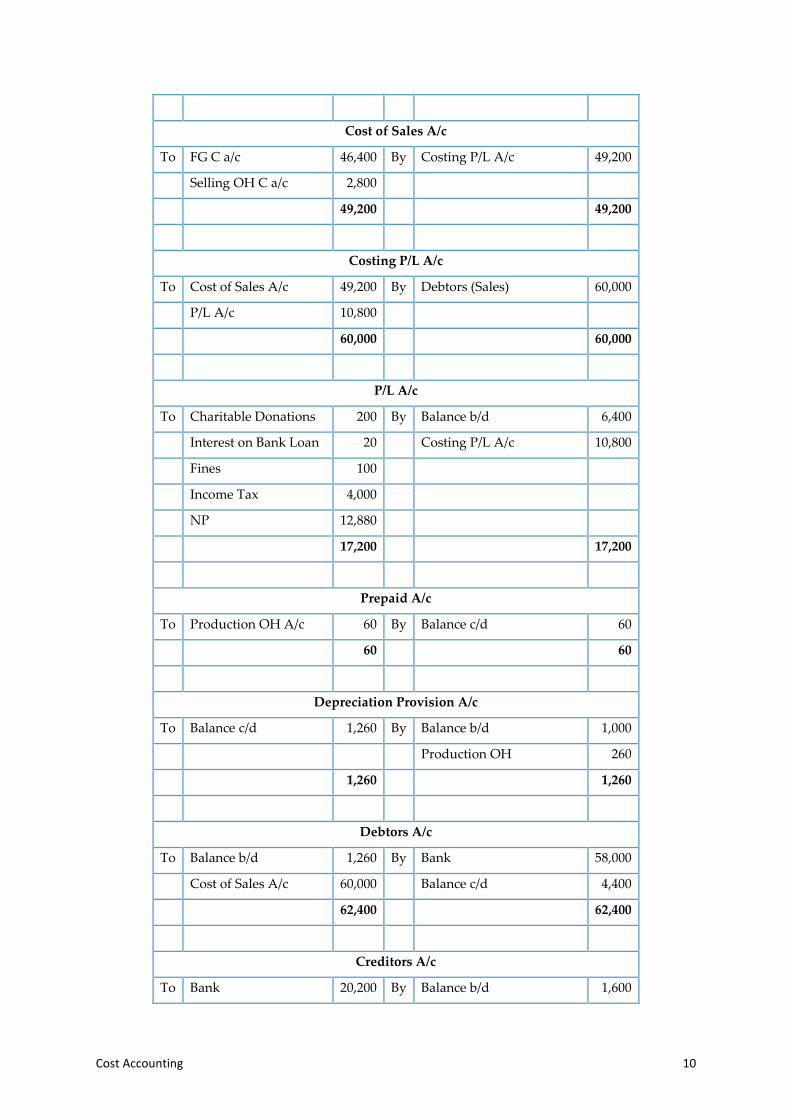
Cost Accounting 10
Cost of Sales A/c
To FG C a/c 46,400 By Costing P/L A/c 49,200
Selling OH C a/c 2,800
49,200 49,200
Costing P/L A/c
To Cost of Sales A/c 49,200 By Debtors (Sales) 60,000
P/L A/c 10,800
60,000 60,000
P/L A/c
To Charitable Donations 200 By Balance b/d 6,400
Interest on Bank Loan 20 Costing P/L A/c 10,800
Fines 100
Income Tax 4,000
NP 12,880
17,200 17,200
Prepaid A/c
To Production OH A/c 60 By Balance c/d 60
60 60
Depreciation Provision A/c
To Balance c/d 1,260 By Balance b/d 1,000
Production OH 260
1,260 1,260
Debtors A/c
To Balance b/d 1,260 By Bank 58,000
Cost of Sales A/c 60,000 Balance c/d 4,400
62,400 62,400
Creditors A/c
To Bank 20,200 By Balance b/d 1,600

Cost Book Keeping 11
Balance c/d 1,400 Stores Control A/c 20,000
21,600 21,600
Fixed Assets A/c
To Balance b/d 11,000 By
Bank 400 Balance c/d 11,400
11,400 11,400
Bank A/c
To Balance b/d 2,000 By Wages C A/c 18,400
Debtors A/c 58,000 Fixed Assets A/c 400
Production OH A/c 8,000
Administration OH A/c 2,400
Selling OH 2,800
Creditors A/c 20,200
Charitable Donation 200
Fines 100
Interest on Bank Loan 20
Income Tax 4,000
Balance c/d 3,480
60,000 60,000
Share Capital A/
To Balance c/d 16,000 By Balance b/d 16,000
16,000 16,000
Trail Balance
Stores C A/c 1,200 Creditors A/c 1,400
FG A/c 1,600 P/L A/c 12,880
WIP A/c 9,400 Depreciation Provision A/c 1,260
Cash at Bank 3,480 Share Capital A/c 16,000
Debtors A/c 4,400
Prepayments A/c 60
Fixed Assets A/c 11,400
31,540 31,540
Cost Accounting 12
2 METHODS OF COSTING
2.1 JOB COSTING
Job costing:
A method of costing
Used when the work is undertaken as per the customer’s special requirement
Price is quoted to the customer on estimation
Actual cost is compared with estimation for price variation and P/L
Applicable: printing press, ship-building, heavy machinery, interior decoration, etc.
{CA inter M01}
PRACTICAL PROBLEMS
Job Cost Sheet
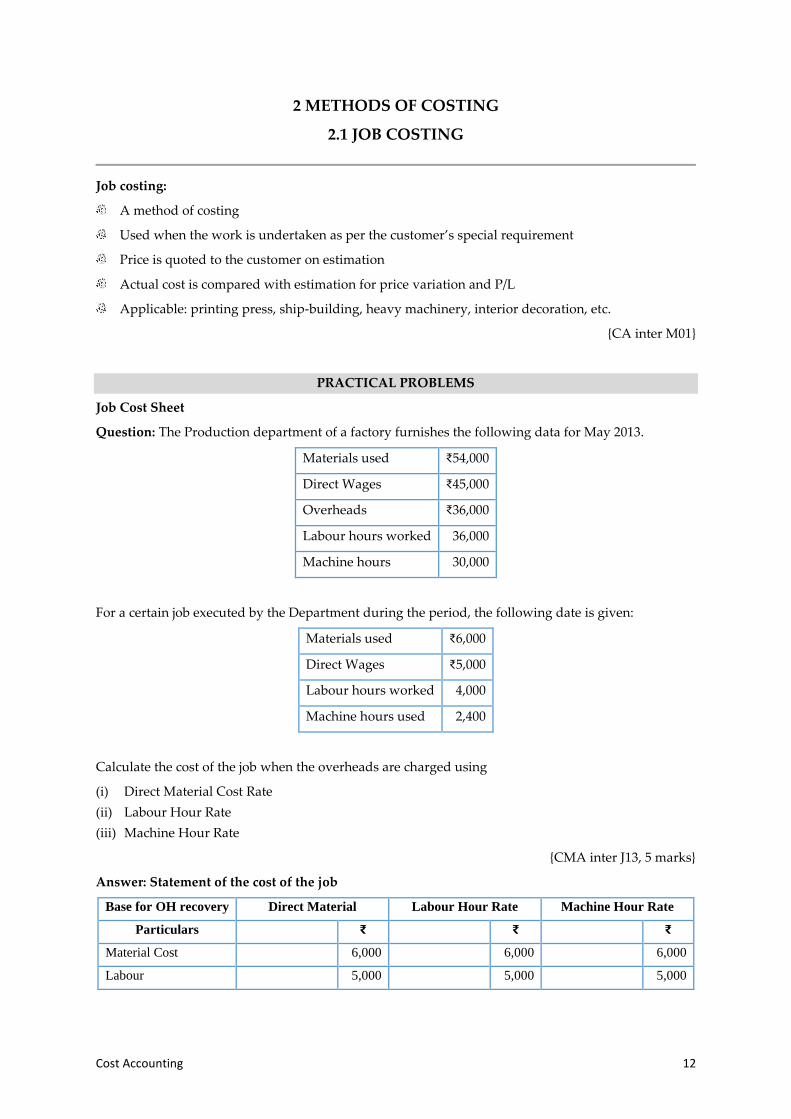
Question: The Production department of a factory furnishes the following data for May 2013.
Materials used ₹54,000
Direct Wages ₹45,000
Overheads ₹36,000
Labour hours worked 36,000
Machine hours 30,000
For a certain job executed by the Department during the period, the following date is given:
Materials used ₹6,000
Direct Wages ₹5,000
Labour hours worked 4,000
Machine hours used 2,400
Calculate the cost of the job when the overheads are charged using
(i) Direct Material Cost Rate
(ii) Labour Hour Rate
(iii) Machine Hour Rate
{CMA inter J13, 5 marks}
Answer: Statement of the cost of the job
Base for OH recovery Direct Material Labour Hour Rate Machine Hour Rate
Particulars ₹ ₹ ₹
Material Cost 6,000 6,000 6,000
Labour 5,000 5,000 5,000

Job Costing 13
Overheads (𝑂𝑣𝑒𝑟ℎ𝑒𝑎𝑑
𝐵𝑎𝑠𝑒)
36,000
54,000× 6,000
4,000 36,000
36,000× 4,000
4,000 36,000
30,000× 2,400
2,880
Cost of Job 15,000 15,000 13,880
Job Costing
Question 2: During June 2001, a company was engaged on three jobs, all of which were started on 1st
June. The following details relating to the jobs are available:
Particulars Total Job 120 Job 121 Job 122
Purchase of Materials 5600 2000 2200 1400
Stores issued 940 240 - 700
Direct Wages 2200 900 700 600
Materials returned to Stores 40
Materials valued at ₹80 were transferred from job number 120 to Job No. 122. Overheads for the month
amounted to ₹2,800 and overheads are absorbed at 120% of direct wages. Job No. 121 was completed
during the month and invoiced to the customer at ₹4,200.
Prepare Job Cost A/c, Work-in-progress Control A/c, Overheads Control A/c and Costing P/L A/c for
June 2001.
Answer:
Job Cost A/c
J-120 J-121 J-122 J-120 J-121 J-122
To Direct Material 2,000 2,200 1,400 By Transfers 80
Stores 240 700 Costing PL 3,740
Direct Wages 900 700 600 Material Returned 40
Overheads 1,080 840 720
Transfer 80 Balance c/d 4,140 3,460
4220 3740 3,500 4,220 3,740 3,500
WIP Ledger Control A/c
To Direct Material 5,600 By Direct Material Returned 40
Stores 940 J-121 A/c 3,740
Direct Wages 2,200
Overheads 2,640 Balance c/d 7,600
11,380 11,380

Cost Accounting 14
Overheads Ledger Control A/c
To OH Incurred 2,800 By OH Absorbed 2,640
Under Absorption 160
2,800 2,800
Costing P/L A/c
To J-121 A/c 3,740 By Sales 4,200
Under absorption 160
Profit 460
4,200 4,200
Question 3: In a factory following the job costing Method, an abstract from the WIP as at 30th Sep was
prepared as under:
Job No. Material Director Labour Factory overheads Applied
115 1,325 400 hours 800 640
118 810 250 hours 500 400
120 765 300 hours 475 380
2,900 1,775 1,420
Materials used in October were as follows:
Material requisition Job Cost
No. No. ₹
54 118 300
55 118 425
56 118 515
57 120 665
58 121 910
59 124 720
3,535
Labour Hours during October
Job no Number of Hours
Shop A Shop B
115 25 25
118 90 30
120 75 10
Job Costing 15
121 65 —
124 20 10
275 75
Indirect Labour:
Waiting for material 20 10
Machine Breakdown 10 5
Idle time 5 6
Overtime Premium 6 5
316 101
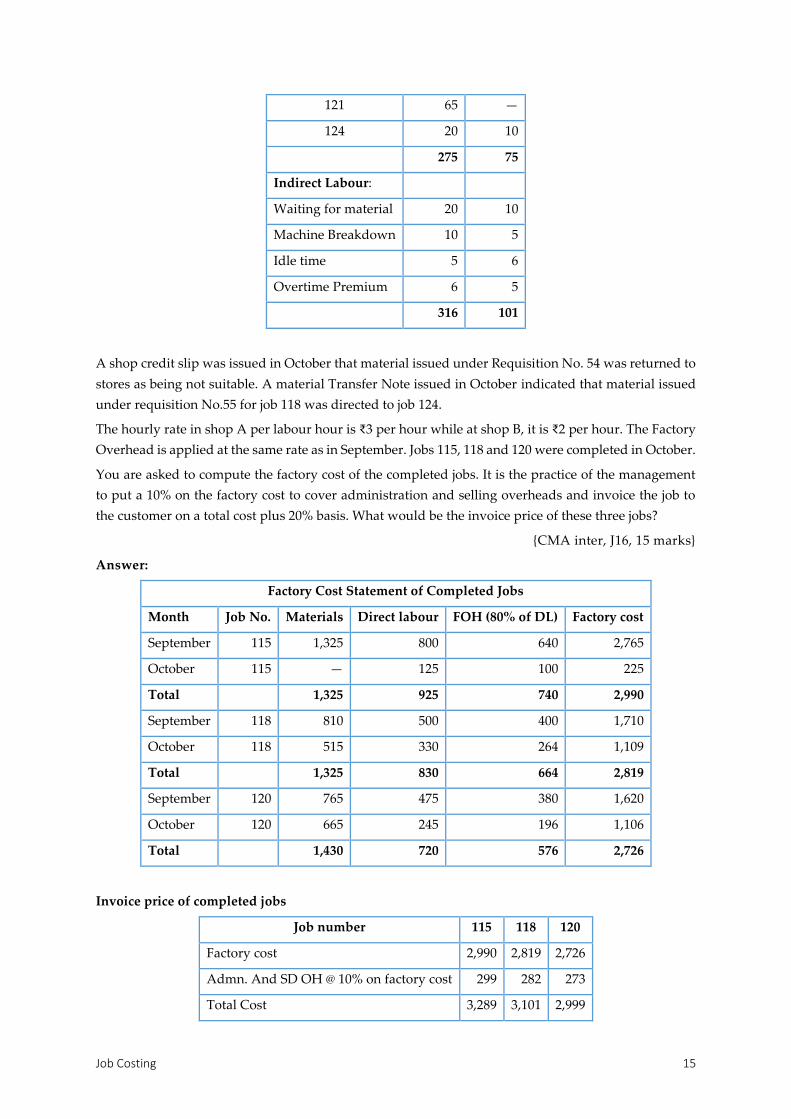
A shop credit slip was issued in October that material issued under Requisition No. 54 was returned to
stores as being not suitable. A material Transfer Note issued in October indicated that material issued
under requisition No.55 for job 118 was directed to job 124.
The hourly rate in shop A per labour hour is ₹3 per hour while at shop B, it is ₹2 per hour. The Factory
Overhead is applied at the same rate as in September. Jobs 115, 118 and 120 were completed in October.
You are asked to compute the factory cost of the completed jobs. It is the practice of the management
to put a 10% on the factory cost to cover administration and selling overheads and invoice the job to
the customer on a total cost plus 20% basis. What would be the invoice price of these three jobs?
{CMA inter, J16, 15 marks}
Answer:
Factory Cost Statement of Completed Jobs
Month Job No. Materials Direct labour FOH (80% of DL) Factory cost
September 115 1,325 800 640 2,765
October 115 — 125 100 225
Total 1,325 925 740 2,990
September 118 810 500 400 1,710
October 118 515 330 264 1,109
Total 1,325 830 664 2,819
September 120 765 475 380 1,620
October 120 665 245 196 1,106
Total 1,430 720 576 2,726
Invoice price of completed jobs
Job number 115 118 120
Factory cost 2,990 2,819 2,726
Admn. And SD OH @ 10% on factory cost 299 282 273
Total Cost 3,289 3,101 2,999
Cost Accounting 16
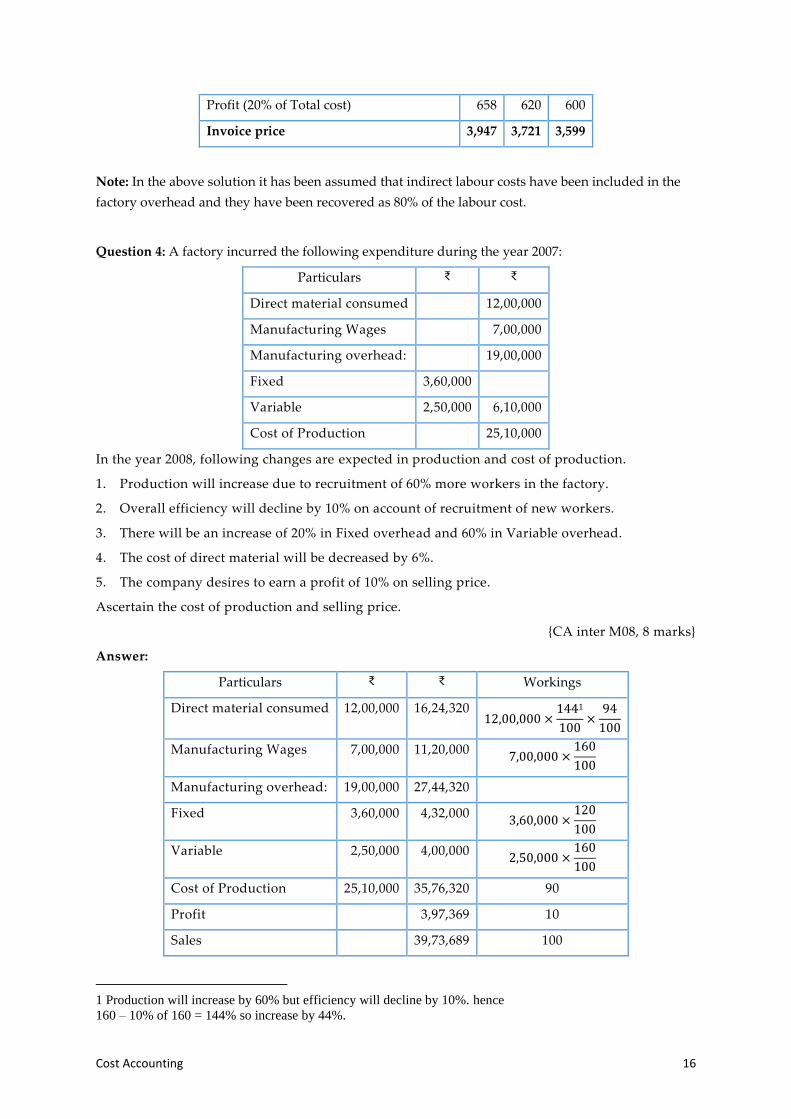
Profit (20% of Total cost) 658 620 600
Invoice price 3,947 3,721 3,599
Note: In the above solution it has been assumed that indirect labour costs have been included in the
factory overhead and they have been recovered as 80% of the labour cost.
Question 4: A factory incurred the following expenditure during the year 2007:
Particulars ₹ ₹
Direct material consumed 12,00,000
Manufacturing Wages 7,00,000
Manufacturing overhead: 19,00,000
Fixed 3,60,000
Variable 2,50,000 6,10,000
Cost of Production 25,10,000
In the year 2008, following changes are expected in production and cost of production.
1. Production will increase due to recruitment of 60% more workers in the factory.
2. Overall efficiency will decline by 10% on account of recruitment of new workers.
3. There will be an increase of 20% in Fixed overhead and 60% in Variable overhead.
4. The cost of direct material will be decreased by 6%.
5. The company desires to earn a profit of 10% on selling price.
Ascertain the cost of production and selling price.
{CA inter M08, 8 marks}
Answer:
Particulars ₹ ₹ Workings
Direct material consumed 12,00,000 16,24,320 12,00,000 ×
1441
100×
94
100
Manufacturing Wages 7,00,000 11,20,000 7,00,000 ×
160
100
Manufacturing overhead: 19,00,000 27,44,320
Fixed 3,60,000 4,32,000 3,60,000 ×
120
100
Variable 2,50,000 4,00,000 2,50,000 ×
160
100
Cost of Production 25,10,000 35,76,320 90
Profit 3,97,369 10
Sales 39,73,689 100
1 Production will increase by 60% but efficiency will decline by 10%. hence
160 – 10% of 160 = 144% so increase by 44%.
Job Costing 17
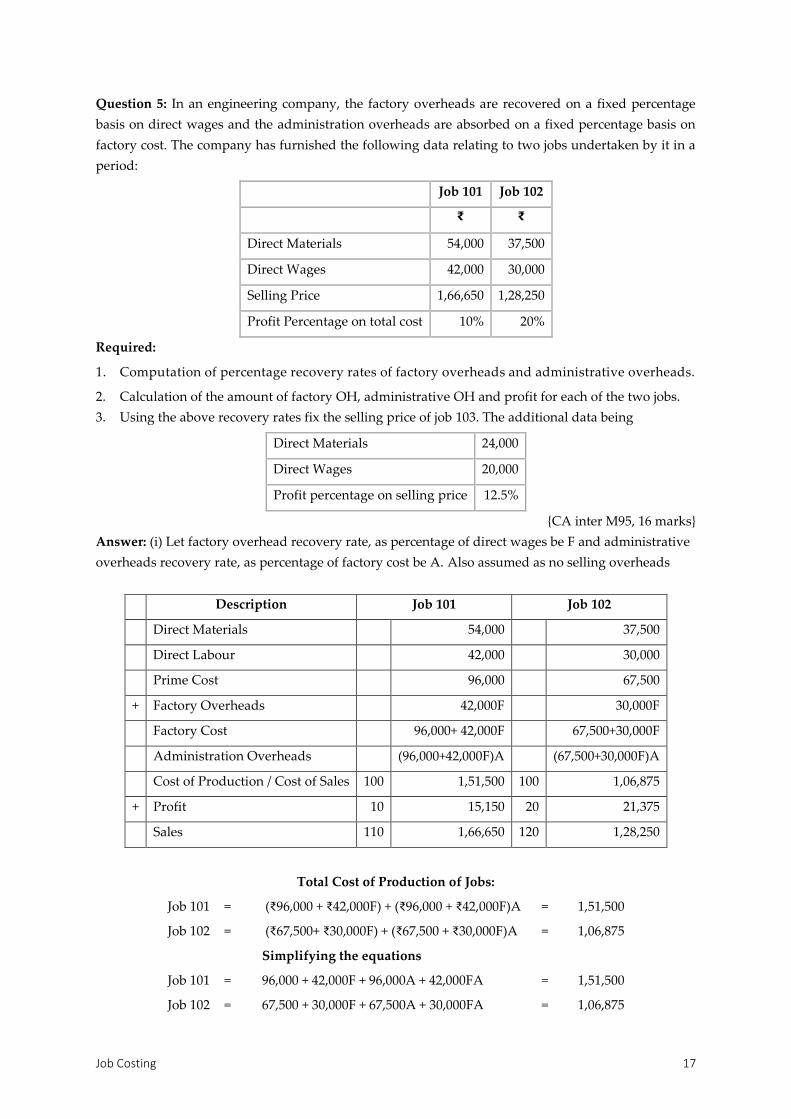
Question 5: In an engineering company, the factory overheads are recovered on a fixed percentage
basis on direct wages and the administration overheads are absorbed on a fixed percentage basis on
factory cost. The company has furnished the following data relating to two jobs undertaken by it in a
period:
Job 101 Job 102
₹ ₹
Direct Materials 54,000 37,500
Direct Wages 42,000 30,000
Selling Price 1,66,650 1,28,250
Profit Percentage on total cost 10% 20%
Required:
1. Computation of percentage recovery rates of factory overheads and administrative overheads.
2. Calculation of the amount of factory OH, administrative OH and profit for each of the two jobs.
3. Using the above recovery rates fix the selling price of job 103. The additional data being
Direct Materials 24,000
Direct Wages 20,000
Profit percentage on selling price 12.5%
{CA inter M95, 16 marks}
Answer: (i) Let factory overhead recovery rate, as percentage of direct wages be F and administrative
overheads recovery rate, as percentage of factory cost be A. Also assumed as no selling overheads
Description Job 101 Job 102
Direct Materials 54,000 37,500
Direct Labour 42,000 30,000
Prime Cost 96,000 67,500
+ Factory Overheads 42,000F 30,000F
Factory Cost 96,000+ 42,000F 67,500+30,000F
Administration Overheads (96,000+42,000F)A (67,500+30,000F)A
Cost of Production / Cost of Sales 100 1,51,500 100 1,06,875
+ Profit 10 15,150 20 21,375
Sales 110 1,66,650 120 1,28,250
Total Cost of Production of Jobs:
Job 101 = (₹96,000 + ₹42,000F) + (₹96,000 + ₹42,000F)A = 1,51,500
Job 102 = (₹67,500+ ₹30,000F) + (₹67,500 + ₹30,000F)A = 1,06,875
Simplifying the equations
Job 101 = 96,000 + 42,000F + 96,000A + 42,000FA = 1,51,500
Job 102 = 67,500 + 30,000F + 67,500A + 30,000FA = 1,06,875

Cost Accounting 18
Multiplying equation Job 102 with 1.4
Job 101 96,000 + 42,000F + 96,000A + 42,000FA = 1,51,500
Job 102 ×1.4 94,500 + 42,000F + 94,500A + 42,000FA = 1,49,625
[Job 101 – Job 102] & finding A
1,500 + 1,500A = 1,875
A [% of AOH on FC] 0.25 = 25%
Applying 0.25 in A and finding F
Job 101 96,000 + 42,000F + 96,000A + 42,000FA = 1,51,500
96,000 + 42,000F + 96,000(0.25) + 42,000F(0.25) = 1,51,500
96,000 + 42,000F + 24,000 + 10,500F = 1,51,500
1,20,000 + 52,500F = 1,51,500
F [% of FOH on DW] 0.6 = 60%
(i) Statement of jobs, showing amount of FOH, AOH & profit
Job 101
₹
Job 102
₹
Job 101
₹
Direct Materials 54,000 37,500 24,000
Direct Wage 42,000 30,000 20,000
Prime Cost 96,000 67,500 44,000
Factory Overheads (60% of Direct Wages) 25,200 18,000 12,000
Factory Cost 1,21,200 85,500 56,000
Administrative Overheads (25% of Factory Cost) 30,300 21,375 14,000
Total Cost 1,51,500 1,06,857 70,000
Profit (10% & 20% on cost and 12.5% on sales) 15,150 21,375 10,000
Selling Price 1,66,650 1,28,250 80,000
Batch Costing 19
2.2 BATCH COSTING
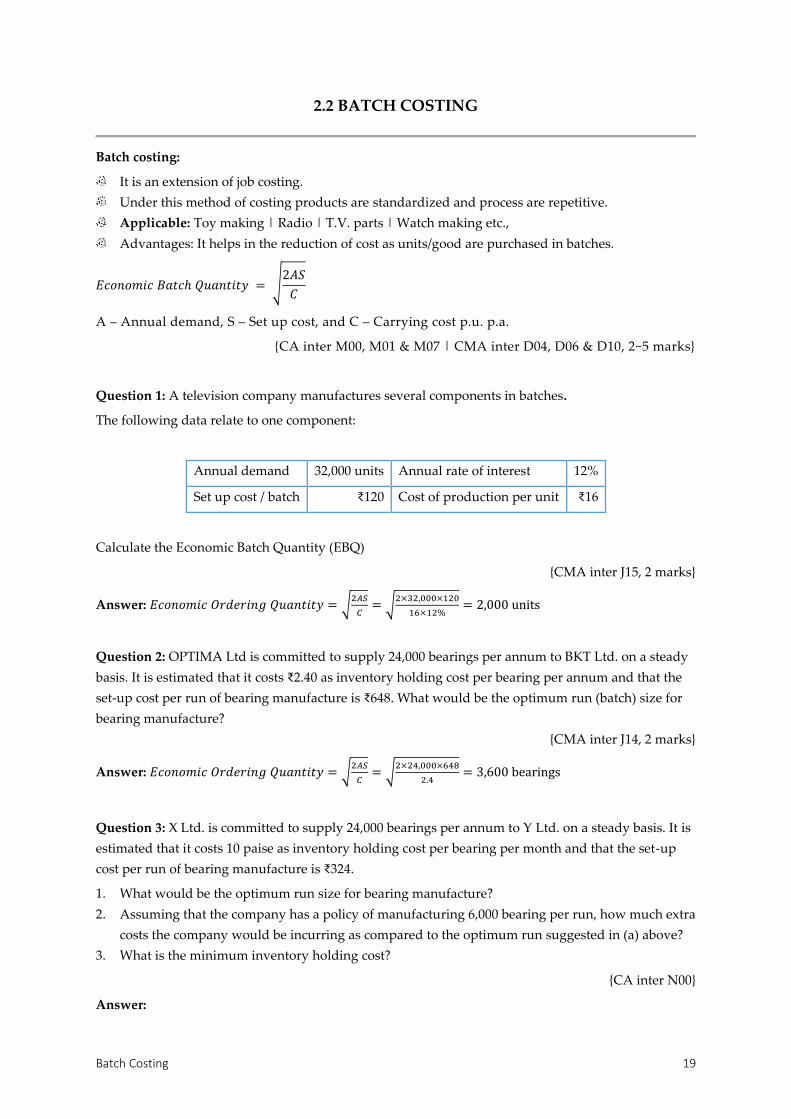
Batch costing:
It is an extension of job costing.
Under this method of costing products are standardized and process are repetitive.
Applicable: Toy making | Radio | T.V. parts | Watch making etc.,
Advantages: It helps in the reduction of cost as units/good are purchased in batches.
𝐸𝑐𝑜𝑛𝑜𝑚𝑖𝑐 𝐵𝑎𝑡𝑐ℎ 𝑄𝑢𝑎𝑛𝑡𝑖𝑡𝑦 = √2𝐴𝑆
𝐶
A – Annual demand, S – Set up cost, and C – Carrying cost p.u. p.a.
{CA inter M00, M01 & M07 | CMA inter D04, D06 & D10, 2~5 marks}
Question 1: A television company manufactures several components in batches.
The following data relate to one component:
Annual demand 32,000 units Annual rate of interest 12%
Set up cost / batch ₹120 Cost of production per unit ₹16
Calculate the Economic Batch Quantity (EBQ)
{CMA inter J15, 2 marks}
Answer: 𝐸𝑐𝑜𝑛𝑜𝑚𝑖𝑐 𝑂𝑟𝑑𝑒𝑟𝑖𝑛𝑔 𝑄𝑢𝑎𝑛𝑡𝑖𝑡𝑦 = √2𝐴𝑆
𝐶= √
2×32,000×120
16×12%= 2,000 units
Question 2: OPTIMA Ltd is committed to supply 24,000 bearings per annum to BKT Ltd. on a steady
basis. It is estimated that it costs ₹2.40 as inventory holding cost per bearing per annum and that the
set-up cost per run of bearing manufacture is ₹648. What would be the optimum run (batch) size for
bearing manufacture?
{CMA inter J14, 2 marks}
Answer: 𝐸𝑐𝑜𝑛𝑜𝑚𝑖𝑐 𝑂𝑟𝑑𝑒𝑟𝑖𝑛𝑔 𝑄𝑢𝑎𝑛𝑡𝑖𝑡𝑦 = √2𝐴𝑆
𝐶= √
2×24,000×648
2.4= 3,600 bearings
Question 3: X Ltd. is committed to supply 24,000 bearings per annum to Y Ltd. on a steady basis. It is
estimated that it costs 10 paise as inventory holding cost per bearing per month and that the set-up
cost per run of bearing manufacture is ₹324.
1. What would be the optimum run size for bearing manufacture?
2. Assuming that the company has a policy of manufacturing 6,000 bearing per run, how much extra
costs the company would be incurring as compared to the optimum run suggested in (a) above?
3. What is the minimum inventory holding cost?
{CA inter N00}
Answer:

Cost Accounting 20
(1) 𝐸𝑐𝑜𝑛𝑜𝑚𝑖𝑐 𝑂𝑟𝑑𝑒𝑟𝑖𝑛𝑔 𝑄𝑢𝑎𝑛𝑡𝑖𝑡𝑦 = √2𝐴𝑆
𝐶= √
2 × 24,000 × 324
1.2= 3,600 units
(2) Extra cost incurred by the company
Run size 3,600 u 6,000 u
Setup cost 24,000
3,600× 324
2,160 24,000
6,000× 324
1,296
Carrying cost 3,600
2× 1.2
2,160 6,000
2× 2
3,600
Total cost 4,320 4,896
Additional cost because of improper run size is [4,896 – 4,320] = ₹576
Batch Cost Sheet
Question 4: Batch number A-100 incurred the following cost:
Direct Material – ₹10,000;
Department A: 800 labour hours @ ₹5 per hour
Department B: 1,400 labour hours @ ₹6 per hour.
Factory overheads are absorbed on labour hours’ basis and the rates are
₹7 per hour for Department A
₹4 per hour for Department B
The firm uses a cost-plus system for selling prices, and expects a 25% gross profit (sales value minus
factory cost). Administrative O.H is absorbed at 10% of selling price. Assuming that 1,000 units were
produced in Batch A-100, calculate the selling price p.u.
Answer:
COST SHEET OF BATCH NO. A-100
Direct Material 10,000
Direct Labour: Dept. A: 800 × ₹5 4,000
Direct Labour: Dept. B: 1400 × ₹6 8,400 12,400
Factory OH: Dept. A: 800 × ₹7 5,600
Factory OH: Dept. B: 1400 × ₹4 5,600 11,200
Factory Cost 33,600
Administration OH (10% on Selling price) 4,480
Cost of Production 38,080
Profit (15% on Selling price) 6,720
Selling Price 44,800
Selling price per unit = 44,800/1000 44.8
Contract Costing 21
2.3 CONTRACT COSTING
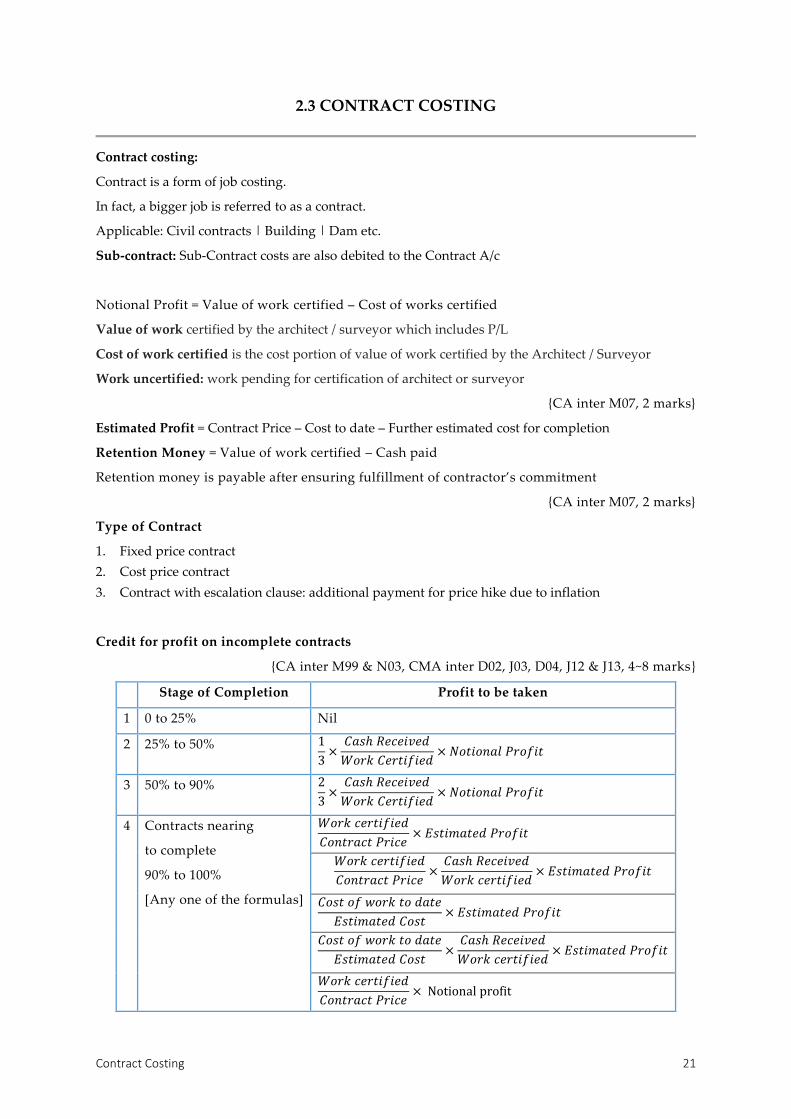
Contract costing:
Contract is a form of job costing.
In fact, a bigger job is referred to as a contract.
Applicable: Civil contracts | Building | Dam etc.
Sub-contract: Sub-Contract costs are also debited to the Contract A/c
Notional Profit = Value of work certified – Cost of works certified
Value of work certified by the architect / surveyor which includes P/L
Cost of work certified is the cost portion of value of work certified by the Architect / Surveyor
Work uncertified: work pending for certification of architect or surveyor
{CA inter M07, 2 marks}
Estimated Profit = Contract Price – Cost to date – Further estimated cost for completion
Retention Money = Value of work certified – Cash paid
Retention money is payable after ensuring fulfillment of contractor’s commitment
{CA inter M07, 2 marks}
Type of Contract
1. Fixed price contract
2. Cost price contract
3. Contract with escalation clause: additional payment for price hike due to inflation
Credit for profit on incomplete contracts
{CA inter M99 & N03, CMA inter D02, J03, D04, J12 & J13, 4~8 marks}
Stage of Completion Profit to be taken
1 0 to 25% Nil
2 25% to 50% 1
3×
𝐶𝑎𝑠ℎ 𝑅𝑒𝑐𝑒𝑖𝑣𝑒𝑑
𝑊𝑜𝑟𝑘 𝐶𝑒𝑟𝑡𝑖𝑓𝑖𝑒𝑑× 𝑁𝑜𝑡𝑖𝑜𝑛𝑎𝑙 𝑃𝑟𝑜𝑓𝑖𝑡
3 50% to 90% 2
3×
𝐶𝑎𝑠ℎ 𝑅𝑒𝑐𝑒𝑖𝑣𝑒𝑑
𝑊𝑜𝑟𝑘 𝐶𝑒𝑟𝑡𝑖𝑓𝑖𝑒𝑑× 𝑁𝑜𝑡𝑖𝑜𝑛𝑎𝑙 𝑃𝑟𝑜𝑓𝑖𝑡
4 Contracts nearing
to complete
90% to 100%
[Any one of the formulas]
𝑊𝑜𝑟𝑘 𝑐𝑒𝑟𝑡𝑖𝑓𝑖𝑒𝑑
𝐶𝑜𝑛𝑡𝑟𝑎𝑐𝑡 𝑃𝑟𝑖𝑐𝑒× 𝐸𝑠𝑡𝑖𝑚𝑎𝑡𝑒𝑑 𝑃𝑟𝑜𝑓𝑖𝑡
𝑊𝑜𝑟𝑘 𝑐𝑒𝑟𝑡𝑖𝑓𝑖𝑒𝑑
𝐶𝑜𝑛𝑡𝑟𝑎𝑐𝑡 𝑃𝑟𝑖𝑐𝑒×
𝐶𝑎𝑠ℎ 𝑅𝑒𝑐𝑒𝑖𝑣𝑒𝑑
𝑊𝑜𝑟𝑘 𝑐𝑒𝑟𝑡𝑖𝑓𝑖𝑒𝑑× 𝐸𝑠𝑡𝑖𝑚𝑎𝑡𝑒𝑑 𝑃𝑟𝑜𝑓𝑖𝑡
𝐶𝑜𝑠𝑡 𝑜𝑓 𝑤𝑜𝑟𝑘 𝑡𝑜 𝑑𝑎𝑡𝑒
𝐸𝑠𝑡𝑖𝑚𝑎𝑡𝑒𝑑 𝐶𝑜𝑠𝑡× 𝐸𝑠𝑡𝑖𝑚𝑎𝑡𝑒𝑑 𝑃𝑟𝑜𝑓𝑖𝑡
𝐶𝑜𝑠𝑡 𝑜𝑓 𝑤𝑜𝑟𝑘 𝑡𝑜 𝑑𝑎𝑡𝑒
𝐸𝑠𝑡𝑖𝑚𝑎𝑡𝑒𝑑 𝐶𝑜𝑠𝑡×
𝐶𝑎𝑠ℎ 𝑅𝑒𝑐𝑒𝑖𝑣𝑒𝑑
𝑊𝑜𝑟𝑘 𝑐𝑒𝑟𝑡𝑖𝑓𝑖𝑒𝑑× 𝐸𝑠𝑡𝑖𝑚𝑎𝑡𝑒𝑑 𝑃𝑟𝑜𝑓𝑖𝑡
𝑊𝑜𝑟𝑘 𝑐𝑒𝑟𝑡𝑖𝑓𝑖𝑒𝑑
𝐶𝑜𝑛𝑡𝑟𝑎𝑐𝑡 𝑃𝑟𝑖𝑐𝑒× Notional profit
Cost Accounting 22
PRACTICAL PROBLEMS
Concept Problem: Simple | Multiple Years | Multiple Contracts
Contract Nearing to Completion
Contract with Escalation Clause
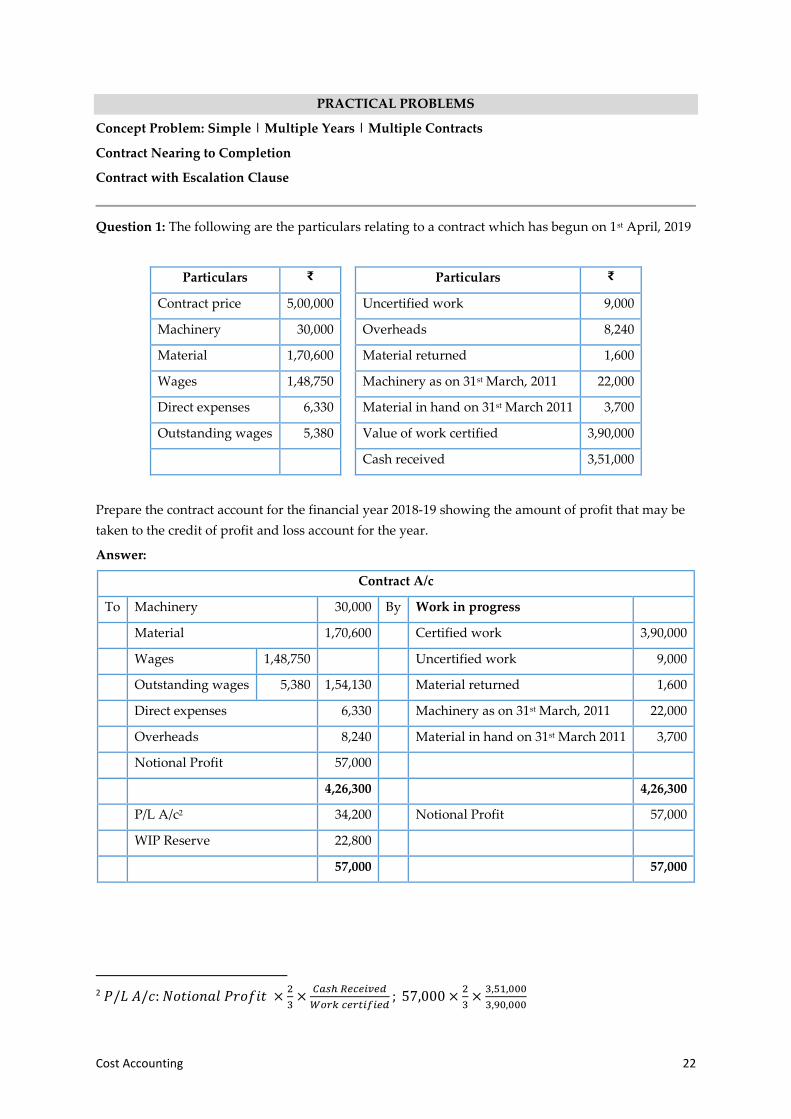
Question 1: The following are the particulars relating to a contract which has begun on 1st April, 2019
Particulars ₹ Particulars ₹
Contract price 5,00,000 Uncertified work 9,000
Machinery 30,000 Overheads 8,240
Material 1,70,600 Material returned 1,600
Wages 1,48,750 Machinery as on 31st March, 2011 22,000
Direct expenses 6,330 Material in hand on 31st March 2011 3,700
Outstanding wages 5,380 Value of work certified 3,90,000
Cash received 3,51,000
Prepare the contract account for the financial year 2018-19 showing the amount of profit that may be
taken to the credit of profit and loss account for the year.
Answer:
Contract A/c
To Machinery 30,000 By Work in progress
Material 1,70,600 Certified work 3,90,000
Wages 1,48,750 Uncertified work 9,000
Outstanding wages 5,380 1,54,130 Material returned 1,600
Direct expenses 6,330 Machinery as on 31st March, 2011 22,000
Overheads 8,240 Material in hand on 31st March 2011 3,700
Notional Profit 57,000
4,26,300 4,26,300
P/L A/c2 34,200 Notional Profit 57,000
WIP Reserve 22,800
57,000 57,000
2 𝑃/𝐿 𝐴/𝑐: 𝑁𝑜𝑡𝑖𝑜𝑛𝑎𝑙 𝑃𝑟𝑜𝑓𝑖𝑡 ×
2
3×
𝐶𝑎𝑠ℎ 𝑅𝑒𝑐𝑒𝑖𝑣𝑒𝑑
𝑊𝑜𝑟𝑘 𝑐𝑒𝑟𝑡𝑖𝑓𝑖𝑒𝑑; 57,000 ×
2
3×
3,51,000
3,90,000

Contract Costing 23
One contract for multiple years
Question 2: Mr. Bhagwandas undertook a Contract for ₹15,00,000 on an arrangement that 80% of the
value of the work done as certified by the architect of the contractee, should be paid immediately and
that the remaining 20% be retained until the contract was completed.
Particulars 2000 2001 2002
Direct Material 1,80,000 2,20,000 1,26,000
Direct Wages 1,70,000 2,30,000 1,70,000
Carriage 6,000 23,000 6,000
Cartage 1,000 2,000
Sundry Expenses 3,000 4,000 3,000
Work Certified 3,60,000 3/4th Certified Completed
Work Uncertified 20,000
Cash paid @ 80% of work certified. Prepare all the relevant accounts.
Answer:
Contract A/c [2017]
To Direct Material 1,80,000 By WIP c/d 3,60,000
Direct Wages 1,70,000
Carriage 6,000
Cartage 1,000
Sundry Expenses 3,000
3,60,000 3,60,000
Contract A/c [2018]
To Work in Progress b/d 3,60,000 By Work in Progress
Direct Material 2,20,000 Work Certified 11,25,000
Direct Wages 2,30,000 Work Uncertified 20,000
Carriage 23,000
Cartage 2,000
Sundry Expenses 4000
Notional Profit 306,000
11,45,000 11,45,000
Profit and Loss A/c3 1,63,200 Notional Profit 3,06,000
3 P/L A/c: Notional Profit ×
2
3×
𝐶𝑎𝑠ℎ 𝑅𝑒𝑐𝑒𝑖𝑣𝑒𝑑
𝑊𝑜𝑟𝑘 𝑐𝑒𝑟𝑡𝑖𝑓𝑖𝑒𝑑; 306,000×
2
3×
4
5
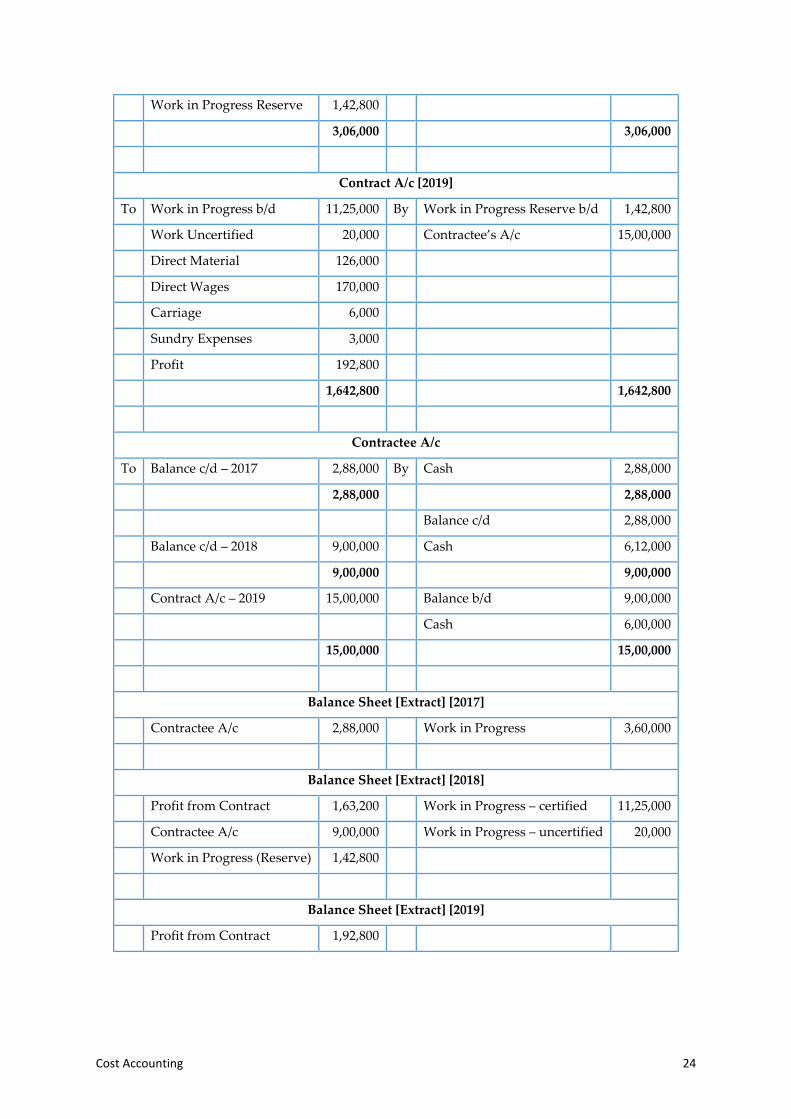
Cost Accounting 24
Work in Progress Reserve 1,42,800
3,06,000 3,06,000
Contract A/c [2019]
To Work in Progress b/d 11,25,000 By Work in Progress Reserve b/d 1,42,800
Work Uncertified 20,000 Contractee’s A/c 15,00,000
Direct Material 126,000
Direct Wages 170,000
Carriage 6,000
Sundry Expenses 3,000
Profit 192,800
1,642,800 1,642,800
Contractee A/c
To Balance c/d – 2017 2,88,000 By Cash 2,88,000
2,88,000 2,88,000
Balance c/d 2,88,000
Balance c/d – 2018 9,00,000 Cash 6,12,000
9,00,000 9,00,000
Contract A/c – 2019 15,00,000 Balance b/d 9,00,000
Cash 6,00,000
15,00,000 15,00,000
Balance Sheet [Extract] [2017]
Contractee A/c 2,88,000 Work in Progress 3,60,000
Balance Sheet [Extract] [2018]
Profit from Contract 1,63,200 Work in Progress – certified 11,25,000
Contractee A/c 9,00,000 Work in Progress – uncertified 20,000
Work in Progress (Reserve) 1,42,800
Balance Sheet [Extract] [2019]
Profit from Contract 1,92,800
Contract Costing 25
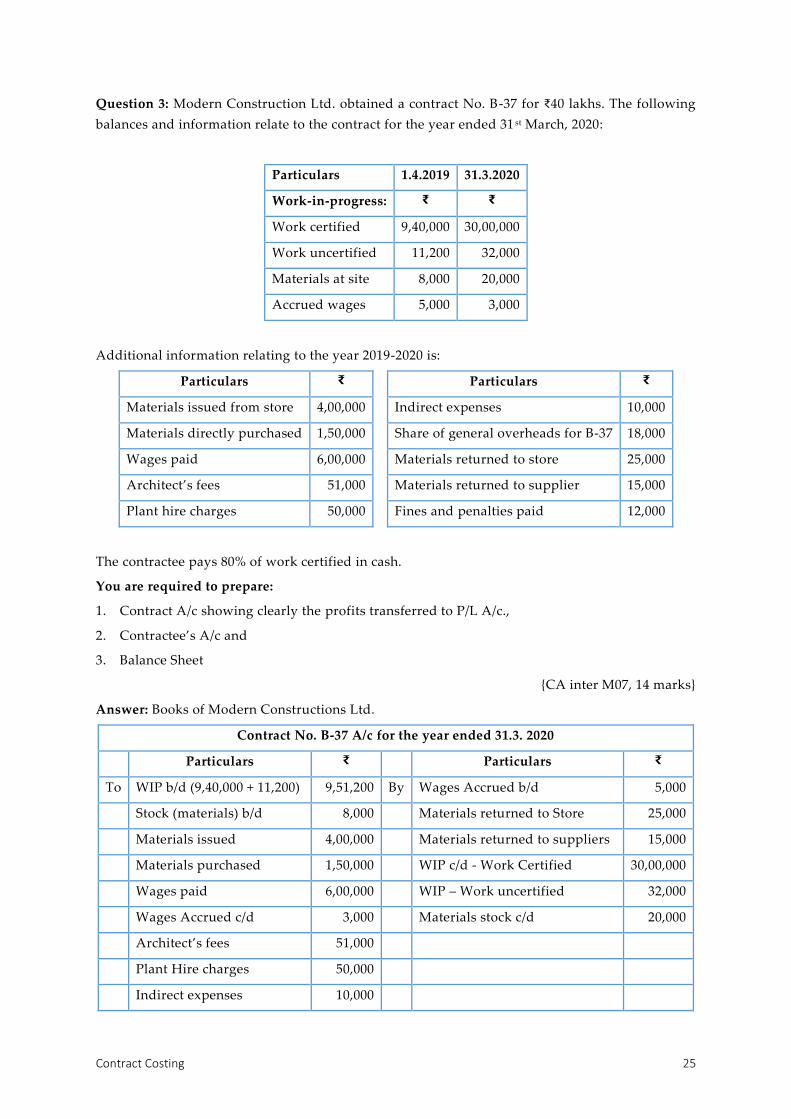
Question 3: Modern Construction Ltd. obtained a contract No. B-37 for ₹40 lakhs. The following
balances and information relate to the contract for the year ended 31 st March, 2020:
Particulars 1.4.2019 31.3.2020
Work-in-progress: ₹ ₹
Work certified 9,40,000 30,00,000
Work uncertified 11,200 32,000
Materials at site 8,000 20,000
Accrued wages 5,000 3,000
Additional information relating to the year 2019-2020 is:
Particulars ₹ Particulars ₹
Materials issued from store 4,00,000 Indirect expenses 10,000
Materials directly purchased 1,50,000 Share of general overheads for B-37 18,000
Wages paid 6,00,000 Materials returned to store 25,000
Architect’s fees 51,000 Materials returned to supplier 15,000
Plant hire charges 50,000 Fines and penalties paid 12,000
The contractee pays 80% of work certified in cash.
You are required to prepare:
1. Contract A/c showing clearly the profits transferred to P/L A/c.,
2. Contractee’s A/c and
3. Balance Sheet
{CA inter M07, 14 marks}
Answer: Books of Modern Constructions Ltd.
Contract No. B-37 A/c for the year ended 31.3. 2020
Particulars ₹ Particulars ₹
To WIP b/d (9,40,000 + 11,200) 9,51,200 By Wages Accrued b/d 5,000
Stock (materials) b/d 8,000 Materials returned to Store 25,000
Materials issued 4,00,000 Materials returned to suppliers 15,000
Materials purchased 1,50,000 WIP c/d - Work Certified 30,00,000
Wages paid 6,00,000 WIP – Work uncertified 32,000
Wages Accrued c/d 3,000 Materials stock c/d 20,000
Architect’s fees 51,000
Plant Hire charges 50,000
Indirect expenses 10,000

Cost Accounting 26
General overheads 18,000
Notional profit c/d 8,55,800
30,97,000 30,97,000
P/L A/c4 4,56,427 8,55,800
WIP Reserve c/d 3,99,373 Notional Profit b/f
8,55,800 8,55,800
Note: Fines and penalties are not shown in Contract A/c
Contractee’s A/c
To Balance c/d 24,00,000 By Balance b/d (80% of 9,40,000) 7,52,000
Bank 16,48,000
24,00,000 24,00,000
Balance Sheet (Extract) as on 31.3.2020
Profit & Loss A/c 4,56,427 Materials at site 20,000
(-) Fines 12,000 4,44,427 Materials in store 25,000
O/s wages 3,000 Work in Progress
Work Certified 30,00,000
(+) Work Uncertified 32,000
(+) Advance 24,00,000
(+) WIP Reserve 3,99,373 2,32,627
Contract Nearing to Complete
Question 4: Compute a conservative estimate of profit on a contract (which has been 80%
complete) from the following particulars. Illustrate four methods of computing the profit:
₹
Total expenditure to date 1,70,000
Estimated further expenditure to complete the contract 34,000
(including contingencies)
Contract Price 3,06,000
Work Certified 2,00,000
Work not certified 17,000
Cash Received 1,63,200
4 𝑃&𝐿 𝐴/𝑐 = 𝑁𝑜𝑡𝑖𝑜𝑛𝑎𝑙 𝑃𝑟𝑜𝑓𝑖𝑡 ×
2
3×
𝐶𝑎𝑠ℎ 𝑅𝑒𝑐𝑒𝑖𝑣𝑒𝑑
𝑊𝑜𝑟𝑘 𝑐𝑒𝑟𝑡𝑖𝑓𝑖𝑒𝑑= 8,55,800 ×
2
3×
80
100

Contract Costing 27
{CA inter M98, 8 marks}
Answer: Working Notes
1. Computation of estimated profit ₹
Contract price 3,06,000
− Total expenditure to date 1,70,000
− Estimated further expenditure to complete the contract 34,000
Estimated profit 1,02,000
2. Computation of Notional Profit
Value of work certified 2,00,000
− Cost of work certified:
(Expenditure-to-date less work not certified) (₹1,70,000–₹17,000)
1,53,000
Notional Profit 47,000
Computation of a conservative estimate of the profit to be taken to P/L A/c (Deferent Methods)
1 Estimated profit ×
work certified
cotract price×
cash rec eived
work certified 1,02,000 ×
2,00,000
3,06,000×
1,63,200
2,00,000
₹54,400
2 Estimated profit ×
work certified
cotract price 1,02,000 ×
2,00,000
3,06,000
₹66,667
3 𝐶𝑜𝑠𝑡 𝑜𝑓 𝑤𝑜𝑟𝑘 𝑡𝑜 𝑑𝑎𝑡𝑒
𝐸𝑠𝑡𝑖𝑚𝑎𝑡𝑒𝑑 𝐶𝑜𝑠𝑡×
𝐶𝑎𝑠ℎ 𝑅𝑒𝑐𝑒𝑖𝑣𝑒𝑑
𝑊𝑜𝑟𝑘 𝑐𝑒𝑟𝑡𝑖𝑓𝑖𝑒𝑑× 𝐸𝑠𝑡𝑖𝑚𝑎𝑡𝑒𝑑 𝑃𝑟𝑜𝑓𝑖𝑡 1,02,000 ×
1,70,000
2,04,000×
1,63,200
2,00,000
₹69,360
4 𝐶𝑜𝑠𝑡 𝑜𝑓 𝑤𝑜𝑟𝑘 𝑡𝑜 𝑑𝑎𝑡𝑒
𝐸𝑠𝑡𝑖𝑚𝑎𝑡𝑒𝑑 𝐶𝑜𝑠𝑡× 𝐸𝑠𝑡𝑖𝑚𝑎𝑡𝑒𝑑 𝑃𝑟𝑜𝑓𝑖𝑡 1,02,000 ×
1,70,000
2,04,000
85,000
5 Notional profit ×
work certified
contract price 47,000 ×
2,00,000
3,06,000
₹30,719
6 2
3× Notional profit ×
cash received
work certified
2
3× 47,000 ×
1,63,200
2,00,000
₹25,568
Escalation Clause
Question 5: Deluxe Limited undertook a contract for ₹5,00,000 on 1st July, 2000. On 30th June, 2001
when the accounts were closed, the following details about the contract were gathered:
Particulars ₹ Particulars ₹
Materials Purchased 1,00,000 Wages Accrued 30-6-2001 5,000
Wages Paid 45,000 Work Certified 2,00,000
General Expenses 10,000 Cash Received 1,50,000
Plant Purchased 50,000 Work Uncertified 15,000
Materials on Hand 30-6-2001 25,000 Depreciation of Plant 5,000
The above contract contained an escalation clause which read as follows:
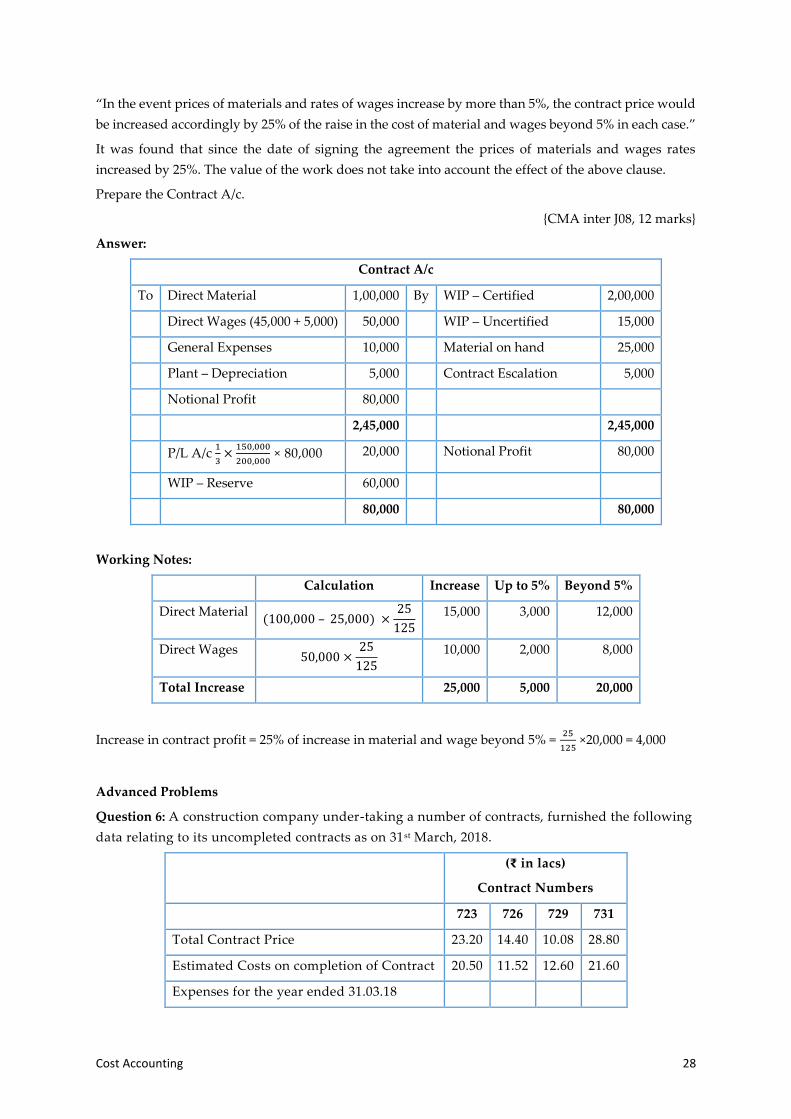
Cost Accounting 28
“In the event prices of materials and rates of wages increase by more than 5%, the contract price would
be increased accordingly by 25% of the raise in the cost of material and wages beyond 5% in each case.”
It was found that since the date of signing the agreement the prices of materials and wages rates
increased by 25%. The value of the work does not take into account the effect of the above clause.
Prepare the Contract A/c.
{CMA inter J08, 12 marks}
Answer:
Contract A/c
To Direct Material 1,00,000 By WIP – Certified 2,00,000
Direct Wages (45,000 + 5,000) 50,000 WIP – Uncertified 15,000
General Expenses 10,000 Material on hand 25,000
Plant – Depreciation 5,000 Contract Escalation 5,000
Notional Profit 80,000
2,45,000 2,45,000
P/L A/c 1
3×
150,000
200,000 × 80,000 20,000 Notional Profit 80,000
WIP – Reserve 60,000
80,000 80,000
Working Notes:
Calculation Increase Up to 5% Beyond 5%
Direct Material (100,000 – 25,000) ×
25
125
15,000 3,000 12,000
Direct Wages 50,000 ×
25
125
10,000 2,000 8,000
Total Increase 25,000 5,000 20,000
Increase in contract profit = 25% of increase in material and wage beyond 5% = 25
125 ×20,000 = 4,000
Advanced Problems
Question 6: A construction company under-taking a number of contracts, furnished the following
data relating to its uncompleted contracts as on 31st March, 2018.
(₹ in lacs)
Contract Numbers
723 726 729 731
Total Contract Price 23.20 14.40 10.08 28.80
Estimated Costs on completion of Contract 20.50 11.52 12.60 21.60
Expenses for the year ended 31.03.18

Contract Costing 29
Direct Materials 5.22 1.80 1.98 0.80
Direct Wages 2.32 4.32 3.90 2.16
O.H (excluding depreciation) 1.06 2.60 2.62 1.05
Profit Reserve as on 1.4.17 1.50 - - -
Plant issued at Cost 5.00 3.50 2.75 3.00
Material at Site on 1.4.17 0.75 - - -
Material at Site on 31.3.18 0.45 0.20 0.08 0.05
Work Certified till 31.3.17 4.65 - - -
Work Certified during the year 2017-2018 12.76 13.26 7.56 4.32
Work Uncertified a on 31.3.18 0.84 0.24 0.14 0.18
Progress payment received during the year 9.57 9.00 5.75 3.60
Depreciation @ 20% p.a. is to be charged on plant issued. While the Contract No. 723 was carried
over from last year, the remaining contracts were started in the 1 st week of April, 2017, required.
1. Determine the P/L in respect of each contract for the year ended 31st March, 2018.
2. State the P/L to be carried to Profit & Loss A/c for the year ended 31 st March, 2018
{CA inter N96}
Answer: Statement of P/L in respect of following contract numbers for the year ended 31.03.18
(₹ in lakhs) Contract Numbers
723 726 729 731
A Contract completion percentage:
(a) Work Certified 17.41 13.26 7.56 4.32
(b) Contract price 23.20 14.40 10.08 28.80
Percentage of completion [(a)/(b)%] 75.04 92.08 75.00 15.00
B Estimated profit on completion:
(c) Contract Price 23.20 14.40 10.08 28.80
(d) Estimated costs on completion 20.50 11.52 12.60 21.60
Profit / (Loss) [(c) – (d)] 2.70 2.88 (2.52) 7.20
C Profit of the year
Opening stock of materials 0.75 - - -
Materials issued 5.22 1.80 1.98 0.80
Direct wages 2.32 4.32 3.90 2.16
Overheads 1.06 2.60 2.62 1.05
Depreciation 1.00 0.70 0.55 0.60
P Total 10.35 9.42 9.05 4.61
Profit in reserve 1.50 - - -

Cost Accounting 30
Material at site on 31.03.18 0.45 0.20 0.08 0.05
Q Total 1.95 0.20 0.08 0.05
R Cost of contract [(P) – (Q)] 8.40 9.22 8.97 4.56
Work certified 12.76 13.26 7.56 4.32
Work not certified 0.84 0.24 0.14 0.18
S Total (S) 13.60 13.50 7.70 4.50
Profit / (Loss) for the year [(R) – (S)] 5.20 4.28 (1.27) (0.06)
Profit to be taken to Profit & Loss A/c of the year in respect of respective contract
(ii) Contract Formula Calculation P/(L)
1 723 𝑁𝑃 ×
2
3×
𝐶𝑅
𝑊𝐶
2
3× 5.20 ×
9.57
12.76
₹2.60
2 726 𝐸𝑃 ×
𝑊𝐶
𝐶𝑃×
𝐶𝑅
𝑊𝐶 2.88 ×
13.26
14.40×
9.00
13.26
₹1.80
3 729 (₹1.27)
4 731 (₹0.06)
Question 7: Batrom Ltd., a contractor commences the contract No. HB-108 on 1st July, 2017. The
details about the contract for the year ending 31st March, 2018 were following;
Particulars ₹
Contract price 30,00,000
Materials issued 8,00,000
Material transferred from contract n. 101 50,000
Wages paid 6,31,000
Wages outstanding 35,000
Supervisor’s Salary 1,80,000
Establishment Exp. 41,000
Plant Issued 10,00,000
Material costing ₹15,000 was sold for ₹11,000 and plant costing ₹80,000 returned to stores on 31st
December, 2017.
A crane costing ₹20,00,000 has been on the contract site for 73 days. Its working life is estimated at
6years and its scrap value at ₹1,10,000. Depreciation on plant is to be charge @ 15% per annum. Up to
31st March, 2018, ¾ (Three-fourth) of the contract was completed but architect’s certificate has been
issued covering 2/3rd of the contract price and 15,00,000 had been received in cash on account.
Required:
(a) Prepare the Contract No. HB-108 Account for the year ended March 31, 2018.
(b) State as how much Profit should be credited to P/L A/c for the year ended March 31, 2018.
{CMA inter D14, 10 marks}

Contract Costing 31
Answer:
(a) Contract Account of Contract No. HB-108 for the period 01.07.17 to 31.03.18
Dr Particulars ₹ Cr Particulars ₹
To Material issued 8,00,000 By Work certified 20,00,000
Material from contract 101 50,000 Work uncertified 2,10,500
Wages paid 6,31,000 Cash (Sale of material) 11,000
Wages outstanding 35,000 P&L Account 4,000
Supervisor’s salary 1,80,000
Establishment expenses 41,000
Depreciation on crane5 63,000
Depreciation on plant6 1,09,500
Notional Profit 3,16,000
21,72,875 21,72,875
Profit and Loss A/c 1,58,000 Notional Profit 3,16,000
WIP Reserve 1,58,000
3,16,000 3,16,000
(b) Profit
to be recognized
2
3× 𝑁𝑜𝑡𝑖𝑜𝑛𝑎𝑙 𝑃𝑟𝑜𝑓𝑖𝑡 ×
𝐶𝑎𝑠ℎ 𝑟𝑒𝑐𝑒𝑖𝑣𝑒𝑑
𝑊𝑜𝑟𝑘 𝐶𝑒𝑟𝑡𝑖𝑓𝑖𝑒𝑑
2
3× ₹3,16,000 ×
15𝑙
20𝑙 ₹1,58,000
Working Note:
(1) Calculation of Notional Profit
Value of Work Completed 𝐶𝑜𝑛𝑡𝑟𝑎𝑐𝑡 𝑃𝑟𝑖𝑐𝑒 ×
𝐿𝑒𝑣𝑒𝑙 𝑜𝑓 𝐶𝑜𝑚𝑝𝑙𝑒𝑡𝑖𝑜𝑛 30,00,000 ×
2
3
20,00,000
− Cost of Work Completed 𝐶𝑜𝑠𝑡 𝑡𝑜 𝑑𝑎𝑡𝑒 ×
𝐿𝑒𝑣𝑒𝑙 𝑜𝑓 𝐶𝑜𝑚𝑝𝑙𝑒𝑡𝑖𝑜𝑛 18,94,500 ×
4
3×
2
3
16,84,000
3,16,000
(2) Cost of Work Completed 18,94,500
Cost of Work Certified 16,84,000
Cost of Work Uncertified 2,10,500
5 [
(20,00,000×1,10,000)
6×
73
365]
6 [10,00,000 ×6
12×
15
100] + [9,20,000 ×
3
12×
15
100]

Cost Accounting 32
Question 8: RST Construction Limited commenced a contract on 1.4.2017. The total contract was for
₹4,921,875. It was decided to estimate the total Profit on the contract and to take to the Credit of Profit
and Loss A/c that proportion of estimated profit on cash basis, which work completed bore to total
Contract. Actual expenditure for the period 1.4.2017 to 31.3.2018 & estimated expenditure for April 1,
2018 to September 30, 2018 are given below:
1.4.17 to 31.3.18
(Actuals)
1.4.17 to 30.9.18
(Estimated)
Particulars ₹ ₹
Materials Issued 7,76,250 12,99,375
Labour: Paid 5,17,500 6,18,750
: Prepaid 37,500 ―
: Outstanding 12,500 5,750
Plant Purchased 4,00,000 ―
Expenses: Paid 2,25,000 3,75,000
: Outstanding 25,000 10,000
: Prepaid 15,000 ―
Plant returns to Store (historical cost) 1,00,000
(On 30.9.2017)
3,00,000
(On 30.9.2018)
Work certified 22,50,000 Full
Work uncertified 25,000 ―
Cash received 18,75,000 ―
Materials at site 82,500 42,500
The plant is subject to annual depreciation @ 25% on written down value method. The contract is
likely to be completed on September 30, 2018.
Required: Prepare the contract A/c. Determine the profit on the contract for the year 2017 -18 on
prudent basis, which has to be credited to Profit and Loss Account.
{CA inter}
Answer:
Contract A/c for the year ending March 31, 2018
Particulars ₹ Particulars ₹
To Materials issued 7,76,250 By Work-in-progress
Labour 5,17,500 Certified 22,50,000
Add: Outstanding 12,500 Uncertified 25,000 22,75,000
Less: Prepaid 37,500 4,92,500 Plant returned 30.09.05 87,500
Plant 4,00,000 (1,00,000 – 25% × ½)
Expenses 2,25,000 Materials at site 82,500

Contract Costing 33
Add: Outstanding
Less: Prepaid
25,000
15,000
2,35,000
Plant at site
(3,00,000 – 25%)
2,25,000
Notional Profit c/d 7,66,250
26,70,000 26,70,000
Profit and Loss A/ca 3,89,000 Notional Profit b/d 7,66,250
WIP (Reserve) 3,77,250
7,66,250 7,66,250
𝑃𝑟𝑜𝑓𝑖𝑡 = 𝐸𝑠𝑡𝑖𝑚𝑎𝑡𝑒𝑑 𝑝𝑟𝑜𝑓𝑖𝑡 × 𝑊𝑜𝑟𝑘 𝑐𝑒𝑟𝑡𝑖𝑓𝑖𝑒𝑑
𝐶𝑜𝑛𝑡𝑟𝑎𝑐𝑡 𝑝𝑟𝑖𝑐𝑒 ×
𝐶𝑎𝑠ℎ 𝑟𝑒𝑐𝑒𝑖𝑣𝑒𝑑
𝑊𝑜𝑟𝑘 𝑐𝑒𝑟𝑡𝑖𝑓𝑖𝑒𝑑
𝑃𝑟𝑜𝑓𝑖𝑡 = 10,21,125 × 22,50,000
49,21,875 ×
18,75,000
22,50,000 = 3,89,000
Statement for calculating estimated profit ₹ ₹
Contract Price 4,92,1875
(-) Cost to date [WIP – notional Profit] [22,75,000 – 7,66,250] 15,08,750
Further Cost to Complete
Material1 13,39,375
Labour2 6,49,500
Expenses2 3,75,000
Plant Depreciation3 28,125
23,92,000 39,00,750
Estimated Profit 10,21,125
Material1 Labour2 Expenses2
Opening Stock 82,500 Paid 6,18,750 3,75,000
+ Issues 12,99,375 + Outstanding CY 5,750 10,000
13,81,875 6,24,500 3,85,000
- Closing Stock 42,500 - Advance CY - -
13,39,375 6,24,500 3,85,000
- Outstanding PY 12,500 25,000
6,12,000 3,60,000
+ Advance PY 37,500 15,000
Actual expenses 6,49,500 3,75,000
Cost Accounting 34
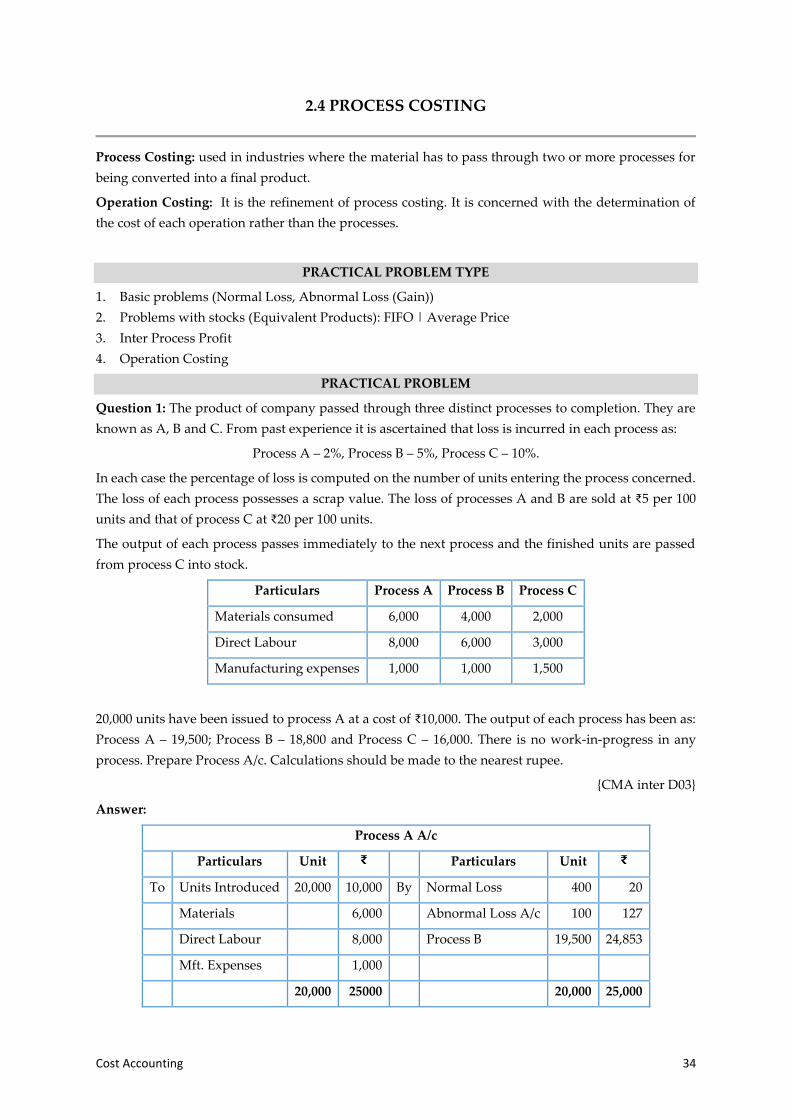
2.4 PROCESS COSTING
Process Costing: used in industries where the material has to pass through two or more processes for
being converted into a final product.
Operation Costing: It is the refinement of process costing. It is concerned with the determination of
the cost of each operation rather than the processes.
PRACTICAL PROBLEM TYPE
1. Basic problems (Normal Loss, Abnormal Loss (Gain))
2. Problems with stocks (Equivalent Products): FIFO | Average Price
3. Inter Process Profit
4. Operation Costing
PRACTICAL PROBLEM
Question 1: The product of company passed through three distinct processes to completion. They are
known as A, B and C. From past experience it is ascertained that loss is incurred in each process as:
Process A – 2%, Process B – 5%, Process C – 10%.
In each case the percentage of loss is computed on the number of units entering the process concerned.
The loss of each process possesses a scrap value. The loss of processes A and B are sold at ₹5 per 100
units and that of process C at ₹20 per 100 units.
The output of each process passes immediately to the next process and the finished units are passed
from process C into stock.
Particulars Process A Process B Process C
Materials consumed 6,000 4,000 2,000
Direct Labour 8,000 6,000 3,000
Manufacturing expenses 1,000 1,000 1,500
20,000 units have been issued to process A at a cost of ₹10,000. The output of each process has been as:
Process A – 19,500; Process B – 18,800 and Process C – 16,000. There is no work-in-progress in any
process. Prepare Process A/c. Calculations should be made to the nearest rupee.
{CMA inter D03}
Answer:
Process A A/c
Particulars Unit ₹ Particulars Unit ₹
To Units Introduced 20,000 10,000 By Normal Loss 400 20
Materials 6,000 Abnormal Loss A/c 100 127
Direct Labour 8,000 Process B 19,500 24,853
Mft. Expenses 1,000
20,000 25000 20,000 25,000

Process Costing 35
Process B A/c
To Process A 19,500 24,853 By Normal Loss 975 49
Materials 4,000
Direct Labour 6,000 Process C 18,800 36,336
Mft. Expenses 1,000
Abnormal Gain 275 532
19,775 36,385 19,775 36,385
Process C A/c
To Process C 18,800 36,336 By Normal Loss 1,880 376
Materials 2,000 Abnormal Loss 920 2,309
Direct Labour 3,000 Finished Goods 16,000 40,151
Mft. Expenses 1,500
18,800 42,836 18,800 42,836
Abnormal Loss A/c
To Process A 100 127 By Cash 1,020 189
Process C 920 2,309 Costing P/L 2,247
1,020 2,436 1,020 2,436
Normal Loss A/c
To Process A 400 20 By Abnormal Gain 275 14
Process B 975 49 Cash 2,980 431
Process C 1,880 376
3,255 445 3,255 445
Abnormal Gain A/c
To Normal Loss 275 14 By Process B 275 532
Costing P/L 518
275 532 275 532

Cost Accounting 36
Question 2: A product passes through three distinct processes I, II and III. The output of each process
is transferred to the next process and the output of process III is transferred to finished goods stock.
The normal wastage in each process and the realizable value of the same are given below:
Process Percentage of normal value
waste related to input
Realizable
per unit
I 5 ₹0.70
II 7 ₹0.80
III 10 ₹1.00
The details of cost data and output for a month are as follows:
Process
I II III
Material Consumed (₹) 1,20,000 40,000 40,000
Direct Labour Cost (₹) 80,000 60,000 60,000
Production expenses (₹) 40,000 40,000 28,000
Output (Units) 38,000 34,600 32,000
Process I was fed with 40,000 units of input costing ₹3,20,000. There were no opening and closing work-
in-progress. Prepare the process accounts for the month.
Answer:
Process I A/c
Particulars Units ₹ Particular Units ₹
To Raw material 40,000 3,20,000 By Normal loss 2,000 1,400
Direct Material 1,20,000 Process II a/c 38,000 5,58,600
Direct Labour 80,000
Production Exp. 40,000
40,000 5,60,000 40,000 5,60,000
Process II A/c
To Process I a/c 38,000 5,58,600 By Normal loss 2,660 2,128
Direct Material 40,000 Abnormal loss (WN1) 740 14,585
Direct Labour 60,000 Process III a/c 34,600 6,81,887
Production Exp. 40,000
38,000 6,98,600 38,000 6,98,600

Process Costing 37
Process III A/c
To Process II a/c 34,600 6,81,887 By Normal loss 3,460 3,460
Direct Material 40,000 Finished Goods Stock a/c 32,000 8,28,700
Direct Labour 60,000
Production Exp. 28,000
Abnormal Gain 860 22,273
35,460 8,32,160 35,460 8,32,160
Abnormal Loss A/c
To Process B 740 14,585 By Cash 740 592
Costing P/L 13,993
14,585 14,585
Abnormal Gain A/c
To Normal Loss 860 860 By Process C 860 22,273
Costing P/L 21,413
860 22,273 860 22,273
Normal Loss A/c
To Process A 2,000 1,400 By Abnormal Gain (C) 860 860
Process B 2,660 2,128 Cash 6,128
Process C 3,460 3,460
6,988 6,988
Working Note
WN Cost per unit of normal output Abnormal
Gain / (Loss)
FG
Transferred Total Cost − Scrap Value
Input − Normal Lossor
Normal Cost
Normal Output
Process Calculation Cost per unit Units Amount Units Amount
1 II ₹6,98,600 − ₹2,218
38,000 − 2,660 units
₹19.71 per unit (740) (₹14,585) 34,600 6,81,887
2 III ₹8,09,887 − ₹3,460
34,600 − 3,460
₹25.89 per units 860 (₹22,273) 32,000 8,28,700
Question 3: A product passes through three processes – A, B and C. The details of expenses incurred
on the three processes during the year 1992 were as under:

Cost Accounting 38
Process A B C
Units issued / introduced cost per unit ₹100 10,000
₹ ₹ ₹
Sundry Materials 10,000 15,000 5,000
Labour 30,000 80,000 65,000
Direct Expenses 6,000 18,150 27,200
Selling price / per unit of output 120 165 250
Management expenses during the year were ₹80,000 and selling expenses were ₹50,000. These are not
allocable to the processes. Actual output of the three processes was: A – 9,300 units, B – 5,400 units and
C – 2,100 units. 2/3rd of the output of Process A and ½ of the output of Process B was passed on to the
next process & the balance was sold. The entire output of process C was sold.
The normal loss of the three processes, calculated on the input of every process was:
Process A – 5%; B – 15% and C – 20%
The Loss of Process A was sold at ₹2 p.u. that of B at ₹5 p.u. and of Process C at ₹10 p.u.
Prepare the Three Processes Accounts and the Profit and Loss A/c.
Answer:
Process A A/c
Particulars Units p.u. ₹ Particulars Units p.u. ₹
To Units brought in 10,000 100 10,00,000 By Normal Loss 500 1,000
Sundry Materials 10,000 Abnormal loss [Nt] 200 110 22,000
Labour 30,000 Process B A/c [Nt] 6,200 110 6,82,000
Direct expenses 6,000 P/L A/c 3,100 110 3,41,000
10,000 10,46,000 10,000 10,46,000
Process B A/c
To Process A A/c 6,200 110 682,000 By 15% Normal Loss 930 5 4,650
Sundry materials 15,000 Process C A/c [Nt] 2,700 150 405,000
Labour 80,000 Profit & Loss A/c 2,700 150 405,000
Direct expenses 18,150
Abnormal gain [Nt] 130 150 19,500
6,330 814,650 6,330 814,650
Process C A/c
To Process B A/c 2,700 150 4,05,000 By Normal Loss 540 10 5,400
Sundry Materials 5,000 Abnormal Loss [Nt] 60 230 13,800
Labour 65,000 Profit & Loss A/c [Nt] 2,100 230 4,83,000
Direct expenses 27,200
2,700 5,02,200 2,700 5,02,200
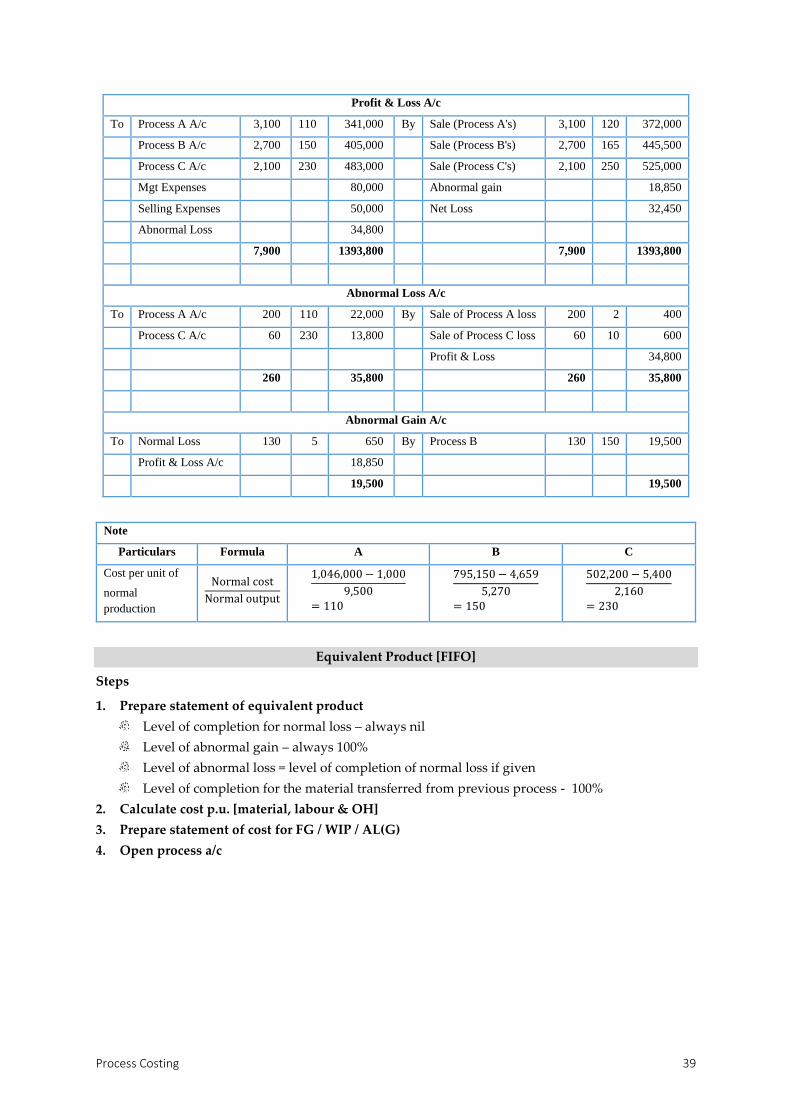
Process Costing 39
Profit & Loss A/c
To Process A A/c 3,100 110 341,000 By Sale (Process A's) 3,100 120 372,000
Process B A/c 2,700 150 405,000 Sale (Process B's) 2,700 165 445,500
Process C A/c 2,100 230 483,000 Sale (Process C's) 2,100 250 525,000
Mgt Expenses 80,000 Abnormal gain 18,850
Selling Expenses 50,000 Net Loss 32,450
Abnormal Loss 34,800
7,900 1393,800 7,900 1393,800
Abnormal Loss A/c
To Process A A/c 200 110 22,000 By Sale of Process A loss 200 2 400
Process C A/c 60 230 13,800 Sale of Process C loss 60 10 600
Profit & Loss 34,800
260 35,800 260 35,800
Abnormal Gain A/c
To Normal Loss 130 5 650 By Process B 130 150 19,500
Profit & Loss A/c 18,850
19,500 19,500
Note
Particulars Formula A B C
Cost per unit of
normal
production
Normal cost
Normal output
1,046,000 − 1,000
9,500= 110
795,150 − 4,659
5,270= 150
502,200 − 5,400
2,160= 230
Equivalent Product [FIFO]
Steps
1. Prepare statement of equivalent product
Level of completion for normal loss – always nil
Level of abnormal gain – always 100%
Level of abnormal loss = level of completion of normal loss if given
Level of completion for the material transferred from previous process - 100%
2. Calculate cost p.u. [material, labour & OH]
3. Prepare statement of cost for FG / WIP / AL(G)
4. Open process a/c

Cost Accounting 40
FIFO method
Question 1: From the following particulars, prepare the following in the books of X Ltd.:
(a) Statement of equivalent of cost.
(b) Statement of apportionment of cost.
Opening stock as on 1st August: 200 units @ ₹4 per unit
Degree of completion: Materials 100%, Labour and Overheads 40%
Units introduced during August: 1,050 units
Output transferred to the next process: 1,100 units
Closing stock: 150 units
Degree of completion: Materials 100%, Labour and Overheads 70%
Other relevant information regarding the process: Materials: ₹3,150, Labour: ₹4,500 and Overheads:
₹2,250.
{CMA inter D09, 10 marks}
Answer: FIFO method
(1) Statement of Equivalent units (using FIFO method)
Units Particulars Units Material Q Labour
In Out % EU % EU
200 Opening WIP
1,050 Input
FG Op. WIP 200 — — 60 120
New 900 100 900 100 900
Closing WIP 150 100 150 70 105
1,250 1,250 1,050 1,125
(2) Statement of Cost per equivalent unit and total cost
Material Labour & OH
Costs 3,150 6,750
Equivalent units (1) 1,050 1,125
Cost per unit 3 6
(3) Process Cost Sheet ₹ ₹
1 Finished Goods
Opening WIP processed Opening value 200×₹4 800
Labour & OH 120×₹6 720
New units processed Material, Labour & OH 900×₹9 8,100 9,620
2 Closing WIP Material 150×₹3 450
Labour & Overheads 105×₹6 630 1,080

Process Costing 41
(4) Process Q A/c
Particulars Units ₹ Particulars Units ₹
To Op. W.I.P. 200 800 By Completed units 1,100 9,620
Materials 1,050 3,150 Cl. WIP 150 1,080
Labour 4,500
Overheads 2,250
1,250 10,700 1,250 10,700
Question 2: From the following Information for the month ending October 2005, prepare Process Cost
accounts for Process III. Use First-in-fist-out (FIFO) method to value equivalent production.
Direct materials added in Process III (Opening WIP) 2,000 units at ₹25,750
Transfer from Process II 53,000 units at ₹4,11,500
Transferred to Process IV 48,000 units
Closing stock of Process III 5,000 units
Units scrapped 2,000 units
Direct material added in Process III ₹1,97,600
Direct wages ₹97,600
Production Overheads ₹48,800
Degree of completion:
Opening Stock Closing Stock Scrap
Materials 80% 70% 100%
Labour 60% 50% 70%
Overheads 60% 50% 70%
The normal loss in the process was 5% of production and scrap was sold at ₹3 p.u.
{CA inter 14 marks}
Answer:
(1) Statement of Equivalent units (using FIFO method)
Units Particulars Units Material A Material B Labour & OH
In Out % EU % EU % EU
2,000 Opening WIP
53,000 Input
FG Op. WIP 2,000 — — 20 400 40 800
New 46,000 100 46,000 100 46,000 100 46,000

Cost Accounting 42
Closing WIP 5,000 100 5,000 70 3,500 50 2,500
Normal loss 2,500 — — — — — —
Abnormal Gain (500) 100 (500) 100 (500) 80 (500)
55,000 55,000 50,500 49,400 48,800
(2) Statement of Cost per equivalent unit and total cost
Material A Material B Labour Overheads
Material Cost 4,11,500 1,97,600 97,600 48,800
(-) Scrap value of normal loss (2,500 × ₹3) 7,500
Total 4,04,000 1,97,600 97,600 48,800
Equivalent Units 50,500 49,400 48,800 48,800
Cost p.u. 8 4 2 1
(3) Process Cost Sheet ₹ ₹
1 Finished Goods
Opening WIP processed Opening value 25,750
Material B 400×₹4 1,600
Wages & Overheads 800×₹3 2,400
New units processed Total cost 46,000×₹15 6,90,000 7,19,750
2 Closing WIP Material A 5,000×₹8 40,000
Material B 3,500×₹4 14,000
Wages & Overheads 2,500×₹3 7,500 61,500
3 Abnormal Gain Total Cost 500×₹15 7,500
(4) Process III A/c
Particulars Units ₹ Particulars Units ₹
To Balance b/d 2,000 25,750 By Normal Loss 2,500 7,500
Process II A/c 53,000 4,11,500 Process IV A/c 48,000 7,19,750
Direct Material 1,97,600 Balance c/d 5,000 61,500
Direct Wages 97,600
Prod. Overheads 48,800
Abnormal Gain 500 7,500
55,500 7,88,750 55,500 7,88,750

Process Costing 43
FIFO & Average Price Method
Question 3: The following data relate to Process Q
1. Opening work-in-process 4,000 units and the degree of completion:
Materials 100% ₹24,000
Labour 60% ₹14,400
OH 60% ₹7,200
2. Received during the month of April, 2020 from process P: 40,000 Units at ₹1,71,000
3. Expenses incurred in Process Q during the month:
Materials ₹79,000
Labour ₹1,38,230
OH ₹69,120
4. Closing WIP is 3,000 units and degree of completion is material – 100% and labour & OH – 50%
5. Units scrapped are 4,000 units & degree of completion is material – 100% and Labour & OH – 80%
6. Normal loss: 5% of current input.
7. Spoiled goods realized ₹1.50 each on sale.
8. Completed units are transferred to warehouse;
Required Prepare:
1. Equivalent unit statement
2. Statement of cost per equivalent unit and total costs.
3. Process Q Account
4. Any other account necessary
{CA inter M98, 12 marks}
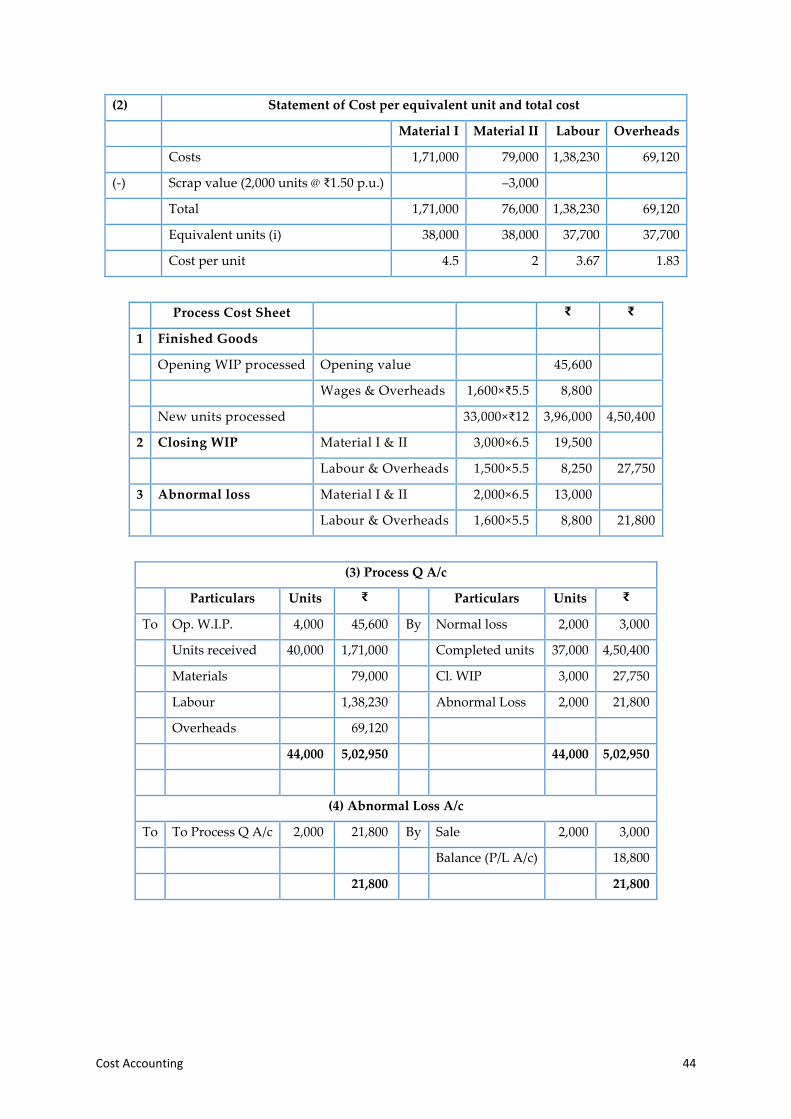
Answer: FIFO method
(1) Statement of Equivalent units (using FIFO method)
Units Particulars Units Material P Material Q Labour O.H
In Out % EU % EU % EU % EU
4,000 Opening WIP
40,000 Input
FG Op. WIP 4,000 — — — — 40 1,600 40 1,600
New 33,000 100 33,000 100 33,000 100 33,000 100 33,000
Closing WIP 3,000 100 3,000 100 3,000 50 1,500 50 1,500
Normal loss 2,000 — — — — — — — —
Abnormal loss 2,000 100 2,000 100 2,000 80 1,600 80 1,600
44,000 44,000 38,000 38,000 37,700 37,700
Cost Accounting 44
(2) Statement of Cost per equivalent unit and total cost
Material I Material II Labour Overheads
Costs 1,71,000 79,000 1,38,230 69,120
(-) Scrap value (2,000 units @ ₹1.50 p.u.) –3,000
Total 1,71,000 76,000 1,38,230 69,120
Equivalent units (i) 38,000 38,000 37,700 37,700
Cost per unit 4.5 2 3.67 1.83
Process Cost Sheet ₹ ₹
1 Finished Goods
Opening WIP processed Opening value 45,600
Wages & Overheads 1,600×₹5.5 8,800
New units processed 33,000×₹12 3,96,000 4,50,400
2 Closing WIP Material I & II 3,000×6.5 19,500
Labour & Overheads 1,500×5.5 8,250 27,750
3 Abnormal loss Material I & II 2,000×6.5 13,000
Labour & Overheads 1,600×5.5 8,800 21,800
(3) Process Q A/c
Particulars Units ₹ Particulars Units ₹
To Op. W.I.P. 4,000 45,600 By Normal loss 2,000 3,000
Units received 40,000 1,71,000 Completed units 37,000 4,50,400
Materials 79,000 Cl. WIP 3,000 27,750
Labour 1,38,230 Abnormal Loss 2,000 21,800
Overheads 69,120
44,000 5,02,950 44,000 5,02,950
(4) Abnormal Loss A/c
To To Process Q A/c 2,000 21,800 By Sale 2,000 3,000
Balance (P/L A/c) 18,800
21,800 21,800
Process Costing 45
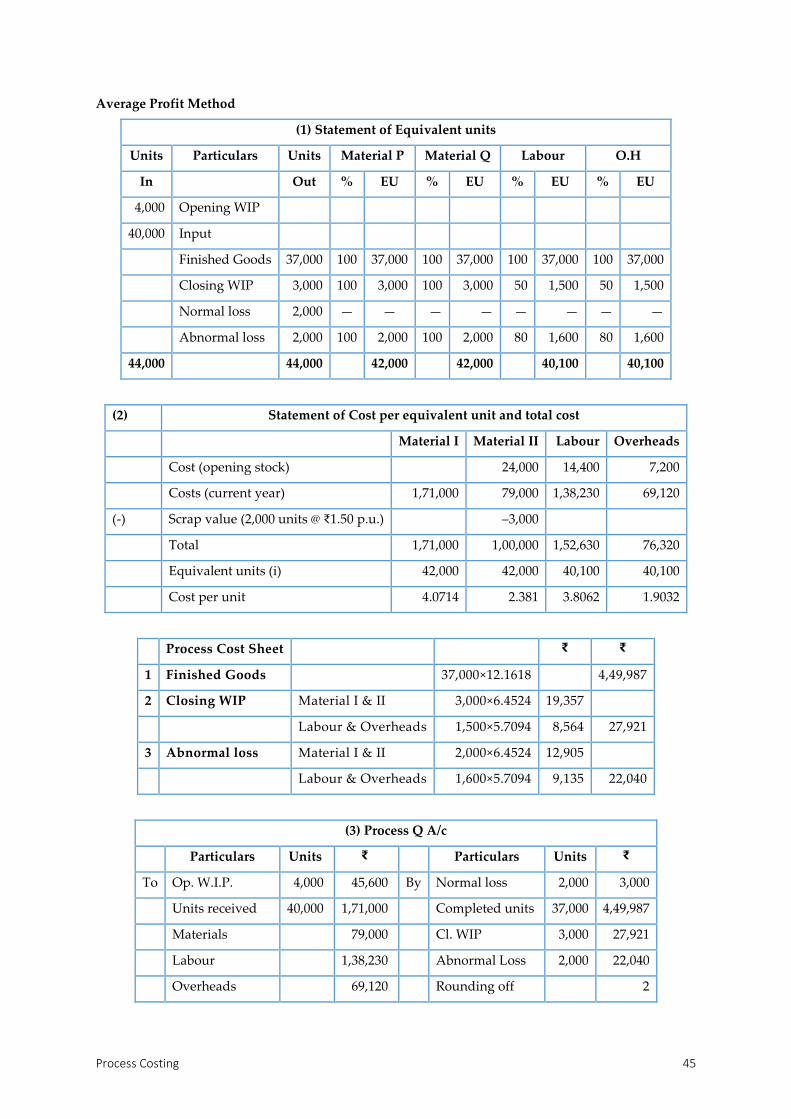
Average Profit Method
(1) Statement of Equivalent units
Units Particulars Units Material P Material Q Labour O.H
In Out % EU % EU % EU % EU
4,000 Opening WIP
40,000 Input
Finished Goods 37,000 100 37,000 100 37,000 100 37,000 100 37,000
Closing WIP 3,000 100 3,000 100 3,000 50 1,500 50 1,500
Normal loss 2,000 — — — — — — — —
Abnormal loss 2,000 100 2,000 100 2,000 80 1,600 80 1,600
44,000 44,000 42,000 42,000 40,100 40,100
(2) Statement of Cost per equivalent unit and total cost
Material I Material II Labour Overheads
Cost (opening stock) 24,000 14,400 7,200
Costs (current year) 1,71,000 79,000 1,38,230 69,120
(-) Scrap value (2,000 units @ ₹1.50 p.u.) –3,000
Total 1,71,000 1,00,000 1,52,630 76,320
Equivalent units (i) 42,000 42,000 40,100 40,100
Cost per unit 4.0714 2.381 3.8062 1.9032
Process Cost Sheet ₹ ₹
1 Finished Goods 37,000×12.1618 4,49,987
2 Closing WIP Material I & II 3,000×6.4524 19,357
Labour & Overheads 1,500×5.7094 8,564 27,921
3 Abnormal loss Material I & II 2,000×6.4524 12,905
Labour & Overheads 1,600×5.7094 9,135 22,040
(3) Process Q A/c
Particulars Units ₹ Particulars Units ₹
To Op. W.I.P. 4,000 45,600 By Normal loss 2,000 3,000
Units received 40,000 1,71,000 Completed units 37,000 4,49,987
Materials 79,000 Cl. WIP 3,000 27,921
Labour 1,38,230 Abnormal Loss 2,000 22,040
Overheads 69,120 Rounding off 2

Cost Accounting 46
44,000 5,02,950 44,000 5,02,950
(4) Abnormal Loss A/c
To To Process Q A/c 2,000 22,040 By Sale 2,000 3,000
Balance (P/L A/c) 19,040
22,040 22,040
Average Price Method
Question 4: The following information is given in respect of Process 3 for the month of January 2020.
Transferred from Process 2: 20,000 units @ ₹6.00 per unit
Transferred to Process 4: 17,000 units
Expenditure incurred in Process 3
Direct Materials ₹30,000
Direct Labour ₹60,000
Overheads ₹60,000
Scrap 1,000 units Closing Stock 4,000 units
Degree of completion: Degree of completion:
Direct Materials 100% Direct Materials 80%
Direct Labour 60% Direct Labour 60%
Overheads 40% Overheads 40%.
Normal loss 10% of production
Scrapped units realized ₹4 per unit
Prepare Process 3 A/c using average price method, along with necessary supporting statements.
{CA inter M01, 10 marks}
Opening stock – 2,000 units made up of
Direct Materials I ₹12,350
Direct Materials – II ₹13,200
Direct Labour ₹17,500
Overheads ₹11,000
Process Costing 47
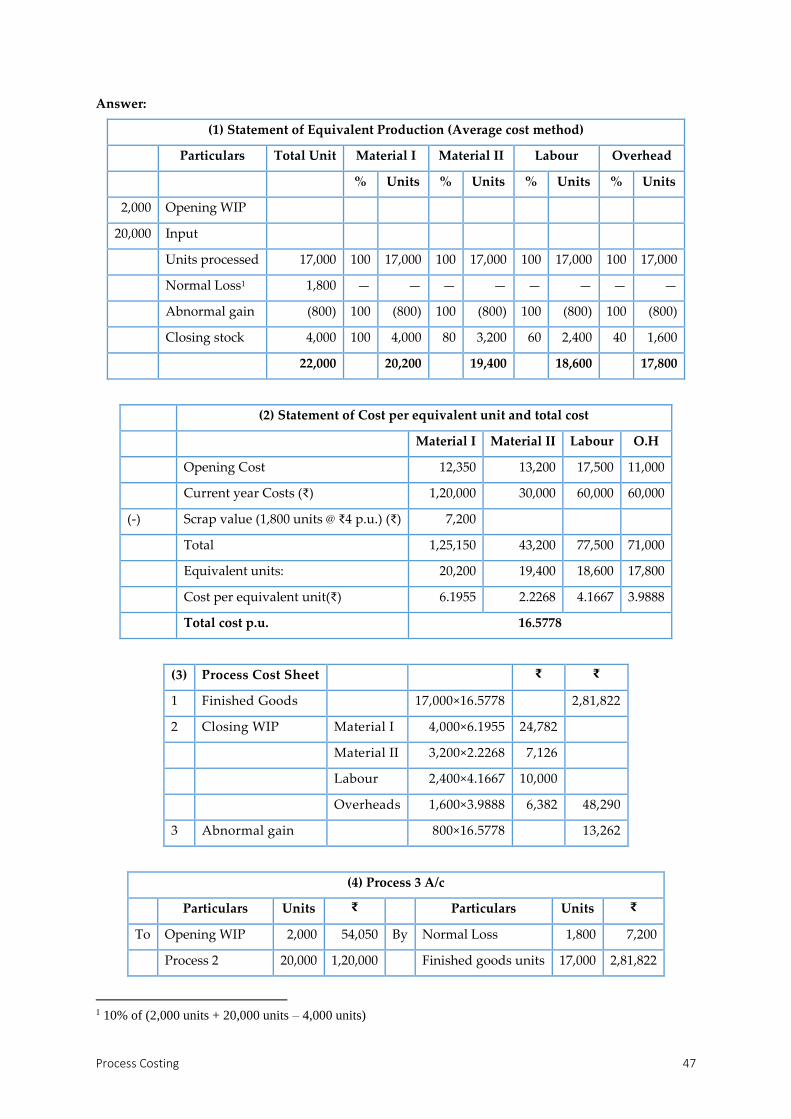
Answer:
(1) Statement of Equivalent Production (Average cost method)
Particulars Total Unit Material I Material II Labour Overhead
% Units % Units % Units % Units
2,000 Opening WIP
20,000 Input
Units processed 17,000 100 17,000 100 17,000 100 17,000 100 17,000
Normal Loss1 1,800 — — — — — — — —
Abnormal gain (800) 100 (800) 100 (800) 100 (800) 100 (800)
Closing stock 4,000 100 4,000 80 3,200 60 2,400 40 1,600
22,000 20,200 19,400 18,600 17,800
(2) Statement of Cost per equivalent unit and total cost
Material I Material II Labour O.H
Opening Cost 12,350 13,200 17,500 11,000
Current year Costs (₹) 1,20,000 30,000 60,000 60,000
(-) Scrap value (1,800 units @ ₹4 p.u.) (₹) 7,200
Total 1,25,150 43,200 77,500 71,000
Equivalent units: 20,200 19,400 18,600 17,800
Cost per equivalent unit(₹) 6.1955 2.2268 4.1667 3.9888
Total cost p.u. 16.5778
(3) Process Cost Sheet ₹ ₹
1 Finished Goods 17,000×16.5778 2,81,822
2 Closing WIP Material I 4,000×6.1955 24,782
Material II 3,200×2.2268 7,126
Labour 2,400×4.1667 10,000
Overheads 1,600×3.9888 6,382 48,290
3 Abnormal gain 800×16.5778 13,262
(4) Process 3 A/c
Particulars Units ₹ Particulars Units ₹
To Opening WIP 2,000 54,050 By Normal Loss 1,800 7,200
Process 2 20,000 1,20,000 Finished goods units 17,000 2,81,822
1 10% of (2,000 units + 20,000 units – 4,000 units)

Cost Accounting 48
Direct Material II 30,000 Closing balance 4,000 48,290
Direct Labour 60,000
Overhead 60,000
Abnormal gain 800 13,262
22,800 3,37,312 22,800 3,37,312
LIFO method
Question 5: From the following information relating to the month of January, 2020. Calculate the
equivalent production units and the value of finished production and WIP using LIFO method.
Opening WIP on 1st January 15,000 units; 50% complete.
Material: 18,000 Labour: 24,000 Overheads: 24,000 Total: 66,000
Units introduced in the process: 30,000 units
Material: 90,000 Labour: 157,500 Overheads: 210,000 Total: 457,500
During the period 22,500 units were completed and transferred to the next process. Closing work-in-
progress on 31st January: 22,500 units; 60% complete.
Answer: (1) Calculation of Equivalent Units
Units in Particulars Units Out % EU
15,000 Opening work in progress
30,000 Units introduced
Finished goods 22,500 100 22,500
Closing work in progress [new] 7,500 60 4,500
Closing work in progress [opening] 15,000 10 1,500
45,000 45,000 28,500
(2) 𝐶𝑜𝑠𝑡 𝑝𝑒𝑟 𝑢𝑛𝑖𝑡 𝑜𝑓 𝑒𝑞𝑢𝑖𝑣𝑎𝑙𝑒𝑛𝑡 𝑝𝑟𝑜𝑑𝑢𝑐𝑡𝑖𝑜𝑛 = 𝑇𝑜𝑡𝑎𝑙 𝑐𝑜𝑠𝑡
𝐸𝑞𝑢𝑖𝑣𝑎𝑙𝑒𝑛𝑡 𝑈𝑛𝑖𝑡𝑠 =
457,500
28,500 = ₹16.0526
(3) Valuation of finished Production and WIP
1. 𝐹𝑖𝑛𝑖𝑠ℎ𝑒𝑑 𝑝𝑟𝑜𝑑𝑢𝑐𝑡𝑖𝑜𝑛𝑠 = 22,500 × ₹16.0526 = ₹3,61,184
2. 𝐶𝑙𝑜𝑠𝑖𝑛𝑔 𝑊𝐼𝑃 = ₹66,000 + (1,500 × 16.0526) + (4,500 × 16.0526) = ₹1,39,720.65
Process Costing 49
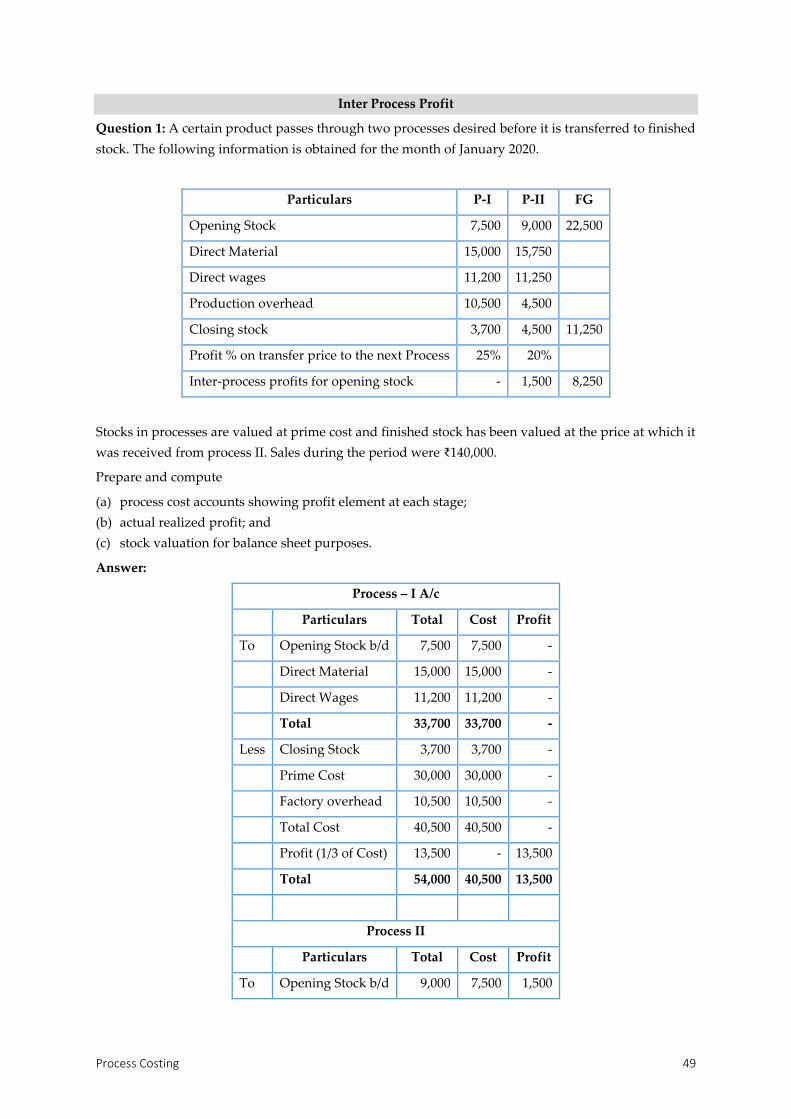
Inter Process Profit
Question 1: A certain product passes through two processes desired before it is transferred to finished
stock. The following information is obtained for the month of January 2020.
Particulars P-I P-II FG
Opening Stock 7,500 9,000 22,500
Direct Material 15,000 15,750
Direct wages 11,200 11,250
Production overhead 10,500 4,500
Closing stock 3,700 4,500 11,250
Profit % on transfer price to the next Process 25% 20%
Inter-process profits for opening stock - 1,500 8,250
Stocks in processes are valued at prime cost and finished stock has been valued at the price at which it
was received from process II. Sales during the period were ₹140,000.
Prepare and compute
(a) process cost accounts showing profit element at each stage;
(b) actual realized profit; and
(c) stock valuation for balance sheet purposes.
Answer:
Process – I A/c
Particulars Total Cost Profit
To Opening Stock b/d 7,500 7,500 -
Direct Material 15,000 15,000 -
Direct Wages 11,200 11,200 -
Total 33,700 33,700 -
Less Closing Stock 3,700 3,700 -
Prime Cost 30,000 30,000 -
Factory overhead 10,500 10,500 -
Total Cost 40,500 40,500 -
Profit (1/3 of Cost) 13,500 - 13,500
Total 54,000 40,500 13,500
Process II
Particulars Total Cost Profit
To Opening Stock b/d 9,000 7,500 1,500
Cost Accounting 50
Process I transfer 54,000 40,500 13,500
Direct Material 15,750 15,750 -
Direct Wages 11,250 11,250 -
Total 90,000 75,000 15,000
(-) Closing Stock 4,500 3,750 750
Prime Cost 85,500 71,250 14,250
Factory overhead 4,500 4,500 -
Total Cost 90,000 75,750 14,250
Profit (1/4 of Cost) 22,500 - 22,500
Total 1,12,500 75,750 36,750
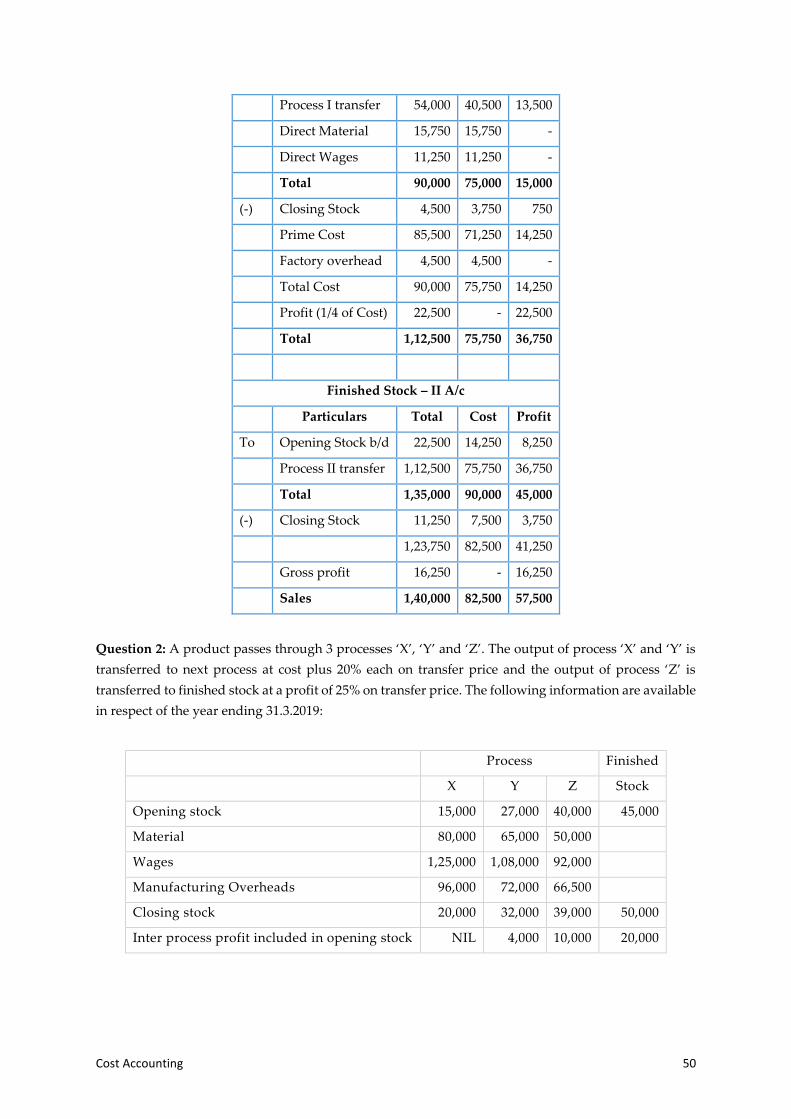
Finished Stock – II A/c
Particulars Total Cost Profit
To Opening Stock b/d 22,500 14,250 8,250
Process II transfer 1,12,500 75,750 36,750
Total 1,35,000 90,000 45,000
(-) Closing Stock 11,250 7,500 3,750
1,23,750 82,500 41,250
Gross profit 16,250 - 16,250
Sales 1,40,000 82,500 57,500
Question 2: A product passes through 3 processes ‘X’, ‘Y’ and ‘Z’. The output of process ‘X’ and ‘Y’ is
transferred to next process at cost plus 20% each on transfer price and the output of process ‘Z’ is
transferred to finished stock at a profit of 25% on transfer price. The following information are available
in respect of the year ending 31.3.2019:
Process Finished
X Y Z Stock
Opening stock 15,000 27,000 40,000 45,000
Material 80,000 65,000 50,000
Wages 1,25,000 1,08,000 92,000
Manufacturing Overheads 96,000 72,000 66,500
Closing stock 20,000 32,000 39,000 50,000
Inter process profit included in opening stock NIL 4,000 10,000 20,000

Process Costing 51
Stock in processes is valued at prime cost. The finished stock is valued at the price at which it is
received from process ‘Z’. Sale of the finished stock during the period was ₹14,00,000. You are
required to prepare:
(a) Process accounts and finished stock A/c showing profit element at each stage.
(b) Profit & Loss A/c.
(c) Show the relevant items in the Balance Sheet.
{CA inter N08, 12 marks}
Answer: (a)
Process X A/c
Particulars Cost Profit Total
Opening stock 15,000 − 15,000
Material 80,000 − 80,000
Wages 1,25,000 − 1,25,000
Total 2,20,000 − 2,20,000
(-) Closing stock 20,000 − 20,000
Prime Cost 2,00,000 2,00,000
Mft. overhead 96,000 − 96,000
Total cost 2,96,000 − 2,96,000
P/L A/c 74,000 74,000
Transfer to Process Y 2,96,000 74,000 3,70,000
Process Y A/c
Opening Stock 23,000 4,000 27,000
Process ‘X’ A/c 2,96,000 74,000 3,70,000
Material 65,000 − 65,000
Wages 1,08,000 − 1,08,000
Total 4,92,000 78,000 5,70,000
(-) Closing stock 27,621 4,379 32,000
Prime Cost 4,64,379 73,621 5,38,000
Mft. overhead 72,000 − 72,000
Total cost 5,36,379 73,621 6,10,000
P/L A/c − 152,500 1,52,500
Transfer to Process Z 5,36,379 226,121 7,62,500
Process Z A/c
Op Stock 30,000 10,000 40,000

Cost Accounting 52
Process ‘Y’ 5,36,379 2,26,121 7,62,500
Material 50,000 − 50,000
Wages 92,000 − 92,000
Total 7,08,379 2,36,121 9,44,500
(-) Closing stock 29,250 9,750 39,000
Prime Cost 6,79,129 2,26,371 9,05,500
Mft. overhead 66,500 − 66,500
Total cost 7,45,629 2,26,371 9,72,000
P/L A/c − 3,24,000 3,24,000
Finished Goods 7,45,629 5,50,371 12,96,000
Finished Goods A/c
Opening Stock 25,000 20,000 45,000
Process ‘Z’A/c 7,45,629 5,50,371 12,96,000
Total 7,70,629 5,70,371 13,41,000
(-) Closing stock 28,733 21,267 50,000
7,41,896 5,49,104 12,91,000
P/L A/c 1,09,000 1,09,000
Sales 7,41,896 6,58,104 14,00,000
(ii) Profit and Loss A/c for the year ending 31st March, 2019
Dr Particulars ₹ Cr Particulars ₹
To Unrealized profit on cl. stock1 35,396 By Unrealized profit on op. stock 34,000
Net Profit 6,58,104 Process X A/c 74,000
Process Y A/c 1,52,500
Process Z A/c 3,24,000
Finished Stock A/c 1,09,000
1 Calculation of amount of unrealized profit on closing stock:
Process ‘X’ Nil
Process ‘Y’ 78,000
570,000× 32,000
₹4,379
Process ‘Z’ 236,121
944,500× 39,000
₹9,750
Finished stock 570,371
13,41,000× 50,000
₹21,267
35,396

Process Costing 53
6,93,500 6,93,500
(iii) Balance Sheet as on 31st March, 2019 (Extract)
Liabilities (₹) (₹) Assets (₹) (₹)
Net profit 6,58,138 Closing stock
Process – X 20,000
Process – Y 32,000
Process – Z 39,000
Finished stock 50,000
1,41,000
[-] unrealized profit 35,396 1,05,604
Advanced Problem
Question 1: A product passes through three processes A, B and C, 10,000 units at a cost of ₹1 were
issued to process A. The other direct expenses were:
Process A Process B Process C
Sundry materials 1,000 1,500 1,480
Direct labour 5,000 8,000 6,500
Direct expenses 1,050 1,188 1,605
The wastage of Process A was 5% and Process B was 4%. The wastage of Process A was sold at ₹0.25
per unit and that of B at ₹0.50 per unit and that of C at ₹1.00 per unit. The overhead charges were 168%
of direct labour. The final product was sold at ₹10.00 per unit, fetching a profit of 20% on sales.
Required: Find the percentage of wastage in Process C.
Answer:
Process A A/c
Dr Particulars Units ₹ Cr Particulars Units ₹
To Units introduced 10,000 10,000 By Normal wastage a/c 500 125
Sundry materials 1,000 Process B a/c. (t/f) 9,500 25,325
Direct labour 5,000
Direct expenses 1,050
Overheads 8,400
10,000 25,450 10,000 25,450

Cost Accounting 54
Process B A/c
Dr Particulars Units ₹ Cr Particulars Units ₹
To Process A a/c. (t/f) 9,500 25,325 By Normal wastage a/c. 380 190
Sundry materials 1,500 Process C a/c. 9,120 49,263
Direct labour 8,000
Direct expenses 1,188
Overheads 13,440
9,500 49,453 9,500 49,453
Process C A/c
Dr Particulars Units ₹ Cr Particulars Units ₹
To Process B a/c. (t/f) 9,120 49,263 By Normal wastage a/c. 456 456
Sundry materials 1,480 (see working note)
Direct labour 6,500 Sale 8,664 86,640
Direct expenses 1,605
Overhead 10,920
Profit 17,328
9,120 87,096 9,120 87,096
Working note: Computation of percentage of wastage in Process C
Let waste units = x and
Sales value of waste units (No of waste units × Scrap Value p. u. )(x × ₹1) = x
Total cost = (Sales per unit − Profit %) × No of units produced
Total cost = (₹10 − 20%) × (9,120 − x)
= 72,960 − 8x = 69,768 − x
Hence x = 456
Percentage of Wastage =456
9,120% = 5%
OPERATION COSTING
Question 1: RST Ltd. manufactures plastic moulded chairs. Three models of moulded chairs, all
variation of the same design, are Standard, Deluxe and Executive. The company uses an operation-
costing system.
RST Ltd. has extrusion, form, trim and finish operations. Plastic sheets are produced by the extrusion
operation. During the forming operation, the plastic sheets are moulded into chair seats and the legs
are added. The standard model is sold after this operation. During the trim operation, the arms are
added to the Deluxe and Executive models and the chair edges are smoothed. Only the executive model
enters the finish operation, in which padding is added. All of the units produced receive the same steps
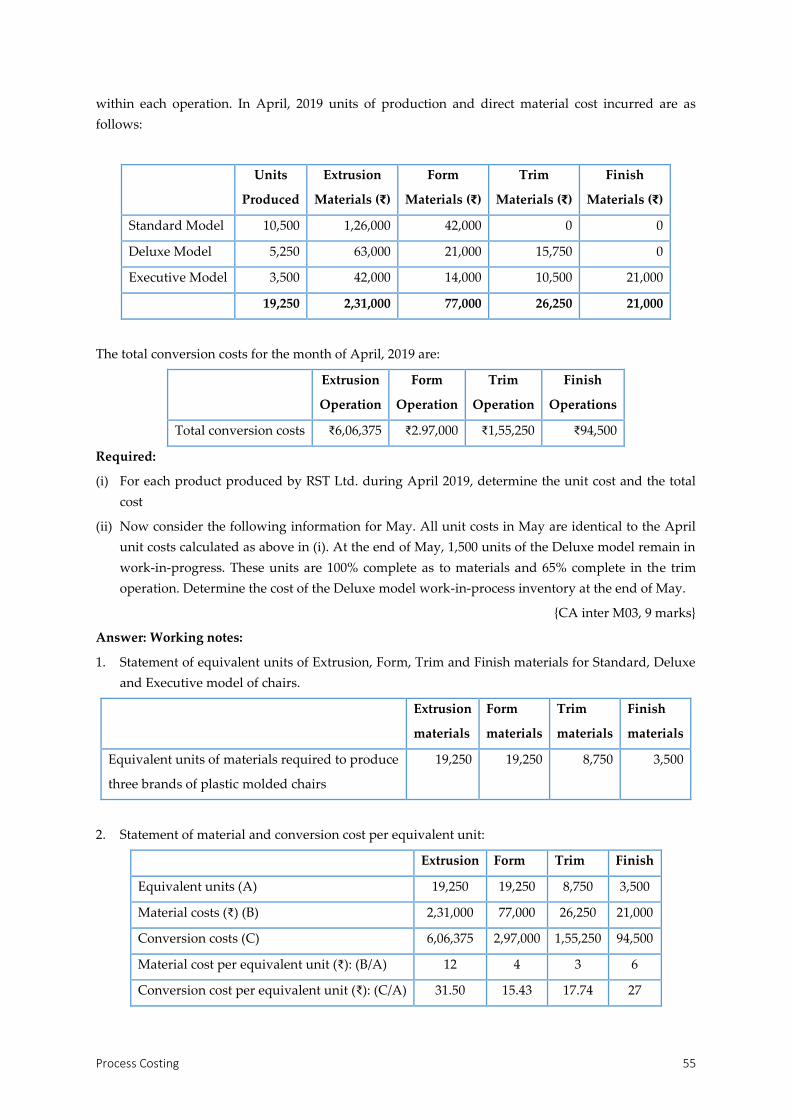
Process Costing 55
within each operation. In April, 2019 units of production and direct material cost incurred are as
follows:
Units
Produced
Extrusion
Materials (₹)
Form
Materials (₹)
Trim
Materials (₹)
Finish
Materials (₹)
Standard Model 10,500 1,26,000 42,000 0 0
Deluxe Model 5,250 63,000 21,000 15,750 0
Executive Model 3,500 42,000 14,000 10,500 21,000
19,250 2,31,000 77,000 26,250 21,000
The total conversion costs for the month of April, 2019 are:
Extrusion
Operation
Form
Operation
Trim
Operation
Finish
Operations
Total conversion costs ₹6,06,375 ₹2.97,000 ₹1,55,250 ₹94,500
Required:
(i) For each product produced by RST Ltd. during April 2019, determine the unit cost and the total
cost
(ii) Now consider the following information for May. All unit costs in May are identical to the April
unit costs calculated as above in (i). At the end of May, 1,500 units of the Deluxe model remain in
work-in-progress. These units are 100% complete as to materials and 65% complete in the trim
operation. Determine the cost of the Deluxe model work-in-process inventory at the end of May.
{CA inter M03, 9 marks}
Answer: Working notes:
1. Statement of equivalent units of Extrusion, Form, Trim and Finish materials for Standard, Deluxe
and Executive model of chairs.
Extrusion
materials
Form
materials
Trim
materials
Finish
materials
Equivalent units of materials required to produce
three brands of plastic molded chairs
19,250 19,250 8,750 3,500
2. Statement of material and conversion cost per equivalent unit:
Extrusion Form Trim Finish
Equivalent units (A) 19,250 19,250 8,750 3,500
Material costs (₹) (B) 2,31,000 77,000 26,250 21,000
Conversion costs (C) 6,06,375 2,97,000 1,55,250 94,500
Material cost per equivalent unit (₹): (B/A) 12 4 3 6
Conversion cost per equivalent unit (₹): (C/A) 31.50 15.43 17.74 27

Cost Accounting 56
Statement of Unit and Total cost Model-wise
Standard Model Deluxe Model Executive Model
Extrusion material 12.00 12.00 12.00
Form material 4.00 4.00 4.00
Trim material – 3.00 3.00
Finish material - - 6..00
Extrusion conversion 31.50 31.50 31.50
Form conversion 15.43 15.43 15.43
Trim conversion – 17.74 17.74
Finish conversion – – 27
(a) Total unit cost 62.93 83.67 116.67
(b) Total Units 10,500 5,250 3,500
Total Cost (a) × (b) 6,60,765 4,39,267.5 4,08,345
Statement of cost of 1,500 units of the Deluxe Model of the chairs lying in WIP inventory at the end
of May 19
Equivalent
Units
Unit cost
(WN 2) ₹
Total Cost
(1) (2) (𝟑) = (𝟏) × (𝟐)
Extrusion materials 1,500 12 18,000
Form materials 1,500 4 6,000
Trim materials 1,500 3 4,500
Extrusion materials conversion 1,500 31.50 47,250
Form materials conversion 1,500 15.43 23,145
Trim materials conversation (1,500 units × 65%) 975 17.74 17,296.50
Total cost of 1,500 units of 1,16,191.50
Deluxe Model of chairs lying in WIP

Joint Products and By Products 57
2.5 JOINT PRODUCTS AND BY- PRODUCTS
Split-off
Joint Process point Products Further Process
========→
Input
Joint cost
Material,
Labour &
Expenses
======→ A Joint product =============→ A1
======→ B Joint product =============→ B1
======→ X By product
1. Joint Products: have equal and significant value
2. By Products: have no significant value (scrap value)
3. Apportioning joint cost for
Joint products
(a) Average unit cost method
(b) Physical unit method
(c) Survey method or Weighted average method
(d) Contribution margin method [Sales – variable cost]
(e) Market value method:
(i) At the point of separation [Market value | Market Price]
(ii) After further processing [Market value | Market Price]
(f) Reverse cost Method or Net realizable value
(g) Reverse cost method with constant GP Ratio or Constant GP Ratio method
By products
(a) Market Value or value on realization
(b) Standard cost in technical estimate
(c) Comparative price
(d) Reuse price
4. Treatment of value for by product
(a) If the value is small: (1) credited to Costing P/L (2) deductible from cost of production
(b) If the value is considerable: apportion like joint costs
(c) If by product require further process: net realizable value
5. Further operation:
Product may be sold after split off point or after further process
If further process cost < incremental revenue, further process is carried on
If further process cost > incremental revenue, further process is not carried on

Cost Accounting 58
PRACTICAL PROBLEMS
Average Unit Cost Method
Question 1: The Rama Corporation produces four products in a manufacturing process.
The corporation produced 10,000 units of A, 20,000 units of B, 15,000 units of C and 25,000 units of D.
The cost before split off point for the four products was ₹140,000. Using the average unit cost method
a. calculate the unit cost, and
b. Show how the joint cost would be apportioned among the products.
Answer:
a. 𝐴𝑣𝑒𝑟𝑎𝑔𝑒 𝑈𝑛𝑖𝑡 𝐶𝑜𝑠𝑡 =𝐽𝑜𝑖𝑛𝑡 𝑐𝑜𝑠𝑡
𝑇𝑜𝑡𝑎𝑙 𝑛𝑢𝑚𝑏𝑒𝑟 𝑜𝑓 𝑢𝑛𝑖𝑡𝑠 𝑝𝑟𝑜𝑑𝑢𝑐𝑒𝑑=
140,000
70,000= ₹2𝑝. 𝑢
b. Cost apportioned among deferent products:
Product A 10000 ×₹2 ₹20,000
Product B 20000 ×₹2 ₹40,000
Product C 15000 ×₹2 ₹30,000
Product D 25000 ×₹2 ₹50,000
Physical Unit Method
Question 2: The following data is extracted from the books of M/s. East India Coke Co. Ltd:
Joints Products Coke Coal Tar Benzoyl Sul. of Ammonia Gas Total
Yield in lbs. for per ton of coal 1,420 120 22 26 412 2,000
The price of coal is ₹80 per tonne. Direct labour and OH cost to split off point are ₹40 and ₹60
respectively per tonne of coal. Calculate the material, labour, OH and total cost of each product on the
basis of weight.
Answer:
Yield % of Total Apportioned cost
Coal DL OH Total
Coke 1420 71.0 56.80 28.40 42.60 127.80
Coal Tar 120 6.0 4.80 2.40 3.60 10.80
Benzol 22 1.1 0.88 0.44 0.66 1.98
Sul. 26 1.3 1.04 0.52 0.78 2.34
Gas 412 20.6 16.48 8.42 12.36 37.08
Total 2000 100 80.00 40.00 60.00 180.00
Survey Method / Weighted Average Method
Question 3: In the timber industry, the milling operations to the split off point during a period
amounted to ₹17,400 with the production;

Joint Products and By Products 59
First grade timber– 400 units,
Second grade timber– 500 units and
Third grade timber– 600 (Total – 1,500 units)
You are required to apportion the joint cost on technical evaluation with points 5, 4 and 3 for first,
second and third grade respectively.
Answer:
Item
1
Units
2
Points
3
Eq Units
4
Cost p.u.
5
Apportioned Cost
6= (4 × 5)
Cost p.u.
7=(𝟔
𝟐)
I Grade 400 5 2,000 3 6,000 15
II Grade 500 4 2,000 3 6,000 12
III Grade 600 3 1,800 3 5,400 9
Total 1,500 5,800 17,400
Market Value / Sales Price Method (Separation Point)
Question 4: The joint cost of making 40 units of product A, 120 units of product B and 140 units of
product C is ₹2,250. The selling prices of products A, B and C are ₹2, ₹3 and ₹4 respectively. The
products did not require any further processing cost after split off point.
You are required to apportion the joint cost (a) on sales price basis and (b) on sales value basis.
Answer:
Apportionment on
1 2 3=1×2 (a) sales price basis (b) sales value basis
Product SP p.u. Qty Sold Sales Value Ratio Apportioned Ratio Apportioned
A 2 40 80 2/9 500 80/1000 180
B 3 120 360 3/9 750 360/1000 810
C 4 140 560 4/9 1,000 560/1000 1,260
Total 9 1,000 2,250 1000 2,250
Market Value Method (after further processing)
Question 5: X Co. Ltd. manufactures two joint products, A and B and sells them at ₹5 and ₹4 p.u.
respectively. During a particular period, 400 units of A and 500 units of B were produced and sold. The
joint cost incurred was ₹180 and further processing costs for products A and B are ₹1,600 and ₹1,500
respectively. Apportion the joint cost.
Answer:
Sales Value Sales Price
Product Quantity
Produced
SP p.u. Sales
Value
Ratio Apportioned
Joint Cost
Ratio Apportioned
Joint Cost
A 400 5 2000 1 90 5/9 100

Cost Accounting 60
B 500 4 2000 1 90 4/9 80
180 180
Reverse cost method or net realisable value method | Reverse cost method with constant GP ratio
Question 6: The factory produces three products A, B and C of equal value from the same
manufacturing process. The joint cost before split off point is ₹19,600. Subsequent costs are given as
under:
A B C Total
Direct Material 1,500 1,300 1,000
Direct Labour 200 150 100
Overhead 800 550 400
Total 2,500 2,000 1,500 6,000
Selling Price 30,000 24,000 20,000 74,000
Profit on Selling Price 30% 25% 20%
Show how you would propose to apportion the joint costs of manufacture under
1. Net realizable value or reverse cost method
2. Constant gross profit ratio and reverse cost method
Answer: Statement of Apportionment of Joint Cost
Product Sales Profit Constant
GP [65.41%]
Further
Cost
NRV NRV
Apport
NRV
Contant GP
A 30,000 9,000 19,622 2,500 18,500 7,400 7,878
B 24,000 6,000 15,697 2,000 16,000 6,400 6,303
C 20,000 4,000 13,081 1,500 14,500 5,800 5,419
49,000 19,600 19,600
𝐶𝑜𝑛𝑠𝑡𝑎𝑛𝑡 𝐺𝑃 𝑅𝑎𝑡𝑖𝑜 =𝐺𝑃
𝑆% =
74,000 − 19,600 − 6,000
74,000% = 65.41%
NRV = Sales – Profit – further cost
NRV Apport = Apportionment using NRV
NRV Constant GP = Sales – Constant GP – further cost
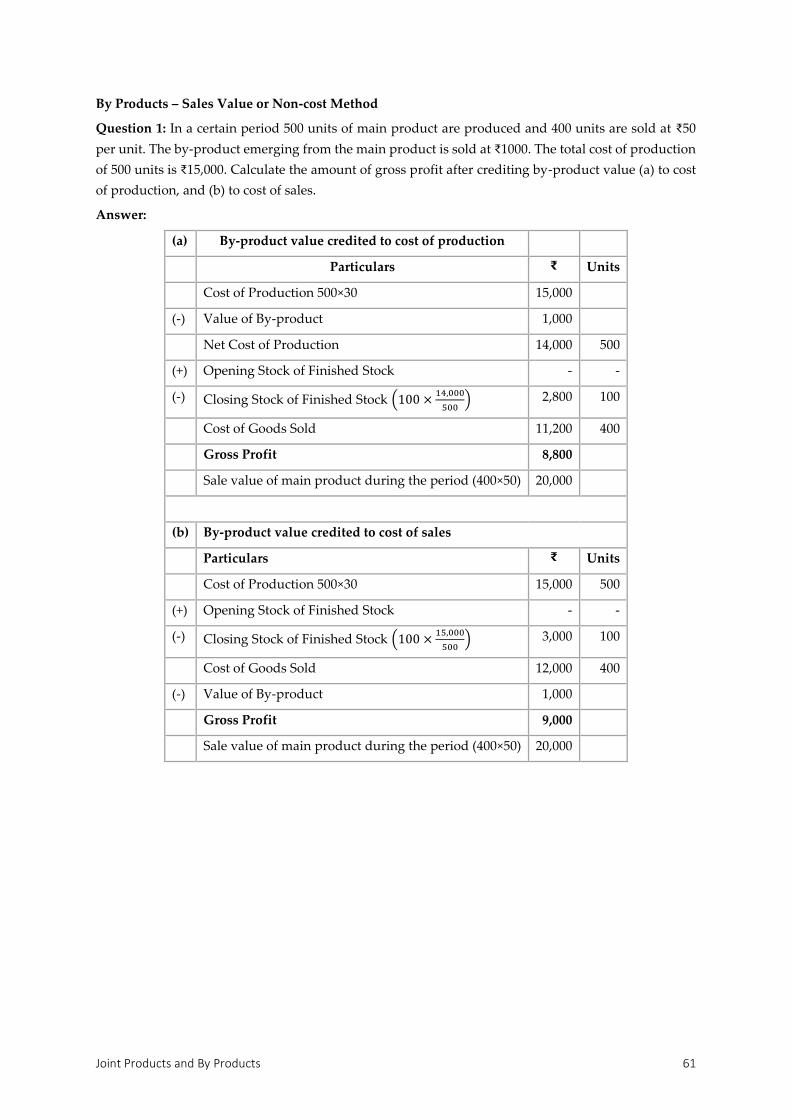
Joint Products and By Products 61
By Products – Sales Value or Non-cost Method
Question 1: In a certain period 500 units of main product are produced and 400 units are sold at ₹50
per unit. The by-product emerging from the main product is sold at ₹1000. The total cost of production
of 500 units is ₹15,000. Calculate the amount of gross profit after crediting by-product value (a) to cost
of production, and (b) to cost of sales.
Answer:
(a) By-product value credited to cost of production
Particulars ₹ Units
Cost of Production 500×30 15,000
(-) Value of By-product 1,000
Net Cost of Production 14,000 500
(+) Opening Stock of Finished Stock - -
(-) Closing Stock of Finished Stock (100 ×14,000
500) 2,800 100
Cost of Goods Sold 11,200 400
Gross Profit 8,800
Sale value of main product during the period (400×50) 20,000
(b) By-product value credited to cost of sales
Particulars ₹ Units
Cost of Production 500×30 15,000 500
(+) Opening Stock of Finished Stock - -
(-) Closing Stock of Finished Stock (100 ×15,000
500) 3,000 100
Cost of Goods Sold 12,000 400
(-) Value of By-product 1,000
Gross Profit 9,000
Sale value of main product during the period (400×50) 20,000

Cost Accounting 62
Advanced problem in joint product
Question 1: Pokemon Chocolates manufactures and distributes chocolate products. It purchases
Cocoa beans and processes them into two intermediate products:
Chocolate powder liquor base
Milk-chocolate liquor base
These two intermediate products become separately identifiable at a single split off point. Every 500
pounds of cocoa beans yields 20 gallons of chocolate – powder liquor base and 30 gallons of milk-
chocolate liquor base.
The chocolate powder liquor base is further processed into chocolate powder. Every 20 gallons of
chocolate-powder liquor base yields 200 pounds of chocolate powder. The milk-chocolate liquor base
is further processed into milk-chocolate. Every 30 gallons of milk-chocolate liquor base yields 340
pounds of milk chocolate.
Production and sales data for October, 2004 are:
Cocoa beans processed 7,500 pounds
Costs of processing Cocoa beans to split off point
(including purchase of beans)
₹712,500
Production Sales Selling price
Chocolate powder 3,000 pounds 3,000 pounds ₹190 per pound
Milk chocolate 5,100 5,100 ₹237.50 per pound
The October, 2004 separable costs of processing chocolate-powder liquor into chocolate powder are
₹302,812.50. The October 2004 separable costs of processing milk-chocolate liquor base into milk-
chocolate are ₹623,437.50.
Pokemon processes both of its intermediate products into chocolate powder or milk-chocolate. There
is an active market for these intermediate products. In October, 2004, Pokemon could have sold the
chocolate powder liquor base for ₹997.50 a gallon and the milk-chocolate liquor base for ₹1,235 a gallon.
Required:
(i) Calculate how the joint cost of ₹7,12,500 would be allocated between the chocolate powder
and milk-chocolate liquor bases under the following methods:
(a) Sales value at split off point
(b) Physical measure (gallons)
(c) Estimated net realizable value, (NRV) and
(d) Constant gross-margin percentage NRV.
(ii) What is the gross-margin percentage of the chocolate powder and milk-chocolate liquor
bases under each of the methods in requirements (i)?
(iii) Could Pokemon have increased its operating income by a change in its decision to fully
process both of its intermediate products? Show your computations.
{CA inter N04, 8+2+3=13 marks}

Joint Products and By Products 63
Answer: Working note
Input Joint
Process
Split off
Output
₹ Further
Process [₹]
Further Process
Output
₹
Cocoa
Bean
₹712,500
[500 lbs.]
7,500 lbs.
CPLB [20 g]
300 g × ₹997.50
2,99,250
FC 3,02,812.50
FR 2,70,750.00
FR < FC
CP [200 lbs.]
3,000 lbs. × ₹190
No further process
5,70,000
MCLB [30 g]
450 g × ₹1,235
5,55,750
FC 6,23,437.50
FR 6,55,500.00
FR > FC
MC [340 lbs.]
5,100 lbs. × ₹237.50
Do further process
12,11,250
Total 8,55,000 9,26,250 17,81,250
𝐶𝑜𝑛𝑠𝑡𝑎𝑛𝑡 𝐺𝑃 𝑅𝑎𝑡𝑖𝑜 =𝐺𝑃
𝑆% =
17,81,250 − 9,26,250 − 7,12,500
17,81,250% = 8%
Apportionment using different bases [refer working note]
SV at
Splitt-off
Physical
Measure
NRV
[S - FPC]
NRV 8%
GP
Constant
GPR [NRV-GP]
CPLB 2,49,375 2,85,000 2,67,187.5 2,22,656.25 45,600 2,21,587.5
MCLB 4,63,125 4,63,125 5,87,812.5 4,89,843.75 96,900 4,90,912.5
7,12,500 7,12,500 7,12,500 7,12,500
(ii) GPR under different apportion bases
CBLB SV at
Split off
Physical
Measure
NRV Constant
GPR NRV
SV of CP 5,70,000.00 5,70,000.00 5,70,000.00 5,70,000.00
(-) Separable costs 3,02,812.50 3,02,812.50 3,02,812.50 3,02,812.50
(-) Joint costs 2,49,375.00 2,85,000.00 2,22,656.25 2,21,587.50
Gross Margin 17,812.50 (17,812.50) 44,531.25 45,600
Gross Margin % 3.125% (3.125%) 7.8125% 8%
MCLB
SV of MC 12,11,250 12,11,250 12,11,250 12,11,250
(-) Separable costs 6,23,437.50 6,23,437.50 6,23,437.50 6,23,437.50
(-) Joint costs 4,63,125 4,27,500 4,89,843.75 4,90,912
Gross Margin 1,24,687.50 1,60,312.50 97,968.75 96,900.50
Gross Margin % 10.29% 13.23% 8.08% 8%
(iii) Further revenue is increased by ₹32,062.5 by not processing CPLB further [refer working note]

Cost Accounting 64
2.6 SERVICE COSTING / OPERATING COSTING
Operating costing: It is a method of ascertaining costs of providing or operating a service.
Applicable: Transport | Hotel | Hospital etc.
{CMA inter, J06 & J09, 5 marks}
Features of operating costs:
1. Operating and running charges: Variable nature like petrol, diesel, lubricating oil, and grease etc.
2. Maintenance charges. Semi-variable nature: cost of tyres and tubes, repairs and maintenance, etc.
3. Fixed or standing charges. garage rent, insurance, road license, depreciation, manager’s salary, etc.
PRACTICAL PROBLEMS
Transport [Absolute tone km & commercial tone km]
Question 1: A truck starts with a load of 10 tons of goods from station P. It unloads 4 tons at station Q
and rest of the goods at station R. It reaches back directly to Station P after getting reloaded with 8 tons
of goods at station R. The distances between P to Q, Q to R and then from R to P are 40 kms, 60 kms
and 80 kms respectively. Compute ‘absolute tonne-km.’ & ‘Commercial tonne-km.'
{CA inter M94, 4 marks}
Answer: Absolute tonne-km = Distance × Load = 40 × 10 + 60 × 6 + 80 × 8 = 1400
Commercial tonne-km = Distance Covered × average Load = 40 + 60 + 80 ×10+6+8
3= 1440
Question 2: SHANKAR has been promised a contract to run a tourist car on a 20 km. long route for the
chief executive of a multinational firm. He buys a car costing ₹150,000. The annual cost of insurance
and taxes are ₹4,500 and ₹900 respectively. He has to pay ₹500 per month for a garage where he keeps
the car when it is not in use. The annual repair costs are estimated at ₹4,000. The car is estimated to
have a life of 10 years at the end of which the scrap value is likely to be ₹50,000.
He hires a driver who is to be paid ₹300 per month plus 10% of the takings as commission. Other
incidental expenses are estimated at ₹200 per month.
Petrol and oil will cost ₹100 per 100 kms. The car will make 4 round trips each day. Assuming that a
profit of 15% on takings is desired and that the car will be on the road for 25 days on an average per
month, what should he charge per round-trip?
Answer:
Statement of Operating cost
Standing charges Per Annum Per Month
₹ ₹
Depreciation 10,000
Insurance 4,500
Taxes 900

Service Costing / Operating Costing 65
Garage (₹500 × 12) 6,000
Annual repairs 4,000
Driver's Salary (₹300× 12) 3,600
Incidental expenses (₹200 × 12) 2,400
31,400 2,617
Variable expenses
Petrol and Oil: *4000kms × 1/100 kms × ₹100 4,000
Total Cost without commission 75 6,617
Driver’s Commission 10 882
Profit 15 1323
Total takings 100 8,822
Total number of round trips per month: 25 days × 4 round trips per day = 100
Hence the charge per round trip = 8822
100 = ₹88.22
* 20 kms × 2 × 4× round trips × 25 days = 4,000 kms.
Question 3: Mahi Transport Company operates a luxury bus, which runs between Delhi to Jaipur and
back for 10 days in a month. The distance from Delhi to Jaipur is 270 kms. The bus completes the trip
from Delhi to Jaipur and comes back on the same day. The bus goes on a Delhi-Agra trip for 10 days in
a month. The distance from Delhi to Agra is 180 kms. This trip is also completed on the same day. For
4 days of its operation in a month it runs in the local city. Daily distance covered in the city is 65 kms.
The other information is given below:
Particulars ₹
Cost of Bus ₹15,00,000
Depreciation 15% per annum
Salary of Driver ₹9,000 per month
Salary of Conductor ₹8,000 per month
Salary of par time accountant ₹4,500 per month
Insurance ₹10,800 per quarter
Diesel ₹49 per liter
Distance covered per liter 5 kms.
Token Tax ₹8,100 per quarter
Lubricant oil ₹300 per 100 k.m.
Repairs and Maintenance ₹8,000 per month
Permit Fee ₹13,050 per quarter
Normal capacity 50 persons
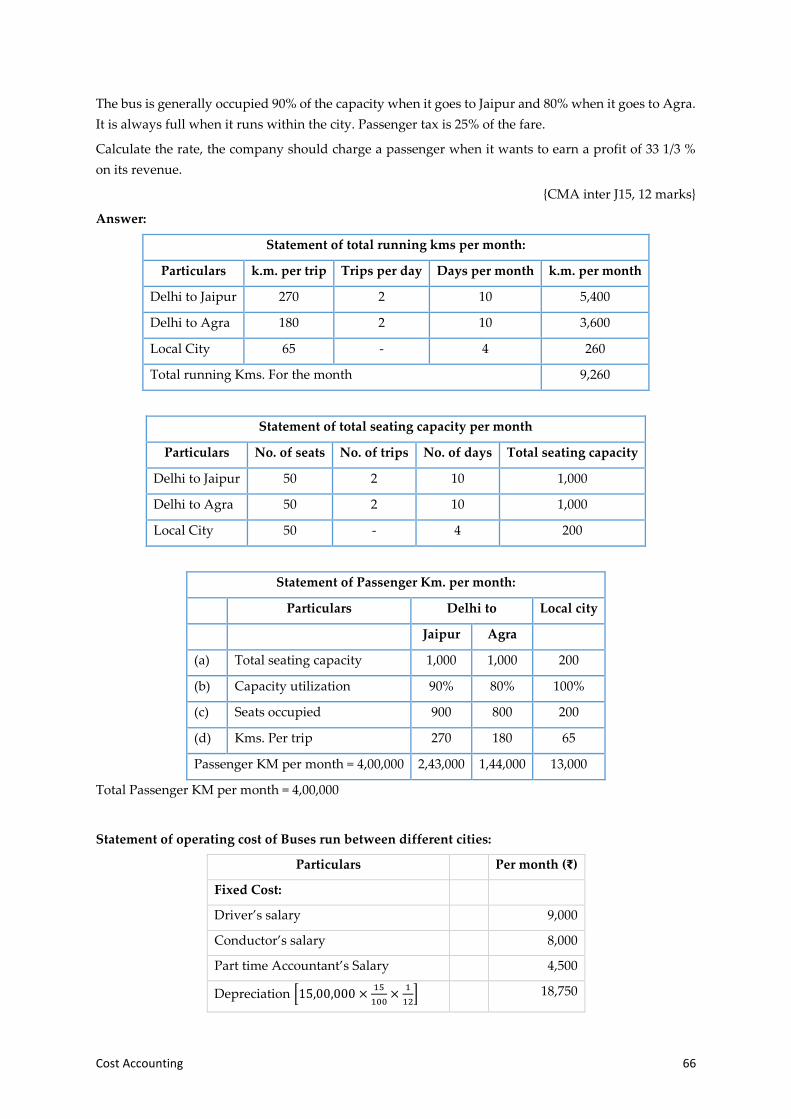
Cost Accounting 66
The bus is generally occupied 90% of the capacity when it goes to Jaipur and 80% when it goes to Agra.
It is always full when it runs within the city. Passenger tax is 25% of the fare.
Calculate the rate, the company should charge a passenger when it wants to earn a profit of 33 1/3 %
on its revenue.
{CMA inter J15, 12 marks}
Answer:
Statement of total running kms per month:
Particulars k.m. per trip Trips per day Days per month k.m. per month
Delhi to Jaipur 270 2 10 5,400
Delhi to Agra 180 2 10 3,600
Local City 65 - 4 260
Total running Kms. For the month 9,260
Statement of total seating capacity per month
Particulars No. of seats No. of trips No. of days Total seating capacity
Delhi to Jaipur 50 2 10 1,000
Delhi to Agra 50 2 10 1,000
Local City 50 - 4 200
Statement of Passenger Km. per month:
Particulars Delhi to Local city
Jaipur Agra
(a) Total seating capacity 1,000 1,000 200
(b) Capacity utilization 90% 80% 100%
(c) Seats occupied 900 800 200
(d) Kms. Per trip 270 180 65
Passenger KM per month = 4,00,000 2,43,000 1,44,000 13,000
Total Passenger KM per month = 4,00,000
Statement of operating cost of Buses run between different cities:
Particulars Per month (₹)
Fixed Cost:
Driver’s salary 9,000
Conductor’s salary 8,000
Part time Accountant’s Salary 4,500
Depreciation [15,00,000 ×15
100×
1
12] 18,750

Service Costing / Operating Costing 67
Insurance (10,800/3) 3,600
Token tax (8,100/3) 2,700
Repair & Maintenance 8,000
Permit fee (13,050 /3) 4,350
Total Fixed Cost 58,900
Variable Cost:
Diesel [9260
5× 49] 90,748
Lubrication oil [9260
100× 300] 27,780
Total Variable Cost 1,18,528
Total Cost (Fixed Cost + Variable Cost) 41
2
3
1,77,428
Passenger tax 25 1,06,457
Total 2,83,885
Profit (Note) 331
3 1,41,942
Total takings 100 4,25,827
Rate per Passenger k.m. = 𝟒,𝟐𝟓,𝟖𝟐𝟕
𝟒,𝟎𝟎,𝟎𝟎𝟎 ₹𝟏. 𝟎𝟔𝟓
Fare to be charged per passenger:
Delhi to Jaipur 270 x 1.065 287.55
Delhi to Agra 180 x 1.065 191.70
Local City 65 x 1.065 69.225
Question 4: Global Transport Ltd. charges ₹90 per ton for its 6 tons truck lorry load from city 'A' to city
'B'. The charges for the return journey are ₹84 per ton. No concession or reduction in these rates is made
for any delivery of goods at intermediate station 'C'.
In January 2020 the truck made 12 outward journeys for city 'B' with full load out of which 2 tons were
unloaded twice in the way of city 'C'. The truck carried a load of 8 tons in its return journey for 5 times
but once caught by police and ₹1,200 was paid as fine. For the remaining trips the truck carried full
load out of which all the goods on load were unloaded once at city 'C'.
The distance from city 'A' to city 'C' and city 'B' are 140 kms and 300 kms respectively. Annual fixed
costs and maintenance charges are ₹60,000 and ₹12,000 respectively. Running charges were spent
during January, 2020 are ₹2,944.
You are required to find out the cost per absolute ton-kilometre and the profit for January, 2020
{CA inter M97, 12 marks}
Answer: Operating Cost and Profit Statement M/s Global Transport Ltd. (during January, 2020)
Particulars ₹
Fixed Costs 5,000 (₹60,000/ 12)
Maintenance charges 1,000 (₹12,000/12)

Cost Accounting 68
Running charges 2,944
Total operating cost 8,944
Cost per absolute ton-km WN3 0.20 (8,944/44,720 absol. ton. kms)
Net revenue received WN4 12,168
(-) Total operating cost 8,944
Profit 3,224
1 Working Notes
1. Outward journeys:
1 From city A to city B 10 journeys × 300 kms × 6 tons 18,000-ton kms
2 From city A to city C 2 journeys × 140 kms × 6 tons 1,680-ton kms
3 From city C to city B 2 journeys × 160 kms × 4 tons 1,280-ton kms
Total 20,960-ton kms
2 Return journeys:
1 From city B to city A 5 journeys × 300 kms × 8 tons. 12,000-ton kms
2 From city C to city A 6 journeys × 300 kms × 6 tons 10,800-ton kms
3 From city B to city C 1 journey × 160 kms. × 6 tons 960-ton kms
Total 23,760-ton kms
(3) Total absolute ton kms for a round journeys: WN 1&2 = 20,960-ton kms + 23,760-ton km = 44,720-
ton kms.
4 Net revenue received during January, 2020:
12 trucks × 6 tons × ₹90 6,480 (from city A to city B)
5 trucks × 8 tons × ₹84 3,360 (from city B to city A)
6 trucks × 6 tons × ₹84 3,024 (from city B to city A)
1 truck × 6 tons × ₹84 504 (from city B to city C)
Total revenue 13,368
(-) Fine paid 1,200
Net revenue received 12,168
Question 5: A transport company has a fleet of three trucks of 10 tonnes capacity each plying in
different directions for transport of customer's goods. The trucks run loaded with goods and return
empty. The distance travelled, number of trips made and the load carried per day by each truck are as
under

Service Costing / Operating Costing 69
Truck
No.
One way
Distance Km
Number of trips
per day
Load carried
per trip / day [tons]
1 16 4 6
2 40 2 9
3 30 3 8
The analysis of maintenance cost and the total distance travelled during the last two years is as under
Year Total distance
travelled
Maintenance Cost
₹
1 1,60,200 46,050
2 1,56,700 45,175
The following are the details of expenses for the year under review
Diesel ₹10 per liter. each liter gives 4 km per liter of diesel on an average.
Driver's salary ₹2,000 per month
Licence and taxes ₹5,000 per annum per truck
Insurance ₹5,000 per annum for all the three vehicles.
Purchase Price per truck ₹300,000 Life 10 years. Scrap value at the end of life is ₹10,000.
Oil and sundries ₹25 per 100 km run.
General Overhead ₹11,084 per annum
The vehicles operate 24 days per month on an average.
Required:
1. Prepare an Annual Cost Statement covering the fleet of three vehicles. ,
2. Calculate the cost per km. run and
3. Determine the freight rate per ton km. to yield a profit of 10% on freight
{CA inter N01, 10 marks}
Answer:
1 Annual Cost Statement of three vehicles ₹
Diesel (1,34,784 kms / 4 km) × ₹10) WN1 3,36,960
Oil & sundries (1,34,784 kms / 100 kms) × ₹25 33,696
Maintenance {(1,34,784 kms × 0.25P) + ₹6,000} WN2 39,696
Drivers' salary (₹2,000 × 12 months) × 3 trucks 72,000
Licence and taxes 15,000
Insurance 5,000
Depreciation (₹2,90,000 / 10 years) × 3 trucks 87,000
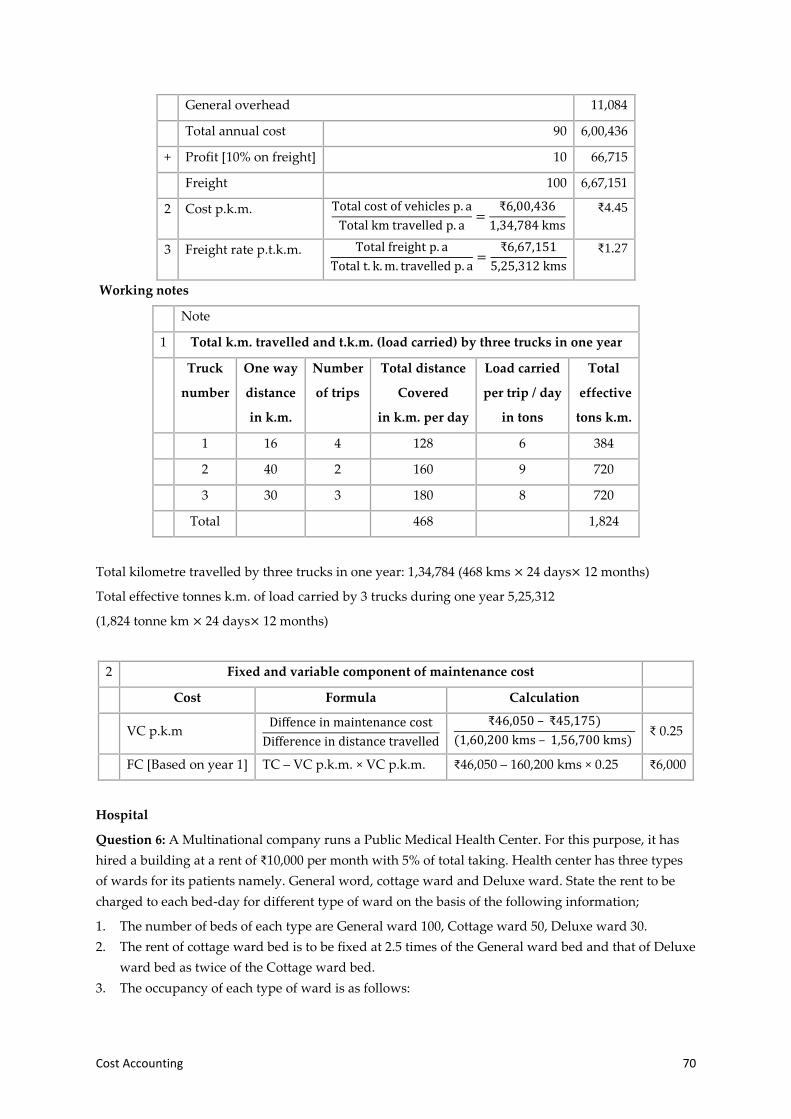
Cost Accounting 70
General overhead 11,084
Total annual cost 90 6,00,436
+ Profit [10% on freight] 10 66,715
Freight 100 6,67,151
2 Cost p.k.m. Total cost of vehicles p. a
Total km travelled p. a=
₹6,00,436
1,34,784 kms
₹4.45
3 Freight rate p.t.k.m. Total freight p. a
Total t. k. m. travelled p. a=
₹6,67,151
5,25,312 kms
₹1.27
Working notes
Note
1 Total k.m. travelled and t.k.m. (load carried) by three trucks in one year
Truck
number
One way
distance
in k.m.
Number
of trips
Total distance
Covered
in k.m. per day
Load carried
per trip / day
in tons
Total
effective
tons k.m.
1 16 4 128 6 384
2 40 2 160 9 720
3 30 3 180 8 720
Total 468 1,824
Total kilometre travelled by three trucks in one year: 1,34,784 (468 kms × 24 days× 12 months)
Total effective tonnes k.m. of load carried by 3 trucks during one year 5,25,312
(1,824 tonne km × 24 days× 12 months)
2 Fixed and variable component of maintenance cost
Cost Formula Calculation
VC p.k.m Diffence in maintenance cost
Difference in distance travelled
₹46,050 – ₹45,175)
(1,60,200 kms – 1,56,700 kms) ₹ 0.25
FC [Based on year 1] TC – VC p.k.m. × VC p.k.m. ₹46,050 – 160,200 kms × 0.25 ₹6,000
Hospital
Question 6: A Multinational company runs a Public Medical Health Center. For this purpose, it has
hired a building at a rent of ₹10,000 per month with 5% of total taking. Health center has three types
of wards for its patients namely. General word, cottage ward and Deluxe ward. State the rent to be
charged to each bed-day for different type of ward on the basis of the following information;
1. The number of beds of each type are General ward 100, Cottage ward 50, Deluxe ward 30.
2. The rent of cottage ward bed is to be fixed at 2.5 times of the General ward bed and that of Deluxe
ward bed as twice of the Cottage ward bed.
3. The occupancy of each type of ward is as follows:

Service Costing / Operating Costing 71
General ward 100%, cottage ward 80% and Deluxe ward 60%. But, in general ward there were
occasions when beds are full, extra beds were hired at a charge of ₹20 per bed. The total hire
charges for the extra beds incurred for the whole year amount to ₹12,000.
4. The Health Center engaged a heart specialist from outside and on an average fee paid to him was
₹15,000 per trip. He makes three trips in the whole year.
5. The other expenses for the year were as under
Particulars ₹
Salary of supervisors, Nurses, ward boys 4,25,000
Repairs and Maintenance 90,000
Salary of doctors 13,50,000
Food supplied to patients 40,000
Laundry charges for their bed linens 80,500
Medicines supplied 74,000
6. Cost of oxygen, X-ray etc., other than directly borne for treatment of patients 49,500
7. General administration charges 63,000
Provide profit @ 20% on total taking.
The Health Center imposes 8% GST on rent received 360 days may be taken in a year.
{CA final N06, 12 marks}
Answer:
Statement of Total Cost
Total Cost ₹ ₹
Salary of Supervisor, Nurses, Ward boys 4,25,000
Repairs and maintenance 90,000
Salary of doctors 13,50,000
Food supplied to patients 40,000
Laundry charges for their bed linens 80,500
Medicines supplied 74,000
Cost of oxygen, X ray etc., other than directly
Borne for treatment of patients 49,500
General administration charges 63,000 21,72,000
Building rent (10×12,000) 1,20,000
Hire charges extra beds 12,000
Fees to heart specialists (3×15,000) 45,000
Total Cost 75 23,49,000
Additional building rent on takings 5 1,56,600
Profit 20 6,26,400

Cost Accounting 72
Total Takings 100 31,32,000
General ward bed days 1,05,000
Room rent per bed day 29.83
Number of beds with Equivalent Rent
Nature of wards Occupancy Weight of rent Ward days
General ward 100×360×10 36,000×1 36,000
Additional General ward 12,000
20
600×1 600
Cottage ward 50×360×80% 14,400×2.5 36,000
Deluxe ward 50×360×60% 6,480×5 32,400
Total 1,05,000
Rent to be charged
Particulars Basic Service Tax Total
General ward 29.83 2.39 32.22
Cottage ward 74.58 5.97 80.55
Deluxe ward 149.15 11.93 161.08
Hotel
Question 7: Following are the particulars given by the owner of a hotel. You, as a Cost & Management
Accountant, are requested to advise him that what rent should he charge from his customers per day
so that he is able to earn 25% on cost other than interest;
1. Staff salaries ₹80,000 per annum.
2. Room attendants’ salary ₹2 per day. The salary is paid on daily basis and services of room attendant
are needed only when the room is occupied. There is one room attendant for one room.
3. Lighting, heating and power. The normal lighting expenses for a room if it is occupied for the whole
month is ₹50. Power is used only in winter and normal charge p.m. if occupied for a room is ₹20.
4. Repairs to Building ₹10,000 per annum.
5. Linen, etc. ₹4,800 per annum.
6. Sundries ₹6,600 per annum.
7. Interior decoration, etc. ₹10,000 per annum.
8. Cost of Building at ₹4,00,000 and its depreciation rate is 5%.
9. Other equipment at ₹1,00,000 and its depreciation rate is 10%.
10. Interest @ 5% may be charged on its investment in the buildings and equipment.
11. There are 100 rooms in the Hotel and 80% of the rooms are normally occupied in summer and 30%
rooms are busy in winter.
You may assume that period of summer and winter is six months each. Normal days in a month may
be assumed to be 30.
{CMA inter D11, 10 marks}

Service Costing / Operating Costing 73
Answer:
Statement of rent per room per day
Particulars ₹ ₹
Staff salary 80,000
Salary of room attendants
Summer 100 × 80% × 2 × 30 × 6 28,800
Winter 100 × 30% × 2 × 30 × 6 10,800
Heating & Lighting
Summer 100 × 80% × 50 × 6 24,000
Winter 100 × 30% × 50 × 6 9,000
Power 100 × 30% × 20 × 6 3,600
Repairs to building 10,000
Linen 4,800
Sundries 6,600
Interior decoration 10,000
Depreciation
Buildings 4,000 × 5% 20,000
Other equipment’s 1,00,000 × 10% 10,000
Total Cost per annum 2,17,600
(+) (+) Profit @ 25% on cost before interest 54,400
Interest on investment 5,00,000 × 5% 25,000
Total Revenue required per annum 2,97,000
Total room days per annum
Summer: 100 × 80% × 30 × 6 = 14,400 𝑑𝑎𝑦𝑠
Winter: 100 × 30% × 30 × 6 = 5,400 𝑑𝑎𝑦𝑠 19,800 days
Room rent per day 𝟐, 𝟗𝟕, 𝟎𝟎𝟎
𝟏𝟗, 𝟖𝟎𝟎
15 per day

Cost Accounting 74
3 COST ACCOUNTING TECHNIQUE
3.1 MARGINAL COSTING
Marginal Cost: Variable cost [additional cost for one unit of product or service]
Marginal costing: Application of marginal cost principle.
whereby variable cost = product cost and fixed cost = period cost
Absorption Costing: A method of costing by which all direct cost and applicable overheads are charged
to products or cost centres for finding out the total cost of production. Absorbed cost includes
production cost as well as administrative and other cost.
Comparison between absorption costing and marginal costing
Question 1: The following data relates to XYZ Ltd. which makes and sells computers
Production 1,00,000 units
Sales 80,000 units
Selling price per unit 15
Direct material 2,50,000
Direct labour 3,00,000
Factory overhead: Variable 1,00,000
Factory overhead: Fixed 2,50,000
Selling and distribution overhead: Variable 1,00,000
Selling and distribution overhead: Fixed 2,00,000
You are required to present income statements using (a) absorption costing & (b) Marginal Costing.
Account briefly for the difference in net profit between the two income statements.
(a) INCOME STATEMENT (Absorption costing)
Sales (80000×15) 1,200,000
Less: Cost of goods manufacture
Direct material 250,000
Direct labour 300,000
Factory overheads: Variable 100,000
Factory overheads: Fixed 250,000
Total 900,000
Less: Closing Stock [20
100× 900,000] 180,000 720,000
Gross Profit 480,000

Marginal Costing 75
Less: Selling & Distribution Expenses: Fixed 200,000
Selling & Distribution Expenses: Variable 100,000 300,000
Net Profit 180,000
(b) INCOME STATEMENT (Marginal costing)
Sales (80,000×15) 12,00,000
Less: cost of goods manufacture
Direct Material 2,50,000
Direct Labour 3,00,000
Factory overheads: variable 1,00,000
Total 6,50,000
Less: Closing Stock [20
100× 650,000] 1,30,000
Total 5,20,000
Selling & Distribution Expenses: variable 1,00,000 6,20,000
Contribution 5,80,000
Less: Factory overhead – fixed 2,50,000
Selling & distribution expenses – fixed 2,00,000 4,50,000
Net Profit 1,30,000
Break Even Point: Total revenue = Total cost
Cash Breakeven Point: Total revenue = Total cash cost
Cost Break Even Point (Cost indifference point): Equal cost in two alternatives
Margin of Safety: Total Sales – BEP sales
Basic Formulas
1 𝑃/(𝐿) = 𝑆 − 𝑉 − 𝐹
2 𝐶𝑜𝑛𝑡𝑟𝑖𝑏𝑢𝑡𝑖𝑜𝑛 = 𝑆 − 𝑉
3 𝑃𝑉𝑅 =
𝐶
𝑆% 𝑜𝑟
∆𝑃
∆𝑆%
4 𝐵𝐸𝑃 =
𝐹
𝑃𝑉𝑅
5 𝑀𝑂𝑆 =
𝑃
𝑃𝑉𝑅
6 𝑇𝑆 = 𝐵𝐸𝑃 + 𝑀𝑂𝑆
7 𝐷𝑃 =
𝐹 + 𝑃
𝑃𝑉𝑅

Cost Accounting 76
PRACTICAL PROBLEMS
Question 1: Sales ₹2,00,000; VC ₹1,20,000; FC ₹50,000 & NP ₹30,000
Calculate the P/V ratio, BEP and MOS.
Particulars % or p.u. Total BEP MOS
Sales
Variable Cost
Contribution
Fixed Cost
Profit/Loss
Question 2: Sales ₹240,000; VC ₹60 p.u.; Profit 25% and Sales price ₹120 p.u. Find out the fixed cost
Particulars % or p.u. Total BEP MOS
Sales
Variable Cost
Contribution
Fixed Cost
Profit/Loss
Question 3: Find out the margin of safety: Sales ₹500 lacs; Profit ₹150 lacs; VC 60%.
Particulars % or p.u. Total BEP MOS
Sales
Variable Cost
Contribution
Fixed Cost
Profit/Loss
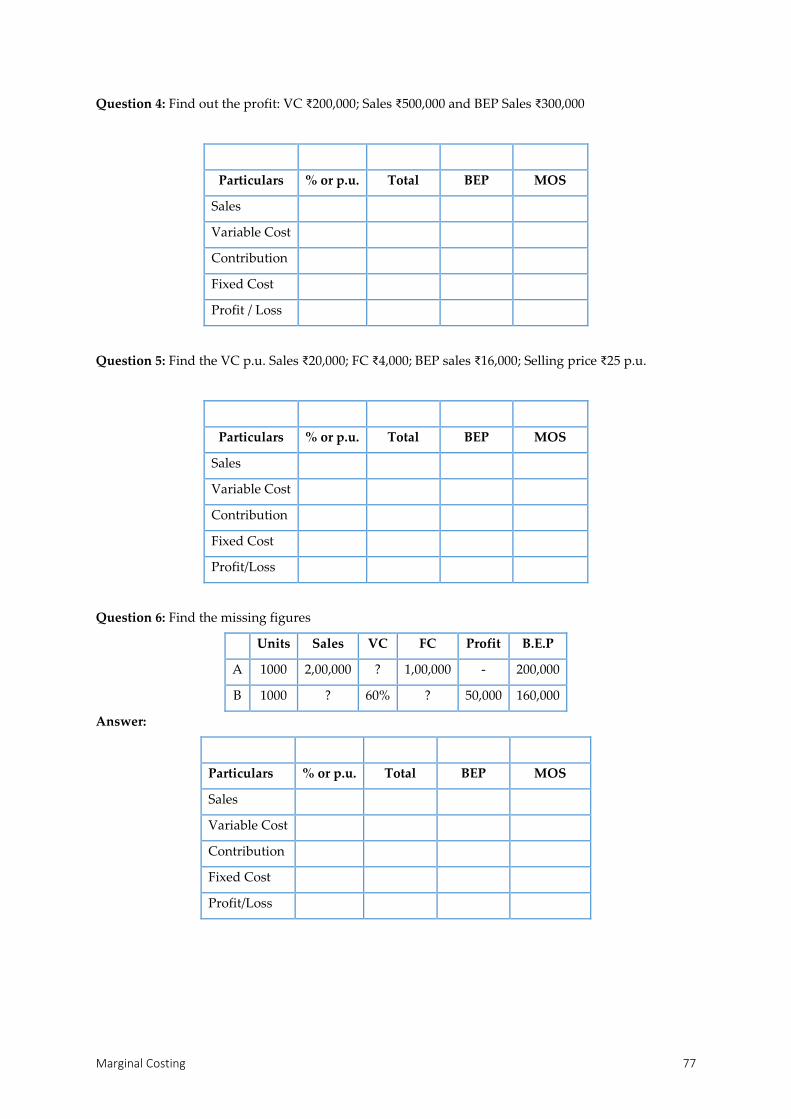
Marginal Costing 77
Question 4: Find out the profit: VC ₹200,000; Sales ₹500,000 and BEP Sales ₹300,000
Particulars % or p.u. Total BEP MOS
Sales
Variable Cost
Contribution
Fixed Cost
Profit / Loss
Question 5: Find the VC p.u. Sales ₹20,000; FC ₹4,000; BEP sales ₹16,000; Selling price ₹25 p.u.
Particulars % or p.u. Total BEP MOS
Sales
Variable Cost
Contribution
Fixed Cost
Profit/Loss
Question 6: Find the missing figures
Units Sales VC FC Profit B.E.P
A 1000 2,00,000 ? 1,00,000 - 200,000
B 1000 ? 60% ? 50,000 160,000
Answer:
Particulars % or p.u. Total BEP MOS
Sales
Variable Cost
Contribution
Fixed Cost
Profit/Loss

Cost Accounting 78
Particulars % or p.u. Total BEP MOS
Sales
Variable Cost
Contribution
Fixed Cost
Profit/Loss
Question 7: Fixed expenses ₹4,000 and Break Even point ₹10,000. Calculate:
P/V ratio | Profit when sales are ₹20,000 | Sales to earn a profit of ₹20,000
Answer:
Particulars % or p.u. BEP
Sales 20,000
Variable Cost
Contribution
Fixed Cost
Profit/Loss 20,000
Question 8: Selling price per unit is ₹150; Variable cost per unit is ₹90 and Fixed cost is ₹600,000
(a) What will be the selling price per unit if the breakeven point is 8000 units and
(b) Compute the sale required to earn a profit of ₹220,000.
Answer:
8,000
Particulars % or p.u. Total BEP
Sales
Variable Cost
Contribution
Fixed Cost
Profit/Loss 2,20,000
Question 9: Sales is ₹200,000. VC is ₹150,000. FC is 30,000
You are required to calculate Present P/V Ratio, BEP and MOS

Marginal Costing 79
Particulars % or p.u. Total BEP MOS
Sales
Variable Cost
Contribution
Fixed Cost
Profit/Loss
Revised P/V Ratio, BEP and MOS in each of the following cases:
(i) 25% increase in selling price
Particulars % or p.u. Total BEP MOS
Sales
Variable Cost
Contribution
Fixed Cost
Profit / Loss
(ii) 10% decrease in selling price
Particulars % or p.u. Total BEP MOS
Sales
Variable Cost
Contribution
Fixed Cost
Profit / Loss
(iii) 20% increase in fixed cost
Particulars % or p.u. Total BEP MOS
Sales
Variable Cost
Contribution
Fixed Cost
Profit / Loss

Cost Accounting 80
(iv) 10% decrease in fixed cost
Particulars % or p.u. Total BEP MOS
Sales
Variable Cost
Contribution
Fixed Cost
Profit / Loss
(v) 10% increase in variable cost
Particulars % or p.u. Total BEP MOS
Sales
Variable Cost
Contribution
Fixed Cost
Profit / Loss
(vi) 10% decrease in variable cost
Particulars % or p.u. Total BEP MOS
Sales
Variable Cost
Contribution
Fixed Cost
Profit / Loss
(vii) 10% increase in selling price accompanied by 10% decrease in variable cost
Particulars % or p.u. Total BEP MOS
Sales
Variable Cost
Contribution
Fixed Cost
Profit / Loss

Marginal Costing 81
(viii) 10% decrease in selling price accompanied by 10% increase in variable cost
Particulars % or p.u. Total BEP MOS
Sales
Variable Cost
Contribution
Fixed Cost
Profit / Loss
(ix) 10% increase in sales volume
Particulars % or p.u. Total BEP MOS
Sales
Variable Cost
Contribution
Fixed Cost
Profit / Loss
(x) 10% decrease in sales volume
Particulars % or p.u. Total BEP MOS
Sales
Variable Cost
Contribution
Fixed Cost
Profit / Loss
10. Question:
Particulars
1 Selling Price p.u. ₹100
2 Variable Cost p.u. ₹60
3 Total Fixed Cost ₹10000
4 Units sold 400

Cost Accounting 82
From the above data, calculate the following
1 Contribution (C) 15 Calculate PVR, BEP & MOS and
impact on these in the following cases 2 Profit or Loss
3 Profit Volume Ratio (PVR) (i) If variable cost increases by 10%
4 Break-even point (BEP) in units (ii) If variable cost decreases by 10%
5 Break-even point in rupees (iii) If fixed cost increases by 10%
6 Break-even point in percent (iv) If fixed cost decreases by 10%
7 Margin of safety (MOS) in units (v) If variable cost increases by 10%
and fixed cost decreases by 10% 8 Margin of safety in rupees
9 Margin of safety in percent (vi) Sales price increases by 10%
10 Sales required to earn a profit of ₹10,000 (vii) Sales price decreases by 10%
11 Sales required to earn a profit of 10% on sales (viii) Sales volume increases by 10%
12 Sales required to earn a profit of 10% on cost (ix) Sales volume decreases by 10%
13 Profit if sales is ₹30,000 (x) Sales price increases by 10%,
variable cost increases by 10%
and fixed cost increases by ₹2,000
14 Revised sales price required to get
(i) BEP in 200 units
(ii) BEP in 400 units (xi) Sales price increases by 10%,
variable cost decreases by 5%
and fixed cost increases by ₹5,000
Answer:
Particulars Formula -----------Calculation----------- Answer
1 Contribution (C) p.u. and total 𝑆 − 𝑉
2 Profit or Loss 𝑆 − 𝑉 − 𝐹
3 Profit Volume Ratio (PVR) 𝐶
𝑆%
4 Break-even point (BEP) in units 𝐹
𝐶 𝑝. 𝑢.
5 Break-even point in rupees 𝐹
𝐶× 𝑆
6 Break-even point in percent 𝐵𝐸𝑃
𝑆%
7 Margin of safety (MOS) in units 𝑃
𝐶 𝑝. 𝑢.
8 Margin of safety in rupees 𝑃
𝐶× 𝑆
9 Margin of safety in percent 𝑀𝑂𝑆
𝑆%
10 Sales required to earn
a profit of ₹10,000
𝐹 + 𝐹𝐷𝑃
𝐶 𝑝. 𝑢.

Marginal Costing 83
11 Sales required to earn
a profit of 10% on sales
𝐹
(𝐶 − 𝑉𝐷𝑃)𝑝. 𝑢.
12 Sales required to earn
a profit of 10% on cost
𝐹 + 𝐹𝐷𝑃
(𝐶 − 𝑉𝐷𝑃)𝑝. 𝑢.
13 Profit if sales is ₹30,000 𝑆 × 𝑃𝑉𝑅 − 𝐹
14 Revised sales price required to get
(i) BEP in 200 units 𝐹
𝑆𝑎𝑙𝑒 𝑢𝑛𝑖𝑡𝑠+ 𝑉
(ii) BEP in 400 units
15 Calculate PVR, BEP & MOS
and impact on these
𝑃𝑉𝑅 =𝐶
𝑆% 𝐵𝐸𝑃 =
𝐶
𝑆% 𝑀𝑂𝑆 =
𝐶
𝑆%
(i) If variable cost increases by 10%
Impact =
𝑁 − 𝑂
𝑂%
(ii) If variable cost decreases by 10%
Impact =
𝑁 − 𝑂
𝑂%
(iii) If fixed cost increases by 10%
Impact =
𝑁 − 𝑂
𝑂%
(iv) If fixed cost decreases by 10%
Impact =
𝑁 − 𝑂
𝑂%
(v) If variable cost increases by 10%
and fixed cost decreases by 10%
Impact =
𝑁 − 𝑂
𝑂%
(vi) Sales price increases by 10%
Impact =
𝑁 − 𝑂
𝑂%
(vii) Sales price decreases by 10%
Impact =
𝑁 − 𝑂
𝑂%
(viii) Sales volume increases by 10%
Impact =
𝑁 − 𝑂
𝑂%
(ix) Sales volume decreases by 10%
Impact =
𝑁 − 𝑂
𝑂%
(x) Sales price increases by 10%,
variable cost increases by 10%

Cost Accounting 84
and fixed cost increases by ₹2,000
Impact =
𝑁 − 𝑂
𝑂%
(xi) Sales price increases by 10%,
variable cost decreases by 5%
and fixed cost increases by ₹5,000
Impact =
𝑁 − 𝑂
𝑂%
Question 11: The sales turnover and profit during two periods were as follows:
Sales Profit
Period I 20 lakhs 2 lakhs
Period II 30 lakhs 4 lakhs
Calculate: PVR, the sales required to earn a profit of ₹5 lakh and the profit when sales are ₹10 lakh.
Answer:
Particulars Formula Calculate Answer
(a) Profit volume ratio 𝐶ℎ𝑎𝑛𝑔𝑒 𝑖𝑛 𝑃𝑟𝑜𝑓𝑖𝑡𝑠
𝐶ℎ𝑎𝑛𝑔𝑒 𝑖𝑛 𝑆𝑎𝑙𝑒𝑠%
4,00,000 − 2,00,000
30,00,000 − 20,00,000% 20%
(b) Fixed cost Sales × PVR – Profit 30,00,000×20%– 4,00,000 ₹2,00,000
(c) Sales to earn ₹5 lacs 𝐹𝑖𝑥𝑒𝑑 𝑐𝑜𝑠𝑡 + 𝐷𝑒𝑠𝑖𝑟𝑒𝑑 𝑃𝑟𝑜𝑓𝑖𝑡
𝑃𝑉𝑅
2,00,000 + 5,00,000
20% ₹35,00,000
(d) Profit if sales is ₹10
lacs Sales × PVR – Fixed Cost
10,00,000
× 20% – 2,00,000 0
Question 12: A company sells its products at ₹15 per unit. In a period if it produces and sells 8,000
units, it incurs a loss of ₹5 per unit. If the volume is raised to 20,000 units, it earns a profit of ₹4 per unit.
Calculate breakeven point in terms of rupees as well as in units.
Answer:
Particulars Formula Calculate Answer
(a) PVR 𝐶ℎ𝑎𝑛𝑔𝑒 𝑖𝑛 𝑃𝑟𝑜𝑓𝑖𝑡𝑠
𝐶ℎ𝑎𝑛𝑔𝑒 𝑖𝑛 𝑆𝑎𝑙𝑒𝑠%
20,000 × 4 + 8,000 × 5
15(20,000 − 8,000)% 66
2
3%
(b) Fixed cost 𝑆𝑎𝑙𝑒𝑠 × 𝑃𝑉𝑅– 𝑃𝑟𝑜𝑓𝑖𝑡 15 × 20,000 × 662
3%– 20,000 × 4 ₹120,000
(c) BEP in ₹ 𝐹𝑖𝑥𝑒𝑑 𝑐𝑜𝑠𝑡
𝑃𝑉𝑅
120,000
662
3%
₹180,000
(d) BEP in units 𝐵𝐸𝑃 𝑖𝑛 ₹
𝑆𝑎𝑙𝑒 𝑝𝑟𝑖𝑐𝑒 𝑝𝑒𝑟 𝑢𝑛𝑖𝑡
180,000
15 12,000 u

Marginal Costing 85
Question 13: From the details given below
Sales Total cost
First 6 months 10 lakhs 8 lakhs
Second 6 months 15 lakhs 11 lakhs
Calculate: PVR, the sales required to earn a profit of ₹5 lakh and the profit when sales are ₹20 lakh.
Answer:
Particulars Formula Calculate Answer
(a) Profit volume ratio 𝐶ℎ𝑎𝑛𝑔𝑒 𝑖𝑛 𝑃𝑟𝑜𝑓𝑖𝑡𝑠
𝐶ℎ𝑎𝑛𝑔𝑒 𝑖𝑛 𝑆𝑎𝑙𝑒𝑠%
4,00,000 − 2,00,000
15,00,000 − 10,00,000% 40%
(b) Fixed cost for 6
months 𝑆𝑎𝑙𝑒𝑠 × 𝑃𝑉𝑅– 𝑃𝑟𝑜𝑓𝑖𝑡 10,00,000×40%– 2,00,000 ₹200,000
Fixed cost for full
year 2,00,000×2 ₹4,00,000
(c) Sales to earn ₹5 lacs 𝐹𝑖𝑥𝑒𝑑 𝑐𝑜𝑠𝑡 + 𝐷𝑒𝑠𝑖𝑟𝑒𝑑 𝑃𝑟𝑜𝑓𝑖𝑡
𝑃𝑉𝑅
400,000 + 500,000
40% ₹22,50,000
(d) Profit if sales is ₹20
lacs 𝑆𝑎𝑙𝑒𝑠 × 𝑃𝑉𝑅– 𝐹𝑖𝑥𝑒𝑑 𝐶𝑜𝑠𝑡
20,00,000 × 40% – 4,00
,000 4,00,000
Problem Type: Decision making & Profit Planning
1. Indifference Point
2. Sales Mix
3. Limiting Factor
4. Elimination of Product
5. Accepting Foreign Order
6. Shut down
7. Make or Buy
8. Plant Merger
Indifference Point
Question 1: Two businesses, Y Ltd. and Z Ltd., sell the same type of product in the same type of market.
Their budgeted profit and loss accounts for the coming year are as follows:
Y Ltd X Ltd
Sales per unit 150 150
Variable Cost per unit 120 100
Fixed Cost 15,000 35,000
You are required to calculate
1. the breakeven point of each business;
2. the sales volume at which each of business will earn ₹5,000 profit;
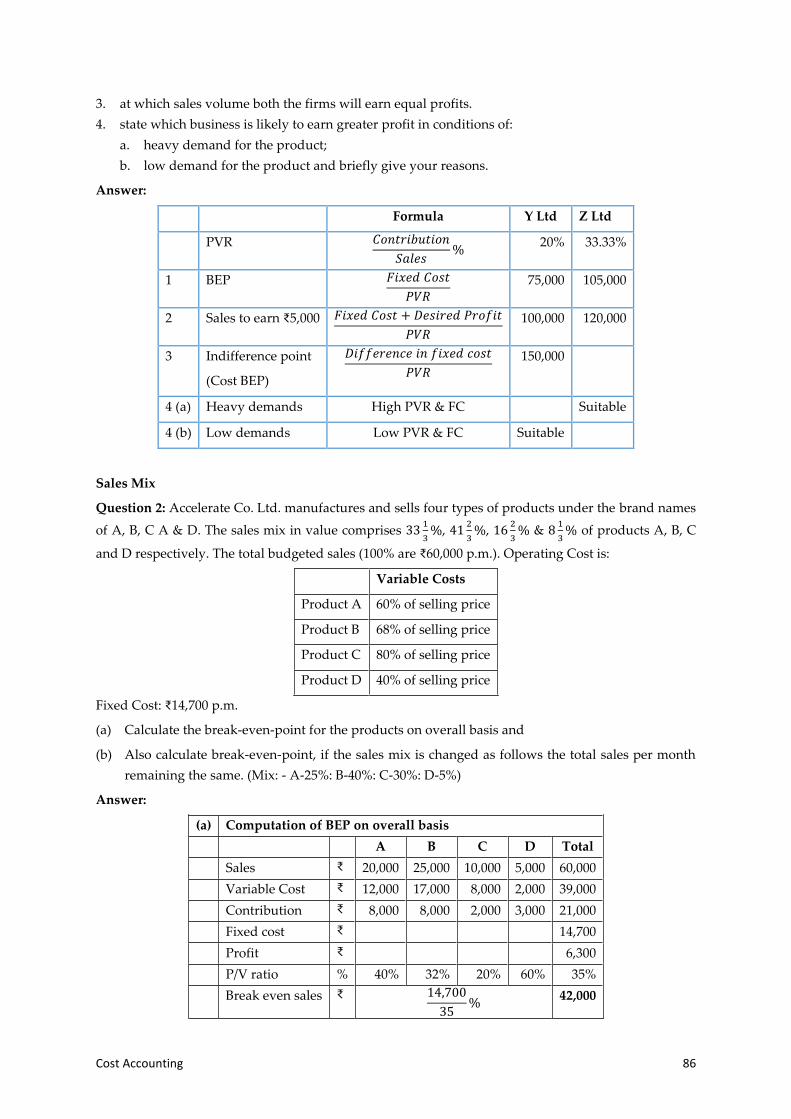
Cost Accounting 86
3. at which sales volume both the firms will earn equal profits.
4. state which business is likely to earn greater profit in conditions of:
a. heavy demand for the product;
b. low demand for the product and briefly give your reasons.
Answer:
Formula Y Ltd Z Ltd
PVR 𝐶𝑜𝑛𝑡𝑟𝑖𝑏𝑢𝑡𝑖𝑜𝑛
𝑆𝑎𝑙𝑒𝑠%
20% 33.33%
1 BEP 𝐹𝑖𝑥𝑒𝑑 𝐶𝑜𝑠𝑡
𝑃𝑉𝑅
75,000 105,000
2 Sales to earn ₹5,000 𝐹𝑖𝑥𝑒𝑑 𝐶𝑜𝑠𝑡 + 𝐷𝑒𝑠𝑖𝑟𝑒𝑑 𝑃𝑟𝑜𝑓𝑖𝑡
𝑃𝑉𝑅
100,000 120,000
3 Indifference point
(Cost BEP)
𝐷𝑖𝑓𝑓𝑒𝑟𝑒𝑛𝑐𝑒 𝑖𝑛 𝑓𝑖𝑥𝑒𝑑 𝑐𝑜𝑠𝑡
𝑃𝑉𝑅
150,000
4 (a) Heavy demands High PVR & FC Suitable
4 (b) Low demands Low PVR & FC Suitable
Sales Mix
Question 2: Accelerate Co. Ltd. manufactures and sells four types of products under the brand names
of A, B, C A & D. The sales mix in value comprises 331
3%, 41
2
3%, 16
2
3% & 8
1
3% of products A, B, C
and D respectively. The total budgeted sales (100% are ₹60,000 p.m.). Operating Cost is:
Variable Costs
Product A 60% of selling price
Product B 68% of selling price
Product C 80% of selling price
Product D 40% of selling price
Fixed Cost: ₹14,700 p.m.
(a) Calculate the break-even-point for the products on overall basis and
(b) Also calculate break-even-point, if the sales mix is changed as follows the total sales per month
remaining the same. (Mix: - A-25%: B-40%: C-30%: D-5%)
Answer:
(a) Computation of BEP on overall basis
A B C D Total
Sales ₹ 20,000 25,000 10,000 5,000 60,000
Variable Cost ₹ 12,000 17,000 8,000 2,000 39,000
Contribution ₹ 8,000 8,000 2,000 3,000 21,000
Fixed cost ₹ 14,700
Profit ₹ 6,300
P/V ratio % 40% 32% 20% 60% 35%
Break even sales ₹ 14,700
35%
42,000

Marginal Costing 87
(b) Computation of BEP if the sales mix is changed
A B C D Total
Sales ₹ 15,000 24,000 18,000 3,000 60,000
Variable Cost ₹ 9,000 16,320 14,400 1,200 40,920
Contribution ₹ 6,000 7,680 3,600 1,800 19,080
Fixed cost ₹ 14,700
P/V ratio % 40% 32% 20% 60% 31.8%
Break even Sales ₹ 14,700
31.8%
46,266
Limiting Factor
Question 3: The Following particulars are extracted from the records of a company.
Product A B
Sale Price (₹) 100 110
Consumption of Materials (kgs) 5 4
Material cost 24 14
Direct wages 2 3
Machine hours used 2 3
Variable overheads 4 6
Comment on the profitability of each product (both use the same raw material) when:
(i) Total sales potential in units is limited.
(ii) Total sales potential in value is limited.
(iii) Raw material is in short supply.
(iv) Production capacity (in terms of machine hour) is the limiting factor.
Answer:
Product A B
Sale Price 100 110
Less Variable Cost 30 23
Contribution 70 87
Profit volume ratio 70% 79%
Contribution per kg of material 14 21.75
Contribution per machine hour 35 29
Ranking based on key factor
(i) Sales in units is limited II I
(ii) Sales in ₹ is limited II I

Cost Accounting 88
(iii) Raw material is limited II I
(iv) Machine hour is limited I II
Limiting Factor and Optimum Product Mix
Question 4: ABC Ltd. is manufacturing three products X, Y and Z. All the products use the same raw
material which is scarce and available to the extent of 61,000 kg only. The following information is
available from records of the company:
Particulars Product X Product Y Product Z
Selling price per unit (₹) 100 140 90
Variable cost per unit (₹) 75 10 65
Raw material requirement per unit (kg) 5 8 6
Market demand (units) 5,000 3,000 4,000
Fixed costs are ₹1,50,000. Advise the company about the most profitable product mix. Compute the
amount of profit resulting from such product mix.
{CMA inter}
Answer:
Ranking X Y Z
Selling price 100 140 90
Less: Variable cost 75 110 65
Contribution per unit 25 30 25
Raw material required per unit 5 8 6
Contribution per unit of raw material 5 3.75 4.17
Ranking I III II
Working notes:
1 Optimum product mix as per ranking Balance
Available raw material 61,000 kg
Produce product X (being I rank) maximum 5,000×5 25,000 kg 36,000 kg
Produce product Z (being II rank) maximum 4,000×6 24,000 kg 12,000 kg
Produce product Y (being III rank) maximum 1,500×8 12,000 kg 0
2 Profit for the optimum product mix
Product X Y Z Total
Produced & Sale 5,000 1,500 4,000
Contribution per unit 25 30 25

Marginal Costing 89
Contribution 1,25,000 4,50,000 1,00,000
Total contribution 2,70,000
Less Fixed cost 1,50,000
Profit 1,20,000
Limiting Factor and Optimum Product Mix
Question 5: Z Ltd., makes a range of five products to which the following standards apply:
Per Unit
A B C D E
₹ ₹ ₹ ₹ ₹
Sales price 50 60 70 80 90
Direct Materials 9 10 17 12 21
Direct wages 16 20 24 28 32
Variable production overheads 8 10 12 14 16
Variable selling and distribution overheads 5 6 7 8 9
Fixed overheads 4 5 6 7 8
42 51 66 69 86
The direct labour wage rate is ₹4 per hour. Fixed overheads have been allocation the basis of direct
labour hours. The company has commitment to produce a minimum of 200 units of each product per
month with a maximum demand of 1,000 units of each product per month. Direct hours cannot exceed
13,000 per month.
Required: Give recommendations, supported by calculations, to show how direct labour hours in the
existing factory should be utilized in order to maximize profits.
Answer:
Ranking A B C D E
₹ ₹ ₹ ₹ ₹
1 Selling price 50.00 60.00 70.00 80.00 90.00
2 Variable Cost
(a) Direct material 9.00 10.00 17.00 12.00 21.00
(b) Labour cost 16.00 20.00 24.00 28.00 32.00
(c) Variable POH 8.00 10.00 12.00 14.00 16.00
(d) Variable S/D OH 5.00 6.00 7.00 8.00 9.00
38.00 46.00 60.00 62.00 78.00
3 Contribution (1-2) 12.00 14.00 10.00 18.00 12.00
Hours required {col. (b)/₹4} 4 5 6 7 8

Cost Accounting 90
Contribution per labour hour 3.00 2.80 1.67 2.57 1.50
Priority I II IV III V
1 Optimum product mix as per ranking Balance
Available raw material 13,000 hours
Produce the minimum requirement of ALL products 200×30 6,000 7,000 hours
Produce product A (being I rank) maximum 800×4 3,200 3,800 hours
Produce product B (being I rank) maximum 760×5 3,800 0 hours
2 Profit for the optimum product mix
Product A B C D E Total
Produced & Sale 1,000 960 200 200 200
Contribution per unit 12 14 10 18 12
Contribution 12,000 13,440 2,000 3,600 2,400
Total contribution 33,440
Less Fixed cost 13,000
Profit 20,440
Elimination of a product
Question 6: A company manufactures 3 products A, B and C. There are no common processes and the
sale of one product does not affect prices or volume of sales of any other. The Company's budgeted
profit / loss for 2020 has been abstracted thus:
Total A B C
Sales 300,000 45,000 225,000 30,000
Production Cost: Variable 180,000 24,000 144,000 12,000
Production Cost: Fixed 60,000 3,000 48,000 9,000
Factory Cost 240,000 27,000 192,000 21,000
Sales & Administration Cost: Variable 24,000 8,100 8,100 7,800
Sales & Administration Cost: Fixed 6,000 2,100 1,800 2,100
Total Cost 2,70,000 37,200 201,900 30,900
Profit 30,000 7,800 23,100 (900)
Answer:
Products Total
A B C
Sales 45,000 2,25,000 30,000 3,00,000
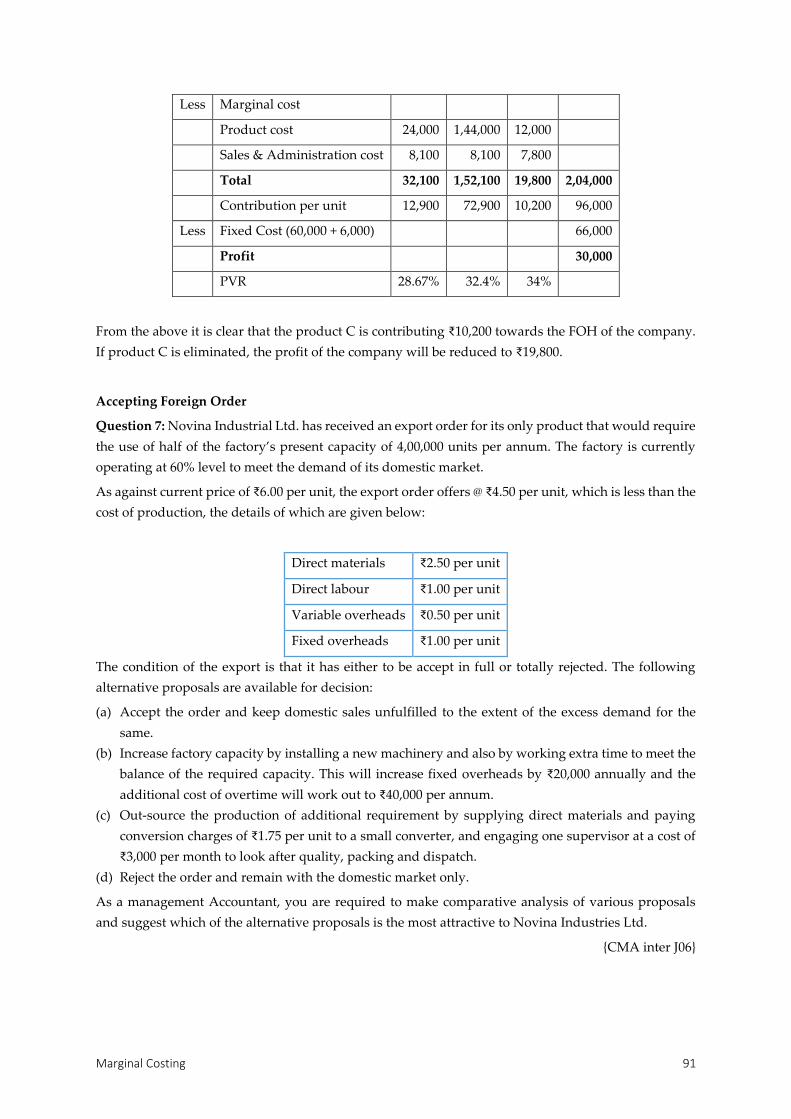
Marginal Costing 91
Less Marginal cost
Product cost 24,000 1,44,000 12,000
Sales & Administration cost 8,100 8,100 7,800
Total 32,100 1,52,100 19,800 2,04,000
Contribution per unit 12,900 72,900 10,200 96,000
Less Fixed Cost (60,000 + 6,000) 66,000
Profit 30,000
PVR 28.67% 32.4% 34%
From the above it is clear that the product C is contributing ₹10,200 towards the FOH of the company.
If product C is eliminated, the profit of the company will be reduced to ₹19,800.
Accepting Foreign Order
Question 7: Novina Industrial Ltd. has received an export order for its only product that would require
the use of half of the factory’s present capacity of 4,00,000 units per annum. The factory is currently
operating at 60% level to meet the demand of its domestic market.
As against current price of ₹6.00 per unit, the export order offers @ ₹4.50 per unit, which is less than the
cost of production, the details of which are given below:
Direct materials ₹2.50 per unit
Direct labour ₹1.00 per unit
Variable overheads ₹0.50 per unit
Fixed overheads ₹1.00 per unit
The condition of the export is that it has either to be accept in full or totally rejected. The following
alternative proposals are available for decision:
(a) Accept the order and keep domestic sales unfulfilled to the extent of the excess demand for the
same.
(b) Increase factory capacity by installing a new machinery and also by working extra time to meet the
balance of the required capacity. This will increase fixed overheads by ₹20,000 annually and the
additional cost of overtime will work out to ₹40,000 per annum.
(c) Out-source the production of additional requirement by supplying direct materials and paying
conversion charges of ₹1.75 per unit to a small converter, and engaging one supervisor at a cost of
₹3,000 per month to look after quality, packing and dispatch.
(d) Reject the order and remain with the domestic market only.
As a management Accountant, you are required to make comparative analysis of various proposals
and suggest which of the alternative proposals is the most attractive to Novina Industries Ltd.
{CMA inter J06}

Cost Accounting 92
Answer:
Options → (a) (b) (c) (d)
Domestic sales (u) 2,00,000 2,40,000 2,40,000 2,40,0000
Foreign Sales (u) 2,00,000 2,00,000 2,00,000 -
₹ / p.u.
Domestic sales 6.00 12,00,000 14,40,000 14,40,000 14,40,000
Foreign Sales 4.50 9,00,000 9,00,000 9,00,000
Total Sales 21,00,000 23,40,000 23,40,000 14,40,000
VC [DM+DL+VOH] ₹4.00 16,00,000 17,60,000 17,60,000 9,60,000
Additional VOH 40,000 10,0001
Contribution 5,00,000 5,40,000 5,70,000 4,80,000
Fixed OH2 2,40,000 2,40,000 2,40,000 2,40,000
Additional FOH 20,000 36,000 -
Profit 2,60,000 2,80,000 2,94,000 2,40,000
Option Select
Shut down
Question 8: Sale price – ₹100, VC p.u. – ₹60 and FC – ₹50,000. FC – ₹20,000 is to be incurred even if
closed. Find out sales at shut down
𝑨𝒏𝒔𝒘𝒆𝒓: 𝑆𝑎𝑙𝑒𝑠 𝑎𝑡 𝑠ℎ𝑢𝑡 𝑑𝑜𝑒𝑛 = (𝐹𝐶 − 𝑆ℎ𝑢𝑡 𝑑𝑜𝑤𝑛 𝑐𝑜𝑠𝑡) ×𝑆𝑎𝑙𝑒
𝐶= (50,000 − 20,000) ×
100
40= 75,000
Question 9: The company is presently passing through a period of very lean market demand and
operating at 50% capacity and have also selling its product at a discounted price generating a total sales
revenue of ₹60,000 at that level.
It is expected that the market scenario will improve in the next year and, on a conservative estimate,
the company is likely to operate at 70% capacity level with increased sales revenue of ₹1,20,000.
Note: VA, FC and total cost at 100% capacity are ₹1,01,000, 19,000 and 1,20,000 respectively.
As an option, the management is considering to close down the operation for one year and restart
operation after one year when the market conditions are likely to improve. If closed down for the year
it is estimated that
(a) The present fixed costs will reduce by 60%.
(b) There will be a cost of ₹10,000 towards closing down operations;
(c) To maintain a skeleton maintenance service for which ₹24,000 to be incurred;
(d) An initial cost of re-opening of ₹20,000 to be incurred.
You are required to work out the profitability under the two options and give your comment.
1 Incremental conversion cost × units sub contracted = (₹1.75 – ₹1.5)×40,000 2 ₹1 per unit for current level of operation (2,40,000×₹1)
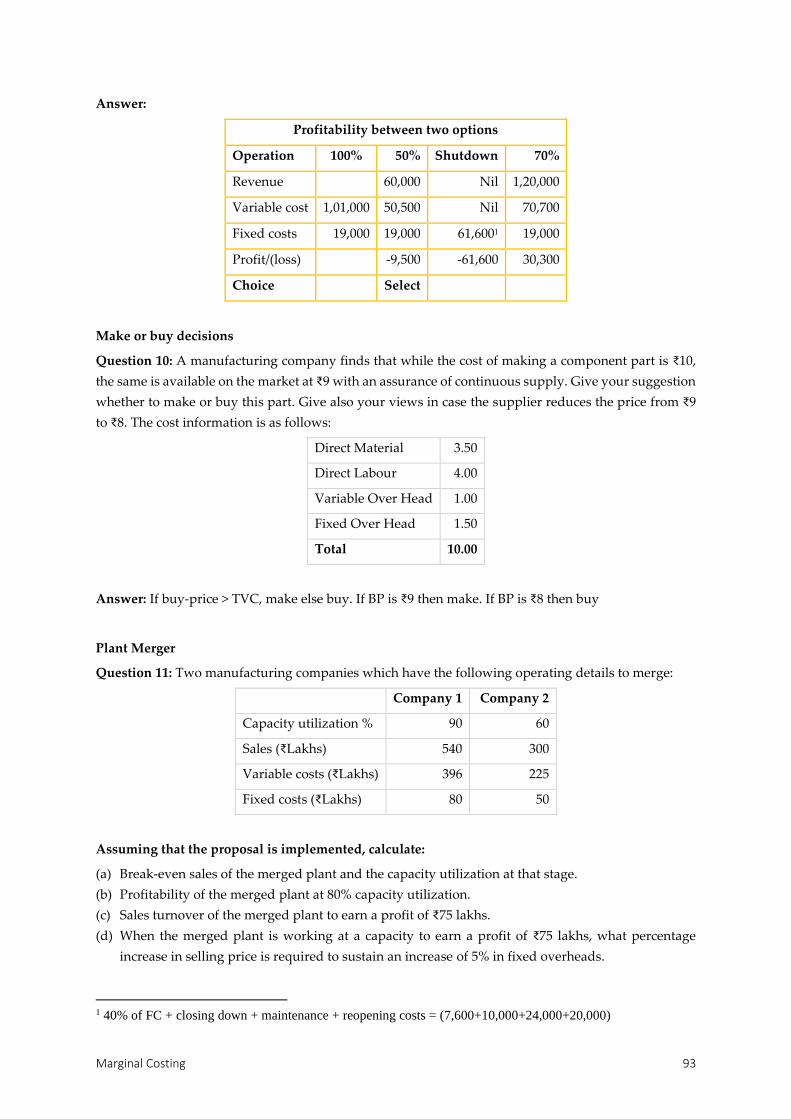
Marginal Costing 93
Answer:
Profitability between two options
Operation 100% 50% Shutdown 70%
Revenue 60,000 Nil 1,20,000
Variable cost 1,01,000 50,500 Nil 70,700
Fixed costs 19,000 19,000 61,6001 19,000
Profit/(loss) -9,500 -61,600 30,300
Choice Select
Make or buy decisions
Question 10: A manufacturing company finds that while the cost of making a component part is ₹10,
the same is available on the market at ₹9 with an assurance of continuous supply. Give your suggestion
whether to make or buy this part. Give also your views in case the supplier reduces the price from ₹9
to ₹8. The cost information is as follows:
Direct Material 3.50
Direct Labour 4.00
Variable Over Head 1.00
Fixed Over Head 1.50
Total 10.00
Answer: If buy-price > TVC, make else buy. If BP is ₹9 then make. If BP is ₹8 then buy
Plant Merger
Question 11: Two manufacturing companies which have the following operating details to merge:
Company 1 Company 2
Capacity utilization % 90 60
Sales (₹Lakhs) 540 300
Variable costs (₹Lakhs) 396 225
Fixed costs (₹Lakhs) 80 50
Assuming that the proposal is implemented, calculate:
(a) Break-even sales of the merged plant and the capacity utilization at that stage.
(b) Profitability of the merged plant at 80% capacity utilization.
(c) Sales turnover of the merged plant to earn a profit of ₹75 lakhs.
(d) When the merged plant is working at a capacity to earn a profit of ₹75 lakhs, what percentage
increase in selling price is required to sustain an increase of 5% in fixed overheads.
1 40% of FC + closing down + maintenance + reopening costs = (7,600+10,000+24,000+20,000)

Cost Accounting 94
Answer:
₹ in lacs
Company 1 Company 2 (a) Merged (b) (c) (d)
Capacity utilization 90% 100% 60% 100% 100% 80%
Sales [S] 540 600 300 500 1,100 880 7911 797.5
Less: Variable costs [V] 396 440 225 375 815 652 586 586.0
Contribution [C] 144 160 125 285 228 205 211.5
Less: Fixed cost [FC] 80 80 50 50 130 130 130 136.5
Profit [P] 64 80 75 155 98 75 75.0
P/V ratio [PVR] [𝐶
𝑆%] 25.91%
BEP [𝐹𝐶
𝑃𝑉𝑅] ₹501.74
Capacity at BEP [𝐵𝐸𝑃
𝑆%] 45.61%
Profitability [𝑃
𝑆%] 11.14%
Sales price increase in % 0.82%2
1 Sales to earn 75 lacs =
𝐷𝑒𝑠𝑖𝑟𝑒𝑑 𝑃𝑟𝑜𝑓𝑖𝑡
𝑃𝑉𝑅 =
75
25.91%
2 Sales price increase in % = 𝐼𝑛𝑐𝑟𝑒𝑎𝑠𝑒 𝑖𝑛 𝑠𝑎𝑙𝑒𝑠
𝑆𝑎𝑙𝑒𝑠 𝑡𝑜 𝑒𝑎𝑟𝑛 75 𝑙𝑎𝑐𝑠%
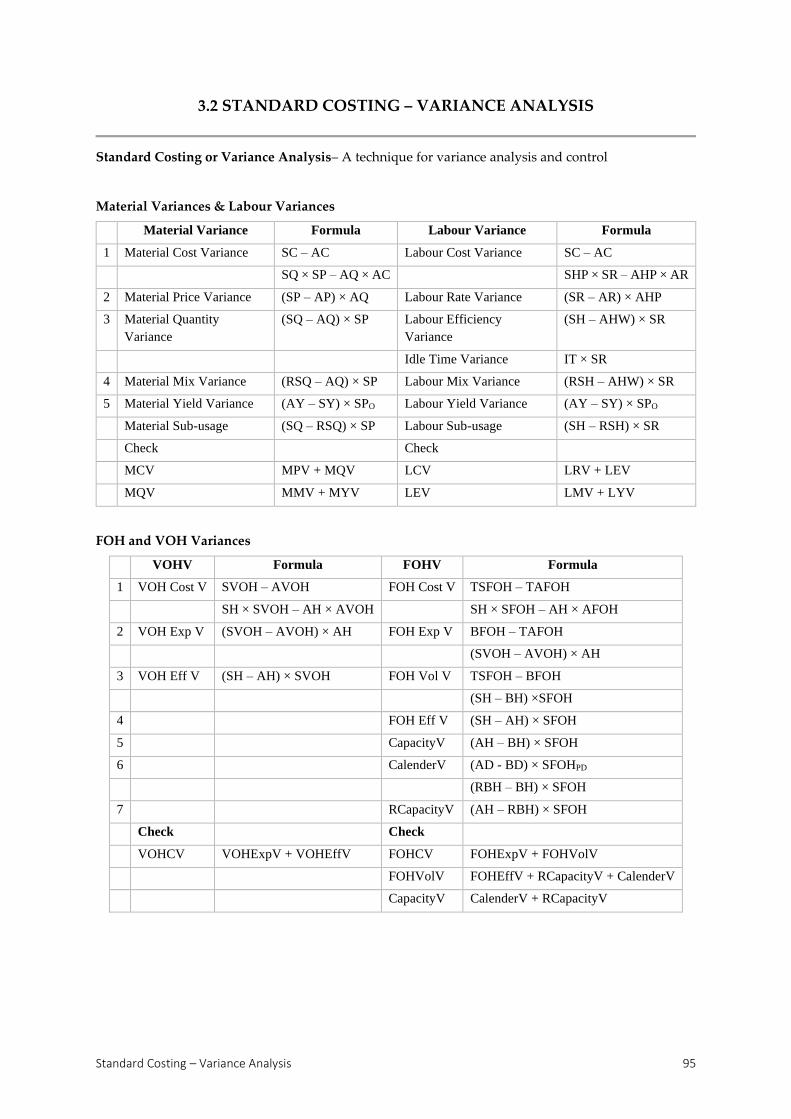
Standard Costing – Variance Analysis 95
3.2 STANDARD COSTING – VARIANCE ANALYSIS
Standard Costing or Variance Analysis– A technique for variance analysis and control
Material Variances & Labour Variances
Material Variance Formula Labour Variance Formula
1 Material Cost Variance SC – AC Labour Cost Variance SC – AC
SQ × SP – AQ × AC SHP × SR – AHP × AR
2 Material Price Variance (SP – AP) × AQ Labour Rate Variance (SR – AR) × AHP
3 Material Quantity
Variance
(SQ – AQ) × SP Labour Efficiency
Variance
(SH – AHW) × SR
Idle Time Variance IT × SR
4 Material Mix Variance (RSQ – AQ) × SP Labour Mix Variance (RSH – AHW) × SR
5 Material Yield Variance (AY – SY) × SPO Labour Yield Variance (AY – SY) × SPO
Material Sub-usage (SQ – RSQ) × SP Labour Sub-usage (SH – RSH) × SR
Check Check
MCV MPV + MQV LCV LRV + LEV
MQV MMV + MYV LEV LMV + LYV
FOH and VOH Variances
VOHV Formula FOHV Formula
1 VOH Cost V SVOH – AVOH FOH Cost V TSFOH – TAFOH
SH × SVOH – AH × AVOH SH × SFOH – AH × AFOH
2 VOH Exp V (SVOH – AVOH) × AH FOH Exp V BFOH – TAFOH
(SVOH – AVOH) × AH
3 VOH Eff V (SH – AH) × SVOH FOH Vol V TSFOH – BFOH
(SH – BH) ×SFOH
4 FOH Eff V (SH – AH) × SFOH
5 CapacityV (AH – BH) × SFOH
6 CalenderV (AD - BD) × SFOHPD
(RBH – BH) × SFOH
7 RCapacityV (AH – RBH) × SFOH
Check Check
VOHCV VOHExpV + VOHEffV FOHCV FOHExpV + FOHVolV
FOHVolV FOHEffV + RCapacityV + CalenderV
CapacityV CalenderV + RCapacityV
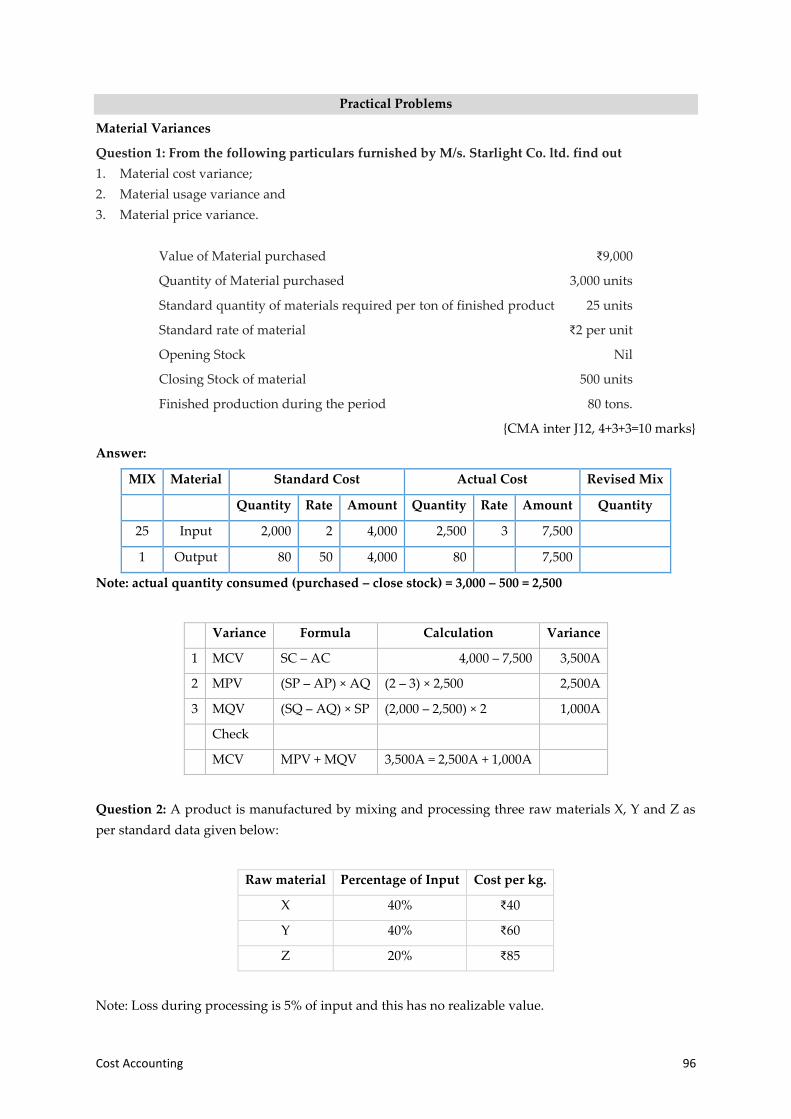
Cost Accounting 96
Practical Problems
Material Variances
Question 1: From the following particulars furnished by M/s. Starlight Co. ltd. find out
1. Material cost variance;
2. Material usage variance and
3. Material price variance.
Value of Material purchased ₹9,000
Quantity of Material purchased 3,000 units
Standard quantity of materials required per ton of finished product 25 units
Standard rate of material ₹2 per unit
Opening Stock Nil
Closing Stock of material 500 units
Finished production during the period 80 tons.
{CMA inter J12, 4+3+3=10 marks}
Answer:
MIX Material Standard Cost Actual Cost Revised Mix
Quantity Rate Amount Quantity Rate Amount Quantity
25 Input 2,000 2 4,000 2,500 3 7,500
1 Output 80 50 4,000 80 7,500
Note: actual quantity consumed (purchased – close stock) = 3,000 – 500 = 2,500
Variance Formula Calculation Variance
1 MCV SC – AC 4,000 – 7,500 3,500A
2 MPV (SP – AP) × AQ (2 – 3) × 2,500 2,500A
3 MQV (SQ – AQ) × SP (2,000 – 2,500) × 2 1,000A
Check
MCV MPV + MQV 3,500A = 2,500A + 1,000A
Question 2: A product is manufactured by mixing and processing three raw materials X, Y and Z as
per standard data given below:
Raw material Percentage of Input Cost per kg.
X 40% ₹40
Y 40% ₹60
Z 20% ₹85
Note: Loss during processing is 5% of input and this has no realizable value.
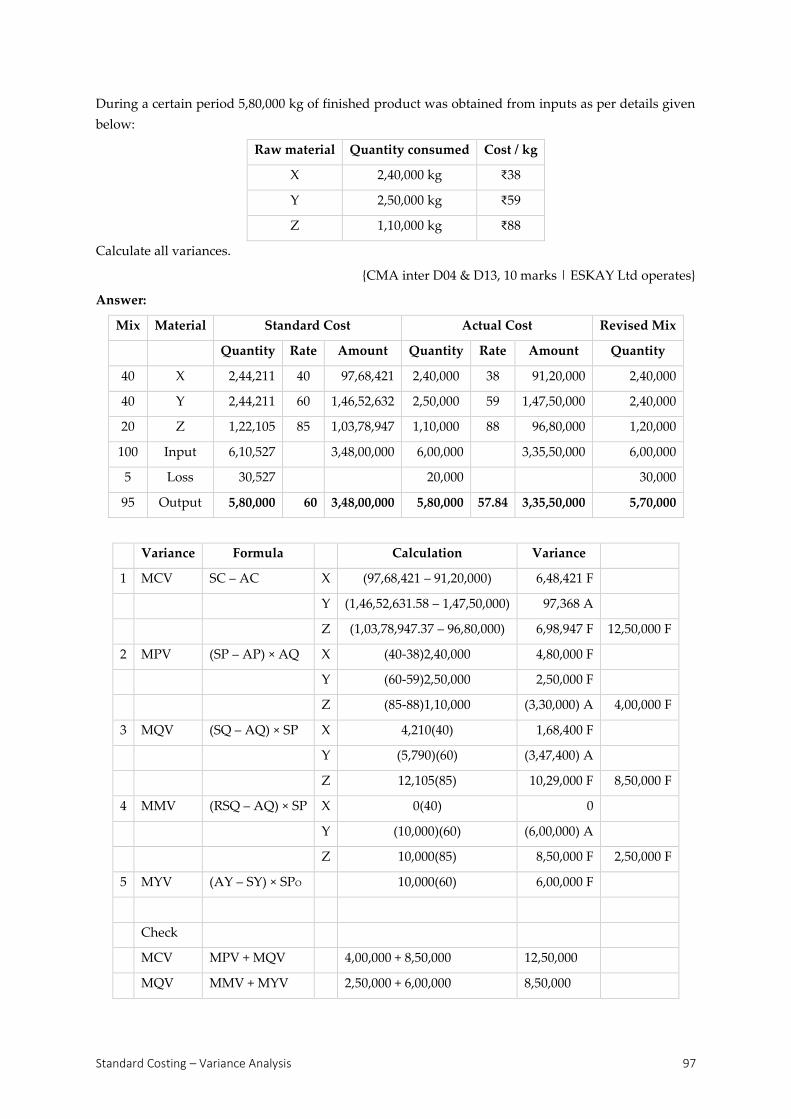
Standard Costing – Variance Analysis 97
During a certain period 5,80,000 kg of finished product was obtained from inputs as per details given
below:
Raw material Quantity consumed Cost / kg
X 2,40,000 kg ₹38
Y 2,50,000 kg ₹59
Z 1,10,000 kg ₹88
Calculate all variances.
{CMA inter D04 & D13, 10 marks | ESKAY Ltd operates}
Answer:
Mix Material Standard Cost Actual Cost Revised Mix
Quantity Rate Amount Quantity Rate Amount Quantity
40 X 2,44,211 40 97,68,421 2,40,000 38 91,20,000 2,40,000
40 Y 2,44,211 60 1,46,52,632 2,50,000 59 1,47,50,000 2,40,000
20 Z 1,22,105 85 1,03,78,947 1,10,000 88 96,80,000 1,20,000
100 Input 6,10,527 3,48,00,000 6,00,000 3,35,50,000 6,00,000
5 Loss 30,527 20,000 30,000
95 Output 5,80,000 60 3,48,00,000 5,80,000 57.84 3,35,50,000 5,70,000
Variance Formula Calculation Variance
1 MCV SC – AC X (97,68,421 – 91,20,000) 6,48,421 F
Y (1,46,52,631.58 – 1,47,50,000) 97,368 A
Z (1,03,78,947.37 – 96,80,000) 6,98,947 F 12,50,000 F
2 MPV (SP – AP) × AQ X (40-38)2,40,000 4,80,000 F
Y (60-59)2,50,000 2,50,000 F
Z (85-88)1,10,000 (3,30,000) A 4,00,000 F
3 MQV (SQ – AQ) × SP X 4,210(40) 1,68,400 F
Y (5,790)(60) (3,47,400) A
Z 12,105(85) 10,29,000 F 8,50,000 F
4 MMV (RSQ – AQ) × SP X 0(40) 0
Y (10,000)(60) (6,00,000) A
Z 10,000(85) 8,50,000 F 2,50,000 F
5 MYV (AY – SY) × SPO 10,000(60) 6,00,000 F
Check
MCV MPV + MQV 4,00,000 + 8,50,000 12,50,000
MQV MMV + MYV 2,50,000 + 6,00,000 8,50,000
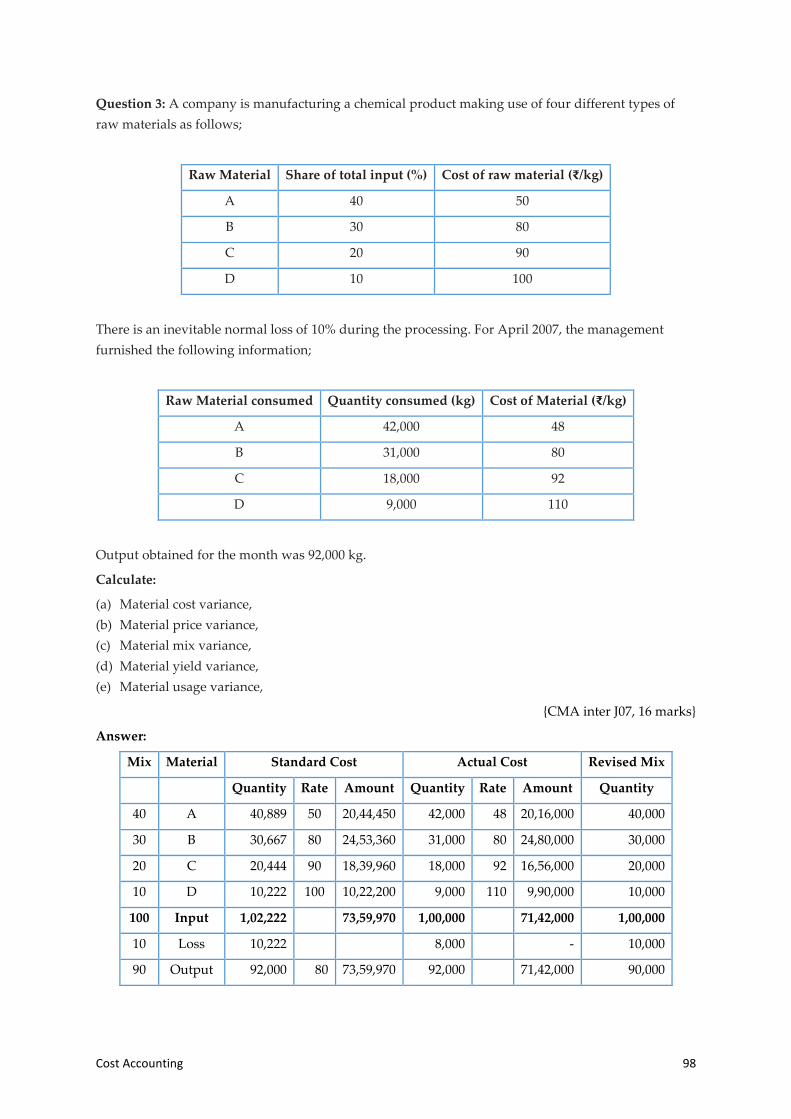
Cost Accounting 98
Question 3: A company is manufacturing a chemical product making use of four different types of
raw materials as follows;
Raw Material Share of total input (%) Cost of raw material (₹/kg)
A 40 50
B 30 80
C 20 90
D 10 100
There is an inevitable normal loss of 10% during the processing. For April 2007, the management
furnished the following information;
Raw Material consumed Quantity consumed (kg) Cost of Material (₹/kg)
A 42,000 48
B 31,000 80
C 18,000 92
D 9,000 110
Output obtained for the month was 92,000 kg.
Calculate:
(a) Material cost variance,
(b) Material price variance,
(c) Material mix variance,
(d) Material yield variance,
(e) Material usage variance,
{CMA inter J07, 16 marks}
Answer:
Mix Material Standard Cost Actual Cost Revised Mix
Quantity Rate Amount Quantity Rate Amount Quantity
40 A 40,889 50 20,44,450 42,000 48 20,16,000 40,000
30 B 30,667 80 24,53,360 31,000 80 24,80,000 30,000
20 C 20,444 90 18,39,960 18,000 92 16,56,000 20,000
10 D 10,222 100 10,22,200 9,000 110 9,90,000 10,000
100 Input 1,02,222 73,59,970 1,00,000 71,42,000 1,00,000
10 Loss 10,222 8,000 - 10,000
90 Output 92,000 80 73,59,970 92,000 71,42,000 90,000

Standard Costing – Variance Analysis 99
Variance Formula Calculation Variance
1 MCV SC – AC A 20,44,450 – 20,16,000 28,450 F
B 24,53,360 – 24,80,000 (26,640) A
C 18,39,960 – 16,56,000 1,83,950 F
D 10,22,200 – 9,90,000 32,200 F 2,17,970 F
2 MPV (SP – AP) × AQ A (50 – 48) 42,000 84,000 F
B (80 – 80) 31,000 0
C (90 – 92) 18,000 (36,000)
D (100 – 110) 9000 (90,000) A (42,000)
3 MQV (SQ – AQ) × SP A 50(40,889 – 42,000) (55,550) A
B 80(30,667 – 31,000) (26,640) A
C 90(20,444 – 18,000) 2,19,960 F
D 100(10,222 – 9000) 1,22,200 F 2,59,970 F
4 MMV (RSQ – AQ) × SP A 50(40,000 – 42,000) (1,00,000) A
B 80(30,000 – 31,000) (80,000) A
C 90(20,000 – 18,000) 1,80,000 F
D 100(10,000 – 9000) 1,00,000 F 1,00,000 F
5 MYV (AY – SY) × SPO (92,000 – 90,000)80 1,60,000 F
Check
MCV MPV + MQV 2,59,970 + (42,000) 2,17,970 F
MQV MMV + MYV 1,60,000 + 1,00,000 2,60,000 F
Question 4: Vinak Ltd. produces an article by blending two basic materials. It operates a standard
costing system and the following standards have been set for raw materials:
Material Standard Mix Standard Price per k.gs
A 40% ₹4
B 60% ₹3
The standard loss in processing is 15%. During April 2009 the company produced 1700 k.gs of finished
output. The position of stocks and purchases for the month of April 2009 is as under:
Material Stock on
1.4.2009 (k.gs)
Stock on
30.4.2009 (k.gs)
Purchases during April 2009
k.gs Cost in ₹
A 35 5 800 3400
B 40 50 1200 3000

Cost Accounting 100
Calculate all material variances [Assume FIFO method of pricing material issues]
Answer:
Standard
Mix
Direct
Material
Standard Cost Actual Cost RSQ
Q ₹/p.u ₹ Q ₹/p.u ₹
40 A 800 4 3200 35 4 140 808
795 4.25 3378.75
830 3518.75
60 B 1200 3 3600 40 3 120 1212
1150 2.50 2875
1190 2995
100 I/P 2000 6800 2020 6513.75 2020
15 Loss 300 320 303
85 O/P 1700 4* 6800 1700 6513.75 1717
Variance Formula Calculation Variance
1 MCV SC – AC A 3200 – 3518.75 318.75 A
B 3600 – 2995 605 F 286.25F
2 MPV (SP – AP) × AQ A (4 – 4.25) × 795 198.75 A
B (3 – 2.5) × 1150 575 F 376.25 F
3 MQV (SQ – AQ) × SP A (800 – 830) × 4 120 A
B (1200 – 1190) × 3 30 F 90A
4 MMV (RSQ – AQ) × SP A (808 – 830) × 4 88 A
B (1212 – 1190) × 3 66 F 22A
5 MYV (AY – SY) × SPO (1700 – 1717) × 4 68 A
Check
MCV MPV + MQV 376.25 F + 90 A 286.25 F
MQV MMV + MYV 22 A + 68 A 90 A
Labour Variances
Question 5: The following information pertains to labour force of UDHHAMI LTD. engaged in a week
of November 2014 for a JOB – PH.
Particulars Skilled Semi- skilled Unskilled Total
No. of workers in standard gang 16 12 8 36
Standard rate per hour (₹) 60 30 10 -
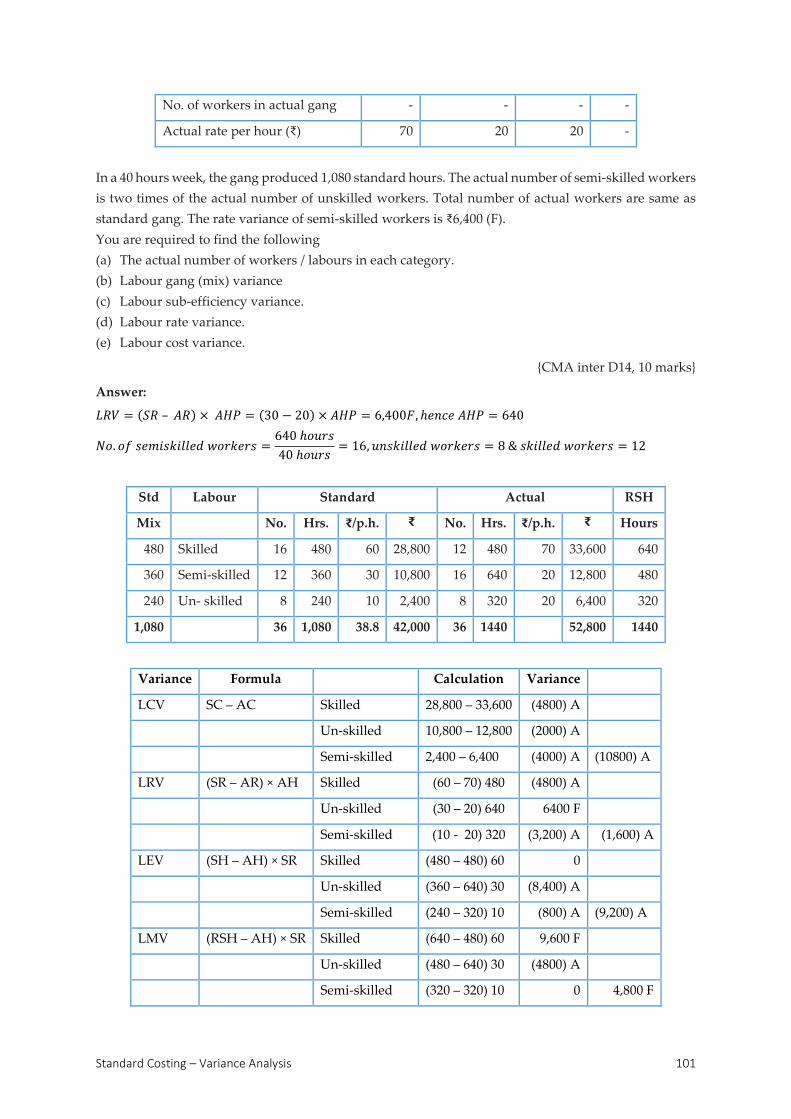
Standard Costing – Variance Analysis 101
No. of workers in actual gang - - - -
Actual rate per hour (₹) 70 20 20 -
In a 40 hours week, the gang produced 1,080 standard hours. The actual number of semi-skilled workers
is two times of the actual number of unskilled workers. Total number of actual workers are same as
standard gang. The rate variance of semi-skilled workers is ₹6,400 (F).
You are required to find the following
(a) The actual number of workers / labours in each category.
(b) Labour gang (mix) variance
(c) Labour sub-efficiency variance.
(d) Labour rate variance.
(e) Labour cost variance.
{CMA inter D14, 10 marks}
Answer:
𝐿𝑅𝑉 = (𝑆𝑅 – 𝐴𝑅) × 𝐴𝐻𝑃 = (30 − 20) × 𝐴𝐻𝑃 = 6,400𝐹, ℎ𝑒𝑛𝑐𝑒 𝐴𝐻𝑃 = 640
𝑁𝑜. 𝑜𝑓 𝑠𝑒𝑚𝑖𝑠𝑘𝑖𝑙𝑙𝑒𝑑 𝑤𝑜𝑟𝑘𝑒𝑟𝑠 =640 ℎ𝑜𝑢𝑟𝑠
40 ℎ𝑜𝑢𝑟𝑠= 16, 𝑢𝑛𝑠𝑘𝑖𝑙𝑙𝑒𝑑 𝑤𝑜𝑟𝑘𝑒𝑟𝑠 = 8 & 𝑠𝑘𝑖𝑙𝑙𝑒𝑑 𝑤𝑜𝑟𝑘𝑒𝑟𝑠 = 12
Std Labour Standard Actual RSH
Mix No. Hrs. ₹/p.h. ₹ No. Hrs. ₹/p.h. ₹ Hours
480 Skilled 16 480 60 28,800 12 480 70 33,600 640
360 Semi-skilled 12 360 30 10,800 16 640 20 12,800 480
240 Un- skilled 8 240 10 2,400 8 320 20 6,400 320
1,080 36 1,080 38.8 42,000 36 1440 52,800 1440
Variance Formula Calculation Variance
LCV SC – AC Skilled 28,800 – 33,600 (4800) A
Un-skilled 10,800 – 12,800 (2000) A
Semi-skilled 2,400 – 6,400 (4000) A (10800) A
LRV (SR – AR) × AH Skilled (60 – 70) 480 (4800) A
Un-skilled (30 – 20) 640 6400 F
Semi-skilled (10 - 20) 320 (3,200) A (1,600) A
LEV (SH – AH) × SR Skilled (480 – 480) 60 0
Un-skilled (360 – 640) 30 (8,400) A
Semi-skilled (240 – 320) 10 (800) A (9,200) A
LMV (RSH – AH) × SR Skilled (640 – 480) 60 9,600 F
Un-skilled (480 – 640) 30 (4800) A
Semi-skilled (320 – 320) 10 0 4,800 F

Cost Accounting 102
LSEV SR(SH- RSH) Skilled (480 – 640) 60 (9600) A
Un-skilled (360 – 480) 30 (3,600) A
Semi-skilled (240 – 320 ) 10 (800) A (14,000) A
Check
LCV LRV + LEV (1,600) + (9,200) (10,800) A
LEV LMV + LSEV 4,800 + (14,000) (9,200) A
Question 6: A group of workers consisting 30 men above 30 years of age, 15 females above 30 years of
age, and 10 youth of age between 20-30 are paid standard hourly rate as follows:
Males ₹80/-per hour
Females ₹60/- per hour
Youth ₹40/- per hour
In a normal working week of 40 hours, the group is expected to produce 200 units of output. During a
week, the group consisting of 40 males, 10 females and 5 youth produced 1600 units they were paid
wages @ ₹70/- for males, ₹65/- for females and ₹30/- for youth per hour.
4 hours were lost due to abnormal idle time.
Calculate:
(a) Wages variance;
(b) Wage rate variance;
(c) Labour efficiency variance;
(d) Labour mix variance;
(e) Labour idle time variance.
{CMA inter J08, 10 marks}
Answer:
Mix Standard Actual HR paid Actual HR Worked RSH
Hrs. ₹/p.h. ₹ Hrs. ₹/p.h. ₹ Hrs. ₹/p.h. ₹ IT
1,200 Men 960 80 76,800 1600 70 1,12,000 1440 70 1,00,800 160 1080
600 Women 480 60 28,800 400 65 26,000 360 65 23,400 40 540
400 Youth 320 40 12,800 200 30 6,000 180 30 5,400 20 360
2,200 Input 1760 1,18,400 2200 1,44,000 1980 1,29,600 220 1980
2,000 Output 1600 74 1,18,400 1600 1,44,000 1600 1,29,600 1800
Variance Formula Calculation Variance
LCV SC – AC Men 76,800– 1,12,000 (35,200) A
Women 28,800– 26,000 2,800 F
Youth 12,800– 6,000 6,800 F (25,600) A
LRV (SR – AR) × AHP Men 1,600 (80– 70) 16,000 F
Women 400(60– 65) (2,000) A

Standard Costing – Variance Analysis 103
Youth 200(40 – 30) 2,000 F 16,000 F
LEV (SH – AHW) × SR Men 80(960– 1,440) (38,400) A
Women 60 (480 – 360) 7,200 F
Youth 40 (320 – 180) 5,600 F (25,600) A
ITR IT × SR Men 160 (80) 12,800
Women 40(60) 2,400
Youth 20(40) 800 (16,000) A
LMV (RSH – AHW) × SR Men 80(1,080 – 1,440) (28,800) A
Women 60(540– 360) 10,800 F
Youth 40(360– 180) 7,200 F (10,800)
A
LYV (AY – SY) × SPO (1,600– 1,800)74 (14,800) A
Check
LCV LRV + LEV 16,000 + (41,600) (25,600 )
A
LEV LMV + LYV + IT (10,800) + (14,800)
+ (16,000) (41,600) A
Variable OH variances
Question 7: From the following data, calculate variable overhead variances:
Budgeted Actual
Variable OH 2,50,000 2,60,000
Output in units 25,000 20,000
Working hours 1,25,000 1,10,000
Answer:
Budgeted Actual Standard
VOH p.u. 10 13 2,00,000
VOH p.h. 2 26/11 20,000
Time Allowed/Taken 5 5.5 1,00,000
VOHV Formula Calculation Variance
VOHCV 𝑆𝐻 × 𝑆𝑉𝑂𝐻– 𝐴𝐻 × 𝐴𝑉𝑂𝐻 (100,000 × 2)– (110,000 ×
26
11)
60,000A
VOHExpV (𝑆𝑉𝑂𝐻– 𝐴𝑉𝑂𝐻) × 𝐴𝐻 (2–
26
11) × 1,10,000
40,000A
VOHEffV (𝑆𝐻– 𝐴𝐻) × 𝑆𝑉𝑂𝐻 (100,000 – 110,000) × 2 20,000A

Cost Accounting 104
FOH Variances
Question 8: S V Ltd. has furnished you the following data:
Budgeted Actual
Number of working days 25 27
Production in units 20000 22000
Fixed overheads 30000 31000
Budgeted FOH rate is ₹1 per hour. The actual hours worked were 31,500.
Calculate: Efficiency variance, capacity variance, calendar variance, volume variance, expenditure
variance and total overhead variance.
Answer:
Budgeted Actual Standard for
actual output
Number of working days 25 27
Production in units 20,000 22,000 22,000
Fixed overheads 30,000 31,000 33,000
Fixed overhead per hour 1
Hours for the production 30,000 31,500 33,000
FOHV Formula Calculation Variance
FOHCV 𝑇𝑆𝐹𝑂𝐻 – 𝑇𝐴𝐹𝑂𝐻 33,000 – 31,000 2,000F
𝑆𝐻 × 𝑆𝐹𝑂𝐻 – 𝐴𝐻 × 𝐴𝐹𝑂𝐻
FOHExpV 𝐵𝐹𝑂𝐻 – 𝑇𝐴𝐹𝑂𝐻 30,000 – 31,000 1,000A
(𝑆𝑉𝑂𝐻 – 𝐴𝑉𝑂𝐻) × 𝐴𝐻
FOHVolV 𝑇𝑆𝐹𝑂𝐻 – 𝐵𝐹𝑂𝐻 33,000 – 30,000 3,000F
(𝑆𝐻 – 𝐵𝐻) × 𝑆𝐹𝑂𝐻 (33,000 – 30,000) × ₹1 3,000F
FOHEffV (𝑆𝐻 – 𝐴𝐻) × 𝑆𝐹𝑂𝐻 (33,000 – 31,500) × ₹1 1,500F
CapacityV (𝐴𝐻 – 𝐵𝐻) × 𝑆𝐹𝑂𝐻 (31,500 – 30,000) × ₹1 1,500F
CalenderV (𝐴𝐷 − 𝐵𝐷) × 𝑆𝐹𝑂𝐻𝑃𝐷 (27 – 25) × 1,200 2,400 F
(𝑅𝐵𝐻 – 𝐵𝐻) × 𝑆𝐹𝑂𝐻 (32,400 – 30,000) × 1 2,400 F
RCapacityV (𝐴𝐻 – 𝑅𝐵𝐻) × 𝑆𝐹𝑂𝐻 (31,500 – 32,400) × ₹1 900A
Check
FOHCV 𝐹𝑂𝐻𝐸𝑥𝑝𝑉 + 𝐹𝑂𝐻𝑉𝑜𝑙𝑉 1,000𝐴 + 3,000𝐹 2,000F
FOHVolV 𝐹𝑂𝐻𝐸𝑓𝑓𝑉 + 𝑅𝐶𝑎𝑝𝑎𝑐𝑖𝑡𝑦𝑉 + 𝐶𝑎𝑙𝑒𝑛𝑑𝑒𝑟𝑉 1,500𝐹 + 900𝐴 + 2,400𝐹 3,000F
CapacityV 𝐶𝑎𝑙𝑒𝑛𝑑𝑒𝑟𝑉 + 𝑅𝐶𝑎𝑝𝑎𝑐𝑖𝑡𝑦𝑉 2,400𝐹 + 900𝐴 1,500F

Standard Costing – Variance Analysis 105
Question 9: A manufacturing company operates a costing system and showed the following data in
respect of the month of November, 2015.
Budgeted Actual
Working days 20 Workings days 22
Man hours 4,000 Man hours 4,200
Fixed Overhead Cost (₹) 2,400 Fixed Overhead Cost (₹) 2,500
Output (units) 800 Output (units) 900
You are required to calculate fixed overhead variances from the above data.
{CMA inter D15, 6 marks}
Answer:
Budgeted Actual Standard for
Actual output
Number of working days 20 22
Production in units 800 900 900
Fixed overheads 2400 2500 2700
Fixed overhead per hour 0.6 0.59 0.6
Hours for the production 4000 4200 4500
Working Notes
𝑅𝐵𝐻 = 22
20× 4000 = 4,400
𝑆𝑅 = 2400
400= 0.6
FOHV Formula Calculation Variance
FOHCV 𝐵𝐹𝑂𝐻 – 𝑇𝐴𝐹𝑂𝐻 2,700 − 2,500 200 F
FOHExpV 𝐵𝐹𝑂𝐻 – 𝑇𝐴𝐹𝑂𝐻 2,400– 2,500 100A
FOHVolV 𝑇𝑆𝐹𝑂𝐻 – 𝐵𝐹𝑂𝐻 2,700– 2,400 300F
FOHEffV (𝑆𝐻 – 𝐴𝐻) × 𝑆𝐹𝑂𝐻 (4,500– 4,200)0.6 180 F
CapacityV (𝐴𝐻 – 𝐵𝐻) × 𝑆𝐹𝑂𝐻 (4,000– 4,200)0.6 120A
CalenderV (𝐴𝐷 − 𝐵𝐷) × 𝑆𝐹𝑂𝐻𝑃𝐷 (20– 22)120 240F
RCapacityV (𝐴𝐻 – 𝑅𝐵𝐻) × 𝑆𝐹𝑂𝐻 (4,200– 4,400)0.6 120A
Check
FO-HCV 𝐹𝑂𝐻𝐸𝑥𝑝𝑉 + 𝐹𝑂𝐻𝑉𝑜𝑙𝑉 300𝐹 + 100𝐴 200 F
FOHVolV 𝐹𝑂𝐻𝐸𝑓𝑓𝑉 + 𝑅𝐶𝑎𝑝𝑎𝑐𝑖𝑡𝑦𝑉 + 𝐶𝑎𝑙𝑒𝑛𝑑𝑒𝑟𝑉 180𝐹 + 120𝐴 + 240𝐹 300 F
CapacityV 𝐶𝑎𝑙𝑒𝑛𝑑𝑒𝑟𝑉 + 𝑅𝐶𝑎𝑝𝑎𝑐𝑖𝑡𝑦𝑉 240𝐹 + 120𝐴 120 F

Cost Accounting 106
Question 10: ABC Enterprise has normal monthly machine-hour capacity of 100 machines working 8
hours per day for 25 working days in a month. The standard time required to manufacture one unit of
the product is 4 hours. The budgeted fixed overhead is ₹150,000.
In a month just concluded, the company worked for 24 days for average 750 machine-hours per day.
The production was 4500 units. The actual fixed overhead was ₹1,60,000.
You are required to complete
(a) Efficiency variance,
(b) Capacity variance,
(c) Calendar variance,
(d) Expenses variance,
(e) Volume variance,
(f) Total fixed overhead variance.
{CMA inter D07 & J14, 12 marks}
Answer:
Budgeted Actual Standard for
actual output
No. of Working days 25 24
Production in units 5000 4500 4500
Hours 100 × 25 × 8 = 20000 750 × 24 = 18000 4500 × 4 = 18000
Fixed overheads 1,50,000 1,60,000 1,35,000
Fixed overhead per hours 7.5 8.89 7.5
𝑅𝐵𝐻 =24
25× 20000 = 19,200
FOHV Formula Calculation Variance
FOHCV 𝐵𝐹𝑂𝐻 – 𝑇𝐴𝐹𝑂𝐻 1,35,000 − 1,60,000 25,000A
FOHExpV 𝐵𝐹𝑂𝐻 – 𝑇𝐴𝐹𝑂𝐻 1,50,000 – 1,60,000 10,000A
FOHVolV 𝑇𝑆𝐹𝑂𝐻 – 𝐵𝐹𝑂𝐻 1,35,000– 1,50,000 15,000A
FOHEffV (𝑆𝐻 – 𝐴𝐻) × 𝑆𝐹𝑂𝐻 (18,000– 18,000)7.5 0
CapacityV (𝐴𝐻 – 𝐵𝐻) × 𝑆𝐹𝑂𝐻 (18,000– 20,000)7.5 15,000A
CalenderV (𝐴𝐷 − 𝐵𝐷) × 𝑆𝐹𝑂𝐻𝑃𝐷 (24– 25)6,000 6,000A
RCapacityV (𝐴𝐻 – 𝑅𝐵𝐻) × 𝑆𝐹𝑂𝐻 (18,000– 19,200)7.5 9,000A
Check
FOHCV 𝐹𝑂𝐻𝐸𝑥𝑝𝑉 + 𝐹𝑂𝐻𝑉𝑜𝑙𝑉 10,000𝐴 + 15,000𝐴 25,000A
FOHVolV 𝐹𝑂𝐻𝐸𝑓𝑓𝑉 + 𝑅𝐶𝑎𝑝𝑎𝑐𝑖𝑡𝑦𝑉 + 𝐶𝑎𝑙𝑒𝑛𝑑𝑒𝑟𝑉 0 + 9,000𝐴 + 6,000𝐴 15,000A
CapacityV 𝐶𝑎𝑙𝑒𝑛𝑑𝑒𝑟𝑉 + 𝑅𝐶𝑎𝑝𝑎𝑐𝑖𝑡𝑦𝑉 6,000𝐴 + 9,000𝐴 15,000A

Standard Costing – Variance Analysis 107
Sales Formula Sales Margin Formula
1 Sales Value V ST – AT Sales Margin Value V TSM – TAM
SQ × SP – AQ × AP SQ × SM – AQ × AM
2 Sales Price V (SP – AP) × AQ Sales Margin V (SM – AM) × AQ
3 Sales Vol V (SQ – AQ) × SP Sales Margin Vol V (SQ – AQ) × SM
4 Sales MixV (RSQ – AQ) × SP Sales Margin MixV (RSQ – AQ) × SM
5 Sales Sub Usage V (SQ – RSQ) × SP Sales Margin Sub Usage V (SQ – RSQ) × SM
Check Check
SVV SPV + SVolV SMVV SMV + SMVolV
SVolV SMixV + SSUV SMVolV SMMixV + SMSUV
Sales Value and Sales Margin Variance:
Question 11: From the following particulars calculate all sales variances according to profit method
and value method
Product Budget Actual
Quantity Cost p.u. Selling Price p.u. Quantity Cost p.u. Selling Price p.u.
X 3000 10 12 3200 10.50 13
Y 2000 15 18 1600 14 17
Answer:
Sales
Product Budgeted Actual RSQ
Q ₹/p.u. ₹ Q ₹/p.u ₹
X 3,000 12 36,000 3,200 13 41,600 2,880
Y 2,000 18 36,000 1,600 17 27,200 1,920
Total 5,000 72,000 4,800 68,800 4,800
Profit Method
Product Budgeted Actual RSQ
Q ₹/p.u. ₹ Q ₹/p.u. ₹
X 3,000 2 6,000 3,200 2.5 8,000 2,880
Y 2,000 3 6,000 1,600 3.0 4,800 1,920
Total 5,000 12,000 4,800 12,800 4,800

Cost Accounting 108
Sales Formula Calculation Variance
ST – AT
SVV SQ × SP – AQ × AC A (3,000 × 12) – (3,200 × 13) 5,600F
B (2,000 × 18) – (1,600 × 17) 8,800A 3,200A
SPV (SP – AP) × AQ A (12 – 13) × 3,200 3,200F
B (18 – 17) × 1,600 1,600A 1,600F
SVolV (SQ – AQ) × SP A (3,000 – 3,200) × 12 2,400F
B (2,000 – 1,600) × 18 7,200A 4,800A
SMixV (RSQ – AQ) × SP A (2,880 – 3,200) × 12 3,840F
B (1,920 – 1,600) × 18 5,760A 1,920A
SSUV (SQ – RSQ) × SP A (3,000 – 2,880) × 12 1,440A
B (2,000 – 1,920) × 18 1,440A 2,880A
Check
SVV SPV + SVolV 1,600F + 4,800A 3,200A
SVolV SMV + SSUV 1,920A + 2,880A 4,800A
Profit Formula Calculation Variance
SMVV TSM – TAM
SQ × SM – AQ × AM A (3,000 × 2) – (3,200 × 2.5) 2,000 F
B (2,000 × 3) – (1,600 × 3) 1,200 A 800F
SMV (SM – AM) × AQ A (12 – 13) × 3,200 3,200F
B (18 – 17) × 1,600 1,600A 1,600F
SMVolV (SQ – AQ) × SM A (3,000 – 3,200) × 2 400F
B (2,000 – 1,600) × 3 1,200A 800A
SMMixV (RSQ – AQ) × SM A (2880 – 3200) × 2 640F
B (1920 – 1600) × 3 960A 320A
SMSUV (SQ – RSQ) × SM A (3,000 – 2,880) × 2 240A
B (2,000 – 1,920) × 3 240A 480A
Check
SMVV SMV + SMVolV 1,600F + 800A 800F
SMVolV SMMixV + SMSUV 320A + 480A 800A

Budget and Budgetary Control 109
3.3 BUDGET AND BUDGETARY CONTROL
Budget: An estimated performance in terms of currency / quantity to be achieved in given time
Budget Centre: A section of an orgn for which separate budget is prepared & control exercised.
Budgetary Control: Guiding and regulating activities to attaining predetermined objectives
Budget manual: A written booklet for procedures of budgeting.
Budget Period: The period of time for which a budget is prepared and used
Components of Budgetary Control System:
a) Physical Budgets: Contain information in terms of physical units about sales, production etc.
b) Cost Budget
c) Profit Budgets: Sales budget, profit and loss budget, etc.
d) Financial Budgets: cash budgets, capital expenditure budget, budgeted balance sheet etc.
e) Functional Budget: Purchase budget, sales budget, production budget, plant-utilization budget
f) Master Budget: A consolidated summary of the various functional budgets
g) Long term Budget
h) Short-term Budget
i) Basic Budget: Remains unaltered over a long period of time
j) Current Budget: Used for a short period of time.
k) Fixed Budget: budget designed to remain unchanged irrespective of the level of activity
l) Flexible Budget: Series of fixed budget
Zero Based Budgeting – ZBB (where base is zero) is a method of budgeting whereby all activities are
re-evaluated each time a budget is formulated.
Principal Budget factor: limiting factor (the scarce resource)
{CMA inter J02, J07 & D11, 4 marks}
PRACTICAL PROBLEMS
Material procurement and wages budget
Question 1: ABC Ltd. manufactures two products using one type of material and one grade of labour.
Shown below is an extract form the company’s working papers of the next period’s budget.
Particulars Product A Product B
Budgeted sales (units) 3,600 4,800
Budgeted material consumption per product (kg) 5 3
Budgeted material cost ₹12 per kg.
Standard hours allowed per product 5 4
Budgeted wage rate ₹8 per hr.

Cost Accounting 110
Overtime premium is 50% and is payable, if a worker works for more than 40 hours a week. There are
90 direct workers. The target productivity ratio (or efficiency ratio) for the productive hours worked by
the direct workers in actually manufacturing the products is 80%; in addition, the non-productive
downtime budgeted at 20% of the productive hours Worked. There are twelve 5-day weeks in the
budget period and it is anticipated that sales and production will occur evenly throughout the whole
period. It is anticipated that stock at the beginning of the period will be: Product A – 1,020 units; Product
B – 2,400 units; Raw material 4,300 kgs. The target closing stocks expressed in terms of anticipated
activity during the budget period are: Product A – 15 days sales; Product B – 20 days sales; raw material
10 days consumption.
Required: Calculate the Material Purchases Budget and the Wages Budget for the direct workers,
showing the quantities and values, for the next period.
Answer:
Material Purchase Budget (in quantities and value)
Particulars Product A Product B Total
(a) Budgeted production (units) 3,480 4,000
(b) Material consumption per unit [kg.] 5 3
Material consumption (kg.) [(a) × (b)] 17,400 12,000 29,400
(+) Closing balance of material (kg) 4,900
(-) Anticipated opening balance of material (kg) 4,300
Total quantity of material (kg) to be purchased 30,000
Total value of material to be purchased (₹) (30,000 kg × ₹12) 3,60,000
Direct Workers’ Wages Budget
(Showing hours required and wages paid)
Standard hours for Product A (3,480 units × 5 hours) 17,400
Standard hour for Product B (4,000 units × 4 hours) 16,000
Total standard hours 33,400
Standard hours at 80% efficiency ratio (33,400 × 100/80) 41,750
(+) Non-productive downtime (20% × 41,750 hours) 8,350
Total labour hours required 50,100
(-) Normal labour hours (90 workers × 60 days × 8 hours) 43,200
Overtime hours available 6,900
Wages for normal hours (₹) (43,200 hours × ₹8) 3, 45,600
Overtime wages (₹) (6,900 × ₹12) 82,800
Total wages 4,28,400
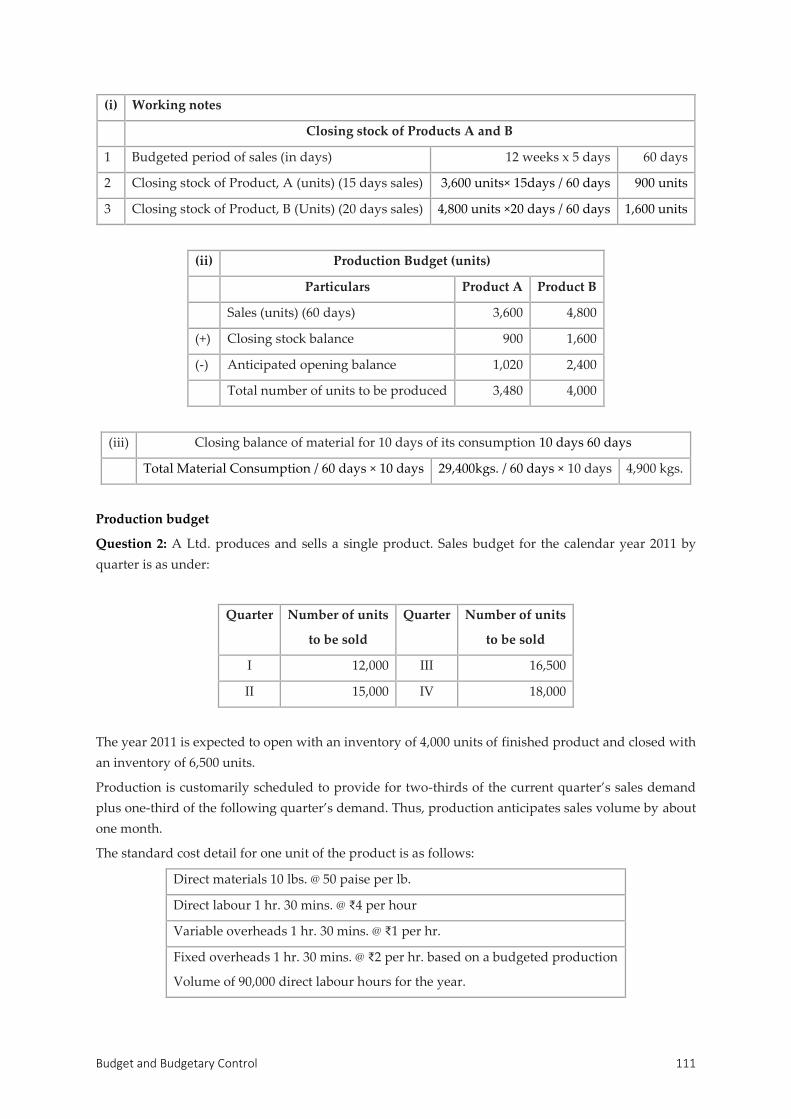
Budget and Budgetary Control 111
(i) Working notes
Closing stock of Products A and B
1 Budgeted period of sales (in days) 12 weeks x 5 days 60 days
2 Closing stock of Product, A (units) (15 days sales) 3,600 units× 15days / 60 days 900 units
3 Closing stock of Product, B (Units) (20 days sales) 4,800 units ×20 days / 60 days 1,600 units
(ii) Production Budget (units)
Particulars Product A Product B
Sales (units) (60 days) 3,600 4,800
(+) Closing stock balance 900 1,600
(-) Anticipated opening balance 1,020 2,400
Total number of units to be produced 3,480 4,000
(iii) Closing balance of material for 10 days of its consumption 10 days 60 days
Total Material Consumption / 60 days × 10 days 29,400kgs. / 60 days × 10 days 4,900 kgs.
Production budget
Question 2: A Ltd. produces and sells a single product. Sales budget for the calendar year 2011 by
quarter is as under:
Quarter Number of units
to be sold
Quarter Number of units
to be sold
I 12,000 III 16,500
II 15,000 IV 18,000
The year 2011 is expected to open with an inventory of 4,000 units of finished product and closed with
an inventory of 6,500 units.
Production is customarily scheduled to provide for two-thirds of the current quarter’s sales demand
plus one-third of the following quarter’s demand. Thus, production anticipates sales volume by about
one month.
The standard cost detail for one unit of the product is as follows:
Direct materials 10 lbs. @ 50 paise per lb.
Direct labour 1 hr. 30 mins. @ ₹4 per hour
Variable overheads 1 hr. 30 mins. @ ₹1 per hr.
Fixed overheads 1 hr. 30 mins. @ ₹2 per hr. based on a budgeted production
Volume of 90,000 direct labour hours for the year.
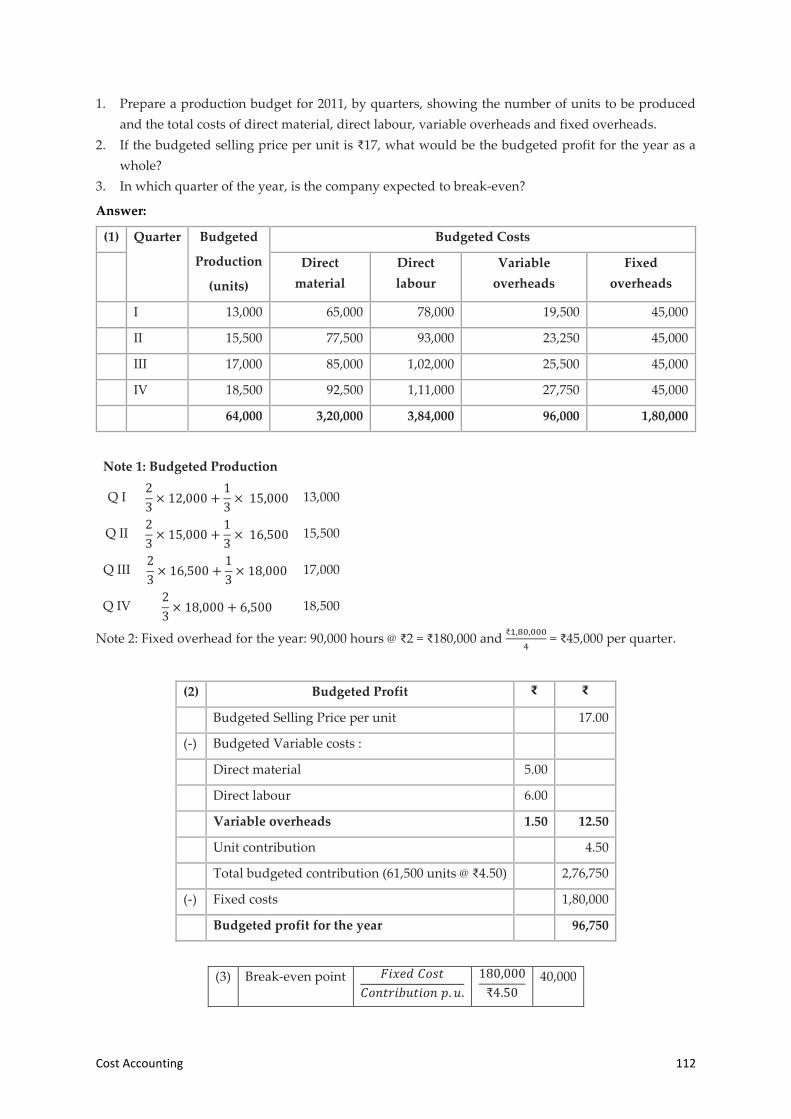
Cost Accounting 112
1. Prepare a production budget for 2011, by quarters, showing the number of units to be produced
and the total costs of direct material, direct labour, variable overheads and fixed overheads.
2. If the budgeted selling price per unit is ₹17, what would be the budgeted profit for the year as a
whole?
3. In which quarter of the year, is the company expected to break-even?
Answer:
(1) Quarter Budgeted
Production
(units)
Budgeted Costs
Direct
material
Direct
labour
Variable
overheads
Fixed
overheads
I 13,000 65,000 78,000 19,500 45,000
II 15,500 77,500 93,000 23,250 45,000
III 17,000 85,000 1,02,000 25,500 45,000
IV 18,500 92,500 1,11,000 27,750 45,000
64,000 3,20,000 3,84,000 96,000 1,80,000
Note 1: Budgeted Production
Q I 2
3× 12,000 +
1
3× 15,000 13,000
Q II 2
3× 15,000 +
1
3× 16,500 15,500
Q III 2
3× 16,500 +
1
3× 18,000 17,000
Q IV 2
3× 18,000 + 6,500 18,500
Note 2: Fixed overhead for the year: 90,000 hours @ ₹2 = ₹180,000 and ₹1,80,000
4 = ₹45,000 per quarter.
(2) Budgeted Profit ₹ ₹
Budgeted Selling Price per unit 17.00
(-) Budgeted Variable costs :
Direct material 5.00
Direct labour 6.00
Variable overheads 1.50 12.50
Unit contribution 4.50
Total budgeted contribution (61,500 units @ ₹4.50) 2,76,750
(-) Fixed costs 1,80,000
Budgeted profit for the year 96,750
(3) Break-even point 𝐹𝑖𝑥𝑒𝑑 𝐶𝑜𝑠𝑡
𝐶𝑜𝑛𝑡𝑟𝑖𝑏𝑢𝑡𝑖𝑜𝑛 𝑝. 𝑢.
180,000
₹4.50
40,000

Budget and Budgetary Control 113
Quarter Sales demand Cum. Sales Demand
I 12,000 12,000
II 15,000 27,000
III 16,500 43,500
IV 18,000 61,500
Thus, A Ltd. wills break-even in the later part of Quarter III.
Flexible Budgeting
Question 3: A factory is currently working at 50% of its working capacity and produces 10,000 units.
At 60% working capacity, the raw material cost increases by 2% and selling price falls 2%. At 80%
working capacity, raw material cost increases by 5% and selling price falls by 5%. At 50% working
capacity, the product costs ₹180 per unit and sold at ₹200 per unit. The cost of ₹180 is made up as
follows:
₹
Material 100
Labour 30
Factory Overhead (40% fixed) 30
Administration overhead (50% fixed) 20
180
You are required to estimate the profits of the factory when it works at 60% and 80% of its capacity.
Answer:
Flexible Budget
Existing proposed
Level of Activity 50% 60% 80%
Number of units 10,000 12,000 16,000
Variable cost
Material 10,00,000 12,24,000 16,80,000
Labour 3,00,000 3,60,000 4,80,000
Factory overhead 1,80,000 2,16,000 2,88,000
Administration overhead 1,00,000 1,20,000 1,60,000
Total variable costs 15,80,000 19,20,000 26,08,000
Fixed Costs
Factory overhead 1,20,000 1,20,000 1,20,000
Administration overhead 1,00,000 1,00,000 1,00,000
Total Fixed Costs 2,20,000 2,20,000 2,20,000
Total costs (i) + (ii) 18,00,000 21,40,000 28,28,000
Sales value 20,00,000 23,52,000 30,40,000
Profit 2,00,000 2,12,000 2,12,000

Cost Accounting 114
Question 4: The following information is obtained from the records of a manufacturing company for a
budgeted production of 10,000 units per annum
Particular ₹ / p.u.
Direct Material 120.00
Direct Labour 60.00
Variable Overheads 50.00
Fixed Overheads (₹3,00,000) 30.00
Variable expenses 10.00
Selling expenses (10% fixed) 30.00
Administrative expenses (₹1,00,000 – rigid for all levels of production) 10.00
Distribution expenses (20% Fixed) 10.00
Total cost of sales (Per unit) 320.00
You are required to prepare a budget for production levels of 6,000, 7,000 and 8,000 units respectively.
Showing distinctly marginal cost and total cost.
Answer:
Cost budget
Particular Cost p.u. 6,000 units 7,000 units 8,000 units
I Variable Cost
Direct material 120 7,20,000 8,40,000 9,60,000
Direct Labour 60 3,60,000 4,20,000 4,80,000
Variable Overheads 50 3,00,000 3,50,000 4,00,000
Variable expenses Direct) 10 60,000 70,000 80,000
Selling Direct (Expenses) 27 1,62,000 1,89,000 2,16,000
Distribution Exp. (80%) 08 48,000 56,000 64,000
Total Variable Costs….I 16,50,000 19,25,000 22,00,000
II Fixed Costs
Fixed Overheads 3,00,000 3,00,000 3,00,000
Selling Expenses (10%) 30,000 30,000 30,000
Administrative Expenses 1,00,000 1,00,000 1,00,000
Distribution Expenses 20,000 20,000 20,000
Total Fixed Costs …. II 4,50,000 4,50,000 4,50,000
Total Costs (I + II) 21,00,000 23,75,000 26,50,000
Cost Per Unit 350 339.28 331.23

Budget and Budgetary Control 115
Question 5: The cost of a product at capacity level of 5,000 units is given under ‘A’ below. For a variation
in capacity above or below this level, the individual expenses vary as indicated under ‘B’ Below:
Particular ‘A’ ‘B’ (₹)
Material costs 2,50,000 100% varying
Labour costs 1,50,000 100% varying
Power 12,500 80% varying
Repairs and maintenance 20,000 75% varying
Stores 10,000 100% varying
Inspection 5,000 20% varying
Depreciation 1,00,000 100% fixed
Administrative overheads 50,000 25% varying
Selling overheads 30,000 50% varying
Find out the unit cost of product under each individual expenses at budgeted production levels of 4,000
units and 6,000 units.
Answer:
Particular Nature 4,000 units 6,000 units
Total Variable Costs
Material costs 100% (V) 2,00,000 3,00,000
Labour costs 100% (V) 1,20,000 1,80,000
Power 80% (V) 8,000 12,000
Repairs and maintenance 75% (V) 12,000 18,000
Stores 100% (V) 8,000 12,000
Inspection 20% (V) 800 1,200
Administrative overheads 25% (V) 10,000 15,000
Selling overheads 50% (V) 12,000 18,000
Total Variable Costs 3,70,000 5,56,200
Total Fixed Costs
Power 20% (F) 2,500 2,500
Repair and Maintenance 25% (F) 5,000 5,000
Inspection 80% (F) 4,000 4,000
Depreciation 100% (F) 1,00,000 1,00,000
Administration overhead 75% (F) 37,500 37,500
Selling overheads 50% (F) 15,000 15,000
Total Fixed Costs 1,64,000 1,64,000
Total Costs (i) + (ii) 5,34,800 7,20,200
Cost per Unit 133.70 120.03
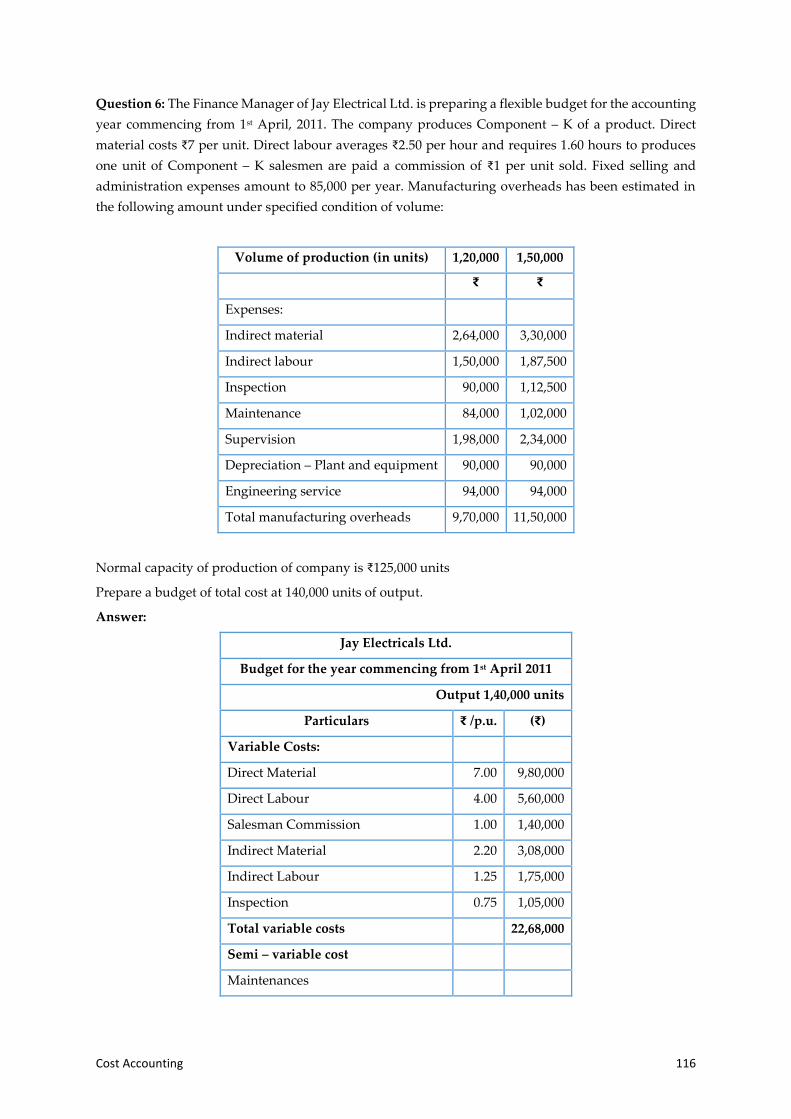
Cost Accounting 116
Question 6: The Finance Manager of Jay Electrical Ltd. is preparing a flexible budget for the accounting
year commencing from 1st April, 2011. The company produces Component – K of a product. Direct
material costs ₹7 per unit. Direct labour averages ₹2.50 per hour and requires 1.60 hours to produces
one unit of Component – K salesmen are paid a commission of ₹1 per unit sold. Fixed selling and
administration expenses amount to 85,000 per year. Manufacturing overheads has been estimated in
the following amount under specified condition of volume:
Volume of production (in units) 1,20,000 1,50,000
₹ ₹
Expenses:
Indirect material 2,64,000 3,30,000
Indirect labour 1,50,000 1,87,500
Inspection 90,000 1,12,500
Maintenance 84,000 1,02,000
Supervision 1,98,000 2,34,000
Depreciation – Plant and equipment 90,000 90,000
Engineering service 94,000 94,000
Total manufacturing overheads 9,70,000 11,50,000
Normal capacity of production of company is ₹125,000 units
Prepare a budget of total cost at 140,000 units of output.
Answer:
Jay Electricals Ltd.
Budget for the year commencing from 1st April 2011
Output 1,40,000 units
Particulars ₹ /p.u. (₹)
Variable Costs:
Direct Material 7.00 9,80,000
Direct Labour 4.00 5,60,000
Salesman Commission 1.00 1,40,000
Indirect Material 2.20 3,08,000
Indirect Labour 1.25 1,75,000
Inspection 0.75 1,05,000
Total variable costs 22,68,000
Semi – variable cost
Maintenances

Budget and Budgetary Control 117
Fixed 0.0857 12,000
Variable 0.60 84,000
Supervision
Fixed 0.60 54,000
Variable 1.20 1,68,000
Total Semi – Variable Costs 3,18,000
Fixed costs
Selling and Administration Expenses 85,000
Depreciation: Plant and equipment 90,000
Engineering services 94,000
Total fixed costs 2,69,000
Total Cost 28,55,000
Working Notes
1. Maintenance Cost 84,000
𝑉𝐶 𝑝, 𝑢. =
𝐶ℎ𝑎𝑛𝑔𝑒 𝑖𝑛 𝐶𝑜𝑠𝑡
𝐶ℎ𝑎𝑛𝑔𝑒 𝑖𝑛 𝑜𝑢𝑡𝑝𝑢𝑡
18,000
30,000
0.60
₹0.60 per unit
Total VC for 1,20,000 units 1,20,000 × 0.60 72,000
Total Fixed Cost 84,000 – 72,000 12,000
2. Supervision cost 198,000
𝑉𝐶 𝑝. 𝑢. =
𝐶ℎ𝑎𝑛𝑔𝑒 𝑖𝑛 𝐶𝑜𝑠𝑡
𝐶ℎ𝑎𝑛𝑔𝑒 𝑖𝑛 𝑜𝑢𝑡𝑝𝑢𝑡
36,000
30,000
1.20
Total VC for 1,20,000 units 1,20,000 ×1.20 144,000
Total Fixed Cost ₹54,000
Cash Budget
Question 7:
On 30th September, 2019, the B/S of M Ltd., (retailer) was as under
Equity shares of ₹10 each 20,000 Equipment (at cost) 20,000
Reserves 10,000 (-) Depreciation 5,000 15,000
Trade Creditors 40,000 Stock 20,000
Proposed Dividend 15,000 Trade Debtors 15,000
Balance at bank 35,000
85,000 85,000
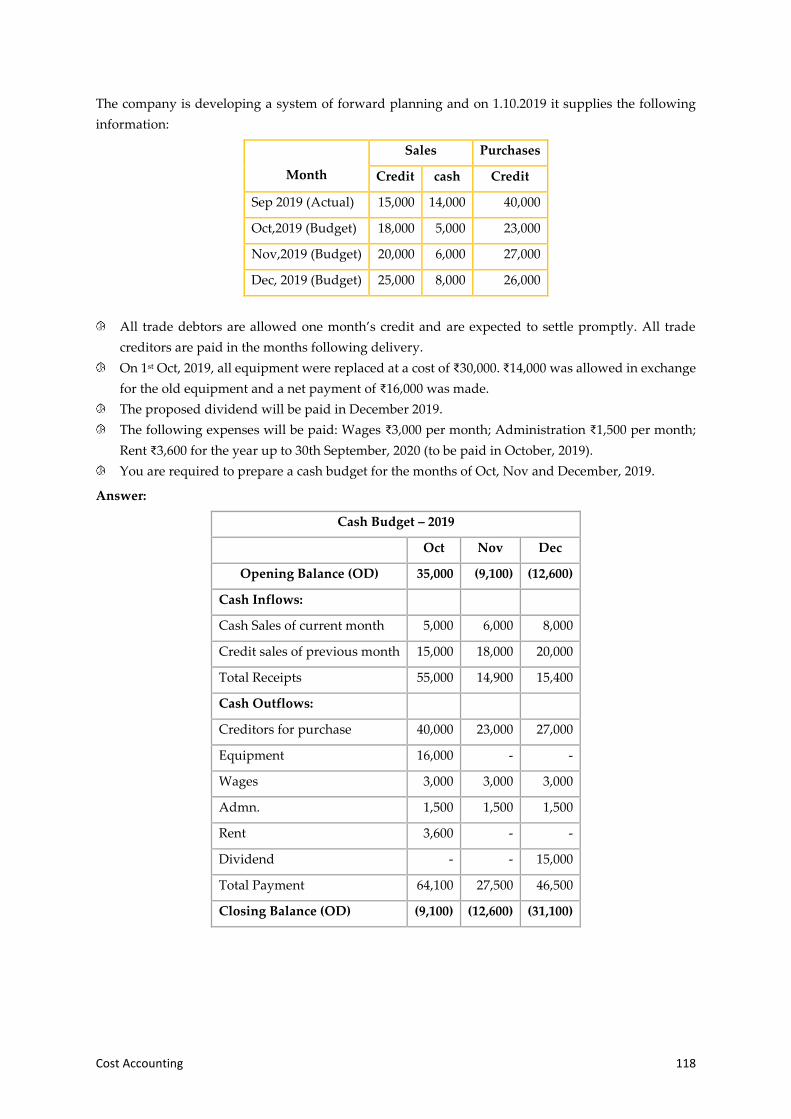
Cost Accounting 118
The company is developing a system of forward planning and on 1.10.2019 it supplies the following
information:
Month
Sales Purchases
Credit cash Credit
Sep 2019 (Actual) 15,000 14,000 40,000
Oct,2019 (Budget) 18,000 5,000 23,000
Nov,2019 (Budget) 20,000 6,000 27,000
Dec, 2019 (Budget) 25,000 8,000 26,000
All trade debtors are allowed one month’s credit and are expected to settle promptly. All trade
creditors are paid in the months following delivery.
On 1st Oct, 2019, all equipment were replaced at a cost of ₹30,000. ₹14,000 was allowed in exchange
for the old equipment and a net payment of ₹16,000 was made.
The proposed dividend will be paid in December 2019.
The following expenses will be paid: Wages ₹3,000 per month; Administration ₹1,500 per month;
Rent ₹3,600 for the year up to 30th September, 2020 (to be paid in October, 2019).
You are required to prepare a cash budget for the months of Oct, Nov and December, 2019.
Answer:
Cash Budget – 2019
Oct Nov Dec
Opening Balance (OD) 35,000 (9,100) (12,600)
Cash Inflows:
Cash Sales of current month 5,000 6,000 8,000
Credit sales of previous month 15,000 18,000 20,000
Total Receipts 55,000 14,900 15,400
Cash Outflows:
Creditors for purchase 40,000 23,000 27,000
Equipment 16,000 - -
Wages 3,000 3,000 3,000
Admn. 1,500 1,500 1,500
Rent 3,600 - -
Dividend - - 15,000
Total Payment 64,100 27,500 46,500
Closing Balance (OD) (9,100) (12,600) (31,100)

Budget and Budgetary Control 119
Question 8: ABC Ltd. provides you the following information:
(i) ABC Ltd. provides you the following information:
Sales Purchases etc. ₹
Particulars April May June July August September
Cash sales 8,000 12,000 16,000 20,000 24,000 28,000
Collection from debtors 16,000 32,000 48,000 64,000 80,000 96,000
Cash purchases 8,000 12,000 16,000 20,000 24,000 28,000
Payment to creditors 12,000 24,000 36,000 48,000 60,000 72,000
Payment of expenses 12,000 5,000 7,800 2,950 27,000 20,000
The opening cash balance of ₹10,000 is the minimum cash balance to be maintained.
1. Any short fall in the minimum cash balance is to be met by Bank borrowings in the multiple of
₹5,000 @ 12% p.a. or by sale of marketable securities in the multiple of ₹10,000. Bank interest on
monthly basis is payable on the first date of the subsequent month. Bank interest is payable for a
minimum period of a month.
2. Any surplus cash is to be used to repay the borrowings in the multiple of ₹5,000 or to purchase the
marketable securities in the multiple of ₹10,000 (ignore interest on securities received and paid).
Required: Prepare the Cash Budget for April to September
Answer:
Cash Budget for April to September ₹
Particulars April May June July August September
A. Total Cash available:
Opening cash balance 10,000 12,000 14,900 14,000 12,000 15,000
Cash sales 8,000 12,000 16,000 20,000 24,000 28,000
Collection from debtors 16,000 32,000 48,000 64,000 80,000 96,000
34,000 56,000 78,900 98,000 1,16,000 1,39,000
B. Total Cash Payments:
Cash purchases 8,000 12,000 16,000 20,000 24,000 28,000
Payment to creditors 12,000 24,000 36,000 48,000 60,000 72,000
Payment of expenses 12,000 5,000 7,800 2,950 27,000 20,000
32,000 41,000 59,800 70,950 1,11,000 1,20,000
C. Surplus (Deficit) [A – B] 2,000 15,000 19,100 27,050 5,000 19,000
Financing and investment:
D Borrowings 10,000 - - - - -
E Sales of securities - - - - 10,000 -
F (-) Repayment of borrowings - - 5,000 5,000 - -
G (-) Interest on borrowings - 100 100 50 - -
H (-) Purchase of securities - - - 10,000 - -
I. Closing cash balance
[C +D +E – F – G –H]
12,000
14,900
14,000
12,000
15,000
19,000