cortical thickness and serum nfl explain cognitive
TRANSCRIPT
ARTICLE OPEN ACCESS
Cortical Thickness and Serum NfL ExplainCognitive Dysfunction in Newly DiagnosedPatients With Multiple SclerosisAlvaro J Cruz-Gomez PhD Lucıa Forero MD Elena Lozano-Soto BSc Fatima Cano-Cano BSc
Florencia Sanmartino BSc Raul Rashid-Lopez MD Jse Paz-Exposito MD PhD Jaime D Gomez Ramirez PhD
Raul Espinosa-Rosso MD and Javier J Gonzalez-Rosa PhD
Neurol Neuroimmunol Neuroinflamm 20218e1074 doi101212NXI0000000000001074
Correspondence
Dr Gonzalez-Rosa
javierrosaucaes
AbstractBackground and ObjectivesTo determine the relative importance of global or regional MRI and blood markers of neu-rodegeneration and neuroaxonal injury in predicting cognitive performance for recently di-agnosed patients with multiple sclerosis (MS)
MethodsThirty-five newly diagnosed patients with relapsing-remitting MS (RRMS) and 23 healthycontrols (HCs) simultaneously completed a full clinical and neuropsychological assessmentstructural brain MRI and serum neurofilament light chain (sNfL) level test Linear regressionanalyses were performed to determine which global or regional measures of gray matter (GM)atrophy and cortical thickness (CT) in combination with sNfL levels and clinical scores aremost strongly related to neuropsychological impairment
ResultsCompared with HCs patients with MS showed bilateral thalamic GM atrophy (left p = 0033right p = 0047) and diminished CT particularly in the right superior and transverse temporalgyri (p = 0045 p = 0037) Regional atrophy failed to add predictive variance whereas anxietysymptoms sNfL and global CT were the best predictors (R2 = 0404 p lt 0001) of cognitiveoutcomes with temporal thickness accounting for greater variance in cognitive deficits thanglobal CT
DiscussionThalamic GM atrophy and thinning in temporal regions represent a distinctive MRI trait in theearly stages of MS Although sNfL levels alone do not clearly differentiate HCs and patientswith RRMS in combination with global and regional CT sNfL levels can better explain thepresence of underlying cognitive deficits Hence cortical thinning and sNfL increases can beconsidered 2 parallel neurodegenerative markers in the pathogenesis of progression in newlydiagnosed patients with MS
From the Institute of Biomedical Research and Innovation of Cadiz (INiBICA) (AJC-G LF EL-S FC-C FS RR-L JDGR RE-R JJG-R) Cadiz Spain Psychology Department(AJC-G EL-S FS JDGR JJG-R) University of Cadiz Spain Neurology Department (LF RR-L RE-R) Puerta del Mar University Hospital Cadiz Spain and RadiodiagnosticDepartment (JP-E) Puerta del Mar Hospital Cadiz Spain
Go to NeurologyorgNN for full disclosures Funding information is provided at the end of the article
The Article Processing Charge was funded by Spanish Ministry of Science Innovation and Universities and the Institute of Biomedical Research and Innovation of Cadiz (INiBICA)
This is an open access article distributed under the terms of the Creative Commons Attribution-NonCommercial-NoDerivatives License 40 (CC BY-NC-ND) which permits downloadingand sharing the work provided it is properly cited The work cannot be changed in any way or used commercially without permission from the journal
Copyright copy 2021 The Author(s) Published by Wolters Kluwer Health Inc on behalf of the American Academy of Neurology 1
Neuroimaging studies using MRI have reported associationsbetween the severity of cognitive dysfunction inmultiple sclerosis(MS) and structural measures of neuronal damage highlightinggraymatter (GM) atrophy as one of the best radiologic predictorsof cognitive impairment severity and development1 In thisregard several studies have revealed that subcortical GM atrophyis already detectable at initial disease stages and is strongly cor-related with MS patientsrsquo clinical and cognitive status23
Cortical atrophy has also been suggested to represent a com-mon phenomenon in the course of MS and recent evidencesupports its association with cognitive dysfunction especiallywhen surface-based measures such as cortical thickness (CT)are used rather than traditional volume-based measures4-6
Although both measures are correlated between them theymay provide complementary information regarding corticalstructure reflecting differential GM morphologic alterations7
Nevertheless studies addressing the regional effects of CT oncognitive function are limited especially in mildly disabledpatients with relapsing-remitting MS (RRMS)
More recently the concentration of serum neurofilamentlight chain (sNfL) a component of the axonal cytoskeletonessential to maintain the structural integrity of neuronalcells has sparked considerable interest as a blood-basedbiomarker to easily detect neurodegeneration and monitordisease progression in different neurologic diseases8-11 in-cluding MS1213 Within this framework an increasingnumber of studies have demonstrated that compared withhealthy populations patients with MS exhibit higher sNfLconcentrations which are also associated with clinical dis-ability and radiologic measures of disease activity such asbrain atrophy and lesion load13-15
Unfortunately to date studies assessing the direct re-lationship between sNfL levels and cognitive function in MSare scarce or have only included patients with long-standingand progressive MS16 therefore the role of sNfL levels as analternate biomarker for cognitive status remains controver-sial17 However recent longitudinal studies have demon-strated that higher sNfL levels are associated with thedevelopment of brain atrophy in different neurologicdiseases1018 a finding that points to a close relationship
between increased brain atrophy resulting from ongoingaxonal loss and higher sNfL levels and highlights the im-portance of the changes in this relationship over time
Although the direct involvement of GM volume and CT incognitive dysfunction in MS has been suggested it remainselusive how sNfL concentration as a measure of neuroaxonalinjury could ultimately contribute to this cognitive decline Inthe present study the specific contributions of clinical andpsychiatric assessment data of well-established MRI-basedglobal and regional measures reflecting macrostructural dam-age and of a biological marker of neuroaxonal damage(ie sNfL levels) in explaining cognitive abnormalities in newlydiagnosed and slightly disabled patients with MS were in-vestigated First we explore whether global MRI measures ofatrophy and cortical thinning together with sNfL and clinicaland psychiatric variables explained cognitive dysfunction inpatients with MS Second we asked whether replacing theseglobal MRI measures regional-specific MRI measures of at-rophy and cortical thinning accounted for additional predictivevariance of cognitive abnormalities Establishing a joint modelbetween subcortical GM atrophy CT and sNfL levels wouldprovide updated brain structural biomarkers underlying cog-nitive dysfunction at the initial stages of MS
MethodsStudy ParticipantsThirty-five patients diagnosed with clinically definite RRMSaccording to the McDonald criteria19 were recruited from theHospital Universitario Puerta del Mar of Cadiz Patients withRRMSwere enrolled in this cross-sectional study based on thefollowing criteria (1) aged between 18 and 58 years (2)having been diagnosed with MS within 4 years (3) having amild physical disability (Expanded Disability Status Scale[EDDS] score equal to or less than 35) and (4) relapse andsteroid free for at least 2 months before the study In addition23 participants with no history of neurologic or psychiatricdysfunction were included as healthy controls (HCs)Handedness was assessed by the Edinburgh Handedness In-ventory20 Clinical and neuropsychological measures serumsampling and MRI were all performed in 2 separate sessions(months between tests 34 plusmn 31)
GlossaryBDI = Beck Depression Inventory BPF = brain parenchymal fraction BRB-N = Brief Repeatable Battery of NeuropsychologicalTests CAT = Computation Anatomy Toolbox CI = cognitively impaired CP = cognitively preserved CT = cortical thicknessEDSS = Expanded Disability Status Scale FDR = false discovery rate FIRST = FMRIBrsquos Integrated Registration andSegmentation Tool FLAIR = fluid-attenuated inversion recovery FSS = fatigue severity scale GM = gray matter GMF = graymatter fraction HC = healthy control IFOG = inferior frontal orbital frontal gyrus MS = multiple sclerosis NI =neuropsychological impairmentROI = regions of interestRRMS = relapsing-remittingmultiple sclerosis SDMT = Symbol DigitModalities Test secondary progressiveMS sNfL = serum neurofilament light chain SP = secondary progressive SRT = SelectiveReminding Test STAI = State-Trait Anxiety Inventory TTG = transverse temporal gyrus WM = white matter ZG = globalcognitive Z score
2 Neurology Neuroimmunology amp Neuroinflammation | Volume 8 Number 6 | November 2021 NeurologyorgNN
Standard Protocol Approvals Registrationsand Patient ConsentsThe protocol for the present study was approved by the Andalu-sian Biomedical Research Ethics Committee (Ref LFD-VIT-2018-01) All participants provided informed written consent be-fore participation in accordance with the Declaration of Helsinki
Neurologic ExaminationPatients selected for the present study underwent a neuro-logic assessment that included the EDSS21 timed 25-footwalk test and 9-hole peg test Clinical and demographic in-formation on patient characteristics and prescribed disease-modifying therapy was noted for all patients
Neuropsychological AssessmentAll participants were assessed using (1) the Brief RepeatableBattery of Neuropsychological Tests (BRB-N) validated for theSpanish population22 (2) the Matrix Reasoning Subtest of theWechsler Adult Intelligence Scale (III) to determine the IQ23(3) the Fatigue Severity Scale (FSS)24 (4) the Beck DepressionInventory (BDI)25 and (5) the State-Trait Anxiety Inventory(STAI)26
For each subtest of the BRB-N Z scores were calculated foreach patient using themean and SD obtained for the HC group
(Z score = Raw score minus HC meanHC SD) Subsequently aglobal cognitive Z (ZG) score was obtained for each partici-pant averaging 9 Z scores from each subtest of the BRB-N
sNfL Level AnalysisBlood samples were collected in clot-activating serum separatortubes centrifuged for 10 minutes at 1500g to separate serum andproperly stored at minus80degC The resulting serum was aliquoted andproperly stored at minus80degC until analysis sNfL concentrations weremeasured using a new high-sensitivity sandwich ELISAmethod forhuman samples (Aviva Systems Biology San Diego) according tothe manufacturerrsquos instructions All patient samples were appro-priately diluted to fall in the range of the standard curve whereascontrol samples were not diluted The abovementioned methodhas been previously validated and is described in detail elsewhere8
MRI Data AcquisitionFor all subjects brain MRIs were collected using a 15 Tscanner (Philips Medical System Ingenia CX Best Nether-lands) The following sequences were acquired (1) sagittal T1-weighted 3Dmagnetization prepared rapid acquisition gradientecho (MPRAGE) sequence (repetition time [TR ]= 2200 msecho time [TE] = 3 ms flip angle = 15deg matrix = 256 times 256 times160 and voxel size = 1 times 1 times 1 mm) and (2) sagittal fluid-attenuated inversion recovery (FLAIR) 3D sequence (TR =
Table 1 Demographic and Clinical Characteristics of Participants
Variables RRMS HC HC vs RRMS (p values)
N 35 23 mdash
Age 3840 (1024) [18ndash57] 3543 (715) [25ndash48] 0232
Sex
Malefemale 1520 1013 0963
Female 5714 5652 mdash
Education y 1306 (320) [6ndash20] 1787 (249) [15ndash22] 0000a
EDSS median 10 (127) [0ndash35]
9HPT (s)
Dominant hand 2484 (469) [1506ndash3605] mdash mdash
Nondominant hand 2726 (837) [1780ndash5510] mdash mdash
T25FW (s) 892 (193) [605ndash1602]
Disease duration (y) 313 (162) [0ndash5]
DMT
None () 571 mdash mdash
First line () 5143 mdash mdash
Second line () 4286 mdash mdash
Abbreviations DMT = disease-modifying therapy EDSS = Expanded Disability Status Scale HC = healthy control RRMS = relapsing-remitting multiplesclerosis T25FW = timed 25-foot walk 9HPT = 9 Hole Peg Test (1) first-line modifying treatment glatiramer acetateinterferonsdimethyl fumarate (2)second-line modifying treatment natalizumabfingolimodValues are expressed as the mean and SD and [range] Student t tests for continuous variables and χ2 for categorical variables were performed to assesssignificant differences between groups (p values are included)a Significantly different at p lt 001
NeurologyorgNN Neurology Neuroimmunology amp Neuroinflammation | Volume 8 Number 6 | November 2021 3
6000ms TE = 354ms flip angle = 180deg matrix = 196 times 256 times160 and voxel size = 105 times 105 times 1 mm)
MRI Data Processing
Quantification of WM Lesion VolumesIn RRMS patientMRI scans FLAIR hyperintense white matter(WM) lesions were automatically segmented and quantified inmilliliters using the Lesion Segmentation Tool with the lesion
growth algorithm (applied-statisticsdelsthtml) To improvethe tissue segmentation step in subsequent image preprocess-ing forGMvolume assessments27 T1 hypointense lesionswerealso identified and filled using neighboring WM values inRRMS images using the same toolbox
Quantification of Global and Regional GM VolumesFMRIBrsquos Integrated Registration and Segmentation Tool(fmriboxacukfslfirst) which is part of the FMRIB
Table 2 Neuropsychological and Global MRI Characteristics of Participants
Variables RRMS HC HC vs RRMS (p values)
Manipulative IQ
Matrix design (WAIS-III) 10357 (1407) 11022 (1266) 0073
Fatigue severity
FSS 4260 (1473) 2622 (1135) 0000a
Depression
BDI-II 1717 (1024) 704 (590) 0000a
Anxiety
STAI-state 2460 (1258) 1809 (993) 0041b
STAI-trait 2874 (1423) 1930 (1158) 0010b
BRB-N
SDMT 5537 (1424) 6300 (1397) 0110
PASAT 3 s 4086 (1173) 4809 (873) 0017b
SRT long-term storage 4863 (1081) 5604 (967) 0001a
SRT consistent long-term retrieval 4109 (1331) 4978 (1229) 0010b
SRT delayed recall 891 (234) 1022 (168) 0009a
1036 SPART long-term storage 1983 (622) 2230 (389) 0147
1036 SPART delayed recall 689 (285) 809 (190) 0105
Phonetic Fluency (F) 1123 (463) 1300 (328) 0146
Semantic Fluency (animals) 2066 (557) 2370 (455) 0053
MRI global measures
FLAIR WM lesion volume (mL) 402 (588) mdash mdash
BPF 079 (004) 081 (003) 0167
GMF 044 (031) 045 (025) 0315
Global cortical thickness (mm) 265 (011) 273 (010) 0010b
Serum neurofilament light levels
sNfL (pgmL) 4448 (2770) 3328 (1647) 0087
sNfL (median interquartile range) 38 (31ndash51) 36 (20ndash42) mdash
Abbreviations BDI = Beck Depression Inventory BPF = brain parenchymal fraction BRB-N = Brief Repeatable Battery of Neuropsychological Tests FSS =Fatigue Severity Scale GMF = gray matter fraction HC = healthy control PASAT = Paced Auditory Serial Addition Test RRMS = relapsing-remitting multiplesclerosis SDMT= Symbol DigitModalities Test sNfL = serumneurofilament light SPART = Spatial Recall Test SRT = Selective Reminding Test STAI = State-TraitAnxiety Inventory WAIS = Wechsler Adult Intelligence Scale WM = white matterValues are expressed as themean and SD Student t tests for continuous variables were performed to assess significant differences between groups (p valuesare included) Analysis of covariance design was used to assess BRB-N score comparisons including educational level was included as a nuisance covariatea Significantly different at p lt 001b Significantly different at p lt 005
4 Neurology Neuroimmunology amp Neuroinflammation | Volume 8 Number 6 | November 2021 NeurologyorgNN
Software Library was used to obtain regional GM volumes ofsubcortical structures (including the caudate putamenglobus pallidus thalamus hippocampus amygdala and nu-cleus accumbens) and subsequently corrected for brainvolume28
Voxel-based morphometry analysis was performed using theComputation Anatomy Toolbox (CAT-12 version 126 r1450)with the current version of Statistical Parametric Mapping (12filionuclacukspm) To this end T1-3D images were firstvisually inspected for artifacts and then preprocessed followingstandard steps suggested in the CAT-12 manual including (1)bias-field correction (2) segmentation into GMWM and CSF(3) registration to a standard template using the DARTEL al-gorithm (4) normalization of GM images to the MontrealNeurological Institute template and (5) modulation of thenormalized data GM regional volumes of cortical areas of in-terest were extracted using the Neuromorphometrics atlas(neuromorphometricscom) and corrected for total intracranialvolume
The brain parenchymal fraction (BPF) was determined throughtissue-specific maps obtained in the segmentation step The BPFwas calculated by dividing the sumofGMandWMsegmentationmaps by the intracranial volume (sum of WM GM and CSFvolumes) as an index of global atrophy TheGM fraction (GMF)
was also obtained following the same procedure dividing GM byintracranial volume as an index of global specific GM atrophy
Quantification of Global and Regional CT ValuesCT was also assessed using the CAT-12 toolbox a fully auto-mated method that uses tissue segmentation to estimate dis-tances between WM and GM voxels based on the projection-based thickness method29 including topology correction andspherical mapping In addition to global CTmeasures regionalCT values were extracted using the Desikan-Killiany atlas30
Statistical AnalysisSPSS 240 (IBM Armonk NY) was used to analyze clinicalneuropsychological and global radiologic measures After veri-fying the normal distribution of all continuous variables(Shapiro-Wilk test) analysis of variance parametric Student ttest and nonparametric Mann-Whitney U test were performedas appropriate for continuous variables and χ2 was used forcategorical variables Two analysis of covariance designs fol-lowing a general linear model were used to compare neuro-psychological scores and subcortical GM volumes betweengroups including educational level and total brain volume asnuisance covariates respectively Regarding analyses of corticalregions of interest (ROI) significant differences between groupsin volume and CT in areas defined by the atlases were assessedusing the Analyze ROI function included in the CAT-12
Table 3 Subcortical GM Volumes in Cubic Millimeters Obtained Using FIRST in Each Experimental Group and SignificantDifferences Between Groups Corrected for Total Brain Volume
Variables RRMS HC HC vs RRMS (p values)
Left thalamus 551172 (62088) 606318 (56841) 0033a
Right thalamus 534637 (62533) 585915 (50712) 0047a
Left accumbens 30048 (8634) 29417 (10943) 0132
Right accumbens 22455 (7175) 22029 (9017) 0120
Left caudate 235151 (42641) 260204 (27112) 0233
Right caudate 247238 (38814) 261660 (39162) 0703
Left pallidum 94183 (12696) 91834 (19467) 0387
Right pallidum 91481 (11133) 91168 (19855) 0917
Left putamen 279301 (49557) 288403 (36929) 0238
Right putamen 276579 (49814) 285186 (33008) 0278
Left hippocampus 271139 (39586) 282425 (47394) 0769
Right hippocampus 261336 (3587) 269241 (38251) 0812
Left amygdala 90072 (15974) 101721 (18652) 0075
Right amygdala 80881 (2223) 91112 (22517) 0287
Abbreviations FIRST = FMRIBrsquos Integrated Registration and Segmentation Tool GM = gray matter HC = healthy control RRMS = relapsing-remitting multiplesclerosisValues are expressed as themeans and SD ANCOVA design following a general linear model was used to compare subcortical GM volumes between groupsand including total brain volume was included as a nuisance covariate in all comparisons (p values are included)a Significantly different at p lt 005
NeurologyorgNN Neurology Neuroimmunology amp Neuroinflammation | Volume 8 Number 6 | November 2021 5
toolbox Data were corrected formultiple comparisons using thefalse discovery rate (FDR) and Holm-Bonferroni methods
Pearson and Spearman correlation analyses were performed toassess significant relationships between variables of interest(ie clinical sNfL and radiologic measures) In addition to
further evaluate the subsequent relationship between sNfL andcognitive status patients with MS were split into 2 MS subgroupsbased on the presence of neuropsychological impairment (NI)The cutoff for failure in each neuropsychological test was definedhere as a score below 15 SD from the mean score of the HCgroup with NI then defined considering the number of failed
Figure 1 Regional Analyses of GM Volume and CT Differences Between Groups
(A) Example of FIRST deepGM structure segmentation in subject space Comparedwith HCs patientswith RRMS showed a significant reduction in the left andright thalami (B) Neuromorphometrics atlas used for cortical GM volume analysis in which compared with HCs patients with RRMS showed a significantreduction in the left inferior frontal orbitofrontal gyrus GM volume after application of FDR multiple comparison correction After Holm-Bonferroni multiplecomparison corrections no significant effects were observed (C) Desikan-Killiany atlas used for regional CT analysis in which patients with RRMS showed asignificant reduction in CT in bilateral temporal parietal and frontal areas compared with HCs after FDR multiple comparison correction After Holm-Bonferroni multiple comparison correction patients with RRMS showed a significant reduction in CT only in the right TTG and right STG compared with HCsCT = cortical thickness FDR = false discovery rate FIRST = FMRIBrsquos Integrated Registration and Segmentation Tool GM = gray matter HC = healthy controlRRMS = relapsing-remitting multiple sclerosis TTG = transverse temporal gyrus
6 Neurology Neuroimmunology amp Neuroinflammation | Volume 8 Number 6 | November 2021 NeurologyorgNN
tests by each patient Thus patients were classified as cognitivelypreserved (CP-RRMS n = 17) if they had not failed or failedbetween 0 and 1 tests and as cognitively impaired (CI-RRMS n =18) if they failed 2 or more tests
Linear regressionmodeling analyses were performed to identifythe contribution of sNfL levels and demographic clinicalpsychiatric and radiologic variables (including global and re-gional measures of GM volume and CT) as predictors of globalneuropsychological status (ZG) scores Only those de-mographic and clinical variables that showed a significantcorrelation (p lt 005) with ZG scores were entered in a step-wise fashion into 2 linear regression models to determine thestrongest variable predictors of ZG in our RRMS sample Inaddition to those variables that fulfilled this criterion only MRIvariables measures that were statistically different betweengroups were entered in the regression analysis Specifically thefirst regression model only included global MRI measureswhereas the second model only involved regional MRI mea-sures (volumes and CT) A p value lt 005 was consideredstatistically significant
Data AvailabilityThe anonymized raw data analyzed in the present study areavailable on reasonable request to the corresponding authorfor purposes of replicating procedures and results
ResultsDemographic and Clinical EvaluationIndividuals in both groups were age and sex matched never-theless the HC group had more years of schooling than theRRMS group (p lt 005) Accordingly all further analyses in-volving variables of interest were corrected for education levelThe RRMS patient sample exhibited low accumulation of dis-ability (EDDS median 10) and a few years of disease duration(mean 313 years) Table 1 summarizes the main demographicand clinical characteristics of HCs and patients with RRMS
Neuropsychological AssessmentTable 2 summarizes neuropsychological results Notablythere were no significant differences between groups in ma-nipulative IQ However patients with RRMS exhibited higher
Table 4 Significant Differences Between Regional GM Cortical Volumes and CT Measures in the Contrast of HealthyControls gt Patients With RRMS
VariablesHC gt RRMS (FDR corrected)p values
HC gt RRMS (Holm-Bonferroni corrected)p values
GM cortical regional volumes (normalized for brain volume)
Left inferior frontal orbital gyrus 0031 ns
CT regional values
Left transverse temporal gyrus 0026 ns
Right transverse temporal gyrus 0023 0037
Left superior temporal gyrus 0026 ns
Right superior temporal gyrus 0023 0045
Right middle temporal gyrus 0026 ns
Right banks of superior temporal sulcus 0030 ns
Left supramarginal gyrus 0026 ns
Right supramarginal gyrus 0026 ns
Left insula 0045 ns
Right insula 0045 ns
Left inferior frontal gyrus (pars opercularis) 0026 ns
Left inferior frontal gyrus (pars orbitalis) 0046 ns
Right caudal middle frontal gyrus 0026 ns
Right superior frontal gyrus 0035 ns
Right inferior parietal gyrus 0031 ns
Right superior parietal gyrus 0045 ns
Abbreviations CT = cortical thickness GM = gray matter HC = healthy control ns = nonsignificant RRMS = relapsing-remitting multiple sclerosisStudent t test p values are provided for significant differences The false discovery rate (FDR) andHolm-Bonferroni corrections formultiple comparisons wereapplied
NeurologyorgNN Neurology Neuroimmunology amp Neuroinflammation | Volume 8 Number 6 | November 2021 7
scores for fatigue (FSS) depression (BDI) and anxiety(STAI) than HCs Regarding cognitive measures patientswith RRMS had poorer performance on tests involving bothinformation processing speedworking memory (Paced Au-ditory Serial Addition Test 3) and verbal episodic memory(including Selective Reminding Test storage retrieval anddelayed recall scores) corrected for educational level At theindividual level 257 of patients with RRMS did not fail anyBRB-N test 229 failed 1 test and 514 failed 2 or moresubtests
Radiologic ResultsPatients with RRMS showed a FLAIR hyperintensity meanlesion volume of 377 plusmn 586 mL Although no significantdifferences between groups were observed in global atrophyvolume-based measures (BPF and GMF Table 2) regionalanalysis of subcortical GM volumes showed a significant re-duction in left (p = 0033) and right thalami (p = 0047) inpatients with RRMS compared with HCs (Table 3 andFigure 1A) Inverse contrast (patients with RRMS gtHCs) didnot yield any significant results Comparing regional corticalvolume-based analysis using the Neuromorphometrics atlasbetween the RRMS and HC groups there was only 1 signif-icant difference reflected in a reduced GM volume in leftinferior frontal orbital frontal gyrus (IFOG) (FDR-adjustedp = 0031 Table 4 and Figure 1B)
Regarding surface-based measures patients with RRMS dis-played a significant reduction in global CT compared withHCs
(Table 2) More specifically regional analysis (following FDRcorrection) indicated that patients with RRMS exhibitedwidespread cortical thinning that affected bilateral temporalparietal and frontal areas compared with HCs (Table 4 andFigure 1C for further details) Subsequent conservative analysis(following Holm-Bonferroni correction) retained a significantCT reduction only in the RRMS group in the right transversetemporal gyrus (TTG p = 0037) and right superior temporalgyrus (STG p = 0045) Inverse contrast (patients with RRMSgt HCs) did not yield any significant results
sNfL ResultsThe median (interquartile range) sNfL level was higher inpatients with RRMS (38 [31ndash51]) than in HCs (36 [20ndash42])Although patients with RRMS also exhibited increased meanconcentrations of sNfL levels only a statistical trend towardsignificance was observed (p = 0087) (Table 2)
Regarding the presence or absence of NI a group effect wasobserved (F255 = 3533 p = 0036) Post hoc tests revealedsignificantly increased sNfL levels in the CI-RRMS subgroupcompared with HCs (Bonferroni-corrected p = 0036) butnot to the CP-RRMS subgroup or between both RRMSsubgroups
sNfLndashMRIndashNeuropsychological Relationshipsin Patients With RRMSsNfL levels correlated with both the total number of failed tests(ρ = 0437 p = 0009) and with global neuropsychological
Table 5 Correlations Between ZG Scores andDemographic Clinical and Radiologic Variables in all Participants and in theRRMS Group
Variables
ZG (all participants) ZG (RRMS group)
r ρ p Values r ρ p Values
Age minus0335 0010 minus0345 0043
Educational level 0419 0001 0372 0028
EDSS mdash mdash minus0375 0027
FSS minus0311 0017 ns ns
BDI minus0383 0003 minus0365 0031
STAI-S minus0350 0007 minus0407 0015
sNfL minus0346 0008 minus0336 0047
Left thalamus GM volume 0303 0021 ns ns
Right thalamus GM volume 0280 0034 ns ns
Mean CT 0455 0000 0337 0048
Right TTG CT 0305 0020 ns ns
Right STG CT 0315 0016 ns ns
Abbreviations BDI = Beck Depression Inventory CT = cortical thickness = STG = superior temporal gyrus EDSS = Expanded Disability Status Scale FSS =Fatigue Severity Scale GM = gray matter = TTG = transverse temporal gyrus GM = gray matter HC = healthy control ns = nonsignificant RRMS = relapsing-remitting multiple sclerosis sNfL = serum neurofilament light STAI-S = State-Trait Anxiety Inventory State score ZG = global cognitive Z-scoreValues are expressed as Pearson (r) or Spearman (ρ) coefficients and p values
8 Neurology Neuroimmunology amp Neuroinflammation | Volume 8 Number 6 | November 2021 NeurologyorgNN
performance (r = minus0336 p = 0047) Importantly sNfL levelsdid not directly correlate with any clinical or radiologic (globalregional) measure The results showing significant correlationsbetween ZG scores and other relevant variables are summa-rized in Table 5
A first stepwise multiple regression analysis was performed todetermine whether candidate variables (age educational levelEDSS FSS BDI STAI-S mean CT and sNfL) predicted ZGscores This model revealed that STAI-S sNfL levels and
global CT were the variables retained in the final modelpredicting neuropsychological performance (R2 = 0404 p lt0001 Figure 2A) To investigate the reliability of regionalmeasures as predictors in cognitive status a separate stepwisemultiple regression analysis was also performed as describedabove for the same data set of predictive variables and inwhich the candidate global MRI measures were replaced withregional measures significantly decreased (Holm-Bonferronicorrected) in the RRMS group compared with the HC group(ie leftright thalamic GM volumes and CT of the rightTTG and STG) This model retained the STAI-S score sNfLlevel and right TTG thickness as variables that best explainedneuropsychological performance in patients with RRMS (R2
= 0429 p lt 0001 Figure 2B)
DiscussionIn newly diagnosed patients with RRMS CT and sNfL mea-surements appear to be promising biomarker combinations fordetecting the presence of early cognitive disturbances In thepresent study we demonstrated that the sNfL level alone as ameasure of global neuroaxonal injury31 does not appear toproperly differentiate between newly diagnosed patients withRRMS and a healthy population or between patients with RRMScognitively preserved and displacing signs of NI However incombination with global and regional CT measurements whichare considered good direct indices of cortical morphology fordetecting neuronal loss or degradation both biomarkers couldreveal 2 parallel pathophysiologic processes underlying theneurodegenerative triggering of MS and predict early cognitivedeficits in the most common course of this disease
A striking result of our study was that sNfL levels although notobserved to significantly differentiate between newly diagnosedpatients with RRMS and HCs were retained in regressionmodels predicting NI in the RRMS group in combination withpsychiatric scores and CT measurements This finding suggeststhe potential use of sNfL levels as a complementary biomarker ofMS cognitive impairment at early stages of the disease and as arelevant measure in clinical settings Because the neurofilamentprotein is a major structural component of myelinated axons andis essential to maintain axonal caliber and to facilitate effectivenerve conduction the sNfL level has recently emerged as a usefulperipheral blood marker reflecting neuroaxonal damage and instudying neurodegeneration characteristics in MS and otherbrain-related diseases Thus higher plasma and sNfL levels havebeen associated with faster rates of brain atrophy and corticalneurodegeneration allowing us to predict disease progression atthe early stages of different neurologic conditions8-11
In MS baseline sNfL concentrations have also been shown tobe associated with different measures of structural braindamage predicting the progression of neurodegeneration anddisability in these patients1314 Importantly a close associa-tion between the temporal dynamics of sNfL levels and brainvolume loss over time in normal aging has been recentlydocumented31 suggesting that sNfL levels could further
Figure 2 Associations Between Regression StandardizedPredicted Values and Global Cognitive Status (ZGScores) in the RRMS Group
(A) Stepwise regression model retaining STAI state anxiety scores (β =minus0412 t = minus2969) sNfL levels (β = minus0367 t = minus2632) and global CT valuesCT (β = 0354 t = 2546) as significant predictors of global cognitive status (ZGscores) in the RRMS group (adjusted R2 = 0404 p lt 0001) (B) Stepwiseregression model including regional radiologic variables retaining STAIstate anxiety scores (β = minus0529 t = minus3751) sNfL levels (β = minus0419 t =minus3018) and right TTG thickness (β = 0409 t = 2853) as significant predictorsof global cognitive status (ZG scores) in the RRMS group (adjusted R2 = 0429p lt 0001) CT = cortical thickness RRMS = relapsing-remitting multiplesclerosis sNfL = serum neurofilament light chain TTG = transverse tem-poral gyrus ZG = global cognitive Z score
NeurologyorgNN Neurology Neuroimmunology amp Neuroinflammation | Volume 8 Number 6 | November 2021 9
reflect posterior-cortical deterioration rather than frontaldamage at least in Parkinson disease11 Likewise althoughevidence relating global or regional CT and sNfL is indeedscarce recent studies of patients with presymptomatic Alz-heimer disease have demonstrated that sNfL changes areclosely associated with both the rate of cortical thinning andcognitive changes10 emphasizing the potential role of thesNfL concentration as a primarymarker of neurodegenerationin patients with neurologic diseases and in patients with MS
Although preliminary evidence for an association betweensNfL concentrations and cognitive performance in MS hasbeen recently suggested this relationship has been exclu-sively observed in progressive forms of disease thus far16
Therefore sNfL levels have been suggested to be in-consistently related to neuropsychological performance inMS raising doubts about their use as a surrogate biomarkerof cognitive status in MS17 However remarkably our re-sults revealed that reduced sNfL concentrations were as-sociated with better neuropsychological functioning andthat their increase was also related to MS patients dis-playing NI Furthermore our data indicate that sNfL levelsin conjunction with CT measurements (rather than volumeor atrophy) may contribute to a better explanation ofcognitive performance in patients with RRMS Hence thecombination of multiple neurodegeneration biomarkersrather than the use of single ones appears to be a reason-able approach to their improve prognostic value
Notably anxiety-state scores in combination with other bio-markers also contributed to a prediction of neuropsychologicalperformance in our patient cohort highlighting the significanteffect of anxiety symptoms on cognition in patients with MS32
These findings are not surprising given that high prevalencerates of psychiatric comorbidity33 have been well documentedin patients with MS and underscore the importance of estab-lishing a psychiatric assessment in patients withMS from initialstages of the disease
Concerning radiologic measures we observed no significantdifferences between patients with RRMS and HCs in globalvolume-based measures of brain atrophy or GM atrophy(ie BPF or GMF respectively) Importantly a decreasedglobal CT was found in patients with RRMS compared withHCs suggesting that at least during the earliest stages of MSglobal conventional volume-based global measures may not besensitive enough to detect subtle structural changes primarilydriven by cortical thinning In this respect previous studieshave documented that FLAIR lesion volumes were associatedwith global CT reduction in patients with RRMS indicatingthat focal inflammatory processes in WM may be related atleast partially to the progression of cortical atrophy3435
At the regional level we demonstrated that GM volumereduction in RRMS was confined to the bilateral thalamiThese findings are consistent with previous evidence whichemphasizes thalamic atrophy as an early and sensitive
surrogate of neurodegeneration processes in MS2 Althoughthe cause of thalamic atrophy in MS is not fully understooddifferent studies have demonstrated that thalamic atrophymay be related to a high prevalence of periventricular WMlesions demyelination or transection of thalamic projectionfibers and subsequent axonal degeneration36 In the RRMSgroup the observed decreases in GM volume in the IFOG acrucial node in the frontoparietal network responsible forcognitive control and emotional processing were also in linewith the findings of previous studies37 and has been linked tothe presence of mood disturbances in patients with MS38
Furthermore although this volume-based approach did notreveal any other significant cortical GM volume reduction inour MS group regional analysis of CT revealed a significantthinning of right temporal areas specifically affecting theTTG and STG in the right hemisphere These findings arealso in agreement with those of a previous report on a similarcohort of recently diagnosed and mildly disabled patientswith RRMS4 Notably these differences were overlookedusing traditional volume-based methodology suggestingthat this approach may not be sensitive enough to detectregional cortical changes occurring during the first stages ofMS Of note 2 different atlases were used to obtain regionalcortical GM volumes and CT values Using a single atlas toquantify these 2 MRI measures is not straightforward be-cause there are substantial technical impediments to com-bine verticesvoxels-based atlases Hence we cannotcompletely confirm that the discrepancies found betweenregional GM volume and CT were due to the differentcortical parcellation methods implemented
Although the cortical thinning in the temporal lobe was moresignificant over the right hemisphere in our RRMS patientsample thinning of the left temporal cortex as well as CTreductions of parietal and frontal regions (Figure 1C) was alsoevident after a less conservative multiple comparisons correc-tion demonstrating the relevance of this common finding Ofinterest an association between temporal lobe thinning andlower cognitive performance has been previously demonstratedin patients with RRMS53940 In this association STG thinninghas been directly linked to poorer performance in tasksassessing visuospatial memory attention and informationprocessing speed540 Remarkably in our present study al-though global CT was also a significant predictor of cognitivestatus in the RRMS group replacing this measure with regionalright TTG thinning slightly increased the predictive value ofthe model and therefore accounted for greater variance inexplaining cognitive deficits than global CT
Accumulating evidence suggests that temporal lobe structuralchanges represent an important feature over the entire diseasecourse of MS In this regard the temporal GM volume lossrate has been suggested to be a surrogate marker for thetransition from the relapsing-remitting to the secondaryprogressive (SP) phase of the disease335 Likewise corticalthinning in temporal regions has been previously described innewly diagnosed and mildly disabled patients with RRMS
10 Neurology Neuroimmunology amp Neuroinflammation | Volume 8 Number 6 | November 2021 NeurologyorgNN
affecting the left hemisphere more severely46 Furthermorethe TTG as a primary area on the superior surface of thetemporal lobe appears to play a role in processing in-formation related to auditory and language input and speechunderstanding However the TTG has also been implicatedin higher-order cognitive functions and in receiving top-downinfluences of attention such as in the processing of speech-related cues that facilitate learning and perceiving new speechsounds41 and in memory mechanisms underlying stimuluscomparisons42 Hence our results underscore that specifickey brain regions involved in a wide variety of distributedcognitive processes appear to display a well-defined corticalthinning pattern In this pattern temporal lobe thinningprobably due to being adjacent to neocortical associationareas could be a potential fingerprint of underlying MS pa-thology from early stages of the disease Both the distributionpattern and the predominant site of occurrence of the dam-aging WM lesions observed in MS which evolves around thehorns of the ventricles within fiber connections and are par-ticularly noted in the frontal and temporal cortical areas43
may lead to remote retrograde changes that would result inthe subsequent diminished thickness of the TTG and othertemporal brain areas Consequently this damage may con-tribute to impairments of phonologic encoding workingmemory and verbal processing that are often prominent inthese patients
The present study had some limitations First we recruited aclinical sample composed exclusively of recently diagnosedand mildly disabled patients with RRMS A homogenoussample is often desirable in several studies however ourconclusions are not applicable in progressive subtypes of MSsuch as those with SP or the primary progressive subtypeSecond it can be considered another limitation that theoverall age range of ourMS cohort was large which was due tothe late onset of some patients (11) diagnosed after age 50years Accumulating evidence indicates that late-onset MSprevalencediagnoses have increased in recent decadesHowever although our patients withMS were similar in manycharacteristics (eg low EDSS scores) a more homogenousage range would have been desirable to minimize the possibleimpact of age Third a full characterization of cortical GMdamage in MS should include cortical lesions which wouldhave improved the potential scope of ourMRI assessment andconclusions Finally the potential value of the sNfL concen-tration as a marker of neuroaxonal injury in MS should con-sider the possible treatment effect13 because its reduction overtime or between patients and HCs could represent regressionto the mean as a consequence of disease-modifying treat-ments at the time of the assessment In this respect althoughall measures were collected in a reasonable short time perioda less variable intermeasurement interval would have alsobeen preferable to limit the impact that this could have in earlyMS However none of the patients with RRMS included inour study had a relapse or other significant clinical eventbetween neuropsychologicalblood sample testing and MRIexamination
In summary the results of the present study indicated thatsNfL levels reflect cortical neurodegeneration in recently di-agnosed in patients with RRMS In particular the associationof sNfL levels with cognitively impaired patients with MSsuggests the mirroring of pathologic mechanisms likely in-volved in the development of MS progression that in additionto the thinning of key cortical regions (rather that to regionalbrain volume measures) would be associated with the pres-ence cognitive dysfunction in early stages of the disease evenin patients with minimal physical disability Based on thesefindings and in accordance with recent new evidence wepostulate that the combination of biomarkers of both corticalmacro- (cortical thinning of temporal regions) and micro-structural (increased sNfL level) brain damage may mostclosely reflect subtle neurodegeneration changes and a strongassociation with the presence of first cognitive deficits innewly diagnosed patients with RRMS
AcknowledgmentThe authors thank the MS unit research staff and theNeuroradiology Department from the Puerta del MarUniversity Hospital for their assistance with recruitmentand data collection The authors especially want to thankpatients their families and healthy participants for theircollaboration
Study FundingThis work was supported by the European Regional De-velopment Fund and the Spanish Ministry of Science In-novation and Universities (grant RTI2018-096951-A-I00)and the Ministry of Economy and Competitiveness (grantRYC-2015-18467)
DisclosureAJ Cruz-Gomez and JD Gomez-Ramirez were supportedby 2 postdoctoral fellowships from the Department ofHealth of the Andalusia Health Service (grants PI-0025-2017 and PI-0034-2019) L Forero received speaker fees andtravel support from Biogen Merck Serono Novartis SanofiTeva and Roche E Lozano-Soto and F Sanmartino weresupported by the University of Cadiz through 2 predoctoralfellowships (UCA-PIF program) F Cano-Cano was sup-ported by the INiBICA through a predoctoral fellowship RRashid-Lopez was supported by a clinical researcher fel-lowship (grant PI-0025-2017) and received speaker feesand travel support from Teva AbbVie Zambon BIAL andItalfarmaco J Paz-Esposito had nothing to disclose REspinosa-Rosso received speaker fees and travel supportfrom Teva AbbVie Zambon BIAL Italfarmaco BiogenMerck Serono Novartis Sanofi and Roche JJ Gonzalez-Rosa was supported by a tenure-track ldquoRamon y Cajalrdquo re-search fellowshipgrant (RYC-2015-18467) Go to Neu-rologyorgNN for full disclosures
Publication HistoryReceived by Neurology Neuroimmunology amp NeuroinflammationFebruary 18 2021 Accepted in final form July 13 2021
NeurologyorgNN Neurology Neuroimmunology amp Neuroinflammation | Volume 8 Number 6 | November 2021 11
References1 Filippi M Rocca MA MR imaging of gray matter involvement in multiple sclerosis
implications for understanding disease pathophysiology and monitoring treatmentefficacy AJNR Am J Neuroradiol 201031(7)1171-1177
2 Azevedo CJ Cen SY Khadka S et al Thalamic atrophy in multiple sclerosis amagnetic resonance imaging marker of neurodegeneration throughout disease AnnNeurol 201883(2)223-234
3 Eshaghi A Prados F Brownlee WJ et al Deep gray matter volume loss drivesdisability worsening in multiple sclerosis Ann Neurol 201883(2)210-222
4 Narayana PA Govindarajan KA Goel P et al Regional cortical thickness in re-lapsing remitting multiple sclerosis a multi-center study Neuroimage Clin 20132120-131
5 Nygaard GO Walhovd KB Sowa P et al Cortical thickness and surface area relate tospecific symptoms in early relapsingndashremitting multiple sclerosis Mult Scler J 201521(4)402-414
6 Calabrese M Rinaldi F Mattisi I et al Widespread cortical thinning characterizespatients with MS with mild cognitive impairment Neurology 201074(4)321-328
7 Lemaitre H Goldman AL Sambataro F et al Normal age-related brain morpho-metric changes nonuniformity across cortical thickness surface area and gray mattervolume Neurobiol Aging 201233(3)617e1-617e9
8 Matıas-Guiu JA Gomez-Pinedo U Forero L et al Plasma neurofilament light chain inprimary progressive aphasia and related disorders clinical significance and metaboliccorrelates J Alzheimers Dis 201972(3)773-782
9 Rohrer JD Woollacott IO Dick KM et al Serum neurofilament light chain protein isa measure of disease intensity in frontotemporal dementia Neurology 201687(13)1329-1336
10 Preische O Schultz SA Apel A et al Serum neurofilament dynamics predicts neu-rodegeneration and clinical progression in presymptomatic Alzheimerrsquos disease NatMed 201925(2)277-283
11 Sampedro F Perez-Gonzalez R Martınez-Horta S Marın-Lahoz J Pagonabarraga JKulisevsky J Serum neurofilament light chain levels reflect cortical neurodegenerationin de novo Parkinsonrsquos disease Parkinsonism Relat Disord 20207443-49
12 Disanto G Barro C Benkert P et al Serum Neurofilament light a biomarker ofneuronal damage in multiple sclerosis Ann Neurol 201781(6)857-870
13 Kuhle J Kropshofer H Haering DA et al Blood neurofilament light chain as abiomarker of MS disease activity and treatment response Neurology 201992(10)e1007-e1015
14 Chitnis T Gonzalez C Healy BC et al Neurofilament light chain serum levelscorrelate with 10‐year MRI outcomes in multiple sclerosis Ann Clin Transl Neurol20185(12)1478-1491
15 Uher T Schaedelin S Srpova B et al Monitoring of radiologic disease activity byserum neurofilaments in MS Neurol Neuroimmunol Neuroinflamm 20207(4)e714
16 Kalatha T Arnaoutoglou M Koukoulidis T et al Does cognitive dysfunction cor-relate with neurofilament light polypeptide levels in the CSF of patients with multiplesclerosis J Int Med Res 201947(5)2187-2198
17 Aktas O Renner A Huss A et al Serum neurofilament light chain no clear relation tocognition and neuropsychiatric symptoms in stable MS Neurol Neuroimmunol Neu-roinflammation 20207(6)e885
18 Barro C Benkert P Disanto G et al Serum neurofilament as a predictor of diseaseworsening and brain and spinal cord atrophy in multiple sclerosis Brain 2018141(8)2382-2391
19 Polman CH Reingold SC Banwell B et al Diagnostic criteria for multiple sclerosis2010 revisions to the McDonald criteria Ann Neurol 201169(2)292-302
20 Oldfield RC The assessment and analysis of handedness the Edinburgh inventoryNeuropsychologia 19719(1)97-113
21 Kurtzke JF Rating neurologic impairment in multiple sclerosis an expanded disabilitystatus scale (EDSS) Neurology 198333(11)1444-1452
22 Sepulcre J Vanotti S Hernandez R et al Cognitive impairment in patients withmultiple sclerosis using the Brief Repeatable Battery-Neuropsychology test MultScler 200612(2)187-195
23 Wechsler D Wechsler Adult Intelligence Scale III TEA 200124 Krupp LB LaRocca NG Muir-Nash J Steinberg AD The fatigue severity scale
Application to patients with multiple sclerosis and systemic lupus erythematosus ArchNeurol 198946(10)1121-1123
25 Wideman TH Sullivan MJL Inada S et al Beck depression inventory (BDI) InEncyclopedia of Behavioral Medicine Springer New York 2013178-179
26 Spielberger CD Gorsuch RL Lushene R Vagg PR Jacobs GA Manual for the State-Trait Anxiety Inventory Consulting Psychologists Press 1983
27 Gelineau-Morel R Tomassini V Jenkinson M Johansen-Berg H Matthews PMPalace J The effect of hypointense white matter lesions on automated gray mattersegmentation in multiple sclerosis Hum Brain Mapp 201233(12)2802-2814
28 Patenaude B Smith SM Kennedy DN Jenkinson M A Bayesian model of shape andappearance for subcortical brain segmentation Neuroimage 201156(3)907-922
29 Dahnke R Yotter RA Gaser C Cortical thickness and central surface estimationNeuroimage 201365336-348
30 Desikan RS Segonne F Fischl B et al An automated labeling system for subdividingthe human cerebral cortex on MRI scans into gyral based regions of interest Neu-roimage 200631(3)968-980
31 Khalil M Pirpamer L Hofer E et al Serum neurofilament light levels in normalaging and their association with morphologic brain changes Nat Commun 202011(1)812
32 Vissicchio NA Altaras C Parker A et al Relationship between anxiety and cognitionin multiple sclerosis Int J MS Care 201921(4)151-156
33 Boeschoten RE Braamse AMJ Beekman ATF et al Prevalence of depression andanxiety inMultiple Sclerosis a systematic review and meta-analysis J Neurol Sci 201737331-341
Appendix Authors
Name Location Contribution
Alvaro JavierCruz-Gomez
Institute of BiomedicalResearch and Innovation ofCadiz (INiBICA) Cadiz SpainPsychology DepartmentUniversity of Cadiz Spain
Design andconceptualization of thestudy neuropsychologicalassessment MRIpreprocessing and analysisstatistical analysis ofradiologicneuropsychological clinicaland sNfL data and draftingthe manuscript forintellectual content
Lucıa ForeroMD
Institute of BiomedicalResearch and Innovation ofCadiz (INiBICA) Cadiz SpainNeurology DepartmentPuerta del Mar UniversityHospital Cadiz Spain
Patient recruitment clinicalassessment and design andconceptualization of thestudy
ElenaLozano-SotoBSc
Institute of Biomedicalresearch and Innovation ofCadiz (INiBICA) Cadiz SpainPsychology DepartmentUniversity of Cadiz Spain
Neuropsychologicalassessment and analysis ofneuropsychological andclinical data
FatimaCano-CanoBSc
Institute of Biomedicalresearch and Innovation ofCadiz (INiBICA) Cadiz Spain
Acquisition storage andanalysis of blood samples toobtain serum neurofilamentlight chain (sNfL)concentrations
FlorenciaSanmartinoBSc
Institute of BiomedicalResearch and Innovation ofCadiz (INiBICA) Cadiz SpainPsychology DepartmentUniversity of Cadiz Spain
Analysis of radiologicneuropsychological clinicaland sNfL data
Raul Rashid-Lopez MD
Institute of BiomedicalResearch and Innovation ofCadiz (INiBICA) Cadiz SpainNeurology DepartmentPuerta del Mar UniversityHospital Cadiz Spain
Patient recruitment andclinical assessment
Jaime DGomez-RamirezPhD
Institute of Biomedicalresearch and Innovation ofCadiz (INiBICA) Cadiz SpainPsychology DepartmentUniversity of Cadiz Spain
MRI preprocessing and MRIanalysis
Jose PazExpositoMD PhD
RadiodiagnosticDepartment Puerta del MarHospital Cadiz Spain
MRI protocol planningacquisition of MRI sequencesof participants and draftingthe manuscript forintellectual content
RaulEspinosa-Rosso MD
Institute of BiomedicalResearch and Innovation ofCadiz (INiBICA) Cadiz SpainNeurology DepartmentPuerta del Mar UniversityHospital Cadiz Spain
Patient recruitment clinicalassessment and drafting themanuscript for intellectualcontent
Javier JGonzalez-Rosa PhD
Institute of BiomedicalResearch and Innovation ofCadiz (INiBICA) Cadiz SpainPsychology DepartmentUniversity of Cadiz Spain
Design andconceptualization of thestudy analysis of radiologicneuropsychological clinicaland sNfL data interpretationof the data and drafting andrevision of the manuscriptfor intellectual content
12 Neurology Neuroimmunology amp Neuroinflammation | Volume 8 Number 6 | November 2021 NeurologyorgNN
34 Bergsland N Lagana MM Tavazzi E et al Corticospinal tract integrity is related toprimary motor cortex thinning in relapsingndashremitting multiple sclerosis Mult Scler J201521(14)1771-1780
35 Tsagkas C Chakravarty MM Gaetano L et al Longitudinal patterns of corticalthinning in multiple sclerosis Hum Brain Mapp 202041(8)2198-2215
36 Mahajan KR Nakamura K Cohen JA Trapp BD Ontaneda D Intrinsic and extrinsicmechanisms of thalamic pathology in multiple sclerosis Ann Neurol 202088(1)81-92
37 Audoin B Zaaraoui W Reuter F et al Atrophy mainly affects the limbic system andthe deep grey matter at the first stage of multiple sclerosis J Neurol Neurosurg Psy-chiatry 201081(6)690-695
38 Pfaff L Lamy J Noblet V et al Emotional disturbances in multiple sclerosis aneuropsychological and fMRI study Cortex 2019117205-216
39 Tillema JM Hulst HE RoccaMA et al Regional cortical thinning inmultiple sclerosisand its relation with cognitive impairment a multicenter study Mult Scler 201622(7)901-909
40 Achiron A Chapman J Tal S Bercovich E Gil H Achiron A Superior temporal gyrusthickness correlates with cognitive performance in multiple sclerosis Brain StructFunct 2013218(4)943-950
41 Warrier C Wong P Penhune V et al Relating structure to function Heschlrsquos gyrusand acoustic processing J Neurosci 200929(1)61-69
42 Opitz B Schroger E von Cramon DY Sensory and cognitive mechanisms for pre-attentive change detection in auditory cortex Eur J Neurosci 200521(2)531-535
43 Sailer M Fischl B Salat D et al Focal thinning of the cerebral cortex in multiplesclerosis Brain 2003126(pt 8)1734-1744
NeurologyorgNN Neurology Neuroimmunology amp Neuroinflammation | Volume 8 Number 6 | November 2021 13
DOI 101212NXI000000000000107420218 Neurol Neuroimmunol Neuroinflamm
Aacutelvaro J Cruz-Gomez Luciacutea Forero Elena Lozano-Soto et al Patients With Multiple Sclerosis
Cortical Thickness and Serum NfL Explain Cognitive Dysfunction in Newly Diagnosed
This information is current as of August 31 2021
ServicesUpdated Information amp
httpnnneurologyorgcontent86e1074fullhtmlincluding high resolution figures can be found at
References httpnnneurologyorgcontent86e1074fullhtmlref-list-1
This article cites 40 articles 4 of which you can access for free at
Subspecialty Collections
httpnnneurologyorgcgicollectionvolumetric_mriVolumetric MRI
httpnnneurologyorgcgicollectionneuropsychological_assessmentNeuropsychological assessment
httpnnneurologyorgcgicollectionmultiple_sclerosisMultiple sclerosis
httpnnneurologyorgcgicollectionmriMRIfollowing collection(s) This article along with others on similar topics appears in the
Permissions amp Licensing
httpnnneurologyorgmiscaboutxhtmlpermissionsits entirety can be found online atInformation about reproducing this article in parts (figurestables) or in
Reprints
httpnnneurologyorgmiscaddirxhtmlreprintsusInformation about ordering reprints can be found online
Academy of Neurology All rights reserved Online ISSN 2332-7812Copyright copy 2021 The Author(s) Published by Wolters Kluwer Health Inc on behalf of the AmericanPublished since April 2014 it is an open-access online-only continuous publication journal Copyright
is an official journal of the American Academy of NeurologyNeurol Neuroimmunol Neuroinflamm
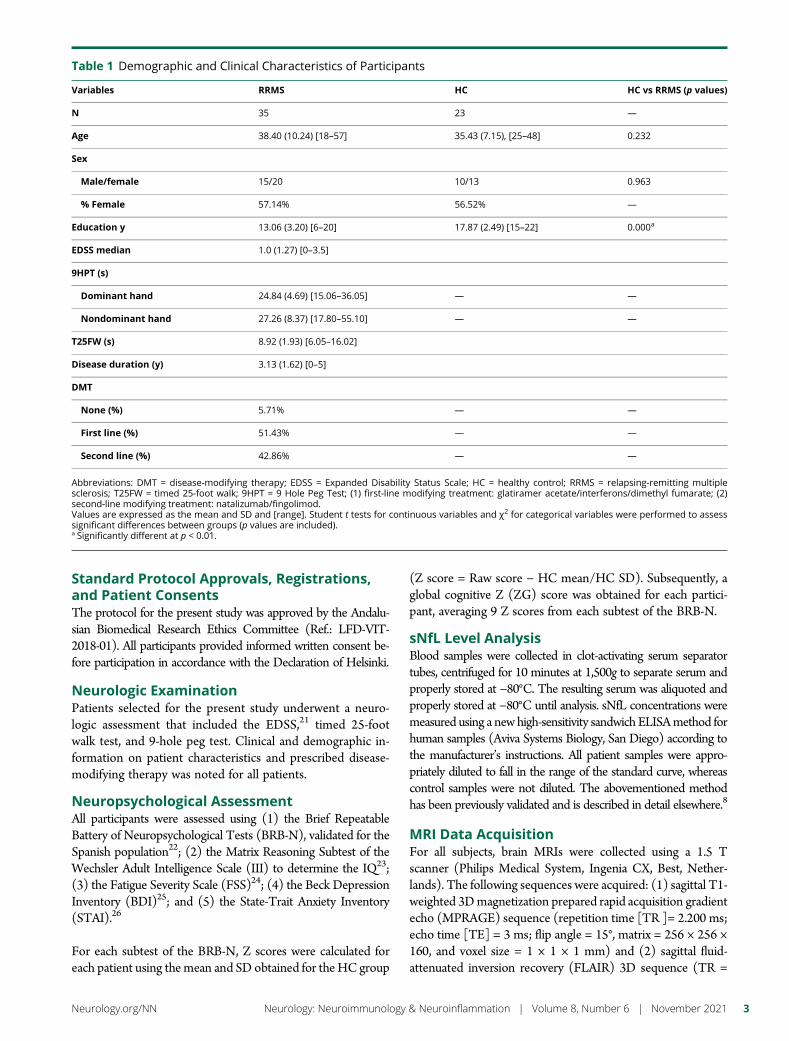
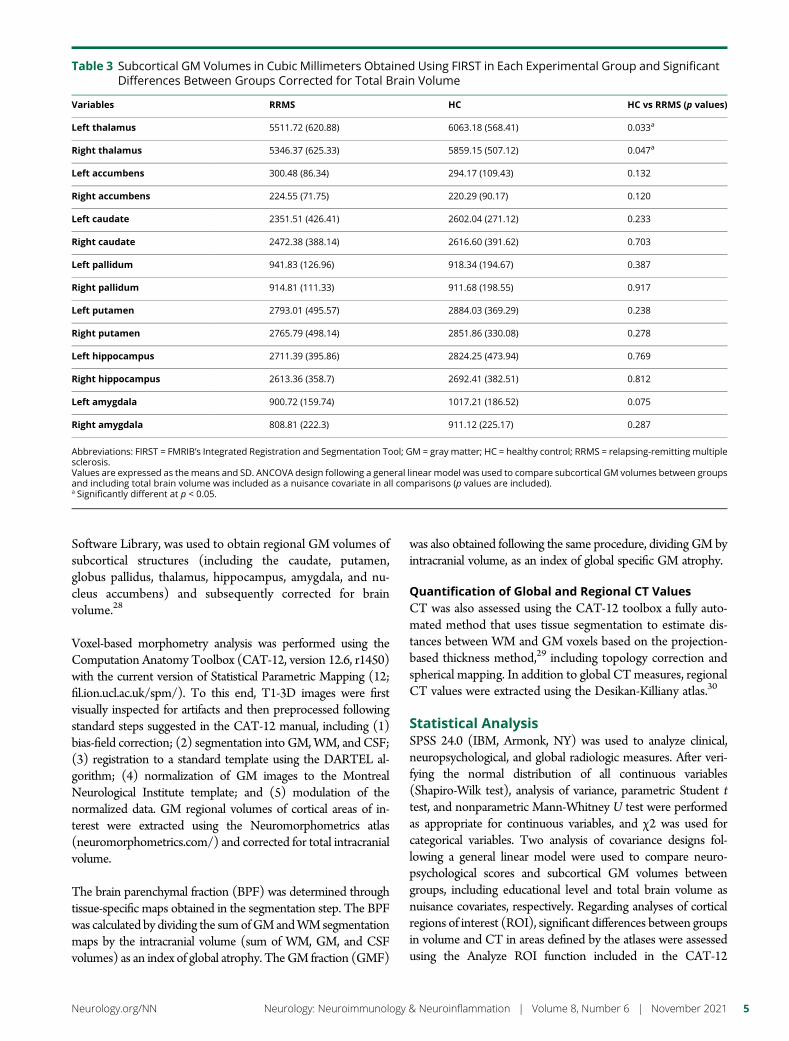