corridor data sheet state route 135 - caltrans 15, 2014 · corridor data sheet state route 135....
TRANSCRIPT

\images\Planning\Cover.jpg
CONTENT: TRAFFIC DATA PLANNING DATA APPENDICES
- Daily Traffic Data - Location Description - Appendix A: Pavement Conditions
- Peak Hour Traffic Data - Highway Type - Appendix B: Traffic Performance Measures
- Historic AADT by Year - Highway Designations - Appendix C: AADT Details
- Historic AADT by Location - Highway Characteristics - Appendix D: Ramp Details
- 2012 Peak Hour Congestion Maps - Modal - Appendix E: Glossary and References
- 2040 Peak Hour Congestion Maps - Intelligent Transportation Systems
- Freight
- Cultural & Scenic
- Environmental
CO
RR
IDO
R D
ATA S
HEET
STATE R
OU
TE 1
35

This Page Intentionally Left Blank
Inputs: PM Peak Hour Analyzed
Base Year 2012
Horizon Year 2040
Section: Page: Section: Page:
Segment 1 Traffic Data 3 Appendix A: Pavement Conditions 15
Segment 1 Planning Data 5 Appendix B: Traffic Performance 16
Segment 2 Traffic Data 7 Appendix C: AADT Details 18
Segment 2 Planning Data 9 Appendix D: Ramp Details 19
Segment 3 Traffic Data 11 Appendix E: Glossary and References 20
Segment 3 Planning Data 13
Prepared by: District 5 - Transportation Planning Last Saved: 10/15/2014
Jeff Berkman, Advance Planning
Kelly McClendon, System Planning
SR 135 Corridor Data SheetDistrict 5, Santa Barbara County
Appendix E provides a glossary and references to supplement the
information in the Traffic Data and Planning Data. It includes a
description of each data item, the data source, and the year of the
data reflected in the sheet.
The information and data contained in this document are for planning purposes only and should not be relied upon for finaldesign of any project. Any information in this TCR is subject to modification as conditions change and new information isobtained. Although planning information is dynamic and continually changing, the District 5 System Planning Division makesevery effort to ensure the accuracy and timeliness of the information contained in the TCR. The information in the TCR doesnot constitute a standard, specification, or regulation, nor is it intended to address design policies and procedures and shallnot be used as a substitute for project specific analysis, including but not limited to, traffic impact studies, that pertain to anyprivate or public development proposal.
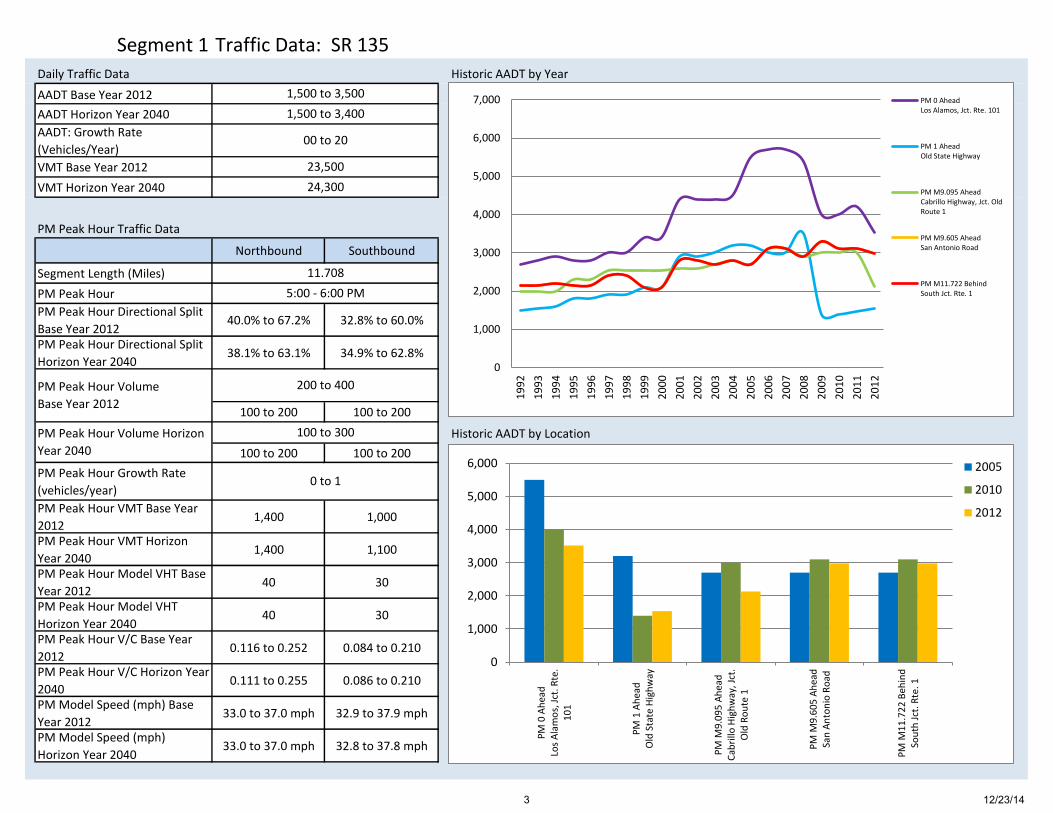
Segment 1 Traffic Data: SR 135
Daily Traffic Data Historic AADT by Year
AADT Base Year 2012 Segment 1AADT Horizon Year 2040 Segment 2AADT: Growth Rate
(Vehicles/Year) Segment 3VMT Base Year 2012
VMT Horizon Year 2040
Northbound Southbound
Segment Length (Miles)
PM Peak Hour
PM Peak Hour Directional Split
Base Year 201240.0% to 67.2% 32.8% to 60.0%
PM Peak Hour Directional Split
Horizon Year 204038.1% to 63.1% 34.9% to 62.8%
100 to 200 100 to 200
Historic AADT by Location
100 to 200 100 to 200
PM Peak Hour Growth Rate
(vehicles/year)
PM Peak Hour VMT Base Year
20121,400 1,000
PM Peak Hour VMT Horizon
Year 20401,400 1,100
PM Peak Hour Model VHT Base
Year 201240 30
PM Peak Hour Model VHT
Horizon Year 204040 30
PM Peak Hour V/C Base Year
20120.116 to 0.252 0.084 to 0.210
PM Peak Hour V/C Horizon Year
20400.111 to 0.255 0.086 to 0.210
PM Model Speed (mph) Base
Year 201233.0 to 37.0 mph 32.9 to 37.9 mph
PM Model Speed (mph)
Horizon Year 204033.0 to 37.0 mph 32.8 to 37.8 mph
PM Peak Hour Traffic Data
0 to 1
11.708
5:00 - 6:00 PM
100 to 300PM Peak Hour Volume Horizon
Year 2040
PM Peak Hour Volume
Base Year 2012
200 to 400
1,500 to 3,500
1,500 to 3,400
00 to 20
23,500
24,300
0
1,000
2,000
3,000
4,000
5,000
6,000
7,000
19
92
19
93
19
94
19
95
19
96
19
97
19
98
19
99
20
00
20
01
20
02
20
03
20
04
20
05
20
06
20
07
20
08
20
09
20
10
20
11
20
12
PM 0 AheadLos Alamos, Jct. Rte. 101
PM 1 AheadOld State Highway
PM M9.095 AheadCabrillo Highway, Jct. OldRoute 1
PM M9.605 AheadSan Antonio Road
PM M11.722 BehindSouth Jct. Rte. 1
0
1,000
2,000
3,000
4,000
5,000
6,000
PM
0 A
hea
dLo
s A
lam
os,
Jct
. Rte
.1
01
PM
1 A
hea
dO
ld S
tate
Hig
hw
ay
PM
M9.
09
5 A
hea
dC
abri
llo H
igh
way
, Jct
.O
ld R
ou
te 1
PM
M9.
60
5 A
hea
dSa
n A
nto
nio
Ro
ad
PM
M11
.72
2 B
ehin
dSo
uth
Jct
. Rte
. 1
2005
2010
2012
3 12/23/14

Segment 1 Traffic Data: SR 135
PM Peak Hour Congestion*
Image Location:
\images\Segment1VC.jpg
*Image Last Modified: 8/12/2014 8:08:19 AM
4 12/23/14

Segment 1 Planning Data: SR 135Location Description Land Use
Segment Description Image Location:
Urban/Rural \images\planning\Seg_1_LU.jpg
Local Planning Jurisdiction
County
City
Prevalent Land Use
Highway Type
Freeway/Expressway System
Facility Type
Functional Classification
Highway Designations Profile Legend
National Highway System
Interregional Road System Landscape Legend
Scenic Highway
Highway Characteristics
Number of Lanes
Pavement Condition Right
Pavement Condition Left Image Location:
Shoulder Width Right (ft) \images\planning\Seg_1_SW.jpg
Shoulder Width Left (ft)
Modal
Airports Served
Bicycle Access
AMTRAK Bus Stations
AMTRAK Rail Stations
AMTRAK Thruway Bus
Parallel/Near AMTRAK
Rail/SHS Crossings
Rail Crossing Description
Intelligent Transportation Systems SW Legend
Signals/Mile
Shoulder Width
No
N/A
Open
N/A
N/A
No
No
Major/Minor
Major/Minor
0-8+
0-8+
Vandenberg AFB
From US 101 to SR 1 (south junction)
Rural
SBCAG
Santa Barbara
N/A
Agriculture
No
Conventional/Expressway
Major Collector
No
No
No
2-4
0
Other Features: N/A
5 12/23/14

Segment 1 Planning Data: SR 135Freight Freight
Percent Trucks Image Location:
Key Freight Highway \images\planning\Seg_1_FR.jpg
California Truck Network
Annual Freight Tonnage
Freight VMT
Cultural & Scenic
Historic Bridges
Lighthouses Profile Legend
Vista Points
Parks
Federal Lands Landscape Legend
Landmarks
Environmental
Surrounding Vegetation
Coastal Zone Image Location:
Water Crossing Description \images\planning\Seg_1_CH.jpg
Flood Zone
Critical Habitat
Air Quality Standards
Criteria Pollutant State Federal
Ozone Nonattainment Unclassified/Attain.
Carbon Monoxide Attainment Attainment
Nitrogen Dioxide Attainment Unclassified/Attain.
Sulfer Dioxide Attainment No information
Particulate Matter (10) Nonattainment Attainment
Particulate Matter (10) Unclassified Unclassified/Attain.
Lead Attainment Unclassified/Attain. CH Legend
Critical Habitat
California Legal
0 - 5,000,000
0 - 10,000
5%-20%
No
N/A
100 Year Flood Plain
Ferini Park
Reported Freight Issues: N/A
No
San Antonio Creek
No
No
Vandenberg AFB
N/A
Urban-Agric./Coastal scrub
No
6 12/23/14

Segment 2 Traffic Data: SR 135
Daily Traffic Data Historic AADT by Year
AADT Base Year 2012 Segment 1AADT Horizon Year 2040 Segment 2AADT: Growth Rate
(Vehicles/Year) Segment 3VMT Base Year 2012
VMT Horizon Year 2040
Northbound Southbound
Segment Length (Miles)
PM Peak Hour
PM Peak Hour Directional Split
Base Year 201263.9% 36.1%
PM Peak Hour Directional Split
Horizon Year 204063.1% 30.6%
200 to 1,900 100 to 1,100
Historic AADT by Location
200 to 2,000 100 to 1,200
PM Peak Hour Growth Rate
(vehicles/year)
PM Peak Hour VMT Base Year
20126,100 3,400
PM Peak Hour VMT Horizon
Year 20406,500 3,600
PM Peak Hour Model VHT Base
Year 2012150 90
PM Peak Hour Model VHT
Horizon Year 2040160 90
PM Peak Hour V/C Base Year
20120.065 to 0.767 0.037 to 0.433
PM Peak Hour V/C Horizon Year
20400.069 to 0.817 0.031 to 0.478
PM Model Speed (mph) Base
Year 201239.3 to 49.0 mph 36.7 to 49.0 mph
PM Model Speed (mph)
Horizon Year 204039.7 to 49.0 mph 38.1 to 49.0 mph
PM Peak Hour Traffic Data
-2 to 15
4.845
5:00 - 6:00 PM
300 to 3,200PM Peak Hour Volume Horizon
Year 2040
PM Peak Hour Volume
Base Year 2012
300 to 3,000
3,000 to 22,600
3,900 to 26,200
30 to 200
84,000
93,800
0
5,000
10,000
15,000
20,000
25,000
30,000
35,000
40,000
45,000
19
92
19
93
19
94
19
95
19
96
19
97
19
98
19
99
20
00
20
01
20
02
20
03
20
04
20
05
20
06
20
07
20
08
20
09
20
10
20
11
20
12
PM M11.722 AheadSouth Jct. Rte. 1
PM R9.095 AheadOrcutt, North Jct. Rte. 1
PM R10.412 AheadEast Clark Avenue
PM 10.93 AheadFoster Road
PM 11.73 AheadLakeview Road/Skyway Drive
PM 12.74 AheadMiller Street
PM 13 BehindSanta Maria Way
0
5,000
10,000
15,000
20,000
25,000
30,000
35,000
40,000
PM
M11
.72
2 A
hea
dSo
uth
Jct
. Rte
. 1
PM
R9
.09
5 A
he
adO
rcu
tt, N
ort
h J
ct.
Rte
. 1
PM
R1
0.4
12
Ah
ead
East
Cla
rk A
ven
ue
PM
10
.93
Ah
ead
Fost
er R
oad
PM
11
.73
Ah
ead
Lake
view
Ro
ad/S
kyw
ay D
rive
PM
12
.74
Ah
ead
Mill
er S
tree
t
PM
13
Be
hin
dSa
nta
Mar
ia W
ay
2005
2010
2012
7 12/23/14

Segment 2 Traffic Data: SR 135
PM Peak Hour Congestion*
Image Location:
\images\Segment2VC.jpg
*Image Last Modified: 8/12/2014 8:10:07 AM
8 12/23/14

Segment 2 Planning Data: SR 135Location Description Land Use
Segment Description Image Location:
Urban/Rural \images\planning\Seg_2_LU.jpg
Local Planning Jurisdiction
County
City
Prevalent Land Use
Highway Type
Freeway/Expressway System
Facility Type
Functional Classification
Highway Designations Profile Legend
National Highway System
Interregional Road System Landscape Legend
Scenic Highway
Highway Characteristics
Number of Lanes
Pavement Condition Right
Pavement Condition Left Image Location:
Shoulder Width Right (ft) \images\planning\Seg_2_SW.jpg
Shoulder Width Left (ft)
Modal
Airports Served
Bicycle Access
AMTRAK Bus Stations
AMTRAK Rail Stations
AMTRAK Thruway Bus
Parallel/Near AMTRAK
Rail/SHS Crossings
Rail Crossing Description
Intelligent Transportation Systems SW Legend
Signals/Mile
Shoulder Width
No
N/A
Open
N/A
N/A
Yes
No
No Distress
No Distress
8+
8+
Santa Maria Public
From SR 1 (n. jct) to Santa Maria Way
Urban
SBCAG
Santa Barbara
Santa Maria
Medium density residential
No
Conventional/Freeway
Principle Arterial
STRAHNET Connector
No
No
4
1
Other Features: Call Box(s)
9 12/23/14

Segment 2 Planning Data: SR 135Freight Freight
Percent Trucks Image Location:
Key Freight Highway \images\planning\Seg_2_FR.jpg
California Truck Network
Annual Freight Tonnage
Freight VMT
Cultural & Scenic
Historic Bridges
Lighthouses Profile Legend
Vista Points
Parks
Federal Lands Landscape Legend
Landmarks
Environmental
Surrounding Vegetation
Coastal Zone Image Location:
Water Crossing Description \images\planning\Seg_2_CH.jpg
Flood Zone
Critical Habitat
Air Quality Standards
Criteria Pollutant State Federal
Ozone Nonattainment Unclassified/Attain.
Carbon Monoxide Attainment Attainment
Nitrogen Dioxide Attainment Unclassified/Attain.
Sulfer Dioxide Attainment No information
Particulate Matter (10) Nonattainment Attainment
Particulate Matter (10) Unclassified Unclassified/Attain.
Lead Attainment Unclassified/Attain. CH Legend
Critical Habitat
Terminal Access
0 - 5,000,000
0 - 10,000
20%
No
California Tiger Salamander; La Graciosa
thistle
100 Year Flood Plain @ Clark Ave
Waller Park
Reported Freight Issues: N/A
No
N/A
No
No
N/A
N/A
Urban-Agriculture
No
10 12/23/14

Segment 3 Traffic Data: SR 135
Daily Traffic Data Historic AADT by Year
AADT Base Year 2012 Segment 1AADT Horizon Year 2040 Segment 2AADT: Growth Rate
(Vehicles/Year) Segment 3VMT Base Year 2012
VMT Horizon Year 2040
Northbound Southbound
Segment Length (Miles)
PM Peak Hour
PM Peak Hour Directional Split
Base Year 201225.6% to 63.9% 36.1% to 74.4%
PM Peak Hour Directional Split
Horizon Year 204025.5% to 65.3% 35.8% to 77.0%
500 to 2,000 900 to 1,900
Historic AADT by Location
700 to 2,500 1,100 to 2,300
PM Peak Hour Growth Rate
(vehicles/year)
PM Peak Hour VMT Base Year
20126,100 6,200
PM Peak Hour VMT Horizon
Year 20407,300 7,700
PM Peak Hour Model VHT Base
Year 2012160 160
PM Peak Hour Model VHT
Horizon Year 2040190 200
PM Peak Hour V/C Base Year
20120.234 to 0.785 0.355 to 0.870
PM Peak Hour V/C Horizon Year
20400.292 to 0.864 0.445 to 1.059
PM Model Speed (mph) Base
Year 201237.1 to 39.7 mph 37.5 to 40.0 mph
PM Model Speed (mph)
Horizon Year 204036.2 to 39.2 mph 36.7 to 39.6 mph
PM Peak Hour Traffic Data
13 to 28
4.806
5:00 - 6:00 PM
2,500 to 3,900PM Peak Hour Volume Horizon
Year 2040
PM Peak Hour Volume
Base Year 2012
2,100 to 3,100
17,900 to 31,100
29,100 to 41,600
200 to 390
120,000
154,700
0
5,000
10,000
15,000
20,000
25,000
30,000
35,000
40,000
45,000
50,000
19
92
19
93
19
94
19
95
19
96
19
97
19
98
19
99
20
00
20
01
20
02
20
03
20
04
20
05
20
06
20
07
20
08
20
09
20
10
20
11
20
12
PM 13 AheadSanta Maria Way
PM 13.54 AheadBetteravia Road
PM 14.78 AheadSanta Maria, Stowell Road
PM 15.772 AheadSanta Maria, Jct. Rte. 166
PM 16.77 AheadSanta Maria, Donovan Road
PM 17.806 BehindSanta Maria, Jct. Rte. 101
0
5,000
10,000
15,000
20,000
25,000
30,000
35,000
40,000
45,000
PM
13
Ah
ead
San
ta M
aria
Way
PM
13
.54
Ah
ead
Bet
tera
via
Ro
ad
PM
14
.78
Ah
ead
San
ta M
aria
, Sto
wel
lR
oad
PM
15
.77
2 A
hea
dSa
nta
Mar
ia, J
ct. R
te.
16
6
PM
16
.77
Ah
ead
San
ta M
aria
,D
on
ova
n R
oad
PM
17
.80
6 B
ehin
dSa
nta
Mar
ia, J
ct. R
te.
10
1
2005
2010
2012
11 12/23/14

Segment 3 Traffic Data: SR 135
PM Peak Hour Congestion*
Image Location:
\images\Segment3VC.jpg
*Image Last Modified: 8/12/2014 8:11:15 AM
12 12/23/14

Segment 3 Planning Data: SR 135Location Description Land Use
Segment Description Image Location:
Urban/Rural \images\planning\Seg_3_LU.jpg
Local Planning Jurisdiction
County
City
Prevalent Land Use
Highway Type
Freeway/Expressway System
Facility Type
Functional Classification
Highway Designations Profile Legend
National Highway System
Interregional Road System Landscape Legend
Scenic Highway
Highway Characteristics
Number of Lanes
Pavement Condition Right
Pavement Condition Left Image Location:
Shoulder Width Right (ft) \images\planning\Seg_3_SW.jpg
Shoulder Width Left (ft)
Modal
Airports Served
Bicycle Access
AMTRAK Bus Stations
AMTRAK Rail Stations
AMTRAK Thruway Bus
Parallel/Near AMTRAK
Rail/SHS Crossings
Rail Crossing Description
Intelligent Transportation Systems SW Legend
Signals/Mile
Shoulder Width
Yes - At-grade
Santa Maria Valley
Open
N/A
N/A
Yes
No
Ride
Major/Ride
2-8+
2-8+
N/A
From Santa Maria Way to US 101
Urban
SBCAG
Santa Barbara
Santa Maria
Urban Reserve
No
Conventional
Principle Arterial
No
No
No
4-6
4
Other Features: Vehicle Detection
13 12/23/14

Segment 3 Planning Data: SR 135Freight Freight
Percent Trucks Image Location:
Key Freight Highway \images\planning\Seg_3_FR.jpg
California Truck Network
Annual Freight Tonnage
Freight VMT
Cultural & Scenic
Historic Bridges
Lighthouses Profile Legend
Vista Points
Parks
Federal Lands Landscape Legend
Landmarks
Environmental
Surrounding Vegetation
Coastal Zone Image Location:
Water Crossing Description \images\planning\Seg_3_CH.jpg
Flood Zone
Critical Habitat
Air Quality Standards
Criteria Pollutant State Federal
Ozone Nonattainment Unclassified/Attain.
Carbon Monoxide Attainment Attainment
Nitrogen Dioxide Attainment Unclassified/Attain.
Sulfer Dioxide Attainment No information
Particulate Matter (10) Nonattainment Attainment
Particulate Matter (10) Unclassified Unclassified/Attain.
Lead Attainment Unclassified/Attain. CH Legend
Critical Habitat
Terminal Access
0 - 5,000,000
0 - 10,000
7%
No
N/A
500 Year Flood Plain @ SR 166
N/A
Reported Freight Issues: N/A
No
N/A
No
No
N/A
Sta. Maria Town Center; Sta. Maria HS
Urban-Agriculture
No
14 12/23/14

Appendix A:
Detailed Pavement Condition
\images\Planning\AppendixA.jpg
15 12/23/14

Appendix B:
Detailed Traffic Performance Measures
Segm
en
t La
bel
Be
gin
Co
Rte
Be
gin
PM
End
PM
Be
gin
Nam
e
End
Nam
e
201
2 A
AD
T V
olu
me
201
2 D
aily
VM
T
201
2 P
M V
olu
me
201
2 P
M M
od
el V
olu
me
201
2 P
M N
B V
olu
me
Ah
ead
Po
int
201
2 P
M N
B V
olu
me
Be
hin
d P
oin
t
201
2 P
M N
B V
olu
me
201
2 P
M S
B V
olu
me
201
2 P
eak
Dir
ecti
on
201
2 V
MT
201
2 N
B V
MT
201
2 SB
VM
T
201
2 V
HT
(M
od
el)
201
2 N
B A
dju
sted
Cap
acit
y
201
2 SB
Ad
just
ed
Cap
acit
y
201
2 N
B V
C
201
2 SB
VC
201
2 P
M N
B M
od
el
Spe
ed
201
2 P
M S
B M
od
el
Spe
ed
SBCAG 2013 SCS Preferred
1a SB 135 0 1LOS ALAMOS, JCT. RTE.
101OLD STATE HIGHWAY 2,805 2,805 280 99 140 84 112 168 SB 280 112 168 8 800 800 0.14 0.21 33.0 33.0
1b SB 135 1 M9.095 OLD STATE HIGHWAYCABRILLO HIGHWAY, JCT.
OLD ROUTE 11,630 13,172 160 40 87 98 93 67 NB 1,293 748 545 39 800 800 0.12 0.08 33.0 33.0
1c SB 135 M9.095 M9.605CABRILLO HIGHWAY,
JCT. OLD ROUTE 1SAN ANTONIO ROAD 2,340 1,193 300 284 202 202 202 98 NB 153 103 50 5 800 800 0.25 0.12 33.0 32.9
1d SB 135 M9.605 M11.722 SAN ANTONIO ROAD SOUTH JCT. RTE. 1 2,980 6,309 300 381 202 202 202 98 NB 635 427 208 17 1,020 1,078 0.20 0.09 37.0 37.9
2a SB 135 M11.722 R9.095 SOUTH JCT. RTE. 1ORCUTT, NORTH JCT.
RTE. 12,980 650 300 1,056 192 192 192 108 NB 65 42 24 1 2,950 2,950 0.06 0.04 49.0 49.0
2b SB 135 R9.095 R10.412ORCUTT, NORTH JCT.
RTE. 1EAST CLARK AVENUE 14,700 19,360 1,450 1,606 895 959 927 523 NB 1,910 1,220 689 42 3,800 3,800 0.24 0.14 45.0 45.0
2c SB 135 R10.412 10.93 EAST CLARK AVENUE FOSTER ROAD 15,800 19,592 1,600 2,003 1,150 895 1,023 577 NB 1,984 1,268 716 47 3,200 3,200 0.32 0.18 43.0 41.8
2d SB 135 10.93 11.73 FOSTER ROADLAKEVIEW
ROAD/SKYWAY DRIVE21,300 17,040 3,000 2,923 1,917 1,917 1,917 1,083 NB 2,400 1,534 866 63 2,500 2,500 0.77 0.43 39.3 36.7
2e SB 135 11.73 12.74LAKEVIEW
ROAD/SKYWAY DRIVEMILLER STREET 21,800 22,018 2,500 2,728 1,598 1,598 1,598 902 NB 2,525 1,614 911 64 3,000 3,000 0.53 0.30 39.8 39.0
2f SB 135 12.74 13 MILLER STREET SANTA MARIA WAY 20,600 5,356 2,500 1,905 1,598 1,598 1,598 902 NB 650 415 235 16 3,000 3,000 0.53 0.30 39.9 39.6
3a SB 135 13 13.54 SANTA MARIA WAY BETTERAVIA ROAD 29,700 16,038 2,950 2,759 1,917 1,853 1,885 1,065 NB 1,593 1,018 575 40 3,000 3,000 0.63 0.35 39.6 39.1
3b SB 135 13.54 14.78 BETTERAVIA ROADSANTA MARIA, STOWELL
ROAD29,150 36,146 2,900 2,120 1,981 1,726 1,853 1,047 NB 3,596 2,298 1,298 90 2,917 2,917 0.64 0.36 39.7 39.8
3c SB 135 14.78 15.772SANTA MARIA,
STOWELL ROAD
SANTA MARIA, JCT. RTE.
16623,850 23,659 2,550 1,882 1,598 1,662 1,630 920 NB 2,530 1,617 913 64 2,076 2,076 0.78 0.44 38.9 40.0
3d SB 135 15.772 16.77SANTA MARIA, JCT. RTE.
166
SANTA MARIA,
DONOVAN ROAD23,350 23,303 2,350 1,575 640 563 602 1,748 SB 2,345 601 1,745 59 2,009 2,009 0.30 0.87 39.4 39.9
3e SB 135 16.77 17.806SANTA MARIA,
DONOVAN ROAD
SANTA MARIA, JCT. RTE.
10120,150 20,875 2,150 2,052 563 538 551 1,599 SB 2,227 570 1,657 60 2,356 2,356 0.23 0.68 37.1 37.5
16 12/23/14

Appendix B:
Detailed Traffic Performance Measures
Segm
en
t La
bel
Be
gin
Co
Rte
Be
gin
PM
End
PM
Be
gin
Nam
e
End
Nam
e
SBCAG 2013 SCS Preferred
1a SB 135 0 1LOS ALAMOS, JCT. RTE.
101OLD STATE HIGHWAY
1b SB 135 1 M9.095 OLD STATE HIGHWAYCABRILLO HIGHWAY, JCT.
OLD ROUTE 1
1c SB 135 M9.095 M9.605CABRILLO HIGHWAY,
JCT. OLD ROUTE 1SAN ANTONIO ROAD
1d SB 135 M9.605 M11.722 SAN ANTONIO ROAD SOUTH JCT. RTE. 1
2a SB 135 M11.722 R9.095 SOUTH JCT. RTE. 1ORCUTT, NORTH JCT.
RTE. 1
2b SB 135 R9.095 R10.412ORCUTT, NORTH JCT.
RTE. 1EAST CLARK AVENUE
2c SB 135 R10.412 10.93 EAST CLARK AVENUE FOSTER ROAD
2d SB 135 10.93 11.73 FOSTER ROADLAKEVIEW
ROAD/SKYWAY DRIVE
2e SB 135 11.73 12.74LAKEVIEW
ROAD/SKYWAY DRIVEMILLER STREET
2f SB 135 12.74 13 MILLER STREET SANTA MARIA WAY
3a SB 135 13 13.54 SANTA MARIA WAY BETTERAVIA ROAD
3b SB 135 13.54 14.78 BETTERAVIA ROADSANTA MARIA, STOWELL
ROAD
3c SB 135 14.78 15.772SANTA MARIA,
STOWELL ROAD
SANTA MARIA, JCT. RTE.
166
3d SB 135 15.772 16.77SANTA MARIA, JCT. RTE.
166
SANTA MARIA,
DONOVAN ROAD
3e SB 135 16.77 17.806SANTA MARIA,
DONOVAN ROAD
SANTA MARIA, JCT. RTE.
101
PM
Gro
wth
Rat
e
AD
T G
row
th R
ate
204
0 A
DT
Vo
lum
e
204
0 D
aily
VM
T
204
0 P
M V
olu
me
204
0 P
M N
B V
olu
me
204
0 P
M S
B V
olu
me
204
0 P
eak
Dir
ecti
on
204
0 P
M V
MT
204
0 N
B V
MT
204
0 SB
VM
T
204
0 V
HT
(M
od
el)
204
0 N
B A
dju
sted
Cap
acit
y
204
0 SB
Ad
just
ed
Cap
acit
y
204
0 N
B V
C
204
0 SB
VC
204
0 N
B M
od
el S
pee
d
204
0 SB
Mo
del
Sp
eed
0 -2 2,739 2,739 267 102 168 SB 267 102 168 8 800 800 0.13 0.21 33.0 33.0
0 -1 1,616 13,055 158 89 69 NB 1,275 718 557 39 800 800 0.11 0.09 33.0 33.0
1 10 2,619 1,336 324 204 113 NB 165 104 58 5 800 800 0.26 0.14 33.0 32.8
1 15 3,405 7,209 333 208 128 NB 704 441 271 19 1,020 1,078 0.20 0.12 37.0 37.8
0 33 3,903 851 298 204 91 NB 65 44 20 1 2,950 2,950 0.07 0.03 49.0 49.0
-2 32 15,597 20,541 1,403 940 477 NB 1,847 1,238 628 41 3,800 3,800 0.25 0.13 45.0 45.0
3 60 17,486 21,683 1,685 1,074 614 NB 2,089 1,332 761 49 3,200 3,200 0.34 0.19 43.3 42.8
8 99 24,073 19,258 3,237 2,042 1,195 NB 2,590 1,634 956 66 2,500 2,500 0.82 0.48 39.7 38.1
4 91 24,354 24,597 2,615 1,718 918 NB 2,641 1,735 927 67 3,000 3,000 0.57 0.31 39.7 38.9
15 202 26,243 6,823 2,927 1,975 1,014 NB 761 513 264 20 3,000 3,000 0.66 0.34 39.8 39.4
28 390 40,615 21,932 3,738 2,441 1,336 NB 2,018 1,318 722 54 3,000 3,000 0.814 0.45 38.3 37.6
25 296 37,439 46,424 3,611 2,251 1,356 NB 4,477 2,791 1,681 114 2,917 2,917 0.77 0.46 39.2 39.2
15 236 30,460 30,216 2,967 1,793 1,161 NB 2,943 1,779 1,152 77 2,076 2,076 0.86 0.56 37.7 39.0
15 204 29,054 28,996 2,763 705 2,128 SB 2,758 704 2,124 72 2,009 2,009 0.35 1.06 38.8 39.6
13 216 26,205 27,149 2,513 687 1,915 SB 2,603 711 1,984 74 2,356 2,356 0.29 0.81 36.2 36.7
17 12/23/14

Appendix C:
Detailed AADTAADT 1992 1993 1994 1995 1996 1997 1998 1999 2000 2001 2002 2003 2004 2005 2006 2007 2008 2009 2010 2011 2012
Segment 1
PM 0 Ahead
Los Alamos, Jct. Rte. 1012,700 2,800 2,900 2,800 2,800 3,000 3,000 3,400 3,400 4,400 4,400 4,400 4,500 5,500 5,700 5,700 5,400 4,000 4,000 4,200 3,520
PM 1 Ahead
Old State Highway1,500 1,550 1,600 1,800 1,800 1,900 1,900 2,100 2,100 2,900 2,900 3,000 3,200 3,200 3,000 3,000 3,500 1,400 1,400 1,470 1,540
PM M9.095 Ahead 2,000 2,000 2,000 2,300 2,300 2,550 2,550 2,550 2,550 2,600 2,600 2,700 2,800 2,700 3,100 3,100 2,900 3,000 3,000 3,000 2,130
PM M9.605 Ahead 2,150 2,150 2,200 2,150 2,150 2,400 2,400 2,100 2,100 2,800 2,800 2,700 2,800 2,700 3,100 3,100 2,900 3,300 3,100 3,100 2,980
PM M11.722 Behind 2,150 2,150 2,200 2,150 2,150 2,400 2,400 2,100 2,100 2,800 2,800 2,700 2,800 2,700 3,100 3,100 2,900 3,300 3,100 3,100 2,980
Segment 2
PM M11.722 Ahead
South Jct. Rte. 1#N/A #N/A #N/A #N/A #N/A #N/A #N/A #N/A #N/A #N/A #N/A #N/A #N/A #N/A #N/A #N/A #N/A 3,300 3,100 3,100 2,980
PM R9.095 Ahead
Orcutt, North Jct. Rte. 112,500 12,500 12,800 13,300 13,300 13,800 13,500 14,000 14,000 14,500 14,500 15,000 15,500 14,800 15,000 15,000 13,000 #N/A 13,000 13,000 14,700
PM R10.412 Ahead
East Clark Avenue15,700 15,700 16,000 16,500 16,800 17,500 17,000 17,500 18,000 18,500 18,500 19,000 19,300 19,000 19,200 19,200 17,200 18,600 18,600 19,600 17,800
PM 10.93 Ahead 19,600 19,600 20,000 21,000 21,500 22,500 22,000 23,000 23,500 24,000 24,000 25,000 25,500 25,000 25,500 25,500 26,500 29,700 28,000 26,600 21,300
PM 11.73 Ahead 29,500 29,500 30,000 31,000 31,500 33,000 32,500 34,000 34,500 35,500 35,500 36,500 37,000 36,500 37,000 37,000 20,500 21,200 21,200 22,200 21,000
PM 12.74 Ahead 19,600 19,600 20,000 21,000 21,500 22,500 22,000 23,000 23,500 24,000 24,500 25,000 25,500 25,000 25,500 25,500 24,800 23,700 23,700 23,700 20,600
PM 13 Behind 19,600 19,600 20,000 21,000 21,500 22,500 22,000 23,000 23,500 24,000 24,500 25,000 25,500 25,000 25,500 25,500 24,800 23,700 23,700 23,700 20,600
Segment 3
PM 13 Ahead
Santa Maria Way30,000 30,000 30,500 31,500 32,000 33,000 32,500 34,000 34,500 35,500 36,000 37,500 38,000 37,500 38,000 38,000 33,000 29,200 27,000 25,700 30,400
PM 13.54 Ahead
Betteravia Road33,000 33,000 33,500 35,000 35,500 37,000 36,500 38,000 39,000 39,500 40,000 41,500 42,000 41,500 42,000 42,000 28,500 32,000 30,000 28,500 31,100
PM 14.78 Ahead
Santa Maria, Stowell Road30,000 30,000 30,500 31,500 32,000 33,000 32,500 34,000 35,000 35,500 36,000 37,500 38,000 38,000 38,500 38,500 26,000 26,000 24,000 22,800 24,700
PM 15.772 Ahead
Santa Maria, Jct. Rte. 16628,000 27,500 28,000 28,000 28,500 27,500 27,000 25,500 26,000 31,000 32,000 33,000 34,500 32,000 32,500 32,500 26,500 20,900 20,900 20,900 24,800
PM 16.77 Ahead
Santa Maria, Donovan Road19,900 19,500 19,900 19,900 20,500 23,300 23,000 24,600 25,000 29,500 30,000 31,000 33,000 31,000 31,500 31,500 27,000 19,900 19,900 19,000 22,400
PM 17.806 Behind
Santa Maria, Jct. Rte. 10113,200 12,900 13,200 13,300 13,500 15,400 15,000 16,000 16,300 19,300 20,000 21,000 22,000 20,000 20,500 20,500 18,500 19,900 19,900 19,000 17,900
18 12/23/14

Appendix D:
Ramps
Ramps along SR135 by segment
Segm
en
t
Ram
p N
ame
Loca
tio
n
20
12
Dai
ly V
olu
me
20
12
PM
Ho
ur
Vo
lum
e
20
40
Dai
ly V
olu
me
20
40
PM
Ho
ur
Vo
lum
e
2b E CLARK SB ON SB SR 135 PM R10.25 2,679 347 2,911 377
2b E CLARK NB OFF SB SR 135 PM R10.3 2,485 185 2,578 191
2c E CLARK NB ON SB SR 135 PM R10.58 3,937 315 4,293 343
2c E CLARK SB OFF SB SR 135 PM R10.59 3,919 498 4,408 560
19 12/23/14

Appendix E: Glossary and References
100-YEAR FLOOD – Areas of 1-percent-annual-
chance flooding (FEMA, 2010).
CALIFORNIA LEGAL – Trucks up to 65 feet are
allowed on the SHS except where otherwise
prohibited (Caltrans, 2014).
FREEWAY/EXPRESSWAY SYTEM – Concept of
how the route is managed as defined in the
Streets and Highways Code (Caltrans, 2014).
500-YEAR FLOOD – Areas of 0.2-percent-annual-
chance-flooding (FEMA, 2010).
CALIFORNIA TRUCK NETWORK – California
Vehicle Code sections related to trucks,
summarized here at the planning level only
FREIGHT VMT – Truck VMT (Freight Analysis
Framework, 2007).
AIR QUALITY STANDARDS – Designations in
relation to the California standards and National
standards (ARB/EPA, 2013).
FUNCTIONAL CLASSIFICATION – System by which
roads are grouped according to the type of
service and amount of traffic the facility carries.
Used to determine design standards of roads AM/PM PEAK – The part of day when most
traffic congestion occurs.
ANNUAL AVERAGE DAILY TRAFFIC (AADT) – Total
volume of vehicle traffic for a year divided by
365 days (Caltrans, 2012).
CRITICAL HABITAT – Critical habitat for
threatened and endangered species (US Fish and
Wildlife Service, 2014)
GROWTH RATE – The forecasted change in
vehicles per year from the base year to the
horizon year.
ANNUAL FREIGHT TONNAGE – Tons per year
(Freight Analysis Framework, 2007).
DISTRICT KEY FREIGHT HIGHWAY FACILITY –
Route key to freight operations (Based on the
California Central Coast Commercial Flows
HIGH EMPHASIS ROUTE – Route with high
interregional importance (Caltrans, 2014).
ATTAINMENT – Air quality in the area meets the
standard (ARB/EPA, 2013).
HORIZON YEAR – 2040 - The future forecast year
used in the long range model.
ATTAINMENT/UNCLASSIFIED – An EPA
designation which, in terms of planning
implications, is essentially the same as
FACILITY TYPE – Description of existing
operations (Caltrans, 2014).
INTERREGIONAL ROAD SYSTEM – Subset of State
Highway System that provides connectivity
among all California’s regions (Caltrans, 2014).
FLOOD ZONE – Special flood hazard areas
(FEMA, 2010).
BASE YEAR – 2012 - The initial year of the
forecast period.
FOCUS ROUTE – Highest priority routes for
completion to minimum facility concept
standards (Caltrans, 2014).
MAJOR (PAVEMENT CONDITION) – Poor
condition, extensive cracks. Requires
rehabilitation/resurfacing (Caltrans, 2013).
100-YEAR FLOOD – Areas of 1-percent-annual-chance flooding. Source: FEMA Digital Flood Insurance Rate Map, 2010. www.fema.gov/msc
500-YEAR FLOOD – Areas of 0.2-percent-annual-chance-flooding. Source: FEMA Digital Flood Insurance Rate Map, 2010. www.fema.gov/msc
AIR QUALITY STANDARDS – Designations in relation to the California standards and National standards Source: California Air Resource Board (ARB), 2013. www.arb.ca.gov/desig/desig.htm
AM/PM PEAK – The part of day when most traffic congestion occurs. Source: SBCAG Regional Model, 2013.
ANNUAL AVERAGE DAILY TRAFFIC (AADT) – Total volume of vehicle traffic for a year divided by 365 days. Source: Caltrans Traffic Operations, 2012.http://traffic-counts.dot.ca.gov/
ANNUAL FREIGHT TONNAGE – Tons per year. Source: Freight Analysis Framework, 2007. www.ops.fhwa.dot.gov/freight/freight_analysis/faf/
ATTAINMENT – Air quality in the area meets the standard. Source: California ARB, 2013. www.arb.ca.gov/desig/desig.htm
ATTAINMENT/UNCLASSIFIED – An EnvironmentalProtection Agency (EPA) designation which, in terms of planning implications, is essentially the same as Attainment. Source: California ARB, 2013. www.arb.ca.gov/desig/desig.htm
BASE YEAR – 2012 - The initial year of the forecast period. Source: SBCAG Regional Model, 2013.
CALIFORNIA LEGAL – Trucks up to 65 feet are allowed on the SHS except where otherwise prohibited. Source: Caltrans Traffic Operations, 2013. www.dot.ca.gov/hq/traffops/engineering/trucks/
CALIFORNIA TRUCK NETWORK – California Vehicle Code sections related to trucks, summarized here at the planning level only. Note: Caltrans is not responsible for authorizing commercial trucks, other than issuing permits for oversize or overweight loads. Source: Caltrans Traffic Operations, 2013. www.dot.ca.gov/hq/traffops/engineering/trucks/
CRITICAL HABITAT – Critical habitat for threatened and endangered species . Source: US Fish and Wildlife Service, 2014. www.fws.gov/gis/data/national/index.html
DISTRICT KEY FREIGHT HIGHWAY FACILITY – Route key to freight operations. Source: California Central Coast Commercial Flows Study, 2012.www.dot.ca.gov/dist05/planning/goods_movement.htm
FACILITY TYPE – Description of existing operations. Source: Caltrans TSN, 2011.
FLOOD ZONE – Special flood hazard areas. Source: FEMA Digital Flood Insurance Rate Map, 2010. www.fema.gov/msc
FOCUS ROUTE – Highest priority routes for completion to minimum facility concept standardsSource: Caltrans Interregional Transportation Strategic Plan, 2013. www.dot.ca.gov/hq/tpp/offices/oasp/itsp.html
FREEWAY/EXPRESSWAY SYTEM – Concept of how the route is managed as defined in the Streets and Highways Code §250-257. Source: Caltrans, 2014.www.leginfo.ca.gov/.html/shc_table_of_contents.html
FREIGHT VMT – Truck Vehicle Miles Traveled. Source: Freight Analysis Framework, 2007. www.ops.fhwa.dot.gov/freight/freight_analysis/faf/
FUNCTIONAL CLASSIFICATION – System by which roads are grouped according to the type of service and amount of traffic the facility carries. Used to determine design standards of roads and determines Federal Aid funding eligibility. Source: FHWA, 2012.http://dot.ca.gov/hq/tsip/hseb/func_clas.html
GROWTH RATE – The forecasted change in vehicles per year from the base year to the horizon year.Source: SBCAG Regional Model, 2013.
HIGH EMPHASIS ROUTE – Route with high interregional importance. Source: Caltrans Interregional Transportation Strategic Plan, 2013.www.dot.ca.gov/hq/tpp/offices/oasp/itsp.html
HORIZON YEAR – 2040 - The future forecast year used in the long range model. Source: SBCAG Regional Model, 2013.
INTERREGIONAL ROAD SYSTEM – Subset of State Highway System that provides connectivity among all California’s regions. Source: Caltrans Interregional Transportation Strategic Plan, 2013. www.dot.ca.gov/hq/tpp/offices/oasp/itsp.html
SERVICE ACCESS – National Network trucks may PEAK HOUR DIRECTIONAL SPLIT – The percent of MAJOR (PAVEMENT CONDITION) – Poor condition,
20 12/23/14

Appendix E: Glossary and References
MINOR (PAVEMENT CONDITION) – Poor
condition, significant cracks. Requires capital
preventative maintenance (Caltrans, 2013).
PREVALENT LAND USE – California County and
local government existing land use designations
(UC Davis Information Center for the
Environment, 2007).
UNCLASSIFIED – Insufficient data to designate
area, or designations have not been made
(ARB/EPA, 2013).
NATIONAL HIGHWAY SYSTEM – The national
system designated by Congress that includes the
Interstate Highway System and other nationally
significant highways and thoroughfares used for
interstate and interregional travel, national
RAIL/SHS CROSSINGS – At-grade crossings
(National Transportation Atlas Database, 2011).
URBAN - Represent densely developed territory
and encompass residential, commercial, and
other non-residential urban land uses (US
Census, 2000).
RIDE (PAVEMENT CONDITION) – Poor ride
quality. May require corrective maintenance
and/or capital preventative maintenance
(Caltrans, 2013).
VEHICLE HOURS OF TRAVEL – A statistic
representing the total number of vehicles
multiplied by the total number of hours vehicles
are traveling.
NATIONAL NETWORK – Allows for conventional
tractor/semitrailer combinations (Caltrans,
2014).
RURAL – Areas outside urban land uses (US
Census, 2000)
VEHICLE MILES TRAVELED (VMT) – Number of
miles vehicles travel. Can be calculated for the
peak hour and/or the entire day.
NONATTAINMENT – Air quality in the area fails
to the applicable standard (ARB/EPA, 2013).
SCENIC HIGHWAY PROGRAM – Program to
protect and enhance the natural scenic beauty
of California highways and adjacent corridors,
through special conservation treatment
(Caltrans, 2014).
VOLUME TO CAPACITY RATIO (V/C) – The ratio
of demand volume to capacity.
PAVEMENT CONDITION – Measurement of
surface characteristics including roughness,
cracking, and faulting (Caltrans, 2013).
SERVICE ACCESS – National Network trucks may
travel up to one mile from the off ramp to
obtain services (Caltrans, 2014).
PEAK HOUR DIRECTIONAL SPLIT – The percent of
traffic volume in the predominant direction of
flow as determined from the regional travel
model.
SURROUNDING VEGETATION – Land cover
dataset (US Forest Service & California
Department of Forestry and Fire Protection,
1979).
PERCENT TRUCKS – Rounded percentage of truck
counts (Caltrans).
TERMINAL ACCESS – National Network trucks
may exit and travel on these SHS routes
(Caltrans, 2014).
BASE YEAR – 2012 - The initial year of the forecast period. Source: SBCAG Regional Model, 2013.
Transportation Strategic Plan, 2013. www.dot.ca.gov/hq/tpp/offices/oasp/itsp.htmlSERVICE ACCESS – National Network trucks may travel up to one mile from the off ramp to obtain services . Source: Caltrans Traffic Operations, 2013. www.dot.ca.gov/hq/traffops/engineering/trucks/
SURROUNDING VEGETATION – Land cover dataset.Source: US Forest Service & California Department of Forestry and Fire Protection, 1979.http://frap.fire.ca.gov/data/frapgisdata-land_cover.php
TERMINAL ACCESS – National Network trucks may exit and travel on these SHS routes Source: Caltrans Traffic Operations, 2013. www.dot.ca.gov/hq/traffops/engineering/trucks/
UNCLASSIFIED – Insufficient data to designate area, or designations have not been made Source: California ARB, 2013. www.arb.ca.gov/desig/desig.htm
URBAN - Represent densely developed territory and encompass residential, commercial, and other non-residential urban land uses. Source: US Census, 2000. http://www.census.gov/
VEHICLE HOURS OF TRAVEL (VHT) – A statistic representing the total number of vehicles multiplied by the total number of hours vehicles are traveling.
VEHICLE MILES TRAVELED (VMT) – Number of miles vehicles travel. Can be calculated for the peak hour and/or the entire day.
VOLUME TO CAPACITY RATIO (V/C) – The ratio of demand volume to capacity.
PEAK HOUR DIRECTIONAL SPLIT – The percent of traffic volume in the predominant direction of flow as determined from the regional travel model. Source: SBCAG Regional Model, 2013.
PEAK HOUR TRAFFIC VOLUME – Represents an estimate of the heaviest traffic flow during the peak hour. Source: Caltrans Traffic Operations, 2012. http://traffic-counts.dot.ca.gov/
PERCENT TRUCKS – Rounded percentage of truck counts. Source: Caltrans Traffic Operations, 2012. http://traffic-counts.dot.ca.gov/
PREVALENT LAND USE – California County and local government existing land use designations. Source: UC Davis Information Center for the Environment, 2007. http://ice.ucdavis.edu/projects/land_use
RAIL/SHS CROSSINGS – At-grade crossings. Source: National Transportation Atlas Database, 2011.http://www.rita.dot.gov/bts/
RIDE (PAVEMENT CONDITION) – Poor ride quality. May require corrective maintenance and/or capital preventative maintenance. Source: Caltrans Pavement Condition Survey, 2013. http://dot.ca.gov/hq/maint/Pavement/Offices/Pavement_Management/index.html
RURAL – Areas outside urban land uses. Source: US Census, 2000). http://www.census.gov/
SCENIC HIGHWAY PROGRAM – Program to protect and enhance the natural scenic beauty of California highways and adjacent corridors, through special conservation treatment. Source Caltrans Landscape Architecture, 2014. http://www.dot.ca.gov/hq/LandArch/scenic_highways/scenic_hwy.htm
MAJOR (PAVEMENT CONDITION) – Poor condition, extensive cracks. Requires rehabilitation/resurfacing Source: Caltrans Pavement Condition Survey, 2013. http://dot.ca.gov/hq/maint/Pavement/Offices/Pavement_Management/index.html
MINOR (PAVEMENT CONDITION) – Poor condition, significant cracks. Requires capital preventative maintenance. Source: Caltrans Pavement Condition Survey, 2013.http://dot.ca.gov/hq/maint/Pavement/Offices/Pavement_Management/index.html
NATIONAL HIGHWAY SYSTEM – The national system designated by Congress that includes the Interstate Highway System and other nationally significant highways and thoroughfares used for interstate and interregional travel, national defense, intermodal connection, and interstate commerce. Source: Caltrans Highway System Engineering, 2013.http://dot.ca.gov/hq/tsip/hseb/map21nhs.html
NATIONAL NETWORK – Allows for conventional tractor/semitrailer combinations. Source: Caltrans Traffic Operations, 2013. www.dot.ca.gov/hq/traffops/engineering/trucks/
NONATTAINMENT – Air quality in the area fails to the applicable standard. Source: California ARB, 2013. www.arb.ca.gov/desig/desig.htm
PAVEMENT CONDITION – Measurement of surface characteristics including roughness, cracking, and faulting (Caltrans, 2013). Source: Caltrans Pavement Condition Survey, 2013. http://dot.ca.gov/hq/maint/Pavement/Offices/Pavement_Management/index.html
21 12/23/14