correlation of shallow groundwater levels with the liquefaction occurrence cause by may 2006...
TRANSCRIPT

Eddy Hartantyo, Kirbani Sri Brotopuspito, Sismanto & Waluyo
International Journal of Applied Sciences (IJAS), Volume (5) : Issue (1) : 2014 1
Correlation of Shallow Groundwater Levels with The Liquefaction Occurrence Cause By May 2006 Earthquake In The
South Volcanic-clastic Sediments Yogyakarta, Indonesia
Eddy Hartantyo [email protected] Geophysics Sub Department, Faculty of Math and Natural Sciences University of Gadjah Mada Yogyakarta,55283, Indonesia
Kirbani Sri Brotopuspito [email protected] Geophysics Sub Department, Faculty of Math and Natural Sciences University of Gadjah Mada Yogyakarta,55283, Indonesia
Sismanto [email protected] Geophysics Sub Department, Faculty of Math and Natural Sciences University of Gadjah Mada Yogyakarta,55283, Indonesia
Waluyo [email protected] Geophysics Sub Department, Faculty of Math and Natural Sciences University of Gadjah Mada Yogyakarta,55283, Indonesia
Abstract
When a large earthquake hit Yogyakarta in 26 May 2006, several liquefaction events occurred in some places in Yogyakarta and surrounding areas. Liquefaction event is strongly influenced by the depth of the ground water in the area, as well as several other parameters. This paper will conduct a qualitative correlation between the observational data liquefaction after the earthquake and the measured groundwater depth. A total of 493 water-table depths were directly measured in the southern part area of volcanic-clastic sediment by using a measuring-tape meter. Fairly high correlation is shown between areas with shallow water depth and the position of occurred liquefactions. The average water depth for liquefied soil is 2.05 m. Almost 90% of the study area showed a high potential for liquefaction to occur. Keywords: Earthquake, Liquefaction, Ground-water, Yogyakarta.
1. INTRODUCTION
Liquefaction is an event that occurs normally in sandy soil (non-cohesive sand), located in a water-saturated conditions, and the medium is subjected to ground vibration (cyclic stress movements) due to earthquake [1]. The sand skeletons will lose their effective stress and change into liquid / viscous [4],[5]. When the large earthquake hit Jogjakarta in the morning (local time) of 27 May 2006, several liquefaction events occurred in some places in Yogyakarta and surrounding areas [6],[7],[8]. The liquefactions phenomena were noted as ground surface cracks, especially new cracks that occur after the occurrence of the earthquake, the presence of sand-boil (slow sand-blast in some places

Eddy Hartantyo, Kirbani Sri Brotopuspito, Sismanto & Waluyo
International Journal of Applied Sciences (IJAS), Volume (5) : Issue (1) : 2014 2
that usually forming successive lines), and the presence of water level changes in wells which bring silt deposition, sometimes reaching up to the surface of the well. The observation points of these phenomena due to the earthquake in May 2006 [7] can be seen in Figure 1. The epicenter of Yogyakarta earthquake was located on the west Parangtritis beach (retrieved from BMKG -Seismological agency- as a red star). The distribution of occurred liquefactions (blue dots) and surface cracks (blue stars) are in line with surface faults. The most of liquefaction and crack lied to the west of main fault (located SW-NE east Bantul).
FIGURE 1: Map of observation points due to the occurrence of the 2006 Yogyakarta earthquake [modified from 6,7,8]. Blue dots and stars are liquefaction occurrences and cracks position respectively. Red star is
the epicenter of the earthquake.
Eddy Hartantyo, Kirbani Sri Brotopuspito, Sismanto & Waluyo
International Journal of Applied Sciences (IJAS), Volume (5) : Issue (1) : 2014 3
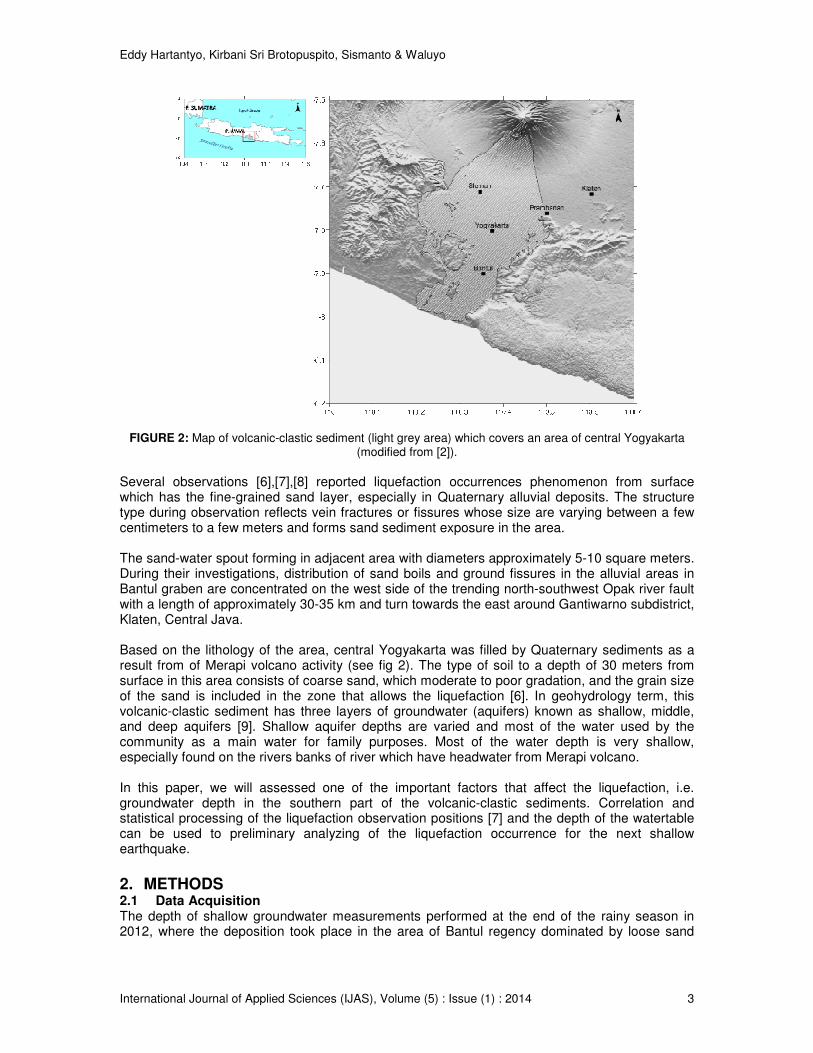
FIGURE 2: Map of volcanic-clastic sediment (light grey area) which covers an area of central Yogyakarta (modified from [2]).
Several observations [6],[7],[8] reported liquefaction occurrences phenomenon from surface which has the fine-grained sand layer, especially in Quaternary alluvial deposits. The structure type during observation reflects vein fractures or fissures whose size are varying between a few centimeters to a few meters and forms sand sediment exposure in the area. The sand-water spout forming in adjacent area with diameters approximately 5-10 square meters. During their investigations, distribution of sand boils and ground fissures in the alluvial areas in Bantul graben are concentrated on the west side of the trending north-southwest Opak river fault with a length of approximately 30-35 km and turn towards the east around Gantiwarno subdistrict, Klaten, Central Java. Based on the lithology of the area, central Yogyakarta was filled by Quaternary sediments as a result from of Merapi volcano activity (see fig 2). The type of soil to a depth of 30 meters from surface in this area consists of coarse sand, which moderate to poor gradation, and the grain size of the sand is included in the zone that allows the liquefaction [6]. In geohydrology term, this volcanic-clastic sediment has three layers of groundwater (aquifers) known as shallow, middle, and deep aquifers [9]. Shallow aquifer depths are varied and most of the water used by the community as a main water for family purposes. Most of the water depth is very shallow, especially found on the rivers banks of river which have headwater from Merapi volcano. In this paper, we will assessed one of the important factors that affect the liquefaction, i.e. groundwater depth in the southern part of the volcanic-clastic sediments. Correlation and statistical processing of the liquefaction observation positions [7] and the depth of the watertable can be used to preliminary analyzing of the liquefaction occurrence for the next shallow earthquake.
2. METHODS 2.1 Data Acquisition The depth of shallow groundwater measurements performed at the end of the rainy season in 2012, where the deposition took place in the area of Bantul regency dominated by loose sand
Eddy Hartantyo, Kirbani Sri Brotopuspito, Sismanto & Waluyo
International Journal of Applied Sciences (IJAS), Volume (5) : Issue (1) : 2014 4
(unconsolidated sand). Deposition of this sediment is laid from Mount Merapi to the South Coast, which is bounded by Piyungan hills on the east side and Progo River on the West side [2]. The total number of measuring wells are 493. Distribution of the well-point measurements following the village’s areas which still have open wells. These are clustered mainly in areas relatively far from urban areas. Measurement points are taken at open wells, so the depth of water table can be directly measured by using a tape meter. In the northern part, the measurement is limited to the east and west of Mlati district. This restriction is consistent with the planned location of a major research thesis whose took area is in the southern part of Yogyakarta Province. North Sleman regency areas are relatively not affected directly by an earthquake in Jogjakarta which normally occurs around the Opak’s fault. On the East side, the measurement area bounded by Berbah and Prambanan districts, and to the south following the Opak and Oya rivers. On the western side, the study is limited by the Progo River. Measurement is not performed in the area of limestone hills in the Pandak district. Measurements were made using simple equipment, such as; (a) Measuring tape, meter roll is used with a maximum length of 50 meters. This meter is used to measure the depth of the well from the surface of the water wells and measure the height of the lip edge of the well from the surface of the ground. (b) A Handy GPS, be used to locate and relocate the position of the measuring point. (c) Notebook, contains a data sheet that informs the position, height, depth of the water table, the location of the measurement, and the information associated with the measurement. (d) Field Guide, is used to locate and determine the points of measurement in the field. 2.2 Analysis Analysis was performed by using the position map of the liquefaction observation in Figure 1 and groundwater depth map. The scenario is taken as follows; (1) creating the map contour which depths of water table, where there were liquefaction occurred, are below the average, (2) the map where 80% (percentile 80) occurred, and (3) map where all liquefaction data were used. These results are mapped as a function of the depth of ground water to show the consistency of water table depth and liquefaction occurence.
3. RESULTS AND DISCUSSIONS
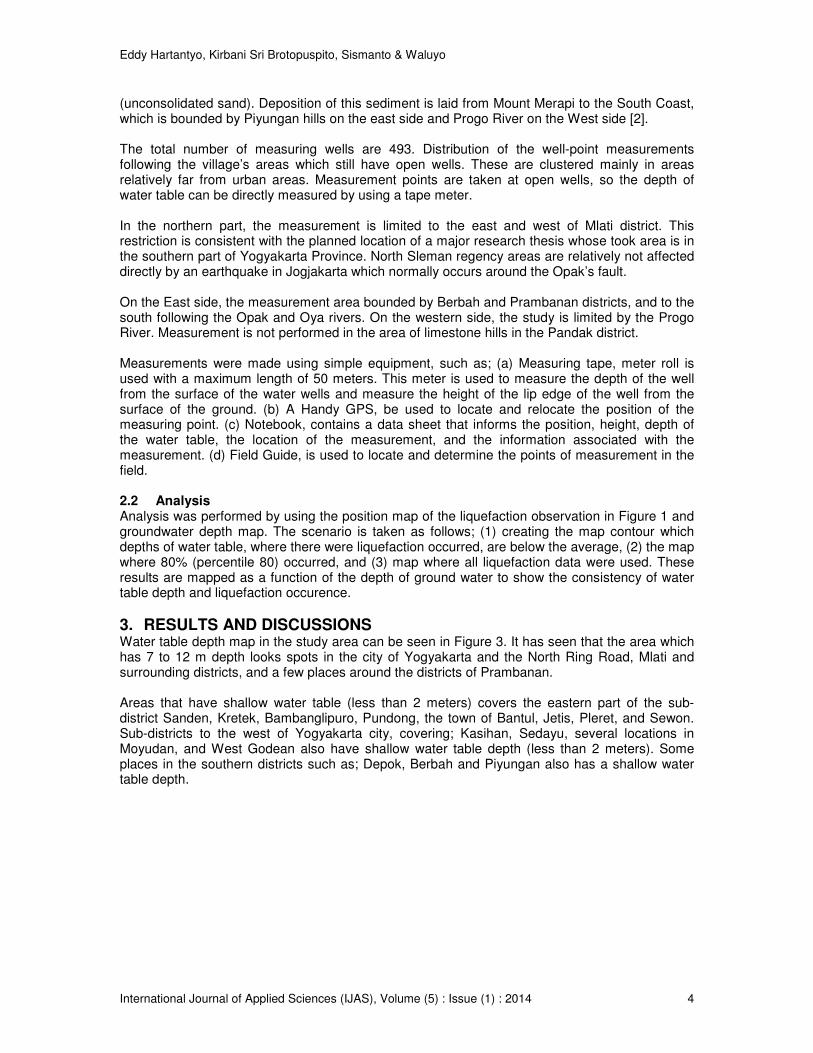
Water table depth map in the study area can be seen in Figure 3. It has seen that the area which has 7 to 12 m depth looks spots in the city of Yogyakarta and the North Ring Road, Mlati and surrounding districts, and a few places around the districts of Prambanan. Areas that have shallow water table (less than 2 meters) covers the eastern part of the sub-district Sanden, Kretek, Bambanglipuro, Pundong, the town of Bantul, Jetis, Pleret, and Sewon. Sub-districts to the west of Yogyakarta city, covering; Kasihan, Sedayu, several locations in Moyudan, and West Godean also have shallow water table depth (less than 2 meters). Some places in the southern districts such as; Depok, Berbah and Piyungan also has a shallow water table depth.
Eddy Hartantyo, Kirbani Sri Brotopuspito, Sismanto & Waluyo
International Journal of Applied Sciences (IJAS), Volume (5) : Issue (1) : 2014 5
FIGURE 3: Water table measurement depth map. Black dot is the position of the measurement point.
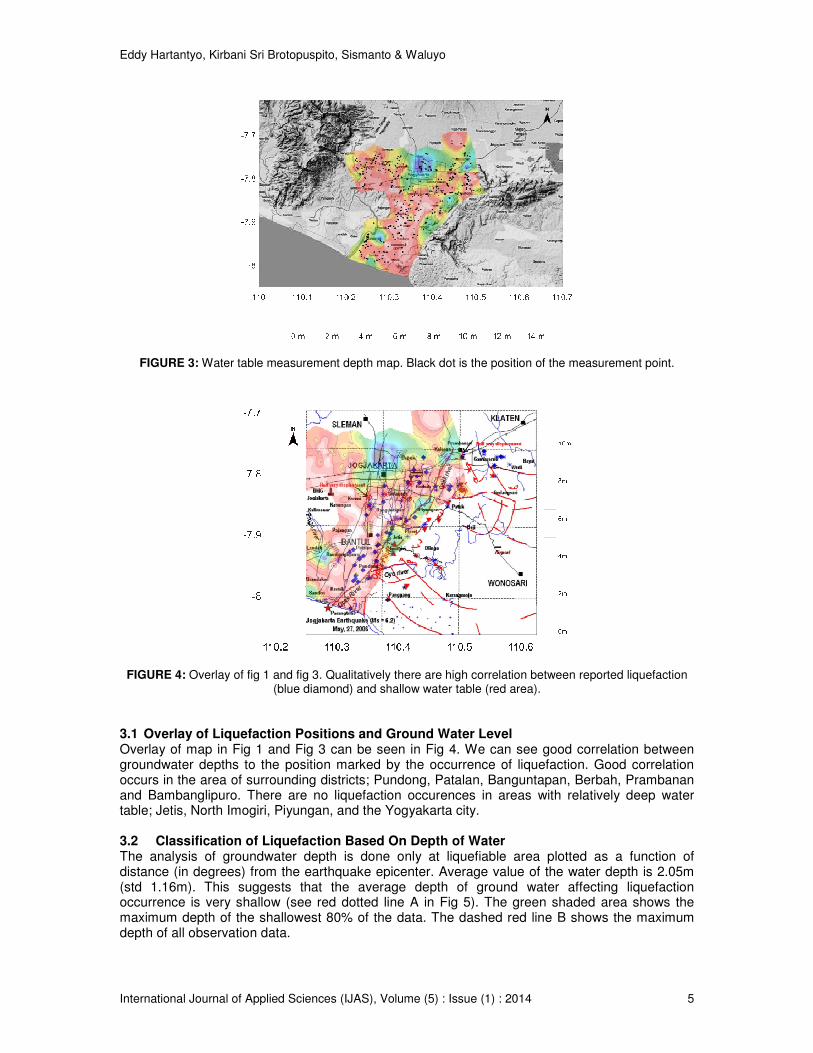
FIGURE 4: Overlay of fig 1 and fig 3. Qualitatively there are high correlation between reported liquefaction (blue diamond) and shallow water table (red area).
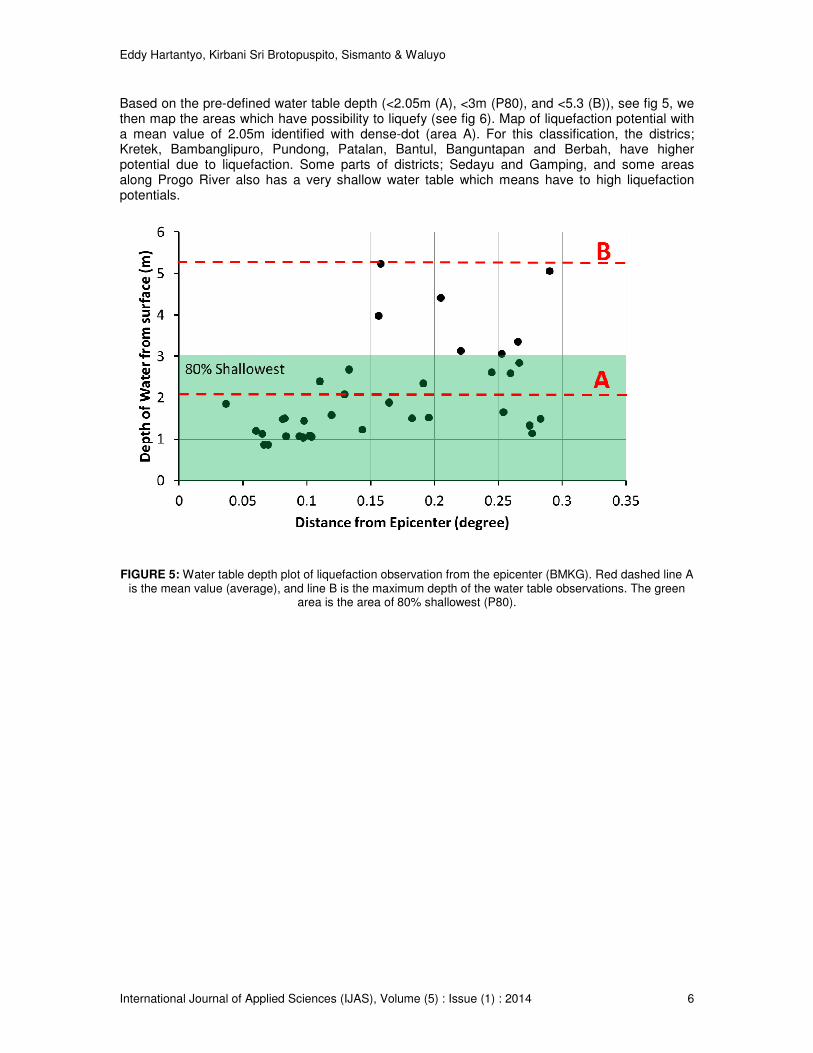
3.1 Overlay of Liquefaction Positions and Ground Water Level Overlay of map in Fig 1 and Fig 3 can be seen in Fig 4. We can see good correlation between groundwater depths to the position marked by the occurrence of liquefaction. Good correlation occurs in the area of surrounding districts; Pundong, Patalan, Banguntapan, Berbah, Prambanan and Bambanglipuro. There are no liquefaction occurences in areas with relatively deep water table; Jetis, North Imogiri, Piyungan, and the Yogyakarta city. 3.2 Classification of Liquefaction Based On Depth of Water The analysis of groundwater depth is done only at liquefiable area plotted as a function of distance (in degrees) from the earthquake epicenter. Average value of the water depth is 2.05m (std 1.16m). This suggests that the average depth of ground water affecting liquefaction occurrence is very shallow (see red dotted line A in Fig 5). The green shaded area shows the maximum depth of the shallowest 80% of the data. The dashed red line B shows the maximum depth of all observation data.
Eddy Hartantyo, Kirbani Sri Brotopuspito, Sismanto & Waluyo
International Journal of Applied Sciences (IJAS), Volume (5) : Issue (1) : 2014 6
Based on the pre-defined water table depth (<2.05m (A), <3m (P80), and <5.3 (B)), see fig 5, we then map the areas which have possibility to liquefy (see fig 6). Map of liquefaction potential with a mean value of 2.05m identified with dense-dot (area A). For this classification, the districs; Kretek, Bambanglipuro, Pundong, Patalan, Bantul, Banguntapan and Berbah, have higher potential due to liquefaction. Some parts of districts; Sedayu and Gamping, and some areas along Progo River also has a very shallow water table which means have to high liquefaction potentials.
FIGURE 5: Water table depth plot of liquefaction observation from the epicenter (BMKG). Red dashed line A is the mean value (average), and line B is the maximum depth of the water table observations. The green
area is the area of 80% shallowest (P80).

Eddy Hartantyo, Kirbani Sri Brotopuspito, Sismanto & Waluyo
International Journal of Applied Sciences (IJAS), Volume (5) : Issue (1) : 2014 7
FIGURE 6: Contour map of possible liquefaction based on water table depth criterion.
For the second classification, which is about 80 % of the data observed to occur liquefaction (area P80), or about the depth of 3m or less, it includes areas of type A plus several districts, for example Berbah and Kotagede districts. This area already covers almost 65% of the study area. For the worst classification (worst scenario), with a maximum water depth is estimated to occur liquefaction (area B, the maximum groundwater is 5.3 m), then almost the entire study area could potentially occurring liquefaction, except for the area of South part of Sleman regency and Yogyakarta city. Extent of area classification reached 90 % of the study area.
4. CONCLUSION
Yogyakarta area, which is dominated by volcanic-clastic sediments of Quarternary Young Merapi led to a layer of sand which reserve groundwater as a shallow aquifer. Shallow aquifer is very influential on the hazard due to the earthquake. Excellent correlation was shows between the shallowness of groundwater with the observational liquefaction data due to earthquake 26 May 2006. Almost the entire area of research (90%) have the liquefaction potential if assumed that the possible liquefaction reach 5.3m depth.
5. ACKNOWLEDGEMENT
Thanks to the team of open-well water table measurement and Geophysics Laboratory, UGM for funding this research.
6. REFERENCES [1] Sladen, J.A., D’Hollander, R.D., and Krahn, J., 1985. The Liquefaction of Sands, a Collapse
Surface Approach, Canadian Geotechnical Journal, Vol22, No.4, pp.564-578.
[2] Rahardjo, W., Sukandarrumidi & Rosidi, H.M.D. 1995. Geology Map : Yogyakarta Quadrangle Geological Map, Pusat Penelitian dan Pengembangan Geologi, Bandung.

Eddy Hartantyo, Kirbani Sri Brotopuspito, Sismanto & Waluyo
International Journal of Applied Sciences (IJAS), Volume (5) : Issue (1) : 2014 8
[3] Macdonald & Partners, Binnie & Partners, Hunting Technical Services Ltd. 1984. Greater Yogyakarta Groundwater Resources Study, Volume 13, Album of Map and Drawing, pp.10-23
[4] Jefferies, M. and Been, K., 2006. “Soil Liquefaction, A Critical State Approach”, Taylor and Francis Publishing Group, London and New York. Pp. 45-48
[5] Anderson, L.R., Keaton, J.R., Aubry, K., and Ellis, S.J., 1982. Liquefaction Potential Map for Davis County, Utah, Department of Civil and Environmental Engineering, Utah State University, Logan, Utah
[6] Lee, S.H.H., Ching, H.H., dan Muntohar, A.S. 2006. Study on Liquefaction Problem of Yogyakarta Area at 052706 Earthquake, Proceeding International Seminar and Symposium on Earthquake Engineering and Infrastructure & Building Retrofitting (EE & IBR), 28 Agustus 2006, Yogyakarta, 6-10
[7] Soebowo, E., Tohari, A., dan Sarah, D., 2007. Study of Liquefaction potency at the Opak Fault zones, Patalan – Bantul, Yogyajarta. Proceeding of Geotechnology Seminar : Contribution of earthscience in the continuous development, (in Bahasa Indonesia), Bandung 3 Desember 2007 ISBN: 978-979-799-255-5
[8] Adawiyah, R., 2008. Liquefaction Hazard Pattern at Yogyakarta Province (Case Study Yogyakarta Earthquake, 27 May 2006 (In Bahasa Indonesia), S1-Thesis, Departemen Geografi, FMIPA, Universitas Indonesia.
[9] Hendrayana, H., 1993. Hydrogeologie und Grundwassergewinnung Im Yogyakarta – Becken, Indonesien. Dissertation, Rheinisch-Westfaelischen Technischen Hochschule Aachen, Germany.