correlation analysis and model of the regional economic ... · the main methodological attitude is...
TRANSCRIPT

Correlation Analysis and Model of the Regional Economic Resilience
ONDREJ SVOBODA, TEREZA KLEMENTOVA Faculty of Economics and Administration
University of Pardubice Studentska 95, 532 10, Pardubice
CZECH REPUBLIC [email protected], [email protected], http://www.upce.cz
Abstract: Some regions can be described as more or less resilient to the economic recession from the position of resilient theory perspective. The aim of this paper is to suggest model involving determinants explaining the resilience and thus contributes to the understanding of this concept and to effective decisions about appropriate instruments of regional policy. A group of indicators that could be useful as determinants of regional economic resilience was suggested. The analytic part of this work is created upon the NUTS 2 regional data sets and reflects the impacts of the 2008 economic crises. The main methodological attitude is processed by the correlation analysis and decision tree. The designed model is discussed with regards on operational programs in the terms of the EU’s Cohesion Policy. The results of the analyses confirm that Human Capital, Regional Economic Performance, Innovation and R&D Activity, Labor Market and Economic Structure of Region are very important determinants. Key-Words: Regional resilience, economic resilience of regions, employment, regional policy, regional development, decision tree method. 1 Introduction The term regional economic resilience is widely put to practice in recent years, especially in connection with assessment of impacts of 2008 economic crisis. An ability to appropriately react within a regional economy is being considered. Despite the change, it is possible to find its utilization before the year 2008. The term has quite a broad meaning and utilization thanks to its multidisciplinary origin. It could be found in area of crisis management during evaluation of impacts of extraordinary events in a region. Regardless the various approaches, to resist and subsequently to adapt to a deviation is the common interpretation of regional economic resilience. To be able to resist is perceived as return to equilibrium which presents the desired condition of a region. Resilience is also described as a property, more precisely, as a process that allows regions to deal appropriately with adversity. Even though we can see regional economic resilience as closely defined subset of more generally perceived regional resilience, it still presents very extensive field as such. The reason why is because it includes reactions of regions to impacts of natural and anthropogenic disasters. Deviation of economy could be caused by the whole spectrum of events, including global or national economic downturns, social disorders or natural disasters. Regional resilience is commonly looked
upon through the eyes of development concerning regional indicators of labour market or regional product. When an economic crisis is taken into consideration, this field of study gains topicality and initiates creation of new methodical approaches, the aim of which is to formulate a genuine view on field of regional development and regional policy. The aim of the research described in the study is to design a model for evaluation of regional economic resilience. This model could be useful for effective decision making in the field of regional policy within regional management processes. Consequently, this paper introduces the knowledge gained on the basis of expert studies which determine appropriate indicators for measuring intensity of regional economic resilience and a set of factors that seem to be a regulating parameter in the process dealing with adversity. Our study designs and provides a set of factors concerning the economic resilience of regions on basis of realized literature survey. Next part of this study is focused on evaluation of the connection between factors which are substituted by indicators affecting the economic resilience and indicator of economic resilience of regions. This is done by using data mining method (decision tree algorithm C5.0) and empirical data of selected regions of the European Union which leads to construction of the model. The last part of the study is focused on application of the model of economic resilience of regions
WSEAS TRANSACTIONS on BUSINESS and ECONOMICS Ondrej Svoboda, Tereza Klementova
E-ISSN: 2224-2899 765 Volume 11, 2014

based on the found factors. This model could be useful for evaluation of a regional economic resilience and for promoting decision-making in the field of implementation of regional policy within the realization of regional management. The results are discussed and summarized in the end of the study. 2 Economic Resilience According to some authors the concept of regional resilience offers a new perspective on regional development with regard on decision-making concerning many uncertainties and ongoing changes in society. Regional resilience is regarded as one of the main ideas of new perspective of regional development (e.g. [9], [15]). The concept of the regional resilience is described in the literature dealing with the effects of natural or anthropogenic emergencies. The term appears in different research areas such as ecology, sociology, and contingency planning in relation to the effects of critical infrastructure failure. These areas also include the issue of flood risk management. The term is mentioned in the evaluation process impacts of climate change as well (for more information see [9], [15], [7]). Pendall et al. state that [16] the concept of regional resilience could also involve a reaction of regions not only to slow negative shocks, but also to long-term processes such as long-term deindustrialization of the region, depopulation, demographic changes (aging population), climate change, etc. Therefore regional resilience is seen as the essence of why some regions respond flexibly to economic, social, political or environmental changes, while others record long history of worsening of the existing development. So it can be said that the concept of resilience is the ability or process of the region to allow effectively resisting and adapting to various challenges (such as sudden fluctuations and slowly running processes). The inspiration for the term resilience to adapt into the regional science were especially studies from the US. These studies describe regional resilience in the term of reactions of regions to extraordinary events (e.g. the 9/11 attacks in New York, Catherine Hurricane) - for example the study by Foster [6]. The aim of resilience studies is to describe impacts of the several deviations and disruptions such as economic recession, unexpected rise of the main regional rivals, unexpected plant closures, new technological challenges etc. [18] Currently the concept is elaborated on basis of a broad spectrum of scientists in the field of regional analysts,
economists, and regional economic geographers. We could mention Martin [13], Hill, Wial and Wolman [8], Pendall [16] and Foster [6]. The literature offers us three different points of view on the economic resilience of regions. The first one is based on the technical concept of resistance. This approach says that the economic resilience of the region is seen as an ability of the economic system to get at a level that would correspond with a situation without the existence of a negative deviation. The second one is a concept of "ecological resilience" emphasizing the magnitude of shock or failure which the region is able to absorb before it diverts from its pre-crisis state. According to some authors (e.g. [17], [14]) - in the case of two mentioned approaches – the long-term development of the successful economies is not taken sufficiently into account. This criticism has led to the third approach called "adaptive" or "evolutionary" approach. This approach emphasizes the system's ability to accept change either preventively or responsively to sudden changes in a system structure to minimize the destabilizing changes. So the main focus is on the adaptability of the system. The three above-mentioned concepts of economic resilience of regions summarize the fact that the resilient region is able to achieve the desired response in different ways (either the ability to return to a level that would correspond with the situation without the existence of abrupt changes, or absorption destabilizing deviation, or undergoing a change in its form to minimize destabilizing effect). For the purpose of this research a set of potential determinants of regional resilience was designed. Set of potential determinants is based on previous studies - e.g. [13], [6]. The set is divided into 6 sections:
• Sectoral Structure, • Human Capital, • Labour Market, • Socio-demographic Characteristics, • Regional Economic Performance, • Innovation Activity and R&D.
2.1 Method for Measuring Economic Resilience of Regions There are many economic indicators that can be measured when we want to know intensity of regional resilience. These include employment; gross domestic product (GDP) and gross value added (GVA). The first step is to evaluate positive
WSEAS TRANSACTIONS on BUSINESS and ECONOMICS Ondrej Svoboda, Tereza Klementova
E-ISSN: 2224-2899 766 Volume 11, 2014
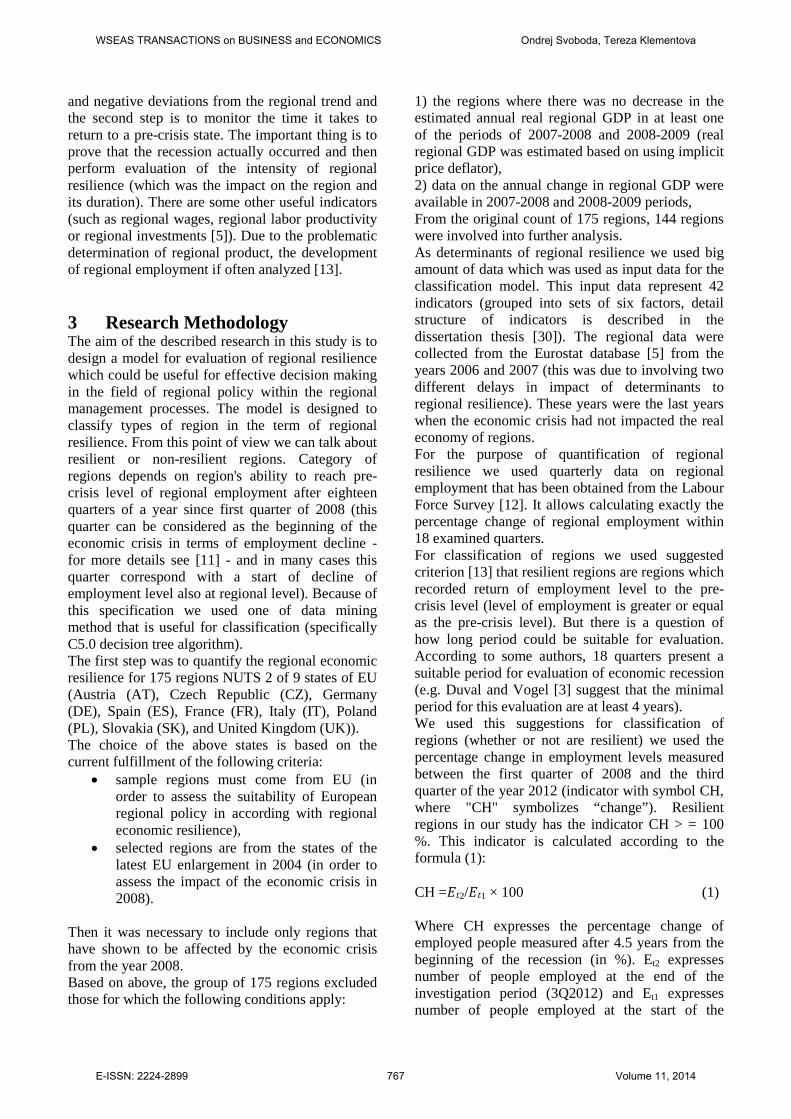
and negative deviations from the regional trend and the second step is to monitor the time it takes to return to a pre-crisis state. The important thing is to prove that the recession actually occurred and then perform evaluation of the intensity of regional resilience (which was the impact on the region and its duration). There are some other useful indicators (such as regional wages, regional labor productivity or regional investments [5]). Due to the problematic determination of regional product, the development of regional employment if often analyzed [13]. 3 Research Methodology The aim of the described research in this study is to design a model for evaluation of regional resilience which could be useful for effective decision making in the field of regional policy within the regional management processes. The model is designed to classify types of region in the term of regional resilience. From this point of view we can talk about resilient or non-resilient regions. Category of regions depends on region's ability to reach pre-crisis level of regional employment after eighteen quarters of a year since first quarter of 2008 (this quarter can be considered as the beginning of the economic crisis in terms of employment decline - for more details see [11] - and in many cases this quarter correspond with a start of decline of employment level also at regional level). Because of this specification we used one of data mining method that is useful for classification (specifically C5.0 decision tree algorithm). The first step was to quantify the regional economic resilience for 175 regions NUTS 2 of 9 states of EU (Austria (AT), Czech Republic (CZ), Germany (DE), Spain (ES), France (FR), Italy (IT), Poland (PL), Slovakia (SK), and United Kingdom (UK)). The choice of the above states is based on the current fulfillment of the following criteria:
• sample regions must come from EU (in order to assess the suitability of European regional policy in according with regional economic resilience),
• selected regions are from the states of the latest EU enlargement in 2004 (in order to assess the impact of the economic crisis in 2008).
Then it was necessary to include only regions that have shown to be affected by the economic crisis from the year 2008. Based on above, the group of 175 regions excluded those for which the following conditions apply:
1) the regions where there was no decrease in the estimated annual real regional GDP in at least one of the periods of 2007-2008 and 2008-2009 (real regional GDP was estimated based on using implicit price deflator), 2) data on the annual change in regional GDP were available in 2007-2008 and 2008-2009 periods, From the original count of 175 regions, 144 regions were involved into further analysis. As determinants of regional resilience we used big amount of data which was used as input data for the classification model. This input data represent 42 indicators (grouped into sets of six factors, detail structure of indicators is described in the dissertation thesis [30]). The regional data were collected from the Eurostat database [5] from the years 2006 and 2007 (this was due to involving two different delays in impact of determinants to regional resilience). These years were the last years when the economic crisis had not impacted the real economy of regions. For the purpose of quantification of regional resilience we used quarterly data on regional employment that has been obtained from the Labour Force Survey [12]. It allows calculating exactly the percentage change of regional employment within 18 examined quarters. For classification of regions we used suggested criterion [13] that resilient regions are regions which recorded return of employment level to the pre-crisis level (level of employment is greater or equal as the pre-crisis level). But there is a question of how long period could be suitable for evaluation. According to some authors, 18 quarters present a suitable period for evaluation of economic recession (e.g. Duval and Vogel [3] suggest that the minimal period for this evaluation are at least 4 years). We used this suggestions for classification of regions (whether or not are resilient) we used the percentage change in employment levels measured between the first quarter of 2008 and the third quarter of the year 2012 (indicator with symbol CH, where "CH" symbolizes “change”). Resilient regions in our study has the indicator CH > = 100 %. This indicator is calculated according to the formula (1): CH = 2/ 1 × 100 (1) Where CH expresses the percentage change of employed people measured after 4.5 years from the beginning of the recession (in %). Et2 expresses number of people employed at the end of the investigation period (3Q2012) and Et1 expresses number of people employed at the start of the
WSEAS TRANSACTIONS on BUSINESS and ECONOMICS Ondrej Svoboda, Tereza Klementova
E-ISSN: 2224-2899 767 Volume 11, 2014

examined period, which is for the purposes of this paper set for (1Q2008). Because of quarterly data, we rearranged the data by the X12-ARIMA method so that we get seasonally adjusted time series (to remove the seasonal component in time series). The last method used for designing the evaluation model is a classification method - so-called „decision tree“. The decision tree algorithm is one of the possible ways of representing knowledge. Creating a decision tree includes dividing data into many subsets. Common approach includes use of training data. The learning process creating the model is based on dividing training data into successively smaller and smaller subsets (tree nodes). The aim of this process is a situation when the same class of samples is divided into its subsets. This procedure is often called a top down induction of decision trees (TDIDT). The aim is to find a tree which is consistent with the training data [2]. 4 Results of Correlation Analysis The following text presents the main results of the correlation analysis. The text is divided by area. It was necessary to decide on the choice of the type of the correlation coefficient. A condition for the use of parametric variations of correlation coefficient is proof of the fact that both series which enter into the calculation come from a normal distribution. At this point it should be noted that Shapiro - Wilk W test failed to show the normality of data. Hence variant was used nonparametric correlation analyzes. The basic tool to investigate the role of the proposed factors of the regional economic resilience will consist of Spearman's correlation coefficient. Significant values (alfa = 0.05) in the tables below are bold. On the basis of a comparison of the results for 2007 and 2006 is possible to conclude that the differences between the statistically significant relationships are negligible (indicator’s data in tables are from the year 2007). 4.1 Sectoral Structure The results of the correlation analysis of the „The Sectoral Structure of the Region“ summarize the text below.
Table 1 - Results of correl. anal. - Sectoral Structure according to NACE Rev. 2
Variable CH
Agriculture, forestry and fishing (A) -0.335 Industry, mining (B, C, D, E) -0.224 Construction (F) 0.130 Wholesale and retail trade, transportation and storage, accommodation and food service activities (G, H ,I)
0.210
Information and communication (J) 0.388 Financial and insurance activities (K) 0.560 Real estate activities (L) 0.357 Professional, scientific, technical, administrative and support service activities (M, N)
0.326
Public administration and defense, compulsory social security, education, health and social care (O,P,Q)
0.198
Arts, entertainment, recreation and other activities (R, S, T, U) 0.174
Source: own processing on the bases of LFS microdata a EUROSTAT
The above table (Table 1) lists all statistically significant correlations have been established on the basis of statistical test of significance of the correlation coefficient (bold values). One of the most important factors is proportion of financial intermediation on the number of persons employed (code K). This result is surprising, but not unique [17]. The proportion of persons employed in the Professional, scientific, technical, administrative and support service activities (M, N) is positively correlated with the change of the number of persons employed (correlation coefficient = 0.326 for 2007). Another interesting area was to verify whether you can quantify the effect of size or degree of diversification for regional economic resilience.
WSEAS TRANSACTIONS on BUSINESS and ECONOMICS Ondrej Svoboda, Tereza Klementova
E-ISSN: 2224-2899 768 Volume 11, 2014

Table 2 - Results of correlation analysis - Diversification of regional sectors
Variable CH
The adjusted index of diversification - according to the number of persons employed
-0.353
The adjusted index of diversification - according to the gross domestic product -0.298
The adjusted index of diversification - according to the gross fixed capital formation
-0.128
Source: own processing on the bases of LFS microdata a EUROSTAT
The above table (Table 2) demonstrated a statistically significant relationship between the adjusted index of diversification according to the number of persons employed and the degree of economic resilience. Adjusted diversification index was calculated in three ways: based on the number of persons employed; on the basis of gross value added of sectors and on the basis of structure of investment (Gross fix capital formation). Level of structural diversification positively influences the degree of economic resilience (high values of index of diversification mean low level of diversification so the correlation coefficients are negative). The last version of the index (based on Gross fix capital formation) does not prove statistically this relationship. 4.2 Human Capital Results of the correlation analysis of the group of indicators named „Human Capital “summarize the text below. Table 3 - Results of correlation analysis - Human Capital
Variable CH
Human Resources in Science and Technology 0.306
Human Resources in Science and Technology – according to tertiary education
-0.016
Human Resources in Science and Technology – according to occupation 0.605
Human Resources in Science and Technology – core 0.142
Percentage of people with age 25-64 with lower secondary education according to ISCED-97 (level 2)
-0.392
Percentage of people with age 25-64 with upper secondary education according to ISCED-97 (level from 3 to 4)
0.313
Percentage of people with age 25-64 with tertiary education according to ISCED-97 (level from 5 to 6)
0.022
Percentage of people with age 25-64 with upper secondary or tertiary education according to ISCED-97 (level from 3 to 6)
0.388
Source: Own processing according to the LFS microdata and EUROSTAT
Some indicators can be described as factors of economic resilience: Human Resources in Science and Technology, Human Resources in Science and Technology – according to occupation, People with age 25-64 with lower secondary education according to ISCED-97 (level 2), Percentage of people with age 25-64 with upper secondary education according to ISCED-97 (level from 3 to 4), Percentage of people with age 25-64 with upper secondary or tertiary education according to ISCED-97 (level from 3 to 6). Correlation coefficient between Human Resources in Science and Technology – according to occupation and indicators of regional economic resilience (CH) in achieved in comparison with other statistically significant relationships with relatively high value (correlation coefficient is 0.605). 4.3 Labour Market Results of the correlation analysis of the group of indicators named „Labour Market“summarize the text below. Table 4 - Results of correlation analysis – Labour Market
Variable CH
The job vacancy rate 0.762 The rate of economically active people with age 15-64 years 0.331
Employment rate with age 15 to 64 years 0.355 The unemployment rate -0.223
Source: Own processing according to the LFS microdata and EUROSTAT
WSEAS TRANSACTIONS on BUSINESS and ECONOMICS Ondrej Svoboda, Tereza Klementova
E-ISSN: 2224-2899 769 Volume 11, 2014

The table above shows the results obtained from the correlation analysis of indicators of "Labour Market". The table shows that all the selected indicators are significant. The correlation coefficient for that relationship (indicator the job vacancy rate and CH), reached a value of 0,762. Here it is necessary to take into account the incompleteness of indicator values that were available for the years for regions of states CZ, ES, PL and SK. Sufficient level of "Job Vacancy rate" allows the regions to absorb the potential increase in the number of unemployed people. It was found one stress factor (it is unemployment rate). All other factors can be confirmed as a protection factors. The employment rate of people in the age of 15-64 years can be described as a protection factor. 4.4 Socio-demographic Characteristics of the Region Results of correlation analysis of the “Socio-demographic Characteristics of the Region" summarizes text of this subchapter. Table 5 - Results of correl. anal. - Socio-demographic Character. of the Region
Variable CH
Size of population 0.142 The proportion of people at risk of poverty -0.352 The proportion of people living in households with very low work intensity 0.167
The proportion of people suffering from severe material deprivation 0.258
People at risk of poverty or social exclusion -0.308 Percentage change in population between 2004 and 2007, respectively 2006 and 2003 -0.150
The rate of net migration -0.115 Source: Own processing according to the LFS
microdata and EUROSTAT As an indicator with the highest correlation relationship of group can be mentioned "The proportion of people at risk of poverty". This indicator correlated with the indicator of regional economic resilience with a coefficient of -0.352. Another important factor is "People at risk of poverty or social exclusion“.
4.5 Economic Performance of the Region Results of the correlation analysis of the "Economic Performance of the Region" summarizes the text of this subchapter. Table 6 - Results of the correlation analysis – Economic Performance
Variable CH
The estimate of real gross domestic product at market prices per capita, expressed in purchasing power standard (base year = 2005)
0.418
Gross fixed capital formation per capita -0.029 Labour productivity (gross value added of the number of persons employed) 0.573
Disposable income per capita 0.535 Real GDP growth estimated at 2005 prices - the difference between 2004 and 2007 -0.361
Source: Own processing according to the LFS microdata and EUROSTAT
Results show that all of the selected indicators may be considered as factors of regional economic resilience. "Disposable income per capita" can be considered as one of the important factors. Another important factor which was confirmed is labor productivity (measured as gross value added of the number of people employed) and indicator of an estimated real GDP (expressed in purchasing power standards). Labour productivity is very important factor also in other studies [1]. 4.6 Innovation and Research Activity Results of the correlation analysis of the „Innovation and Research Activity“ summarize the text of this subchapter. Table 7 - Results of correlation analysis - Innovation and Research Activity
Variable CH
Total intramural R&D expenditure(in PPS) 0.477 The proportion of persons employed in R&D in the economically active population 0.359
The proportion of researchers employed in R&D in the economically active population 0.361
Number of patent applications per million 0.599
WSEAS TRANSACTIONS on BUSINESS and ECONOMICS Ondrej Svoboda, Tereza Klementova
E-ISSN: 2224-2899 770 Volume 11, 2014

inhabitants Source: Own processing according to the LFS
microdata and EUROSTAT The table above summarizes all the results for the "Innovation and Research Activity." The indicator "Number of patent applications per million inhabitants" is one of the most important factors in this group, as an indicator correlates with CH (correlation coefficient is 0.599). The second most important factor is the indicator "Total intramural R&D expenditure (in PPS)". The proportion of persons employed in R&D of the economically active population“ and „The proportion of researchers in R&D in the economically active population“ indicator correlates in 2007 with of regional economic resilience indicator (CH). 5 Model of the Regional Economic Resilience To fulfill the aim of the research, it was necessary to create a model applicable to evaluation of regional economic resilience. More specifically, this part of the study presents a set of rules used for classification of regions into a group of resilient or non-resilient regions (according to the CH indicator). For this purpose a decision tree algorithm was used. A decision tree was created in the programming environment SPSS Clementine 10.1. The next text describes how an evaluation model was created. The first step was narrowing the set of all indicators. This step was taken on the basis of correlation analysis. For the model indicators that proved statistical significance with the indicator CH at a significance level of 0.05 were selected, while relationship expressed by Spearman's correlation coefficient (in absolute value) was at least 0.3. The results of correlation analysis showed no effect of the factor’s delay in the influence on economic resilience. In relation to nature of the evaluated indicators, it can be assumed that their impact on regional resilience is seen with a minimal delay. That’s why the input data was selected from the year 2007. For successful application of the decision tree algorithm, it was necessary to perform data transformation. This transformation was based on the conversion of a continuous variable (indicator CH) to a discrete type (new index CH_2c was set). Each region has obtained a value of either 1 (resilient region by CH) or 2 (non-resilient region by CH).
The input data was divided into two parts - training and test part at a ratio of 3:1. Data of regions were randomly divided into two groups - 98 regions into the training group and 33 regions into the test group. The regions included into the test group were used to evaluate quality of founded rules. The following rules have been obtained by the use of method of a decision tree (especially method of C5.0 decision tree): GVA/EM <= 51,282 [ Mode: 2 ] PATmi <= 101,721 [ Mode: 2 ] => 2 PATmi > 101,721 [ Mode: 1 ] EMr15 <= 68,600 [ Mode: 2 ] => 2 EMr15 > 68,600 [ Mode: 1 ] => 1 GVA/EM > 51,282 [ Mode: 1 ] Pr-ste25-64 <= 63,200 [ Mode: 2 ] => 2 Pr-ste25-64 > 63,200 [ Mode: 1 ] Pr-use25-64 <= 47,700 [ Mode: 1 ] Pr-use25-64 <= 44,700 [ Mode: 1 ] Pr-use25-64 > 44,700 [ Mode: 2 ] => 2 Where GVA/EM means Labour Productivity (gross value added of the number of people employed in PPS), PATmi means Number of European Patent Applications per million Inhabitants. EMr15 means Employment rate of People aged 15 and older. Pr-ste means The Proportion of People aged 25-64 years with Upper Secondary or Tertiary education. Pr-use means The Proportion of People aged 25-64 years with Upper Secondary Education. 5.1 Evaluation of the Quality of the Model and its Modification The model classifies the regions with the reliability of 93.75% (on a set of test data). Relationships within the model correspond to relationships found in the correlation analysis. It should be noted here that the structure of the generated rules may not always correspond with theoretical understanding of the issue. Indicators used in the structure of the decision tree are suitable for the evaluation of economic resilience but not entirely appropriate for supporting effective decision making in the implementation of regional policy. The results obtained on the basis of the correlation analysis suggest the existence of other significant relationships. On this basis, it would be possible to replace some of the indicators and modify the structure of the model with respect to its better usability. A disadvantage of the original model is mainly use of the indicator "Number of European Patent Applications per million Inhabitants". This indicator cannot be directly controlled by means of regional policy instruments. The indicator "Total Intramural
WSEAS TRANSACTIONS on BUSINESS and ECONOMICS Ondrej Svoboda, Tereza Klementova
E-ISSN: 2224-2899 771 Volume 11, 2014

R&D Expenditures (in PPS)" appears to be a suitable replacement. Another disadvantage of the original model is absence of indicators which correspond with a factor "Sectoral Structure of the Region." The selection of indicators from this group was determined by keeping the classification accuracy of the original model (as a new input indicator from this group The adjusted index of diversification was used - according to the number of employed people). A side effect of these changes was an urge to use indicators "Human Resources in Science and Technology" and removing the indicator "Proportion of People aged 25-64 years with Higher Secondary Education." The following figure (Fig. 1) shows a graphical image of rules of the modified evaluation model. Used abbreviations of indicators are explained in the Table no.1. Fig. 1 - Modified evaluation model
Source: Own construction from the programming environment Clementine 10.1
Table (see Table 8) illustrates the relevant factors and indicators which were used to generate the modified evaluation model.
Table 8 - Significant factors and indicators used in the model Factor Indicator
Sectoral Structure of Region
The Adjusted Index of Diversification - according to the number of people employed – symbolizes as UID-EM
Human Capital Human Resources in Science and Technology - the total supply – symbolizes as HRSTr
Human Capital The Proportion of People aged 25-64 years with Upper Secondary or Tertiary Education – symbolizes as Pr-ste25-64
Labor Market Employment Rate aged 15 to 64 years – symbolizes as EMr15-64
The Economic Performance of the Region
Labour Productivity (gross value added of the number of people employed) – symbolizes as GVA/EM
Innovation and Research Activity
Total Intramural R&D Expenditures (in PPS) – symbolizes as GERDpi
Source: Own construction based on the modified model
The classification accuracy of the modified model was also relatively high: 87.8 %. Quality of the model with 6 factors shows also results of Chi-Square test and Student's t-test (see Table 9 – 20). In some cases total number of regions in tables 9 – 20 doesn’t reach to number of 144 finally examined regions due to the missing values. All tests have the same level of significance (alfa = 0.05). For categorisation of factors in Chi-Square test as classification criteria were used median values of individual factors. First Chi-Square test for UID-EM and CH shows significant relation (p-value = 0.036) – see Table 9.
WSEAS TRANSACTIONS on BUSINESS and ECONOMICS Ondrej Svoboda, Tereza Klementova
E-ISSN: 2224-2899 772 Volume 11, 2014

Table 9 – Observed Frequencies – UID-EM and CH Level of UID-EM
Region Region Total UID-EM<=0.25 UID-EM>0.25 CH=1 15 6 21 CH=2 25 31 56 Total 40 37 77
Source: Own processing according to the LFS microdata and EUROSTAT
Also Student’s t-test shows significant relationship between UID-EM and CH (Table 10). Table 10 – Two-sample t-test – UID-EM and CH
Variable Region Region
CH=1 CH=2 Mean of UID-EM 0.196 0.314
p-value St. deviation St. deviation
CH=1 CH=2 0.043 0.215 0.228 Source: Own processing according to the LFS
microdata and EUROSTAT Second Chi-Square test for HRSTr and CH shows significant relation (p-value = 0.021) – see Table 11. Table 11 – Observed Frequencies – HRSTr and CH
Level of HRSTr
Region Region Total
HRSTr>=26 HRSTr<26 CH=1 29 18 47 CH=2 40 57 97 Total 69 75 144
Source: Own processing according to the LFS microdata and EUROSTAT
Also Student’s t-test shows significant relationship between HRSTr and CH (Table 12). Table 12 – Two-sample t-test – HRSTr and CH
Variable Region Region
CH=1 CH=2 Mean of HRSTr 28.230 25.042
p-value St. deviation St. deviation
CH=1 CH=2 0.003 5.389 6.091
Source: Own processing according to the LFS microdata and EUROSTAT
Third Chi-Square test for Pr-ste25-64 and CH shows significant relation (p-value = 0.002) – see Table 13. Table 13 – Observed Frequencies – Pr-ste25-64 and CH Level of Pr-ste25-
64
Region Region Total
Pr-ste25-64>=76.1 Pr-ste25-64<76.1
CH=1 32 14 46 CH=2 38 59 97 Total 70 73 143
Source: Own processing according to the LFS microdata and EUROSTAT
Student’s t-test shows significant relationship between Pr-ste25-64 and CH (Table 14). Table 14 – Two-sample t-test – Pr-ste25-64 and CH
Variable Region Region
CH=1 CH=2 Mean of Pr-ste25-
64 77.893 69.693
p-value St. deviation St. deviation
CH=1 CH=2 0.002 8.428 16.820 Source: Own processing according to the LFS
microdata and EUROSTAT Fourth Chi-Square test for EMr15-64 and CH shows significant relation (p-value = 0.00004) – see Table 15. Table 15 – Observed Frequencies – EMr15-64 and CH Level
of EMr15-
64
Region Region Total
EMr15-64>=66.8 EMr15-64<66.8
CH=1 33 14 47 CH=2 33 64 97 Total 66 78 144
Source: Own processing according to the LFS microdata and EUROSTAT
WSEAS TRANSACTIONS on BUSINESS and ECONOMICS Ondrej Svoboda, Tereza Klementova
E-ISSN: 2224-2899 773 Volume 11, 2014

Student’s t-test shows significant relationship between EMr15-64 and CH (Table 16). Table 16 – Two-sample t-test – EMr15-64 and CH
Variable Region Region
CH=1 CH=2 Mean of EMr15-
64 68.891 63.936
p-value St. deviation St. deviation
CH=1 CH=2 0.0001 5.566 7.149 Source: Own processing according to the LFS
microdata and EUROSTAT Fifth Chi-Square test for GVA/EM and CH shows significant relation (p-value = 0.00000) – see Table 17. Table 17 – Observed Frequencies – GVA/EM and CH Level of
GVA/EM Region Region
Total GVA/EM>=51.66 GVA/EM<51.66
CH=1 36 11 47 CH=2 28 69 97 Total 64 80 144
Source: Own processing according to the LFS microdata and EUROSTAT
Student’s t-test shows significant relationship between GVA/EM and CH (Table 18). Table 18 – Two-sample t-test – GVA/EM and CH
Variable Region Region
CH=1 CH=2 Mean of GVA/EM 55.456 42.890
p-value St. deviation St. deviation
CH=1 CH=2 0.0001 21.660 15.002 Source: Own processing according to the LFS
microdata and EUROSTAT Sixth Chi-Square test for GERDpi and CH shows significant relation (p-value = 0.00000) – see Table 19.
Table 19 – Observed Frequencies – GERDpi and CH Level of GERDpi
Region Region Total GERDpi>=231 GERDpi<231
CH=1 30 11 41 CH=2 24 59 83 Total 54 70 124
Source: Own processing according to the LFS microdata and EUROSTAT
Student’s t-test shows significant relationship between GERDpi and CH (Table 20). Table 20 – Two-sample t-test – GERDpi and CH
Variable Region Region
CH=1 CH=2 Mean of GERDpi 491.751 237.396
p-value St. deviation St. deviation
CH=1 CH=2 0.00002 387.3 251.7
Source: Own processing according to the LFS microdata and EUROSTAT
5.1.1 Proposal for the use of the Model and its Limitations The proposed model is designed to evaluate the economic resilience of regions. It can be used to assess the current state of regional economies. Limitations of the model arise from the fact that model’s structure is based on the uniqueness of input data. This uniqueness is based on selection of factors and also on selection of regions influence on the structure of model. The structure of the model is also influenced by the length of time series that was analyzed. 5.2 Recommendations for application of Regional Policy The model allows identification of the key factors of economic resilience of regions. The analysis shows that the way to improve economic resilience of regions may stem from regional policy measures affecting the key factors that were found. The following table (Table 21) shows an overview of these indicators. The second column contains the proposed regional policy instruments (namely the operational programs for the period 2007-2013) which could affect the size of those indicators.
WSEAS TRANSACTIONS on BUSINESS and ECONOMICS Ondrej Svoboda, Tereza Klementova
E-ISSN: 2224-2899 774 Volume 11, 2014

Model could be implemented in other similar models (e.g. [10], [19], [21]). Table 21 - Proposed measures for supporting the economic resilience of regions
Indicator Instrument of regional policy
Human Resources in Science and Technology
Operational Programme Research and Development for Innovation (OP R&DI)
People aged 25-64 with upper secondary or tertiary education, People aged 25-64 with upper secondary education according to ISCED-97 (level from 3 to 6)
Operational Programme Education for Competitiveness (OP EC)
Total Intramural R&D Expenditures (PPS)
Operational Programme Enterprise and Innovations (OPEI)
Employment rate of people aged 15 to 64 years
Operational Programme Human Resources and Employment (HRE OP)
Adjusted Index of Diversification - by number of people employed
Operational Programme Enterprise and Innovations (OPEI)
Source: own construction 6 Comparison of used methods and obtained results Correlation analysis shows many statistically significant relationships between examined indicators and key indicator CH. Unfortunately, the most common statistically significant relationships range from 0.3 to 0.4 of Spearman’s coefficient in absolute value. Correlation analysis is therefore not so useful tool for modeling economic resilience of regions in comparison with decision tree method. On the other hand there is useful application of correlation analysis as method for selection of input indicators for some specific methods - specifically in the case of data mining methods. In our case we used correlation analysis as filter of relatively big dataset.
The decision tree method showed good classification of the regions according to their previous state (The classification accuracy in the case of original model was 93.75 % resp. 87.8 % for modified model). All Chi-Square tests and Student's t-tests confirmed the statistical significance of all founded factors. Analyses used in this paper confirmed that regions with more diversified sectoral structure tend to have higher levels of resilience - this finding was confirmed by specific use of The Adjusted Index of Diversification. Results of correlation analysis correspond with similar foundlings of Duval and Vogel [3]: the lower degree of restoration of persons employed was recorded in regions where there is a greater concentration of people working in the sector of "Agriculture, Fisheries and Forestry". Furthermore, it was confirmed that the level of human capital expressed through the "Human Resources in Science and Technology" is a protective factor of resilience. In other words, regions which have a higher proportion of Human Resources in Science and Technology recorded relatively higher resilience. Important role of Human capital was proved also by ESPON research project [4]. The presence of well-educated and skilled workforce can be seen as a protective factor for economic resilience of regions as well. Economically powerful regions with higher values of for at least one of the following indicators: labor productivity, disposable income, gross fixed capital formation, regional product, are more resilient than those that have lower values of this indicators. Innovation and research activity represented by the number of registered patent applications per capita, and the size of spending on research and development positively affect the response of regions on an economic shock. Beyond these results, it appears that the worst are the regions with lack of scientific research base. They are usually characterized by a minimum innovation activity. Correlation analysis and also decision tree analysis proven this relation. Similar conclusions states Ron Martin [13]. 7 Conclusion The aim of the described research was to design a model for evaluation of regional resilience which could be useful for effective decision making in the field of regional policy within the regional management processes. Fulfilment of this aim demanded to carry out some partial goals. Firstly some factors that were tested - whether they were
WSEAS TRANSACTIONS on BUSINESS and ECONOMICS Ondrej Svoboda, Tereza Klementova
E-ISSN: 2224-2899 775 Volume 11, 2014

determinants of economic regional resilience - were suggested. Secondly, economic regional resilience based on the analysis of 144 selected regions NUTS 2 from 9 states of EU was quantified. Another analysis applied the Spearman’s correlation coefficient which quantifies the strength of relationship between the CH indicator and each potential determinant. Based on these results, a model for evaluation of regional economic resilience was designed. Quality of the model with 6 factors was proven by Chi-Square and Student's t-test. The most important indicators are “The Adjusted index of Diversification” - calculated according to the number of people employed - “Human Resources in Science and Technology”, “The Proportion of People aged 25-64 years with Upper Secondary or Tertiary Education”, “Employment rate aged 15 to 64 years”, “Labour Productivity (gross value added by the number of people employed)”, and “Total intramural R&D expenditures”. For further research, the authors recommend prolonging the testing period and putting focus on other economic crises. The further research would spread the indicator sets and also enrich the research attitude with the focus on sensitivity analysis of founded determinants. Acknowledgements This study was made thanks to the support of the student grant competition no. SGSFES-2014002 IGA, University of Pardubice, Czech Republic. References: [1] ANDREICA, M. E., et al. Econometric and
neural network analysis of the labor productivity and average gross earnings indices in the Romanian industry. In: Proceedings of the 10th WSEAS International Conference on Mathematics and Computers in Business and Economics (MCBE)(ISBN: 978-960-474-063-5/ISSN: 1790-5109). 2009. p. 106-111.
[2] BERKA, P. Dobývání znalostí z databází. Vyd. 1. Praha: Academia, 2003, 366 s. ISBN 80-200-1062-9.
[3] DUVAL, R., VOGEL, L. Economic Resilience to Shocks and the role of Structural Policies, OECD Economic Studies No. 44, Paris: OECD, 2008.
[4] ESPON. Economic Crisis: Resilience of Region (Final Report). [online]. ESPON & Cardiff University, [cit. 2014-08-21]. 2014. Available from:
http://www.espon.eu/main/Menu_Projects/Menu_AppliedResearch/ECR2.html
[5] EUROSTAT: General and regional statistics. Eurostat [online]. [cit. 2012-10-15]. Available from: http://epp.eurostat.ec.europa.eu/portal/page/portal/statistics/search_database.
[6] FOSTER, K. A. A Case Study Approach to Understanding Regional Resilience. Working Paper 2007–08, Institute of Urban and Regional Development, University of California, Berkeley, [online]. 2007. s. 41 [cit. 2012-09-14]. Available from: http://www.iurd.berkeley.edu/publications/wp/2007-08.pdf.
[7] GUNDERSON, L. H., HOLLING, C.S. Panarchy: understanding transformations in human and natural systems. Washington, DC: Island Press, 2002, xxiv, s. 507. ISBN 15-596-3857-5.
[8] HILL, E.; WIAL, H.; WOLMAN, H. Exploring regional economic resilience, Working Paper, Institute of Urban and Regional Development, No. 2008, 04, [online]. 2008. s. 22 [cit. 2012-09-15]. Available from: http://hdl.handle.net/10419/59420.
[9] HUTTER, G., KUHLICKE, C., at al. Natural hazards and resilience: exploring institutional and organizational dimensions of social resilience, Natural Hazard, 2011.
[10] IOANA, A. D. Multidimensional models for simulation. In: MASTORAKIS, N. E., et al. (ed.). WSEAS International Conference. Proceedings. Recent Advances in Computer Engineering. WSEAS, 2009.
[11] KRAFT,J. at al. Hospodářská krize – vybrané makroekonomické a mikroekonomické souvislosti s projekcí na úrovni regionů. Liberec: Technická univerzita v Liberci, 2010. ISBN 978-80-737-2678-2.
[12] LABOUR FORCE SURVEY [online]. [cit. 2013-08-20]. 2013. Available from: http://epp.eurostat.ec.europa.eu/portal/page/portal/microdata/lfs.
[13] MARTIN, R. Regional economic resilience, hysteresis and recessionary shocks, In Journal of Economic Geography, 12 (1). 2012. pp. 1 – 32.
[14] MARTIN, R., SUNLEY, P. Complexity Thinking and Evolutionary Economic Geography, In Journal of Economic Geography. 7, 2007. pp. 573-602.
[15] PELLING, M. Adaptation to Climate Change. From Resilience to Transformation. London: Routledge, 2011.
WSEAS TRANSACTIONS on BUSINESS and ECONOMICS Ondrej Svoboda, Tereza Klementova
E-ISSN: 2224-2899 776 Volume 11, 2014
[16] PENDALL, R., FOSTER, K. A., et al. Resilience and regions: building understanding of the metaphor, In Cambridge Journal of Regions, Economy and Society, 3 (1), 2010. pp. 59 - 70.
[17] PIKE, A., DAWLEY, S., et al. Resilience, adaptation and adaptability, In Cambridge Journal of Regions, Economy and Society, vol. 3 (3), 2010. pp. 59 – 70.
[18] SIMMIE, J., MARTIN, R. L. The economic resilience of regions: towards an evolutionary approach. In Cambridge Journal of Regions, Economy and Society, 3, 1, 2010. pp. 27 – 44.
[19] STŘÍTESKÁ, M., SVOBODA, O. Dynamic Balanced Scorecard: model for Sustainable Regional Development. In WSEAS TRANSACTIONS on ENVIRONMENT and DEVELOPMEN. Volume 7, 2011, p. 211-221, ISSN: 17905079.
[20] SVOBODA, O. Regional Economic Resilience. Pardubice, 2013. Available from: http://dspace.upce.cz/bitstream/10195/54074/3/SvobodaO_EkonomickaOdolnost_RR_2013.pdf. Dissertation thesis. University of Pardubice.
[21] ŠNAPKA, P., MIKUŠOVÁ, M. Prevention of Crises Based on the Creation and Usage of Simulation Models. In WSEAS Transactions on Business and Economics. Volume 11, 2014, p. 141-154 ISSN / E-ISSN: 1109-9526 / 2224-2899.
WSEAS TRANSACTIONS on BUSINESS and ECONOMICS Ondrej Svoboda, Tereza Klementova
E-ISSN: 2224-2899 777 Volume 11, 2014