corporate taxes and capital structure: a long-term
TRANSCRIPT

NBER WORKING PAPER SERIES
CORPORATE TAXES AND CAPITAL STRUCTURE:A LONG-TERM HISTORICAL PERSPECTIVE
Francis A. LongstaffIlya A. Strebulaev
Working Paper 20372http://www.nber.org/papers/w20372
NATIONAL BUREAU OF ECONOMIC RESEARCH1050 Massachusetts Avenue
Cambridge, MA 02138August 2014
We are grateful for helpful discussions with Alex Butler, Ivo Welch, and seminar participants at theU.S. Securities and Exchange Commission. We acknowledge Matthias Fleckenstein, Yuji Sakurai,and Mike Schwert for their capable research assistance. All errors are our responsibility. The viewsexpressed herein are those of the authors and do not necessarily reflect the views of the National Bureauof Economic Research.
NBER working papers are circulated for discussion and comment purposes. They have not been peer-reviewed or been subject to the review by the NBER Board of Directors that accompanies officialNBER publications.
© 2014 by Francis A. Longstaff and Ilya A. Strebulaev. All rights reserved. Short sections of text,not to exceed two paragraphs, may be quoted without explicit permission provided that full credit,including © notice, is given to the source.
Corporate Taxes and Capital Structure:¸˛A Long-Term Historical PerspectiveFrancis A. Longstaff and Ilya A. StrebulaevNBER Working Paper No. 20372August 2014JEL No. G32,G38
ABSTRACT
We study the relation between leverage and corporate tax rates using an extensive data set constructedfrom all corporate income tax returns filed with the IRS from 1926 to 2009. This data set includesfinancial statement data from millions of private and public corporations of all sizes. We show thatcorporate leverage has increased significantly over the past century. We find strong evidence that changesin corporate leverage are directly related to changes in corporate tax rates for all but the smallest firms.These results are robust to the inclusion of control variables for the costs of financial distress, corporateliquidity, and capital market and macroeconomic conditions. The adjustment of leverage to changesin corporate tax rates is slower for smaller firms facing financial constraints. We find that the capitalstructures of the smallest firms are driven much more by external shocks than is the case for largerfirms.
Francis A. LongstaffUCLAAnderson Graduate School of Management110 Westwood Plaza, Box 951481Los Angeles, CA 90095-1481and [email protected]
Ilya A. StrebulaevGraduate School of BusinessStanford University655 Knight WayStanford, CA 94305and [email protected]
1. INTRODUCTION
The capital structure decisions of corporations have been one of the most importantareas of study in financial economics ever since the pioneering studies of Modiglianiand Miller (1958, 1963). Corporate theory has identified a number of potential deter-minants of corporate capital structure such as taxes, bankruptcy costs, informationasymmetry, and agency problems.
In particular, the relation between corporate taxes and financial decisions of firmshas played a central role in the capital structure literature. This is because the choiceof capital structure changes the after-tax value of the firm’s cash flows. Thus, ifcorporate taxes are material, optimizing capital structure should be an importantpriority for firm managers who wish to maximize the total after-tax value of thecompany. To date, however, there has not been strong evidence linking changes incorporate income tax rates to corporate capital structure. As Graham (2008) puts itin a review of research on taxation and corporate finance, “there is no known studythat documents tax-related time series effects in debt usage.” At the same time,recent theoretical research and some empirical estimates suggest that tax benefits arelarge and that firms may leave money on the table by not leveraging enough (Graham(1996a, 2000)).
The challenges that face empirical researchers are two-fold. First, the time seriesdata are limited. For example, the US Compustat data cover only public firms andgoes back only to the early 1950s (adequate coverage starts only in the early 1960s).The biggest US tax reform over that period, in 1986, is small in comparison withchanges in tax laws and rates during the first half of the 20th Century. The secondchallenge is that changes in tax laws and rates do not happen overnight but aretypically the result of multi-year policy negotiations between decision makers. As aresult, economic agents may sometimes have ample time to prepare and adjust forthe eventual tax reform. For example, the overall results on the effect of the 1986 UStax reform on capital structure are inconclusive (Slemrod (1992), Givoly, Hayn, Ofer,and Sarig (1992)), likely because the reform itself was very complicated and firms hadtime to adjust.
This paper studies the relation between corporate taxes and leverage using anextensive new data set that allows us to resolve both of these challenges. Specifically,the data set is constructed from an Internal Revenue Service (IRS) database of allcorporate income tax returns filed in the United States from 1926 to 2009. By usingnearly a century of capital structure data, our results provide clear answers aboutthe time series effects of tax rate changes on corporate leverage for firms of all sizes.Further, by spanning almost the entire history of the corporate income tax, the dataset allows us to evaluate the effects of a much broader set of policy changes, many ofwhich may not have been fully anticipated.
A number of important results emerge from this analysis. First, we find that there
1

has been a significant upwards trend in the amount of corporate leverage throughoutmuch of the past century. In particular, the average corporate leverage ratio increasedfrom a low of 51.65 percent in 1931 to a high of 75.15 percent in 1978. Since the 1970s,however, the average corporate leverage ratio has gradually declined and was 63.77percent in 2009.
Second, we find strong direct evidence that corporate leverage responds to changesin corporate tax rates for all but the smallest firms. In particular, an increase inthe marginal corporate tax rate of one percent results in a 0.18 percent increase incorporate leverage, representing roughly a $137 billion increase in aggregate corporateleverage (based on 2009 statistics). In contrast, a one percent increase in the marginalcorporate tax rate would raise about $8 billion in additional tax revenue (based on2009 statistics). The significant positive relation between leverage and corporate taxrates is robust to the inclusion of control variables for the costs of financial distress,corporate liquidity, and capital market and macroeconomic conditions. These resultsprovide direct empirical confirmation of one of the central pillars of standard corporatecapital structure tradeoff theory.
Finally, our results provide evidence that financial constraints play a central rolein determining corporate capital structure. In particular, we show that large firmsadjust their capital structures much more rapidly in response to changes in marginalcorporate tax rates than do medium-size firms. In contrast, the capital structuredecisions of smaller firms are driven more by liquidity and profitability shocks. Thus,given that small and medium-sized firms likely face greater financial constraints thanlarge firms, these results imply the first-order importance of financial constraints incapital structure decisions.
There is an extensive empirical literature on the determinants of corporate cap-ital structure. Because extensive time series data was previously unavailable, earlierresearch in this area concentrated primarily on identifying cross-sectional factors in-fluencing capital structure. For example, Mackie-Mason (1990) shows that there couldbe significant tax effects in incremental financing decisions. Rajan and Zingales (1995)compare corporate financial policies across a number of developed countries and findthat cross-sectional variation in tax rates has some predictive power in explaining cap-ital structure decisions. Fama and French (2002) find that leverage is an increasingfunction of the size of public companies. One challenge with cross-sectional deter-minants is that they do not establish the causality of the link between taxes andfinancial constraints. Several recent papers try to control for endogeneity by concen-trating on natural experiments. For example, Panier, Perez-Gonzales, and Villanueva(2014) study changes in Belgian tax law and find that firms respond strongly to taxincentives (particularly large firms). Heider and Ljungqvist (2014) find that US firmsrespond strongly to increases in state level corporate income tax rates.
Recent research has also emphasized that macroeconomic risk has a profoundimpact on corporate financing decisions (Hackbarth, Miao, Morellec (2006), Bhamra,
2

Kuehn, Strebulaev (2010)). Empirically, Korajczyk and Levy (2003) observed thatfinancially unconstrained firms follow counter-cyclical leverage strategies, but finan-cially constrained firms exhibit pro-cyclical leverage behavior. They also find thatmacroeconomic conditions are significant for issue choice for unconstrained firms, butless so for constrained firms. Consistent with this evidence, Gertler and Gilchrist(1993) find aggregate cyclicality of short-term availability in the presence of financialconstraints.
An important recent paper by Graham, Leary, and Roberts (2014) is one of fewstudies that explores long-term trends in corporate capital structure. They concentrateon unregulated public US companies and show that firm characteristics are unlikelyto account for the long-term trends, such as an increase in the overall level of debt.They attribute the rise of debt to changes in government borrowing, macroeconomicuncertainty, and financial sector development.
This paper extends the literature in several important dimensions. In particular,by using data for millions of both private and public firms for a timeframe spanningmost of a century, we are able to identify the time series effects of corporate taxrate changes on corporate capital structure. Furthermore, by stratifying the data byfirm size, we are also able to explore the role that financial constraints may play indetermining corporate capital structures.
The rest of the paper is as follows. Section 2 review the history of corporateincome taxation in the United States. Section 3 describes the data. Section 4 studiesthe relation between corporate taxes and leverage. Section 5 summarizes the findingsand presents concluding remarks.
2. THE US CORPORATE INCOME TAX
The taxation of corporate income in the United States has a long history. During theCivil War in 1862, President Lincoln signed a revenue act that introduced a three to fivepercent income tax, which also applied to income from businesses. This income tax wasrepealed in 1872. In 1894, the Wilson Tariff Act reinstated income taxation on bothpersonal and business income. The Wilson Tariff Act was then ruled unconstitutionala year later in 1895.1
The current corporate income tax was initiated in 1909 with the levy of a one-percent tax rate on corporate income in excess of $5,000. Thus, the corporate incometax predates the 1913 introduction of the current personal income tax by four years.The passage of the 16th Amendment in 1913 resolved the issue of the constitutionalityof both the personal and corporate income taxes.
1For a discussion of the history of the income tax, see www.irs.gov/uac/Historical-Highlight-of-the-IRS as well as Joseph (2004) and Bank (2010).
3
Table 1 presents summary statistics for the corporate income tax rate schedulethroughout its history. As shown, corporate income tax rates have varied significantlyover time, ranging from a low of one percent from 1909–1915 to a high of 53 percentfrom 1942–1949. Table 1 also shows that the number of tax brackets, defined asthe number of income ranges with distinct tax rates, has also varied dramaticallyover time. The number of tax brackets ranges from one during 1913–1918 when allcorporate income was taxed at the same rate, to nine in 1940. It is also interestingto observe that the maximum tax rate does not always occur for the highest taxbracket. In other words, the corporate tax rate is not always an increasing functionof income. For example, the current corporate income tax schedule taxes corporateincome between $100,000 and $335,000 at the rate of 39 percent, while income abovethe maximum threshold of $18,333,333 is only taxed at a 35 percent rate.
Since the corporate tax rate varies across income levels, we need some measureof the marginal or representative tax rate.2 In this paper, we will use the simplestdefinition of the marginal tax rate as the tax rate applied to the highest income taxbracket. Figure 1 plots the time series of this measure of the marginal tax rate over thepast century. We observe, however, that all of the results are robust to the definitionof the marginal tax rate. In particular, the results are very similar when we use themaximum tax rate or an average tax rate as the measure of the marginal tax rate.
3. THE DATA
The Revenue Act of 1916 mandated the annual publication of statistics associatedwith the collection of income taxes. From 1916–1925, the total values of some incomeand deduction items were published, where the values were aggregated across all taxreturns. Since 1926, the IRS has published aggregate basic balance sheet and incomestatement information based on all of the millions of corporate income tax returnsfiled. This data is reported in the annual IRS Statistics of Income (SOI) publication.Since this data set will likely be new to most researchers, we provide an introduction tothe SOI reports in the online Appendix to this paper and describe where this data maybe accessed in an effort to facilitate future work by academic researchers. Beginningin 1931, the IRS has also reported aggregate balance sheet and income statement datafor all firms within specific size categories. The number of size categories ranges from8 to 12 during the 1931–2009 period.
To provide an example of the distribution of firms included in the SOI, Table 2shows the total number of firms and total assets for all firms within each of the ninesize categories reported in 2009 by the IRS. The total number of corporate tax returnsincluded is 4,829,756. The distribution of returns, however, is heavily skewed towardssmaller firms. In fact, firms with total assets of less than or equal to $500,000 total
2For a discussion of this issue, see Graham (1996b).
4
3,889,921, which represents 80.54 percent of all firms. In contrast, the distribution ofassets is heavily skewed toward larger firms. The total assets of all firms in the largestsize category is $70,497 billion, which represents 92.80 percent of all corporate assets.
It is interesting to compare the distribution of firms in the SOI universe withthose in the Compustat universe for the same year, since Compustat is one of themost widely-used sources of data for historical accounting information for US publiccompanies. Table 3 shows the total number of firms and total assets for all firmswithin the Compustat universe, where these summary statistics are reported usingthe same format and size categories as in Table 2.
As shown, the 2009 Compustat universe includes information for 9,735 firms in2009 (the SOI and Compustat universes include both financial firms and nonfinancialfirms). Thus, the SOI universe includes roughly 500 times as many firms as the Com-pustat universe. This is because the SOI universe includes not only the public firmsincluded in the Compustat universe, but also millions of smaller nonpublic firms whichrepresent the vast majority of all corporations in the US. It is important to observe,however, that the SOI data also includes many large firms that are not included in theCompustat universe. For example, the SOI universe includes 14,110 firms in the $250million and larger category, while the Compustat universe only include 3,812 firms inthe same size category. The reason for the difference is that the SOI data includesmany large nonpublic firms (such as Cargill, Levi Strauss, Bechtel, etc.) Thus, theSOI universe is far more comprehensive, and significantly extends Compustat in termsof size, nonpublic firms, as well as the time dimension.
To make the SOI data comparable over time, we use the CPI-U index to convertall balance sheet and income statement totals into constant 2009 dollars. To providegreater consistency over time, we combine the totals for the size categories and formthree broader size categories. These three categories are designated small, medium,and large. These three categories map into asset size ranges (in 2009 dollars) ofroughly zero to $10 million, $10 million to $100 million, and greater than $100 million,respectively.
The balance sheet and income statement information is self reported by eachfirm filing a corporate tax return, although all information is subject to audit. Whilethere is undoubtedly variation in accounting policies across firms and also over time,the definitions of most of basic balance sheet and income statement categories (suchas cash, accounts receivable, accounts payable, shareholders’ equity, etc.) are likelyrelatively constant over time. Thus, leverage ratios computed using these values shouldbe generally consistent over time.
Although corporate tax returns are for a specific tax year, not all firms have thesame year end. For example, based on the 2009 Compustat universe, 60.9 percent offirms have a December year end, 8.3 percent have a June year end, and the remainingfirms have year ends that are relatively uniformly distributed throughout the other
5
months of the year. The SOI uses the convention that the 2009 report is based onthe corporate income returns for tax years ending between July 1, 2008 and June 30,2009, and similarly for reports for other years. As we will show later, this will havelittle effect on the results, since it simply increases the apparent time required by firmsto respond to changes in tax rates and other control variables.
The SOI reports for 1926–1950 are based on actual totals of all corporate taxreturns filed. Beginning with 1951, totals for smaller size categories are based on astratified sampling of returns filed. For example, for the 2009 SOI report, the values forsize categories below $50,000,000 are based on stratification. Although this procedureresults in extrapolated values for totals, this procedure should have little effect onfinancial ratios such as the leverage measure.
Table 4 presents summary statistics for common-size balance sheet (expressedas a percent of total assets) and income statement (expressed as a percent of totalrevenues) items for the small, medium, and large categories, as well as for all firms. Asshown, there are some interesting patterns in the average common-sized ratios acrossthe size categories. For example, cash represents a much larger fraction of total assetsfor smaller firms that it does for the medium-sized and large firms. This finding isclearly consistent with the notion that smaller firms face greater financial constraintsand, therefore, hold more liquid portfolios of assets as protection against shocks. Thispattern is also reflected in the much smaller fraction of total assets that smaller firmsinvest in longer term investments.
Not surprisingly, larger firms tend to be more profitable on average. Earnings be-fore taxes represents only 2.45 percent of total revenues for small firms, but represents7.32 percent for the large firms. Because large firms are historically more successful,and because successful small firms become larger firms with time, path dependencydrives this result. Small firms include successful firms that are more likely to migrateto the large category and also include many unprofitable firms that are likely to staysmall or disappear from the sample altogether.
The ratio of corporate taxes to earnings before taxes is 33.1 percent for smallfirms, 42.9 percent for medium-sized firms, and 38.4 percent for large firms. Thisshows that corporate taxes are a significant fraction of earnings for all size categorieseven though the corporate tax rate schedule has historically been relatively progressive.Furthermore, the incidence of taxation is not monotonic with firm size, suggesting thatlarger firms may have more flexibility in structuring their corporate tax liabilities.
A comparison of these financial ratios for the SOI universe with those for Com-pustat firms indicates that they are fairly similar. In particular, we compute averagecommon size ratios for SOI firms during the 1960–2009 period and compare them withthose for Compustat firms during the same period. For example, cash, receivables,inventories, and capital assets represent 5.54, 21.73, 5.37, and 18.83 percent of totalassets for SOI firms, respectively. The same ratios for Compustat firms are 4.03, 28.39,
6

8.17, and 27.70 percent, respectively. Similarly, earnings before taxes and corporatetaxes paid are 4.50 and 1.72 percent of total revenues for SOI firms, respectively. Thesame ratios for Compustat firms are 7.87 and 3.56 percent, respectively.
Turning next to corporate leverage, we compute the leverage ratio by simplytaking the ratio of total debt to total assets for each year and size category. In thiscontext, debt includes all liabilities of the firm such as accounts payable and accrualsas well as formal indebtedness such as bank loans, mortgages, and corporate bonds.This ratio is also equal to one minus the ratio of shareholders’ equity to total assets.Empirical researchers typically prefer to use leverage ratios that are based on bookvalues of debt rather than liabilities, because liabilities include items such as workingcapital financial needs, which are more indicative of day-to-day operating environmentthan of voluntary financial decisions. SOI data reports only liabilities. However,because our emphasis is on time-series patterns, this distinction is of less importance,unless the composition of debt and non-debt liabilities changed dramatically over time.Rajan and Zingales (1995) also report ratios based on liabilities, because their aimis to compare leverage ratios across different countries and the definition of debt-likeliabilities varies with the accounting regime. It should also be noted that empiricalresearchers overwhelmingly work with large firms, for which debt-like liabilities cantake the form of corporate bonds, commercial paper, and so on – that is, “pure” debt.Most of our data is based on small private firms, where the distinction between debtand non-debt liabilities is moot, because most of these firms do not have access topublic debt markets.
Table 5 presents summary statistics for the leverage ratios for each of the threesize categories and for all firms. Figure 2 plots the leverage ratio for all firms for the1926–2009 period. As illustrated, the leverage ratio for all firms also varies significantlyover time. The highest corporate leverage ratios occur during 1970s when they reacheda level in excess of 75 percent.
As a preliminary to the formal empirical analysis later in the paper, Figure 3presents a scatterdiagram of the level of the marginal corporate tax rate and the levelof aggregate corporate leverage for the 1926–2009 period. As shown, there is a strongpositive relation between the two measures.
Figure 4 plots the time series of leverage ratios for the small, medium, and largesize categories. These leverage ratios are generally increasing throughout the 1931–2009 period. The leverage ratios for the medium-sized and large firms, however, reacha maximum in 1988 and then begin to decline. In contrast, the leverage ratio for smallfirms continues to increase. Thus, there is a clear difference between the properties ofsmall firms and the other firms.
Returning to Table 5, the results suggest that average leverage is monotonicallyincreasing in firm size. The average leverage ratio is 60.7 percent for small firms, 64.4percent for medium-sized firms, and 67.5 percent for large firms. The lower average
7
leverage for smaller firms is again consistent with the perspective that smaller firmsface greater financial constraints and are less able to acquire outside funding.
On the other hand, leverage ratios for smaller firms tend to be more volatile thanthose for larger firms. Specifically, the leverage ratios for small firms range from 38.0to 76.6 percent during the sample period. In contrast, the leverage ratios of largerfirms ranges 53.2 to 76.3 percent, which is a much tighter range than for small firms.The difference in the volatility of leverage ratios across size categories could reflectthat smaller firms are more susceptible to liquidity and funding shocks through thebusiness cycle. Thus, they may have less ability to choose their capital structure thanlarger firms.
It is important to recognize that there are other ways in which the leverage of afirm can be defined. For example, a number of papers focus on the net leverage ratio,given by subtracting cash from total debt, and then dividing the difference by totalassets. To show that our results are robust to this alternative definition of leverage, allof the empirical analyses are repeated using net leverage. These results are includedin the online Appendix as Tables A1 through A5. As these tables show, the resultsusing the net leverage ratio are all very similar to those obtained using the leverageratio.
Finally, we note that the average leverage ratios for the SOI firms are very similarto those for Compustat firms. Specifically, the average leverage ratio for all SOI firmsduring the 1960–2009 period is 69.90 percent. The ratio of liabilities to total assetsfor all Compustat firms during the same period is 71.18 percent.
4. HOW DO CORPORATE TAX RATES AFFECT LEVERAGE?
The standard tradeoff theory of capital structure implies that corporate tax ratesshould be a major determinant of corporate leverage decisions. In this section, we testthe empirical implications of this theory by examining how corporate tax rates arerelated to corporate leverage over time. In doing this, we make use of the extensivetime series of corporate capital structure information available from the SOI reports.An important advantage of this data set is that it allows us to study the relationbetween leverage and tax rates almost from the inception of the corporate income tax.
Specifically, our empirical approach will be to test whether changes in corporatetax rates are related to subsequent changes in corporate leverage. The reason forfocusing on subsequent changes in leverage rather than contemporaneous changes isthat firms may require time to respond to changes in tax rates because of the effectsof financial frictions. Furthermore, this approach helps lessen potential endogeneityissues. The reason for focusing on changes rather than levels is simply that bothcorporate tax rates and leverage ratios tend to be highly persistent. In contrast,changes in these variables appear more stationary.
8
In testing whether changes in tax rates are followed by changes in corporate cap-ital structure, we also include a number of other explanatory variables as controls. Inthe first specification, we include several lags of the change in leverage to control forpotential persistence in leverage changes. In the second specification, we add variablesthat proxy for changes in the cost of financial distress. In the third specification, weinclude variables controlling for the liquidity and internal cash flows of the corpora-tions. In the final specification, we include variables controlling for the state of debtand equity capital markets.
4.1 The Effects of Tax Rate Changes
As an initial specification, we regress changes in leverage on its lagged values andon lagged changes in the marginal corporate income tax rate. In particular, we usethe first two lags of the change in leverage as a control for any persistence in thedependent variable (longer lags are not significant). To test whether changes in taxrates are followed by changes in leverage ratios, we also include the first three lags ofthe change in the marginal tax rate.
Table 6 presents the results from the regression. As shown, changes in leveragedisplay some degree of persistence. The second lagged change is positive and weaklysignificant in the regression including all firms. This result, however, is not uniformacross the individual size categories. Both the small and medium categories have asignificant negative coefficient for a lagged change in leverage. This suggests that theleverage ratios for small and medium-sized firms tend to be mean reverting, in sharpcontrast to the persistent behavior of leverage ratios for large firms. This pattern ofdifferences in the behavior of capital structure across size categories will be a recurringtheme throughout much of the subsequent empirical analysis in the paper. It is alsoconsistent with previous empirical findings about the differences in capital structurepolicies of small and large firms (Korajczyk and Levy (2003), Gertler and Gilchrist(1993) and others).
Turning next to the effect of changes in tax rates, the results for the regressionincluding all firms indicate that there is a strong positive relation between changes inmarginal tax rates and subsequent changes in corporate leverage. In particular, thefirst lagged change in the marginal tax rate has a t-statistic of 2.30. The coefficient es-timates for the lagged changes in marginal tax rates imply that one percent change inthe marginal tax rate cumulates to an increase in the leverage ratio of 0.0018, or 0.18percent. While this increase may seem modest as a percentage, it represents an in-crease in aggregate corporate leverage of nearly $137 billion (based on 2009 statistics).This increase is very large relative to the roughly $8 billion of incremental annual cor-porate income tax revenue that a one percent increase in the marginal tax rate wouldgenerate (again based on 2009 statistics). These results are clearly consistent with thehypothesis that tax rates are an important determinant of corporate capital structure.
9

The results for the regressions for the individual size categories are also veryintriguing. As shown in Table 6, lagged changes in the marginal tax rate are notsignificant in explaining subsequent changes in the leverage of small firms. In contrast,there is a significant positive relation between lagged changes in the marginal taxrate and subsequent changes in leverage for both medium-sized and large firms. Thisdistinction suggests that the capital structure of small firms may be driven by differentfactors than is the case for larger firms. For example, small firms may face financialconstraints that limit their ability to optimize capital structure, while larger firms mayhave more control over their capital structure. This is consistent with recent dynamiccapital structure models that emphasize optimal inaction by firms in the presenceof transaction costs (Goldstein, Ju, Leland (2001), Strebulaev (2007)). If transactioncosts have a fixed cost component, it gives rise to differences between capital structuredeterminants of small and large firms (Kurshev and Strebulaev (2007)).
Although there is a significant positive relation between leverage and marginaltax rates for medium-sized firms, the result shows that the nature of that relationis subtly different than for large firms. In particular, changes in leverage occur twoto three years after changes in the marginal tax rate for the medium category, butoccur during the subsequent year for large firms. This difference is consistent withmedium-sized firms facing financial frictions which make changing capital structure aslower process than for larger firms.
4.2 The Costs of Financial Distress
The standard tradeoff theory of capital structure implies that the optimal leverageis determined by balancing the tax advantages of debt against the costs of financialdistress. Motivated by this, we next examine the relation between changes in leverageand corporate tax rates while including a number of controls for the cost of financialdistress associated with leverage.
Specifically, we include three variables as instruments for the cost of financialdistress. The first is the annual value-weighted default rate of nonfinancial corporatebonds in the US. This variable is described in Giesecke, Longstaff, Schaefer, andStrebulaev (2011, 2013), and the time series of default rates is obtained from theironline Appendix. As shown in their papers, corporate defaults tend to cluster in timeand are persistent. Thus, an increase in the corporate default rate implies an increasein expected default rates in the subsequent year. As shown by Acharya, Bharath, andSrinivasan (2007) and many others, recovery rates tend to be lower during periodscharacterized by higher default rates. In turn, lower recovery rates map into higherexpected costs of financial distress.
The second and third variables are the growth rates in GDP and industrial pro-duction, respectively. As shown by Davydenko, Strebulaev, and Zhang (2012), thecosts of financial distress are industry related and tend to be weakly counter-cyclical.
10
Thus, we would expect the expected costs of financial distress to increase during busi-ness cycle downturns. Including the growth rate in GDP and industrial production inthe analysis should control for business cycle variation in the cost of financial distress.
Table 7 reports the results for the regression in which these three variables areadded to the regression reported in Table 6. We include only one lag of these variablessince the results are unaffected by the inclusion of additional lags, and additionallagged values of these variables are generally insignificant.
As shown, the implications for the relation between tax rates and leverage are verysimilar to those reported in Table 6. In particular, lagged changes in the corporatetax rate are significantly positively related to subsequent changes in leverage when allfirms are included, and also for the medium and large categories. Changes in corporatetax rates are not significantly related to changes in leverage for small firms.
The lagged value of the corporate default rate is significant in explaining subse-quent changes in the leverage of small firms. Surprisingly, the sign of the coefficientis positive, implying that an increase in the risk of defaults and the expected costof financial distress is associated with higher leverage for these smaller firms. Thisseemingly counterintuitive result may imply, once again, that the capital structure ofsmaller firms may be driven more by financial constraints and other external factorsthan by endogenous choices. For example, a higher expected likelihood of distress isassociated with a decline in profitability and lower shareholder equity, which, in turn,leads to higher leverage. This may also apply to firms in the medium category sincetheir leverage is significantly positively related to lagged industrial production growth.
4.3 Firm Liquidity and Internal Capital
Recent literature emphasizes the central role that financial constraints play in deter-mining the capital structure of corporations.3 Firms that face severe constraints orfrictions may find that changes in the leverage ratio over time are heavily influencedby the amount of internal cash flow generated by operations or the liquidity of theirassets.
In light of this literature, we extend the analysis by including a number of proxiesfor firm liquidity and internal cash flow. In particular, we calculate the cash andcurrent ratios for firms in the three size categories as well as for the combined total ofall firms. The cash ratio is simply the ratio of cash to total assets. The current ratio isthe ratio of current assets to total assets, where current assets include cash, accountsreceivable, and inventories. To provide a measure of internal cash flow, we compute
3See Almeida, Campello, and Weisbach (2004), Opler, Pinkowitz, Stulz, and William-son (1999), Gryglewicz (2011), Acharya, Davydenko, and Strebulaev (2012), Andersonand Caverhill (2012), and Pinkowitz, Sturgess, Williamson (2013).
11

the profitability ratio as the ratio of earnings before taxes to total assets. Table 8reports the results from the regression in which lagged changes in these three liquidityand internal cash flow measures are added to the baseline specification reported inTable 6.
The results show that the implications for the relation between changes in cor-porate tax rates and subsequent changes in leverage are essentially the same as in theprior regressions. In particular, changes in tax rates are not significant in explainingchanges in leverage for small firms. As before, the leverage of medium-sized firms issignificantly affected by changes in tax rates after a two- or three-year delay. Theleverage of large firms increases significantly in the year after an increase in tax rates.The results for the regression in which all firms are included are the same as in theprevious regressions.
Turning to the results for the liquidity and internal cash flow variables, Table 8shows that the leverage of small firms is strongly influenced by these variables. Boththe lagged change in the current ratio and the lagged profitability ratio are highlysignificant in explaining the subsequent change in the leverage ratio for small firms.These results are consistent with the view that the capital structure of financially con-strained firms or firms facing financial frictions is strongly related to the liquidity oftheir assets or their internal free cash flows. A similar result holds for the medium cat-egory in that lagged changes in the current ratio are significantly related to subsequentleverage changes.
In contrast to these results, Table 8 shows that none of the three liquidity or prof-itability ratios are significant in explaining subsequent changes in leverage for eitherthe large firm category or for the combined total of all firms. This again demonstratesthat the determinants of capital structure for larger and presumably less financiallyconstrained firms differ in important ways from those for smaller firms.
4.4 The Effects of External Capital Markets
As discussed earlier, corporate capital structure could be influenced by events in theexternal capital markets. To address this, we reexamine the relation between changesin corporate tax rates and subsequent changes in leverage while controlling for anumber of measures of market factors.
Specifically, we include three additional variables in the baseline regression re-ported in Table 6. The first is the lagged return on the Center for Research in SecurityPrices (CRSP) value-weighted index. This return series serves as a control for the con-ditions in the equity markets. The second variable is the year-on-year change in thevolatility of the CRSP value-weighted index. The volatility of the index is estimatedeach year by taking the standard deviation of the monthly returns on the index duringthe year. The third variable is the change in the yield spread between Baa-rated and
12
Treasury bonds. This index is available from Moody’s throughout the sample period.Table 9 reports the results from the regression of changes in corporate leverage on itsfirst two lags, the first three lags of the change in the corporate tax rate, and on thefirst lag of these capital market variables.
Once again, the implications of the regression for the relation between changes incorporate tax rates and subsequent changes in leverage indicate that there is a strongrelation for larger firms, a significant but delayed relation for medium-sized firms, andno apparent relation for small firms. The coefficient estimates for the lagged changes incorporate tax rates and their statistical significance are very similar to those reportedin previous regressions.
Table 9 also shows that the lagged stock return is not significant for any of thesize categories or for the regression with all firms included. It is also not significantfor the lagged change in the corporate bond spread. In contrast, there is a marginallysignificant relation between changes in volatility and the subsequent change in leveragefor the large firm category and in the regression with all firms. The sign of thesecoefficients is negative, consistent with a scenario in which these firms adjust theleverage downward when facing more volatile financial markets.
5. CONCLUSION
In this paper, we study the relation between corporate taxes and corporate capitalstructure using long-term historical data from US corporate tax returns. The datais based on all corporate tax returns filed in the US for nearly a century by millionsof corporations. This study contributes to the growing empirical literature on capitalstructure determinants by analyzing a much longer time series for a larger sample ofcompanies than in any previous study. On the other hand, the data we have access tois based on aggregated size categories rather than individual tax returns.
We find a strong relation between taxes and capital structure. Changes in taxrates are related to an increase in corporate leverage. When we explore the differenceswith respect to firm size, we find that only large firms are responsive to changes intax rates over a short period of time. Medium-sized firms exhibit higher leverage witha lag, and leverage ratios of small firms are not related to the time series variation intax rates. This evidence is consistent with the presence of financial constraints with afixed component that delay the response of medium-sized firms and make it too costlyfor small firms to vary their leverage in response to tax incentives. These results arerobust when we consider time-series proxies for corporate distress costs, corporateprofitability, macroeconomic indicators such as GDP growth and stock returns, andchanges in volatility.
13

REFERENCES
Acharya, Viral, Sreedhar Bharath, and Anand Srinivasan, 2007, Does Industry-wideDistress Affect Defaulted Firms? Evidence from Creditor Recoveries, Journal of Fi-nancial Economics 85, 787-821.
Acharya, Viral, Sergei Davydenko, and Ilya A. Strebulaev, 2012, Cash Holdings andCredit Risk, Review of Financial Studies 25, 2959-2999.
Almeida, Heitor, Murillo Campello, and Michael S. Weisbach, 2004, The Cash FlowSensitivity of Cash, Journal of Finance 59, 1777-1804.
Anderson, Ronald W., and Andrew Carverhill, 2012, Corporate Liquidity and CapitalStructure, Review of Financial Studies 25, 797-837.
Bank, Stephen M., 2010, From Sword to Shield: The Transformation of the CorporateIncome Tax, 1861 to Present, Oxford University Press.
Bhamra, Harjoat S., Lars-Alexander Kuehn, and Ilya A. Strebulaev, 2010, The Ag-gregate Dynamics of Capital Structure and Macroeconomic Risk, Review of FinancialStudies 23, 4187-4241.
Davydenko, Sergei, Ilya A. Strebulaev, and Xiaofei Zhao, 2012, A Market-Based Studyof the Cost of Default, 2012, Review of Financial Studies 25, 3573-3609.
Fama, Eugene F., and Kenneth R. French, 2002, Testing Tradeoff and Pecking OrderPredictions about Dividends and Debt, Review of Financial Studies 15, 1-37.
Gertler, Mark, and Simon Gilchrist, 1993, The Role of Credit Market Imperfections inthe Monetary Transmission Mechanism: Arguments and Evidence, The ScandinavianJournal of Economics 95, 43-64.
Giesecke, Kay, Francis A. Longstaff, Stephen M. Schaefer, and Ilya A. Strebulaev,2011, Corporate Bond Default Risk: A 150-Year Perspective, Journal of FinancialEconomics 102, 233-250.
Giesecke, Kay, Francis A. Longstaff, Stephen M. Schaefer, and Ilya A. Strebulaev,2013, Macroeconomic Effects of Corporate Default Crisis: A Long-Term Perspective,Journal of Financial Economics, forthcoming.
Givoly, Dan, Carla Hayn, Aharon R. Ofer, and Oded Sarig, 1992, Taxes and CapitalStructure: Evidence from Firms’ Response to the Tax Reform Act of 1986, Review ofFinancial Studies 5, 331-355.
14

Goldstein, Robert, Nenqiiu Ju, and Hayne Leland, 2001, An EBIT-Based Model ofDynamic Capital Structure, Journal of Business 74, 483-512.
Graham, John R., 1996a, Debt and the Marginal Tax Rate, Journal of FinancialEconomics 41, 41-73.
Graham, John R., 1996b, Proxies for the Corporate Marginal Tax Rate, Journal ofFinancial Economics 42, 187-221.
Graham, John R., 2000, How Big are the Tax Benefits of Debt? Journal of Finance55, 1901-1941.
Graham, John R., 2008, Taxes and Corporate Finance, in B.E. Eckbo (ed.), Handbookof Corporate Finance; Empirical Corporate Finance, Elsevier Science, Amsterdam.
Graham, John R., Mark Leary, and Michael Roberts, 2014, A Century of CapitalStructure: The Leveraging of Corporate America, Journal of Financial Economics,forthcoming.
Gryglewicz, Sebastian, 2011, A Theory of Corporate Financial Decisions with Liquid-ity and Solvency Concerns, Journal of Financial Economics 99, 365-384.
Hackbarth, Dirk, Jianjun Miao, and Erwan Morellec, (2006), Capital Structure, CreditRisk and Macroeconomic Conditions, Journal of Financial Economics 82, 519-550.
Heider, Florian, and Alexander Lunhgqvist, 2014, As Certain as Debt and Taxes:Estimating the Tax Sensitivity of Leverage from State Tax Changes, Working paper,New York University.
Joseph, Richard J., 2004, The Origins of the American Income Tax, Syracuse Univer-sity Press.
Korajczyk, Robert, and Amnon Levy, 2003, Capital Structure Choice: MacroeconomicConditions and Financial Constraints, Journal of Financial Economics 68, 75-109.
Kurshev, Alexander, and Ilya A. Strebulaev, 2007, Firm Size and Capital Structure,Working paper, Stanford University.
MacKie-Mason, Jeffrey K., 1990, Do Taxes Affect Corporate Financing Decisions,Journal of Finance 45, 1471-1493.
Modigliani, Franco, and Merton H. Miller, 1958, The Cost of Capital, CorporationFinance and the Theory of Investment, American Economic Review 48, 261-297.
Modigliani, Franco, and Merton H. Miller, 1963, Corporate Income Taxes and the
15

Cost of Capital: A Correction, American Economic Review 53, 433-443.
Opler, Tim, Lee Pinkowitz, Rene Stulz, and Rohan Williamson, 1999, The Determi-nants and Implications of Corporate Cash Holdings, Journal of Finance 52, 3-46.
Panier, Fred, Francisco Perez-Gonzalez, and Pablo Villanueva, 2014, Capital Struc-ture and Taxes: What Happens When You (Also) Subsidize Equity?, Working paper,Stanford University.
Pinkowitz, Lee, Jason Sturgess, and Rohan Williamson, 2013, Do Cash Stockpiles FuelCash Acquisitions? Journal of Corporate Finance, forthcoming.
Rajan, Raghuram G., and Luigi Zingales, 1995, What Do We Know about CapitalStructure? Some Evidence from International Data, Journal of Finance 50 1421-1460.
Slemrod, Joel, 1992, Do Taxes Matter? Lessons from the 1980’s, The American Eco-nomic Review 82, 250-256.
Strebulaev, Ilya A., 2007, Do Tests of Capital Structure Mean What They Say?,Journal of Finance 62, 1747-1787.
16

1900 1920 1940 1960 1980 2000 20200
10
20
30
40
50
60
Year
Mar
gina
l Tax
Rat
e
Figure 1. Time Series Plot of the Marginal Corporate Income Tax Rate.This figure plots the marginal corporate income tax rate for the 1909–2009 period.The marginal corporate income tax rate is defined as the rate on the highest bracketof corporate income.

1930 1940 1950 1960 1970 1980 1990 2000 20100
0.1
0.2
0.3
0.4
0.5
0.6
0.7
0.8
Year
Cor
pora
te L
ever
age
Figure 2. Time Series Plot of Corporate Leverage Ratio for All Firms. Thisfigure plots the corporate leverage ratio for all firms for the 1926–2009 period. Thecorporate leverage ratio is defined as the ratio of debt to total assets.

0 10 20 30 40 50 600.4
0.45
0.5
0.55
0.6
0.65
0.7
0.75
0.8
Cor
pora
te L
ever
age
Marginal Tax Rate
Figure 3. Scatterdiagram of the Corporate Leverage Ratio for All Firmsand the Marginal Corporate Income Tax Rate. This figure plots the corporateleverage ratio for all firms against the marginal corporate income tax rate for the1926–2009 period. The corporate leverage ratio is defined as the ratio of debt to totalassets. The marginal corporate income tax rate is defined as the rate on the highestbracket of corporate income.

1930 1940 1950 1960 1970 1980 1990 2000 20100
0.1
0.2
0.3
0.4
0.5
0.6
0.7
0.8
Year
Cor
pora
te L
ever
age
SmallMediumLarge
Figure 4. Time Series Plots of Leverage Ratios for Small, Medium-Sized,and Large Corporations. This figure plots the leverage ratios for firms in the small,medium, and large categories for the 1931–2009 period. The leverage ratio is definedas the ratio of debt to total assets for each category of firms.

Online Appendix
Introduction to the IRS Statistics of Income
The IRS provides an extensive introduction to the Statistics of Income Program on itswebsite at http://www.irs.gov/uac/SOI-Tax-Stats-About-SOI. As discussed on thiswebsite, the Revenue Act of 1916 requires the IRS to publish an annual report re-lating to the operations of the internal revenue laws pertaining to the collection oftaxes from individuals, and all forms of business including corporations, estates, non-profit organizations, and trusts. The SOI program fulfills this mandate through itsinformation office, Statistical Information Services.
Beginning in 2009, the IRS began to digitize its library of historical reports, and theseare now all available online. In particular, the website http://www.irs.gov/uac/SOI-Tax-Stats-Archive contains links to pdf versions of the annual SOI reports from 1916to 1933 which contain statistics for both individuals and business returns. Beginningin 1929, the IRS published a separate annual report for businesses, and the abovearchive website contains links to these reports for the 1929 to 1999 period. The USBureau of the Census has summarized much of the key information about corpo-rate financial statements from the SOI annual reports for the period from 1926 to1970 in its publication Historical Statistics of the United States, Colonial Times to1970, Part 2. More recent annual reports for corporate tax statistics can be found athttp://www.irs.gov/uac/SOI-Tax-Stats-Corporation-Complete-Report.
Robustness Analysis Using Net Leverage
The empirical results in Tables 5 through 9 of the paper are based on the leverageratio, which is defined as the ratio of total debt to total assets. As a robustness check,we repeat the analysis in these tables using net leverage, which is defined as the ratioof total debt minus cash to total assets. The results using this alternative measureof leverage are given below as Tables A1 through A5, where Table A1 corresponds toTable 5, Table A2 corresponds to Table 6, etc. As can be seen by comparing the resultsin Tables A1 through A5 with the corresponding tables in the paper, the empiricalresults using the net leverage ratio are virtually identical to those in the paper basedon the leverage ratio.
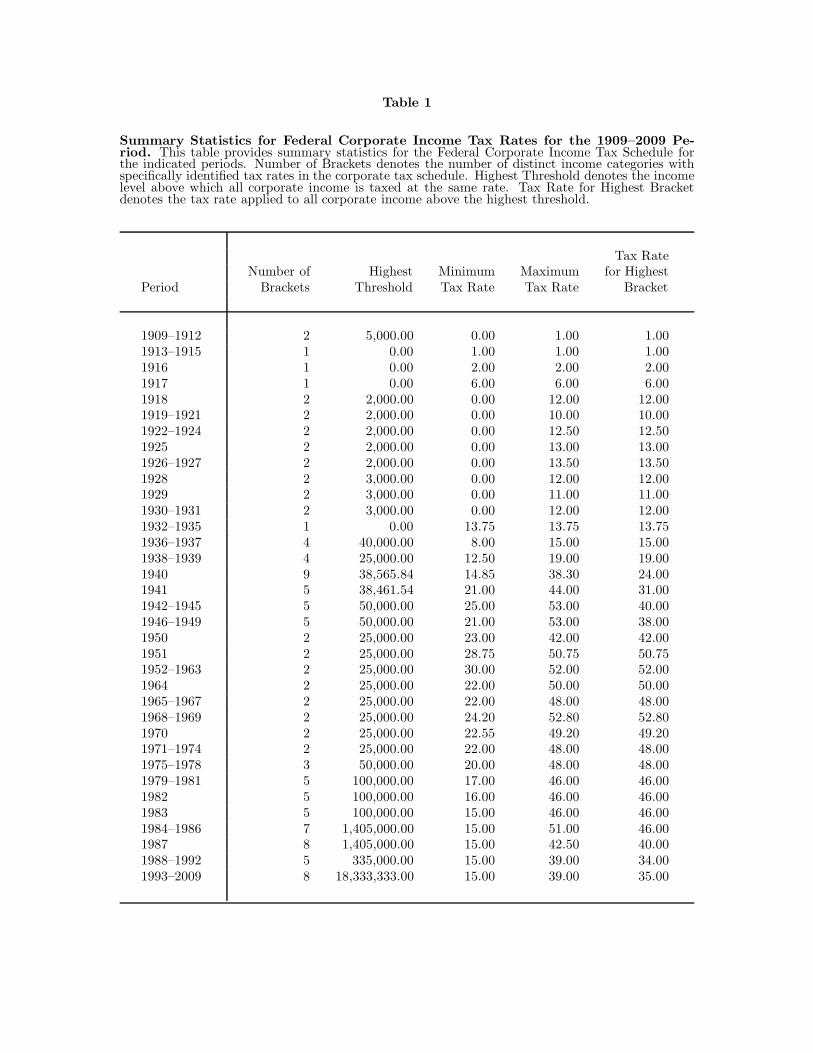
Table 1
Summary Statistics for Federal Corporate Income Tax Rates for the 1909–2009 Pe-riod. This table provides summary statistics for the Federal Corporate Income Tax Schedule forthe indicated periods. Number of Brackets denotes the number of distinct income categories withspecifically identified tax rates in the corporate tax schedule. Highest Threshold denotes the incomelevel above which all corporate income is taxed at the same rate. Tax Rate for Highest Bracketdenotes the tax rate applied to all corporate income above the highest threshold.
Tax RateNumber of Highest Minimum Maximum for Highest
Period Brackets Threshold Tax Rate Tax Rate Bracket
1909–1912 2 5,000.00 0.00 1.00 1.001913–1915 1 0.00 1.00 1.00 1.001916 1 0.00 2.00 2.00 2.001917 1 0.00 6.00 6.00 6.001918 2 2,000.00 0.00 12.00 12.001919–1921 2 2,000.00 0.00 10.00 10.001922–1924 2 2,000.00 0.00 12.50 12.501925 2 2,000.00 0.00 13.00 13.001926–1927 2 2,000.00 0.00 13.50 13.501928 2 3,000.00 0.00 12.00 12.001929 2 3,000.00 0.00 11.00 11.001930–1931 2 3,000.00 0.00 12.00 12.001932–1935 1 0.00 13.75 13.75 13.751936–1937 4 40,000.00 8.00 15.00 15.001938–1939 4 25,000.00 12.50 19.00 19.001940 9 38,565.84 14.85 38.30 24.001941 5 38,461.54 21.00 44.00 31.001942–1945 5 50,000.00 25.00 53.00 40.001946–1949 5 50,000.00 21.00 53.00 38.001950 2 25,000.00 23.00 42.00 42.001951 2 25,000.00 28.75 50.75 50.751952–1963 2 25,000.00 30.00 52.00 52.001964 2 25,000.00 22.00 50.00 50.001965–1967 2 25,000.00 22.00 48.00 48.001968–1969 2 25,000.00 24.20 52.80 52.801970 2 25,000.00 22.55 49.20 49.201971–1974 2 25,000.00 22.00 48.00 48.001975–1978 3 50,000.00 20.00 48.00 48.001979–1981 5 100,000.00 17.00 46.00 46.001982 5 100,000.00 16.00 46.00 46.001983 5 100,000.00 15.00 46.00 46.001984–1986 7 1,405,000.00 15.00 51.00 46.001987 8 1,405,000.00 15.00 42.50 40.001988–1992 5 335,000.00 15.00 39.00 34.001993–2009 8 18,333,333.00 15.00 39.00 35.00

Table 2
Size Distribution of Corporations in the 2009 IRS Statistics of Income. This table shows the number of firms in each of the sizecategories reported by the IRS for the year 2009. The range for each size category is based on the total assets for individual firms. The upperand lower bounds for each size category are expressed in dollars. The total assets for all firms in each category are also shown, where thesetotals are expressed in billions of dollars.
Size Category
Number Percentage Total Assets PercentageFrom To of Firms of Total of All Firms of Total
1 500,000 3,889,921 80.54 375.36 0.50500,000 1,000,000 370,940 7.68 260.58 0.341,000,000 5,000,000 409,100 8.47 867.43 1.145,000,000 10,000,000 67,655 1.40 471.96 0.6210,000,000 25,000,000 42,016 0.87 647.86 0.8525,000,000 50,000,000 15,965 0.33 560.42 0.7450,000,000 100,000,000 10,398 0.22 737.47 0.97100,000,000 250,000,000 9,651 0.20 1,547.20 2.04>250,000,000 14,110 0.29 70,496.74 92.80
Total 4,829,756 100.00 75,965.02 100.00

Table 3
Size Distribution of Corporations in the 2009 Compustat Universe. This table shows the number of firms in each of the size categoriesreported by Compustat for the year 2009. The range for each size category is based on the total assets for individual firms. The upper andlower bounds for each size category are expressed in dollars. The total assets for all firms in each category are also shown, where these totalsare expressed in billions of dollars.
Size Category
Number Percentage Total Assets PercentageFrom To of Firms of Total of All Firms of Total
1 500,000 2,430 24.96 0.07 0.00500,000 1,000,000 126 1.29 0.09 0.001,000,000 5,000,000 493 5.06 1.29 0.005,000,000 10,000,000 329 3.38 2.42 0.0110,000,000 25,000,000 605 6.21 9.98 0.0225,000,000 50,000,000 537 5.52 19.50 0.0550,000,000 100,000,000 570 5.86 40.68 0.10100,000,000 250,000,000 833 8.56 137.72 0.32>250,000,000 3,812 39.16 42,415.47 99.50
Total 9,735 100.00 42,627.22 100.00

Table 4
Summary Statistics for Corporate Financial Statements. This table reports averages for the indicated common-size balance sheet andincome statement items. The balance sheet items are expressed as percentages of total assets. The income statement items are expressed aspercentages of total revenues. The averages are taken over all years in the respective sample periods. Small, Medium, and Large denote firmswith total assets of roughly less than $10 million, between $10 and $100 million, and greater than $100 million, respectively (measured incurrent (2009) dollars). Number of firms denotes the total number of corporate returns in 2009 for the indicated size categories. The sampleperiod for the individual size categories is 1931–2009. The sample period for the category including all firms is 1926–2009.
Small Medium Large All
Cash 11.07 9.35 6.84 7.14Receivables 20.49 23.41 18.79 19.12Inventories 16.80 12.06 4.37 6.05Investments 9.03 24.69 44.54 36.51Capital Assets 34.56 24.22 20.39 22.14Other Assets 8.05 6.27 5.07 9.04Total Assets 100.00 100.00 100.00 100.00
Expenses 97.55 96.08 92.68 94.83Earnings before Tax 2.45 3.92 7.32 5.17Corporate Tax 0.81 1.68 2.81 2.07Revenues 100.00 100.00 100.00 100.00
Number of Firms 4,737,616 68,379 23,761 4,829,756
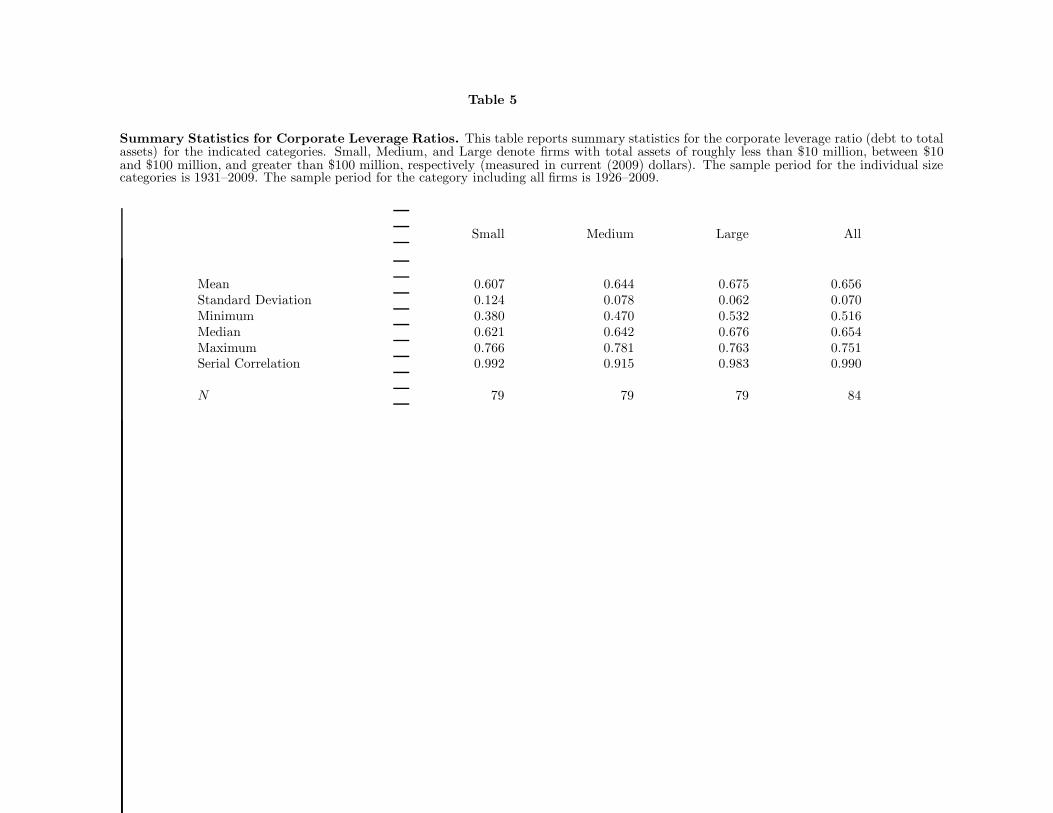
Table 5
Summary Statistics for Corporate Leverage Ratios. This table reports summary statistics for the corporate leverage ratio (debt to totalassets) for the indicated categories. Small, Medium, and Large denote firms with total assets of roughly less than $10 million, between $10and $100 million, and greater than $100 million, respectively (measured in current (2009) dollars). The sample period for the individual sizecategories is 1931–2009. The sample period for the category including all firms is 1926–2009.
Small Medium Large All
Mean 0.607 0.644 0.675 0.656Standard Deviation 0.124 0.078 0.062 0.070Minimum 0.380 0.470 0.532 0.516Median 0.621 0.642 0.676 0.654Maximum 0.766 0.781 0.763 0.751Serial Correlation 0.992 0.915 0.983 0.990
N 79 79 79 84

Table 6
Regression of Changes in Leverage on Changes in the Tax Rate. This table reports summary statistics from the regression of thechange in the leverage ratio on its first two lags and on the previous three changes in the corporate tax rate for the highest bracket. Small,Medium, and Large denote firms with total assets of roughly less than $10 million, between $10 and $100 million, and greater than $100 million,respectively (measured in current (2009) dollars). The t-statistics are based on the Newey-West estimate of the covariance matrix (three lags).The superscripts ∗ and ∗∗ denote significance at the ten-percent and five-percent levels, respectively. The sample period for the individual sizecategories is 1931–2009. The sample period for the category including all firms is 1926–2009.
ΔLevt = α +2∑
i=1
βi ΔLevt−i +3∑
i=1
γi ΔTax Rate t−i + εt
Small Medium Large All
Coefficient Intercept 0.0065 0.0012 0.0004 0.0005ΔLevt−1 −0.1486 −0.4261 0.0326 0.0733ΔLevt−2 −0.1469 −0.1625 0.2058 0.2232ΔTax Rate t−1 −0.0005 −0.0010 0.0013 0.0011ΔTax Rate t−2 0.0007 0.0034 0.0006 0.0003ΔTax Rate t−3 −0.0009 0.0027 0.0002 0.0004
t-Statistic Intercept 3.48∗∗ 0.37 0.28 0.48ΔLevt−1 −1.04 −2.69∗∗ 0.21 0.49ΔLevt−2 −1.86∗ −1.42 1.60 1.91∗
ΔTax Rate t−1 −0.43 −0.52 2.14∗∗ 2.30∗∗
ΔTax Rate t−2 0.85 2.43∗∗ 1.29 0.45ΔTax Rate t−3 −0.82 2.12∗∗ 0.39 1.08
Adj. R2 −0.017 0.169 0.135 0.145N 79 79 79 84
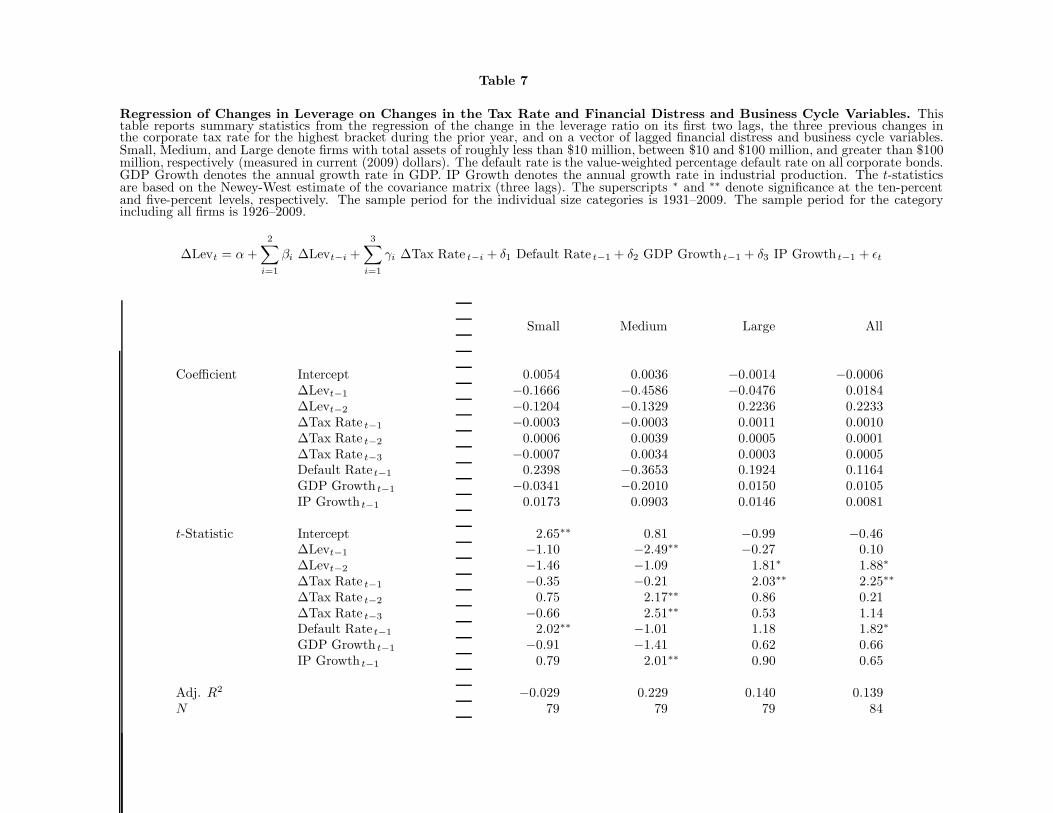
Table 7
Regression of Changes in Leverage on Changes in the Tax Rate and Financial Distress and Business Cycle Variables. Thistable reports summary statistics from the regression of the change in the leverage ratio on its first two lags, the three previous changes inthe corporate tax rate for the highest bracket during the prior year, and on a vector of lagged financial distress and business cycle variables.Small, Medium, and Large denote firms with total assets of roughly less than $10 million, between $10 and $100 million, and greater than $100million, respectively (measured in current (2009) dollars). The default rate is the value-weighted percentage default rate on all corporate bonds.GDP Growth denotes the annual growth rate in GDP. IP Growth denotes the annual growth rate in industrial production. The t-statisticsare based on the Newey-West estimate of the covariance matrix (three lags). The superscripts ∗ and ∗∗ denote significance at the ten-percentand five-percent levels, respectively. The sample period for the individual size categories is 1931–2009. The sample period for the categoryincluding all firms is 1926–2009.
ΔLevt = α +2∑
i=1
βi ΔLevt−i +3∑
i=1
γi ΔTax Rate t−i + δ1 Default Rate t−1 + δ2 GDP Growth t−1 + δ3 IP Growth t−1 + εt
Small Medium Large All
Coefficient Intercept 0.0054 0.0036 −0.0014 −0.0006ΔLevt−1 −0.1666 −0.4586 −0.0476 0.0184ΔLevt−2 −0.1204 −0.1329 0.2236 0.2233ΔTax Rate t−1 −0.0003 −0.0003 0.0011 0.0010ΔTax Rate t−2 0.0006 0.0039 0.0005 0.0001ΔTax Rate t−3 −0.0007 0.0034 0.0003 0.0005Default Rate t−1 0.2398 −0.3653 0.1924 0.1164GDP Growth t−1 −0.0341 −0.2010 0.0150 0.0105IP Growth t−1 0.0173 0.0903 0.0146 0.0081
t-Statistic Intercept 2.65∗∗ 0.81 −0.99 −0.46ΔLevt−1 −1.10 −2.49∗∗ −0.27 0.10ΔLevt−2 −1.46 −1.09 1.81∗ 1.88∗
ΔTax Rate t−1 −0.35 −0.21 2.03∗∗ 2.25∗∗
ΔTax Rate t−2 0.75 2.17∗∗ 0.86 0.21ΔTax Rate t−3 −0.66 2.51∗∗ 0.53 1.14Default Rate t−1 2.02∗∗ −1.01 1.18 1.82∗
GDP Growth t−1 −0.91 −1.41 0.62 0.66IP Growth t−1 0.79 2.01∗∗ 0.90 0.65
Adj. R2 −0.029 0.229 0.140 0.139N 79 79 79 84
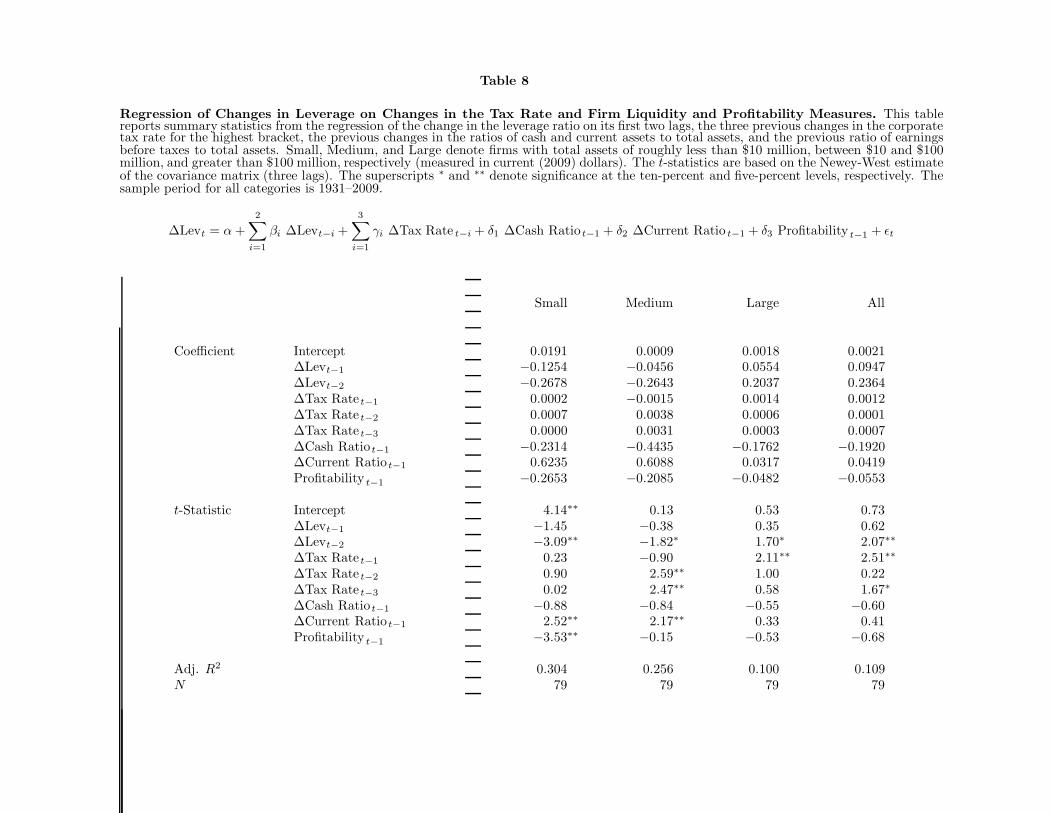
Table 8
Regression of Changes in Leverage on Changes in the Tax Rate and Firm Liquidity and Profitability Measures. This tablereports summary statistics from the regression of the change in the leverage ratio on its first two lags, the three previous changes in the corporatetax rate for the highest bracket, the previous changes in the ratios of cash and current assets to total assets, and the previous ratio of earningsbefore taxes to total assets. Small, Medium, and Large denote firms with total assets of roughly less than $10 million, between $10 and $100million, and greater than $100 million, respectively (measured in current (2009) dollars). The t-statistics are based on the Newey-West estimateof the covariance matrix (three lags). The superscripts ∗ and ∗∗ denote significance at the ten-percent and five-percent levels, respectively. Thesample period for all categories is 1931–2009.
ΔLevt = α +2∑
i=1
βi ΔLevt−i +3∑
i=1
γi ΔTax Rate t−i + δ1 ΔCash Ratio t−1 + δ2 ΔCurrent Ratio t−1 + δ3 Profitability t−1 + εt
Small Medium Large All
Coefficient Intercept 0.0191 0.0009 0.0018 0.0021ΔLevt−1 −0.1254 −0.0456 0.0554 0.0947ΔLevt−2 −0.2678 −0.2643 0.2037 0.2364ΔTax Rate t−1 0.0002 −0.0015 0.0014 0.0012ΔTax Rate t−2 0.0007 0.0038 0.0006 0.0001ΔTax Rate t−3 0.0000 0.0031 0.0003 0.0007ΔCash Ratio t−1 −0.2314 −0.4435 −0.1762 −0.1920ΔCurrent Ratio t−1 0.6235 0.6088 0.0317 0.0419Profitability t−1 −0.2653 −0.2085 −0.0482 −0.0553
t-Statistic Intercept 4.14∗∗ 0.13 0.53 0.73ΔLevt−1 −1.45 −0.38 0.35 0.62ΔLevt−2 −3.09∗∗ −1.82∗ 1.70∗ 2.07∗∗
ΔTax Rate t−1 0.23 −0.90 2.11∗∗ 2.51∗∗
ΔTax Rate t−2 0.90 2.59∗∗ 1.00 0.22ΔTax Rate t−3 0.02 2.47∗∗ 0.58 1.67∗
ΔCash Ratio t−1 −0.88 −0.84 −0.55 −0.60ΔCurrent Ratio t−1 2.52∗∗ 2.17∗∗ 0.33 0.41Profitability t−1 −3.53∗∗ −0.15 −0.53 −0.68
Adj. R2 0.304 0.256 0.100 0.109N 79 79 79 79

Table 9
Regression of Changes in Leverage on Changes in the Tax Rate, Stock Returns, and Changes in Volatility and CorporateCredit Spreads. This table reports summary statistics from the regression of the change in the leverage ratio on its first two lags, the threeprevious changes in the corporate tax rate for the highest bracket, the previous return on the stock market, and the previous changes in stockmarket volatility and corporate credit spreads. Small, Medium, and Large denote firms with total assets of roughly less than $10 million,between $10 and $100 million, and greater than $100 million, respectively (measured in current (2009) dollars). The t-statistics are based onthe Newey-West estimate of the covariance matrix (three lags). The superscripts ∗ and ∗∗ denote significance at the ten-percent and five-percentlevels, respectively. The sample period for the individual size categories is 1931–2009. The sample period for the category including all firmsis 1926–2009.
ΔLevt = α +2∑
i=1
βi ΔLevt−i +3∑
i=1
γi ΔTax Rate t−i + δ1 Stock Return t−1 + δ2 ΔVolatilityt−1 + δ3 ΔSpread t−1 + εt
Small Medium Large All
Coefficient Intercept 0.0060 0.0028 0.0013 0.0013ΔLevt−1 −0.1327 −0.4380 0.0341 0.0713ΔLevt−2 −0.1499 −0.1797 0.1486 0.1853ΔTax Rate t−1 −0.0003 −0.0008 0.0013 0.0011ΔTax Rate t−2 0.0009 0.0032 0.0007 0.0003ΔTax Rate t−3 −0.0011 0.0029 0.0002 0.0005Stock Return t−1 0.0002 −0.0135 −0.0083 −0.0062ΔVolatilityt−1 −0.0496 −0.0017 −0.0331 0.0212ΔSpread t−1 1.2369 0.2089 0.0281 −0.0393
t-Statistic Intercept 2.51∗∗ 0.70 0.82 1.09ΔLevt−1 −0.93 −2.59∗∗ 0.23 0.49ΔLevt−2 −1.92∗ −1.43 1.02 1.43ΔTax Rate t−1 −0.28 −0.45 2.23∗∗ 2.27∗∗
ΔTax Rate t−2 1.13 2.53∗∗ 1.46 0.50ΔTax Rate t−3 −1.03 2.08∗∗ 0.36 1.22Stock Return t−1 0.02 −0.91 −1.26 −1.28ΔVolatilityt−1 −1.39 −0.04 −1.98∗ −1.84∗
ΔSpread t−1 1.37 0.15 0.05 −0.08
Adj. R2 0.019 0.139 0.149 0.143N 79 79 79 84
Online Appendix
Introduction to the IRS Statistics of Income
The IRS provides an extensive introduction to the Statistics of Income Program on itswebsite at http://www.irs.gov/uac/SOI-Tax-Stats-About-SOI. As discussed on thiswebsite, the Revenue Act of 1916 requires the IRS to publish an annual report re-lating to the operations of the internal revenue laws pertaining to the collection oftaxes from individuals, and all forms of business including corporations, estates, non-profit organizations, and trusts. The SOI program fulfills this mandate through itsinformation office, Statistical Information Services.
Beginning in 2009, the IRS began to digitize its library of historical reports, and theseare now all available online. In particular, the website http://www.irs.gov/uac/SOI-Tax-Stats-Archive contains links to pdf versions of the annual SOI reports from 1916to 1933 which contain statistics for both individuals and business returns. Beginningin 1929, the IRS published a separate annual report for businesses, and the abovearchive website contains links to these reports for the 1929 to 1999 period. The USBureau of the Census has summarized much of the key information about corpo-rate financial statements from the SOI annual reports for the period from 1926 to1970 in its publication Historical Statistics of the United States, Colonial Times to1970, Part 2. More recent annual reports for corporate tax statistics can be found athttp://www.irs.gov/uac/SOI-Tax-Stats-Corporation-Complete-Report.
Robustness Analysis Using Net Leverage
The empirical results in Tables 5 through 9 of the paper are based on the leverageratio, which is defined as the ratio of total debt to total assets. As a robustness check,we repeat the analysis in these tables using net leverage, which is defined as the ratioof total debt minus cash to total assets. The results using this alternative measureof leverage are given below as Tables A1 through A5, where Table A1 corresponds toTable 5, Table A2 corresponds to Table 6, etc. As can be seen by comparing the resultsin Tables A1 through A5 with the corresponding tables in the paper, the empiricalresults using the net leverage ratio are virtually identical to those in the paper basedon the leverage ratio.

Table A1
Summary Statistics for Corporate Net Leverage Ratios. This table reports summary statistics for the corporate net leverage ratio (netleverage over total assets, where net leverage is defined as debt minus cash) for the indicated categories. Small, Medium, and Large denotefirms with total assets of roughly less than $10 million, between $10 and $100 million, and greater than $100 million, respectively (measuredin current (2009) dollars). The sample period for the individual size categories is 1931–2009. The sample period for the category including allfirms is 1926–2009.
Small Medium Large All
Mean 0.496 0.550 0.606 0.584Standard Deviation 0.107 0.093 0.075 0.082Minimum 0.309 0.387 0.446 0.439Median 0.526 0.547 0.612 0.602Maximum 0.641 0.710 0.706 0.699Serial Correlation 0.987 0.905 0.988 0.993
N 79 79 79 84

Table A2
Regression of Changes in Net Leverage on Changes in the Tax Rate. This table reports summary statistics from the regression ofthe change in the net leverage ratio (net leverage over total assets, where net leverage is defined as debt minus cash) on its first two lags andon the previous three changes in the corporate tax rate for the highest bracket. Small, Medium, and Large denote firms with total assets ofroughly less than $10 million, between $10 and $100 million, and greater than $100 million, respectively (measured in current (2009) dollars).The t-statistics are based on the Newey-West estimate of the covariance matrix (three lags). The superscripts ∗ and ∗∗ denote significance atthe ten-percent and five-percent levels, respectively. The sample period for the individual size categories is 1931–2009. The sample period forthe category including all firms is 1926–2009.
ΔNet Levt = α +2∑
i=1
βi ΔNet Levt−i +3∑
i=1
γi ΔTax Rate t−i + εt
Small Medium Large All
Coefficient Intercept 0.0049 0.0009 0.0002 0.0003ΔNet Levt−1 −0.0827 −0.4592 0.1743 0.1808ΔNet Levt−2 −0.0980 −0.2258 0.1812 0.2443ΔTax Rate t−1 −0.0017 −0.0025 0.0016 0.0013ΔTax Rate t−2 0.0004 0.0033 0.0004 −0.0001ΔTax Rate t−3 −0.0014 0.0027 0.0001 0.0003
t-Statistic Intercept 2.62∗∗ 0.21 0.16 0.32ΔNet Levt−1 −0.70 −3.13∗∗ 1.46 1.65ΔNet Levt−2 −1.37 −1.94∗ 1.50 2.07∗∗
ΔTax Rate t−1 −1.51 −1.01 2.28∗∗ 2.35∗∗
ΔTax Rate t−2 0.47 2.06∗∗ 0.78 −0.18ΔTax Rate t−3 −1.11 2.00∗∗ 0.09 0.83
Adj. R2 0.018 0.168 0.196 0.180N 79 79 79 84
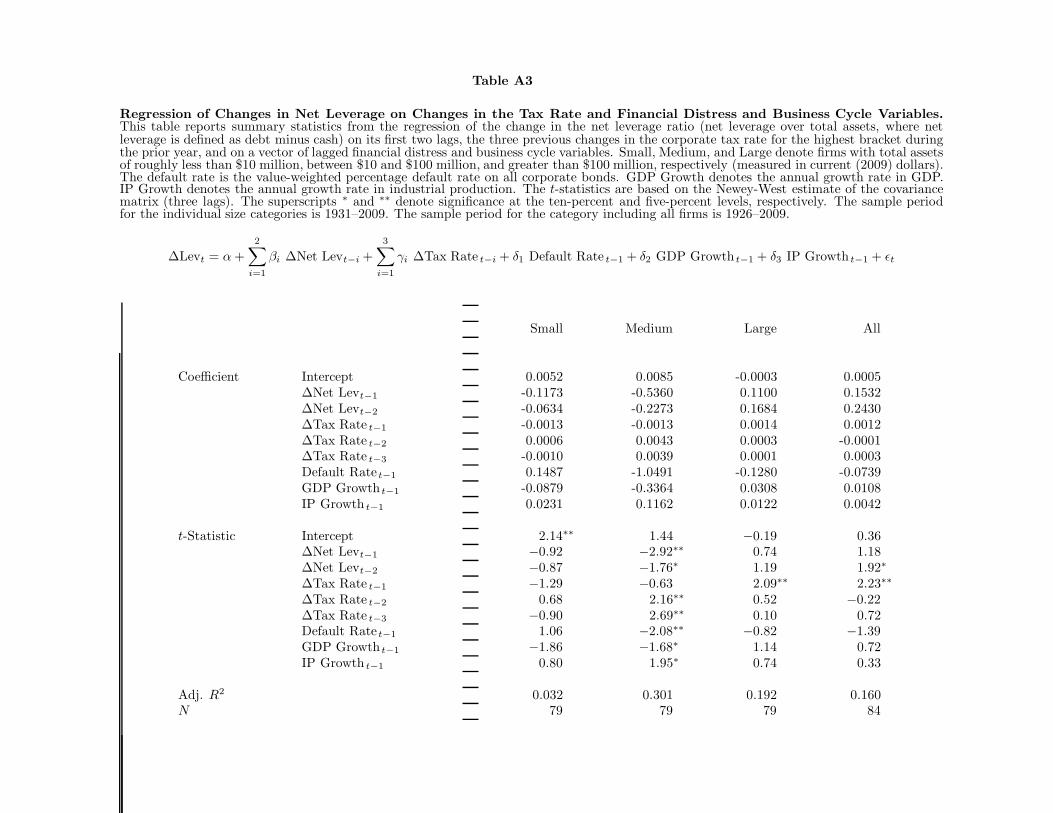
Table A3
Regression of Changes in Net Leverage on Changes in the Tax Rate and Financial Distress and Business Cycle Variables.This table reports summary statistics from the regression of the change in the net leverage ratio (net leverage over total assets, where netleverage is defined as debt minus cash) on its first two lags, the three previous changes in the corporate tax rate for the highest bracket duringthe prior year, and on a vector of lagged financial distress and business cycle variables. Small, Medium, and Large denote firms with total assetsof roughly less than $10 million, between $10 and $100 million, and greater than $100 million, respectively (measured in current (2009) dollars).The default rate is the value-weighted percentage default rate on all corporate bonds. GDP Growth denotes the annual growth rate in GDP.IP Growth denotes the annual growth rate in industrial production. The t-statistics are based on the Newey-West estimate of the covariancematrix (three lags). The superscripts ∗ and ∗∗ denote significance at the ten-percent and five-percent levels, respectively. The sample periodfor the individual size categories is 1931–2009. The sample period for the category including all firms is 1926–2009.
ΔLevt = α +2∑
i=1
βi ΔNet Levt−i +3∑
i=1
γi ΔTax Rate t−i + δ1 Default Rate t−1 + δ2 GDP Growth t−1 + δ3 IP Growth t−1 + εt
Small Medium Large All
Coefficient Intercept 0.0052 0.0085 -0.0003 0.0005ΔNet Levt−1 -0.1173 -0.5360 0.1100 0.1532ΔNet Levt−2 -0.0634 -0.2273 0.1684 0.2430ΔTax Rate t−1 -0.0013 -0.0013 0.0014 0.0012ΔTax Rate t−2 0.0006 0.0043 0.0003 -0.0001ΔTax Rate t−3 -0.0010 0.0039 0.0001 0.0003Default Rate t−1 0.1487 -1.0491 -0.1280 -0.0739GDP Growth t−1 -0.0879 -0.3364 0.0308 0.0108IP Growth t−1 0.0231 0.1162 0.0122 0.0042
t-Statistic Intercept 2.14∗∗ 1.44 −0.19 0.36ΔNet Levt−1 −0.92 −2.92∗∗ 0.74 1.18ΔNet Levt−2 −0.87 −1.76∗ 1.19 1.92∗
ΔTax Rate t−1 −1.29 −0.63 2.09∗∗ 2.23∗∗
ΔTax Rate t−2 0.68 2.16∗∗ 0.52 −0.22ΔTax Rate t−3 −0.90 2.69∗∗ 0.10 0.72Default Rate t−1 1.06 −2.08∗∗ −0.82 −1.39GDP Growth t−1 −1.86 −1.68∗ 1.14 0.72IP Growth t−1 0.80 1.95∗ 0.74 0.33
Adj. R2 0.032 0.301 0.192 0.160N 79 79 79 84

Table A4
Regression of Changes in Net Leverage on Changes in the Tax Rate and Firm Liquidity and Profitability Measures. Thistable reports summary statistics from the regression of the change in the net leverage ratio (net leverage over total assets, where net leverageis defined as debt minus cash) on its first two lags, the three previous changes in the corporate tax rate for the highest bracket, the previouschanges in the ratios of cash and current assets to total assets, and the previous ratio of earnings before taxes to total assets. Small, Medium,and Large denote firms with total assets of roughly less than $10 million, between $10 and $100 million, and greater than $100 million,respectively (measured in current (2009) dollars). The t-statistics are based on the Newey-West estimate of the covariance matrix (three lags).The superscripts ∗ and ∗∗ denote significance at the ten-percent and five-percent levels, respectively. The sample period for all categories is1931–2009.
ΔLevt = α +2∑
i=1
βi ΔNet Levt−i +3∑
i=1
γi ΔTax Rate t−i + δ1 ΔCash Ratio t−1 + δ2 ΔCurrent Ratio t−1 + δ3 Profitability t−1 + εt
Small Medium Large All
Coefficient Intercept 0.0154 −0.0063 −0.0018 −0.0013ΔNet Levt−1 −0.1487 −0.1569 0.1212 0.1283ΔNet Levt−2 −0.1599 −0.3238 0.1255 0.2411ΔTax Rate t−1 −0.0007 −0.0028 0.0017 0.0014ΔTax Rate t−2 0.0005 0.0034 0.0002 −0.0002ΔTax Rate t−3 −0.0004 0.0035 0.0002 0.0004ΔCash Ratio t−1 −0.6392 −0.8155 −0.3649 −0.2894ΔCurrent Ratio t−1 0.6513 0.7417 0.0520 0.0312Profitability t−1 −0.2154 0.1429 0.0661 0.0459
t-Statistic Intercept 3.24∗∗ −0.69 −0.55 −0.48ΔNet Levt−1 −1.83∗ −1.11 0.88 0.99ΔNet Levt−2 −2.21∗∗ −1.99∗∗ 1.17 2.15∗∗
ΔTax Rate t−1 −1.03 −1.23 2.14∗∗ 2.40∗∗
ΔTax Rate t−2 0.58 2.00∗∗ 0.43 −0.29ΔTax Rate t−3 −0.52 2.49∗∗ 0.34 0.93ΔCash Ratio t−1 −1.56 −1.26 −1.19 −1.00ΔCurrent Ratio t−1 3.02∗∗ 1.86∗ 0.48 0.30Profitability t−1 −2.81∗∗ 0.54 0.81 0.68
Adj. R2 0.311 0.265 0.200 0.185N 79 79 79 79

Table A5
Regression of Changes in Net Leverage on Changes in the Tax Rate, Stock Returns, and Changes in Volatility and CorporateCredit Spreads. This table reports summary statistics from the regression of the change in the net leverage ratio (net leverage over totalassets, where net leverage is defined as debt minus cash) on its first two lags, the three previous changes in the corporate tax rate for thehighest bracket, the previous return on the stock market, and the previous changes in stock market volatility and corporate credit spreads.Small, Medium, and Large denote firms with total assets of roughly less than $10 million, between $10 and $100 million, and greater than$100 million, respectively (measured in current (2009) dollars). The t-statistics are based on the Newey-West estimate of the covariance matrix(three lags). The superscripts ∗ and ∗∗ denote significance at the ten-percent and five-percent levels, respectively. The sample period for theindividual size catergories is 1931–2009. The sample period for the category including all firms is 1926–2009.
ΔNet Levt = α +2∑
i=1
βi ΔNet Levt−i +3∑
i=1
γi ΔTax Rate t−i + δ1 Stock Return t−1 + δ2 ΔVolatilityt−1 + δ3 ΔSpread t−1 + εt
Small Medium Large All
Coefficient Intercept 0.0035 0.0020 0.0008 0.0009ΔNet Levt−1 −0.0536 −0.4623 0.1736 0.1739ΔNet Levt−2 −0.1051 −0.2473 0.1682 0.2373ΔTax Rate t−1 −0.0017 −0.0024 0.0017 0.0013ΔTax Rate t−2 0.0008 0.0029 0.0004 −0.0001ΔTax Rate t−3 −0.0016 0.0030 −0.0000 0.0003Stock Return t−1 0.0079 −0.0080 −0.0060 −0.0051ΔVolatilityt−1 −0.0352 0.0410 −0.0265 −0.0131ΔSpread t−1 0.9855 0.1407 0.0560 −0.1356
t-Statistic Intercept 1.58 0.38 0.50 0.75ΔNet Levt−1 −0.43 −2.96∗∗ 1.63 1.75∗
ΔNet Levt−2 −1.36 −1.85∗ 1.66∗ 2.19∗∗
ΔTax Rate t−1 −1.42 −0.99 2.20∗∗ 2.22∗∗
ΔTax Rate t−2 0.82 2.29∗∗ 0.75 −0.16ΔTax Rate t−3 −1.26 2.03∗∗ −0.02 0.83Stock Return t−1 0.59 −0.45 −0.79 −0.97ΔVolatilityt−1 −1.10 0.72 −1.60 −1.25ΔSpread t−1 0.88 0.08 0.08 −0.25
Adj. R2 0.013 0.140 0.192 0.164N 79 79 79 84