the effect of corporate income and payroll taxes … · the effect of corporate income and payroll...
TRANSCRIPT

Corporate In
com
e & Payroll Tax
The Effect of Corporate Income and Payroll Taxes
on the Wages of Canadian Workers
Pouya Ebrahimi and François Vaillancourt
JANUARY 2016

fraserinstitute.org

The Effect of Corporate Income and Payroll Taxes on the Wages of Canadian Workers / i
fraserinstitute.org
Contents
Executive Summary / iii
Introduction / 1
1 Literature Review / 3
Corporate income tax / 3
Payroll taxes / 4
2 Data and Methodology / 8
Variables used in the empirical analysis / 8
Key variables over time and across provinces / 11
3 Empirical Findings / 17
Conclusion / 31
Appendix / 33
References / 66
About the Authors / 70
Acknowledgments / 70
Publishing Information / 71
Purpose, Funding, and Independence / 72
Supporting the Fraser Institute / 72
About the Fraser Institute / 73
Editorial Advisory Board / 74

fraserinstitute.org

fraserinstitute.org / iii
Executive Summary
A long held misperception in public policy debates is about who ultimately bears the burden of business taxes. The tax incidence is determined by the group that ultimately bears the burden of the tax, which can be different from the entity responsible for collecting and remitting the revenue to government. When it comes to corporate taxes, some simply—and wrongly—assume that corporations pay them in an economic sense, leading to inaccurate claims about the desirability of raising such taxes. And, when it comes to payroll taxes, those levied on employers are assumed—again, incorrectly—to be paid by employers.
The corporate income tax (CIT) is ultimately “paid” for by individuals either as: workers through lower wages; consumers through higher prices; and/or corporate owners (shareholders) through lower profits and returns of investment. While the objective of groups pushing for a higher CIT may be to increase the tax burden on owners of capital, taxes shifted to consumers or workers are clearly not paid by “corporations”, even in the loosest mean-ing of the term. With respect to payroll taxes, an increase in the total cost of labour is not always and easily absorbed by employers, meaning increased payroll taxes can result in a reduction in compensation (either wages or fringe benefits, or a combination of both). Thus, studying the incidence of corporate income and payroll taxes is important for an informed public-policy debate.
In practice, empirical evidence suggests that the burden of both taxes is partly shifted to workers. This study examines the effect of the statutory (fed-eral and provincial combined) corporate income-tax rate and the employer portion of the payroll tax rate on the wages of Canadian workers.
Economists generally accept that the burden of corporate income and payroll taxes falls to some extent on workers through reduced wages, espe-cially in open economies where capital is mobile and sensitive to tax rates. This can be the result of: [1] short-term adjustments to the level, or more likely, the rate of wage increases at the time when wages are set; and [2] long-term adjustments that reduce labour productivity and thus wages when capital (investment) declines in higher taxed regions or sectors. The empirical analy-sis in this study focuses on the first explanation and thus most likely captures only part of the impact of such business taxes on wages.

iv / The Effect of Corporate Income and Payroll Taxes on the Wages of Canadian Workers
fraserinstitute.org
We use a sample of individual-level data from Statistics Canada’s Labour Force Survey (LFS) to measure the effect of corporate income and payroll taxes on the wages of workers over the period from 1998 to 2013, while controlling for individual determinants of wages such as a worker’s age, sex, education, marital status, occupation, and industry. We also control for a worker’s union status and firm size, and use provincial fixed effects, time fixed effects, the unemployment rate, and inflation as variables when relevant.
Our findings show that corporate income and payroll taxes have a negative and statistically significant impact on wages even in the very short term. Specifically, controlling for other factors, we find that a 1% increase in the statutory corporate income-tax rate reduces the (inflation-adjusted) hourly wage rate by between 0.15% and 0.24%, depending on the model speci-fication (these results are for workers employed in the private sector). Based on these results, if the 2012 unweighted average combined corporate income-tax rate for the ten provinces (27.34%) increased by just one percentage point to 28.34%, the national hourly wage rate in the following year would decrease by between $0.13 and $0.20, which translates into annual wages that are lower by between $254 and $390.
For a 1% increase in the employer portion of the payroll tax rate, we also find a negative effect on the hourly wage rate ranging from 0.03% to 0.14%. In dollar terms, this suggests that a one-percentage-point increase in the 2012 unweighted average combined employer-portion payroll tax rate (10.52%) would decrease the national average hourly wage rate in the follow-ing year by between $0.07 and $0.31, which translates into annual wages that are lower by between $137 and $605.
In addition, we produce regression analyses including both private- and public-sector workers and sub-samples of private-sector workers grouped by firm size and by union status. In all cases, the results point to a negative and significant effect on the hourly wage rate from increases in corporate income and payroll taxes, albeit by different orders of magnitude.

fraserinstitute.org / 1
Introduction
A long held misperception in public policy debates is about who ultimately bears the burden of business taxes. The tax incidence is determined by the group that ultimately bears the burden of the tax, which can be different from the entity responsible for collecting and remitting the revenue to government. When it comes to corporate taxes, some simply—and wrongly—assume that corporations pay them in an economic sense, leading to inaccurate claims about the desirability of raising such taxes. And when it comes to payroll taxes, those levied on employers are assumed—again, incorrectly—to be paid by employers.
The corporate income tax (CIT) is ultimately “paid” for by individuals either as: workers through lower wages; consumers through higher prices; and/or corporate owners (shareholders) through lower profits and returns of investment. While the objective of groups pushing for a higher CIT may be to increase the tax burden on owners of capital, taxes shifted to consumers or workers through the use of market power are clearly not paid by “corpora-tions”, even in the loosest meaning of the term. With respect to payroll taxes, an increase in the total cost of labour is not always and easily absorbed by employers, meaning increased payroll taxes can result in a reduction in com-pensation (either wages or fringe benefits, or a combination of both). Indeed, studying the incidence of corporate income and payroll taxes is important for an informed public-policy debate.
In practice, empirical evidence suggests that the burden of both taxes is partly shifted to workers. This study examines the effect of the statutory (fed-eral and provincial combined) corporate income-tax rate and the employer portion of the payroll tax rate on the wages of Canadian workers. It follows research carried out by Ebrahimi, Roy, and Vaillancourt (2015) but covers a longer time period and extends the analysis to include the effect on public-sector workers.
Economists generally accept that the burden of corporate income and payroll taxes falls to some extent on workers through reduced wages, espe-cially in open economies where capital is mobile and sensitive to tax rates. How this comes about is not spelled out in the recent empirical literature but the process can be the result of: [1] short-term adjustments to the level, or

2 / The Effect of Corporate Income and Payroll Taxes on the Wages of Canadian Workers
fraserinstitute.org
more likely, the rate of wage increases at the time when wages are set; and [2] long-term adjustments that reduce labour productivity and thus wages when capital (investment) declines in higher-taxed regions or sectors. The empir-ical analysis in this study focuses on the first explanation and thus most likely captures only part of the impact of such business taxes on wages.
We use a sample of individual-level data from Statistics Canada’s Labour Force Survey (LFS) to measure the incidence of corporate income and payroll taxes on the wages of workers over the period from 1998 to 2013, while controlling for individual determinants of wages. Our findings show that corporate income and payroll taxes do in fact have a negative and statis-tically significant impact on wages. In the next section, we briefly review past findings from the literature on the incidence of corporate income and payroll taxes. Section 2 describes our data and methodology. Section 3 presents the results of our empirical analysis.

fraserinstitute.org / 3
1 Literature Review
Here we briefly review the empirical literature measuring the incidence of corporate income tax and payroll taxes.
Corporate income tax
The empirical literature on the incidence of the CIT can be classified into two streams: an older macroeconomic data approach and a newer microeconomic data approach. The first stream of studies originated in the United States and relies on a macroeconometrics approach (Krzyzaniak and Musgrave, 1963; Cragg, Harberger, and Mieszkowski, 1967; Spencer, 1969; Oakland, 1972). Early research focused on the impact of the corporate tax burden on the return of capital. Spencer (1969) examines the incidence of the CIT on the rate of return of capital using data from the Canadian manufacturing sec-tor between 1935 and 1964 and finds that, since profits are unaffected, firms transfer the entire burden of the CIT to other economic agents (the author does not identify the specific agents). However, Dusansky and Tanner (1974) question Spencer’s (1969) methodology and estimate that the transferred burden of the CIT is lower than 100%. This early literature is plagued by speci-fication problems of a reduced-form equation using profits as the dependent variable. Contrary to demand or cost functions, there is no profit function in economic theory; profit is the return capital earns in a given activity with well-functioning markets insuring it is equal across activities with similar risk levels. In terms of an equation, profit is what remains after subtracting from revenues (price multiplied by quantity sold) the cost of items such as labour (wages multiplied by labour inputs), intermediate inputs, depreciation, the cost of borrowed funds, and so on. Sebold (1979) solves this issue by using a structural multiequation model for the United States that examines the deter-minants of the various components of this profit identity (wage level, quantity sold, and so on) and thus the underlying mechanisms of the incidence of the CIT on the price of the factors of production and output. His findings show that 80% of the corporate tax burden falls on workers in the form of lower

4 / The Effect of Corporate Income and Payroll Taxes on the Wages of Canadian Workers
fraserinstitute.org
wages. Sebold (1979) marks the end of the first stream of empirical investiga-tion on the incidence of the CIT.
The second stream of studies began in 2009 and revisited the CIT incidence primarily using survey data from workers. For US states, Felix and Hines (2009) estimate that, for each dollar increase in CIT revenue, the median wage of American workers in the private sector drops by $0.49. Arulampalam, Devereux, and Maffini (2012) find similar results for a panel of European countries. Felix (2009) finds that a one percentage-point increase in the marginal CIT rate is associated with a decrease of 0.14% to 0.36% in wages. Liu and Althshuler (2013) use the effective corporate marginal tax rate and estimate that wages decrease by $0.60 for every dollar increase in cor-porate income tax revenues. More recently, Serrato and Zidar (2014) carried out a cross-country examination of the incidence of the corporate income tax over a ten-year period and estimate that a 1% decrease in tax rates increases real wages by 1.1%. Their findings also suggest that workers bear 28% of the burden of the CIT.
Table 1a summarizes recent studies on the incidence of the CIT with information including the study’s author/year, country/period, wage variable, data/methodology, and findings.
Payroll taxes
We now turn to a brief review of five relevant studies about the incidence of employer-based payroll taxes on wages. Brittain (1974) uses statutory pay-roll tax rates in 64 countries and finds evidence of complete shifting of the burden of this tax to workers. Subsequent studies, however, generally suggest that payroll taxes are partially shifted to workers. For instance, Holmlund (1983) concludes that half of a payroll tax increase (50%) is directly shifted back within one year for blue-collar workers in Sweden.
In Canada, Abbott and Beach (1997) examine average wage levels in the ten provinces using various econometric techniques. They find a large nega-tive effect of payroll taxes on wages, which varies across different econometric specifications. Marceau and Vaillancourt (1990) examine collective agree-ments in large firms in Quebec and differentiate between the incidence of gen-eral and specific payroll taxes. General payroll taxes consist of payroll taxes such as Unemployment Insurance (UI) and the Canada Pension Plan (CPP) or the Quebec Pension Plan (QPP) that are not specific to any firm, whereas specific payroll taxes vary by firm and sector of activity as they are based on a worker’s compensation premium by sector of activity.1 Their results suggest
1. For more details on general and specific payroll taxes, see Roy-César and Vaillancourt, 2010.

The Effect of Corporate Income and Payroll Taxes on the Wages of Canadian Workers / 5
fraserinstitute.org
Table 1a: Summary of five studies on the incidence of the corporate income tax on wages, 2009–2014
Author(s) & Year Country & Period Wage Variable Data & Methodology Main Findings
Felix and Hines (2009)
US states (except Nevada, Wyoming and Washington); 2000
Wage rate (ratio of weekly wage and weekly number of hours worked)
Microdata (57,426) observations on full-time unionized workers in the private sector
Ordinary least squares (OLS)
Controls for occupation and industry
Taxation variable: Highest marginal CIT rate in each state
A dollar increase in CIT revenues decreases the median wage by $0.49
Unionized workers bear 54% of the tax burden (lower wages).
A one-percentage point increase in CIT reduces the wage premium for unionized workers by 0.36%.
Felix (2009) US states (except Nevada, Wyoming and Washington); 1977–2005
Wage rate per worker (ratio of annual wage and number of hours worked per year)
Microdata (1,150,966 observations) on US workers classified in three groups according to their level of education
Controls for occupation and industry
Taxation variable: Highest marginal CIT rate in each state
A 1% increase in CIT marginal rate result in 0.14%-0.36% decrease in wages.
Negative effect of CIT increases with workers’ level of education.
Progressive incidence of CIT: The fiscal burden of the tax increases with wages.
Arulampalam, Devereux, and Maffini (2012)
Nine European countries; 1996–2003
Annual average wage per firm and per worker
Microdata (55,000 firms)
Examination of the direct incidence of CIT on wages
Taxation variable: Corporate taxes per employee
Controls for the productivity per employee in the manufacturing sector
Negative and significant effect of CIT on wages: a dollar increase in CIT results in a $0.49 wage reduction on average (in the long term)
Liu and Altshuler (2013)
United States; 1982, 1992, and 1997
Weekly wages per worker by industry
Microdata (287,111 observations) on individual characteristics of US workers
Panel fixed effects
Taxation variable: Effective marginal corporate tax rate
A dollar increase in CIT revenues reduces workers’ wages by $0.60. This effect rises with the concentration ratio in each industry.
Serrato and Zidar (2014)
Country and individual-level multi-decade data for 490 county groups; 1980–1990, 1990–2000, 2000–2010
Wage rate Examine the incidence of corporate taxes on firm owners, landowners, and workers
1% corporate tax cut results in 1.1% increase in real wages over a period of 10 years.
28% of the tax burden falls on workers; 42% on firm owners and 30% on landowners
Source: Authors.

6 / The Effect of Corporate Income and Payroll Taxes on the Wages of Canadian Workers
fraserinstitute.org
a negative and significant effect of general payroll taxes on wage rates but a positive and significant effect of specific payroll taxes on wages, although the combined effect of both types of taxes becomes insignificant. Following a similar methodology, Roy-César and Vaillancourt (2010) find a 0.5 and 0.3 percentage-point decline in the annual growth rate of wages in Quebec and Ontario, respectively, in response to increased general payroll taxes.
Table 1b summarizes the above studies on the incidence of payroll taxes on wages using the same format as table 1a.

The Effect of Corporate Income and Payroll Taxes on the Wages of Canadian Workers / 7
fraserinstitute.org
Table 1b: Summary of five studies on the incidence of payroll taxes on wages, 1974–2010
Author(s) & Year Country & Period Wage Variable Data & Methodology Main Findings
Brittain (1974) 64 countries (12 industries); 1957–1959
Wage rate per year per individual
Aggregate data (407 observations).
Ordinary least squares (OLS)
Control variable for productivity per worker
Taxation variable: Statutory tax rates in each country
Workers support the entire burden of payroll tax in the long run. The associated coefficient to the incidence of this tax is between −1.14 and −1.60.
Holmlund (1983) Sweden; 1949–1979
Average hourly wage of blue-collar workers (men only) in the manufacturing/mining sector
Ordinary least squares and two-stage least squares (2SLS)
Methodology adjusts for the movement of workers between sector and controls for the effect of price variation on wages
Partial shifting of the payroll tax to the workers estimated between −0.46 (2SLS) to −0.49 (OLS).
Marceau & Vaillancourt (1990)
Canada (Quebec); 1975–1984
Annual growth rate of wages as negotiated in collective agreements
Data on individual collective agreements (780) signed in Quebec from firms with 500 workers and more.
Pooled regression method
Taxation variables include both general and specific taxes applicable on payroll.
Control variables take into account industry, cost of living (if specified in the agreement) and inflation.
Negative and statistically significant effect of general payroll tax on wages reported between −0.247 and −0.389.
Positive effect and statistically significant of specific payroll taxes on wages reported between 0.0266 and 0.0269.
No statistically significant effect of combined (general and specific) payroll taxes.
Abbott and Beach (1997)
Canada (10 provinces) 1970–1993
Annual level of mean wages(log) = wage rate × hours worked
Data by province Payroll tax rates are efective rates (taxes paid/wages) various pooled regression methods (OLS,GLS) with various lags for the tax rate (none, 1 and 2). Control variables account for macro factors such as GDP, inflation or unemployment
Negative and statistically significant effect of payroll tax on wages and employment. “Surprisingly large” high eleasticites of taxes on wages of −1.7 and 3.5 at the mean tax rate
Roy-César & Vaillancourt (2010)
Canada (Quebec and Ontario); 1985–2007
Annual growth rate of wages as negotiated in collective agreements
Data on individual collective agreements (581) signed in Quebec and Ontario from firms with 500 workers or more.
Taxation variables include both general and specific taxes applicable on payroll.
Control variables take into account industry, cost of living (if specified in the agreement) and inflation.
Annual growth rate of wages drops by 0.5 percentage point in Quebec and 0.3 percentage point in Ontario following one-percentage point increase in general payroll tax.
Positive and statistically significant effect of specific payroll taxes on wages is reported
Source: Authors

8 / fraserinstitute.org
2 Data and Methodology
In order to measure the effect of corporate income and payroll taxes on wages correctly, it is important to control for determinants of an individual worker’s wage rate such as their age, gender, marital status, and education. The empirical analysis in this study uses data from various years of Statistics Canada’s Labour Force Survey (LFS) on wages and other individual characteristics of Canadian workers. The main analytical results exclude public-sector workers; this is the practice in recent studies as public-sector workers are not directly subject to the CIT. However, insofar as the public sector hires from labour markets where other employers are subject to the CIT, the wages they pay may reflect an indirect impact. In a separate round of estimations, which can be found in the appendix, we examine the tax incidence including public-sector workers in the regressions. The LFS was carried out on a monthly basis during the period covered in this study (1998 to 2013). Since the data in the survey was not collected from the same respondent in each household every month, we use a quasi-panel approach. To allow for computational ease, we draw a random sample of 10% of the total observations for each year. Our regressions contain the following variables.
Variables used in the empirical analysis
Wage rateWe use the natural logarithm of the hourly wage rate for full-time employees as our dependent variable. We refer to this variable as the wage rate, which is adjusted for inflation using the Consumer Price Index (CPI) before its trans-formation into a logarithm for each province from Statistics Canada (2015a). Real wages are expressed in 2013 dollars.
Corporate income tax rateOur corporate income tax variable consists of the sum of the top federal and provincial statutory2 corporate income-tax rates transformed into logarithmic
2. Statutory tax rates are the rates specified by the tax code, which can, and often do, differ from the effective tax rates actually paid after deductions, exemptions, and credits are applied.

The Effect of Corporate Income and Payroll Taxes on the Wages of Canadian Workers / 9
fraserinstitute.org
form. This variable is lagged by one year to allow for the short term adjustment to wages in response to changing CIT rates. We use a one-year lag to account for the fact that most wages are set annually either by a collective agreement or employer policy. A change in corporate income (or payroll) taxes in a given year announced in a budget speech is unlikely to immediately result in chan-ges to wages. There is no empirical evidence on the exact lag that should be used but we expect that a one-year lag underestimates the adverse effect on wages. We use the highest (or general) CIT rate since corporate profits are mostly subject to this rate as evidenced by the relative importance of the small business corporate-tax expenditure and the CIT revenue at the federal level.3 For example, in 2009 the federal government’s small business corporate-tax expenditure totalled $4,450 million, while its CIT revenue reached $31,273 million (Canada, Department of Finance, 2014; Statistics Canada, 2009a). Put differently, the small business corporate-tax expenditure was just 14% of the total federal CIT revenue, which indicates the importance of this tax relative to the general one.4 We use statutory rates rather than effective rates given the limitations in readily available and consistent data on effective rates, particularly sorted by industry.5 An analysis using effective rates by industry would be an interesting area for future research.
Payroll tax rateThe payroll tax rate includes the employer’s portion of contribution rates to federal-based programs such as Employment Insurance (EI) and Canada Pension Plan (CPP) or, in Quebec, the Quebec Pension Plan (QPP). The con-tribution rates from provincial occupation health and safety commissions, the Quebec Parental Insurance Plan (QPIP), and provincial payroll taxes are also included in this variable. When more than one provincial payroll tax rate exists, we use the highest rate. Similar to the CIT rate variable, a one-period lag of the payroll tax rate is used in our regressions and transformed into logarithmic form.
Age This variable measures the employee’s age and is a proxy for the number of years of work experience. The LFS does not provide the survey participant’s exact age, but rather the age interval to which they belong. Therefore, we
3. The small business CIT expenditure results from the lower CIT rates offered to Canadian small businesses. See more information, see the Canadian Tax Foundation’s Finances of the Nation (Treff and Perry, 198–2007; Treff and Ort, 2008–2012).4. One reviewer suggested using the share of workers subject to this reduced tax rate; however, this information is not available as far as the authors are aware.5. Statutory rates apply to all industries while effective rates vary according to a host of factors such as the financial structure of firms, their use of tax preferences, and so on. The average effective rate reflects this but does not apply to any one industry.

10 / The Effect of Corporate Income and Payroll Taxes on the Wages of Canadian Workers
fraserinstitute.org
divided the age variable into six age categories: 15 to 24 years old, 25 to 34 years old, 35 to 44 years old, 45 to 54 years old, 55 to 64 years old, and 65 years old and over. In the regressions, the reference category is the 15-to-24 age group.
SexFor male employees, this dichotomous variable takes the value of 1; 0 otherwise.
Marital statusThis dichotomous variable takes the value of 1 for married individuals and common-law partners and zero if single, divorced, separated, or widowed.
Education We define five categories of educational attainment based on the LFS classifica-tion: individuals without a high-school diploma, those who hold a high school diploma, those with a post-secondary certificate or diploma, those with a bach-elor’s degree, and those with a graduate degree. We have included a dichot-omous variable for each of these categories, with the exception of individuals without a high-school diploma since we use them as the reference group.
IndustryThe LFS uses the North American Industry Classification System (NAICS) to identify the industry in which respondents work. Eighteen industries are identified; we use the “Manufacturing of durables” as our reference group.
Occupation6The LFS uses the National Occupation Classification (NOC) to identify the occupation held by respondents. Twenty-five occupations are used; “Clerical occupations” is our reference category.
Firm sizeFirm size is measured by the number of employees (including employees abroad) working in a firm. Small firms, our reference category, employ fewer than 100 employees. We create two dichotomous variables: one for medium-sized firms that have 100 to 500 employees, and another for large firms with more than 500 employees.
Union statusWhen an employee is a union member or covered by a collective agreement, this variable takes the value of 1; otherwise it is zero.
6. The authors examined whether using both industry and occupational variables in the same regression affected the results by removing each in turn. No meaningful impact was found on the key results related to tax incidence.

The Effect of Corporate Income and Payroll Taxes on the Wages of Canadian Workers / 11
fraserinstitute.org
Time fixed-effectsWe define a dichotomous variable for each year during the period of our study in order to capture the impact of annual and cyclical factors on wages. The year 2013 is our reference year.
Provincial fixed-effectsEach province is associated with a dichotomous variable to capture the effect of province-specific factors on wages. Quebec is the province of reference.
Unemployment rateWe use the one-period lag of the provincial unemployment rate to control for the macroeconomic environment and thus the relative strength of employ-ers and employees during wage negotiations. A higher unemployment rate is expected to result in lower wages (in real terms).
Inflation rateIn addition to the unemployment rate, the inflation rate also reflects the economic environment in which wage negotiations are held.7 We use a one-period lag of the provincial inflation rate in our regressions. Since our depend-ent variable, the wage rate, is already expressed in real terms, we expect a limited positive effect from inflation on wages in our estimations.
Tables A-1a and A-1b in the appendix present descriptive and summary statistics for the different variables over the period analyzed (1998 to 2013).
Key variables over time and across provinces
Corporate income-tax rateThe corporate income-tax rate varies a great deal among Canadian provinces for the period under examination. Figures 1a, 1b, and 1c present the evolu-tion of the federal and provincial CIT rates for the period from 1997 to 2012. The federal CIT rate has sharply decreased from its peak in 1997 (28%) to 2012 (15%). While we also observe a decreasing tendency in CIT rates dur-ing this period for most provinces, in Quebec the rate has slightly increased since 2005 and in Eastern provinces (except New Brunswick) the rate has remained constant. In 2012, British Columbia, New Brunswick, and Alberta had the lowest provincial CIT rates in Canada (10%), while Nova Scotia and Prince Edward Island had the highest CIT rate (16%).
7. We use the actual values of inflation and unemployment since the inflation rate was negative in a few cases and, thus, could not be transformed into a logarithmic variable.

12 / The Effect of Corporate Income and Payroll Taxes on the Wages of Canadian Workers
fraserinstitute.org
0
5
10
15
20
25
30
2012201120102009200820072006200520042003200220012000199919981997
0
5
10
15
20
25
30
2012201120102009200820072006200520042003200220012000199919981997
0
5
10
15
20
25
30
2012201120102009200820072006200520042003200220012000199919981997
Figures 1 a, b, c: Corporate Income Tax Rates in Canada, Federal and Provincial, 1997–2012Pe
rcen
tPe
rcen
tPe
rcen
t
Sources: Tre� and Perry (1998–2007); Tre� and Ort (2008–2012); calculations by authors.
Federal
Quebec
Ontario
British Columbia
Alberta
Saskatchewan
Manitoba
Newfoundland & Labrador
Prince Edward Island
Nova Scotia
New Brunswick

The Effect of Corporate Income and Payroll Taxes on the Wages of Canadian Workers / 13
fraserinstitute.org
Payroll tax ratesFigures 2a, 2b, and 2c present payroll tax rates for the period from 1997 to 2012. The federal payroll tax rate shown in these figures is the sum of the employer contribution rates to Employment Insurance (EI) and Canada Pension Plan (CPP).8 The provincial payroll tax rate includes EI and CPP/QPP contributions in addition to the contribution rates to provincial occupational health and safety commissions, the Quebec Parental Insurance Plan (QPIP), and provincial payroll taxes.
We observe small variations in the payroll tax rates in Canadian prov-inces over the years. Quebec displays the highest rate in comparison with other provinces. This rate was 14.3% in 2012. For the same year, the payroll tax rate in Alberta was 8.8%.
Unemployment rateWe find that the unemployment rate has been the highest in Eastern prov-inces and the lowest in Western provinces as shown in figures 3a, 3b and 3c. In 2012, Alberta was the province with the lowest unemployment rate (4.6%) and Newfoundland & Labrador had the highest unemployment rate (12.5%) in Canada, much higher than the national average of 7.3%. As indicated in the figures, Quebec and the Eastern provinces experienced generally a higher unemployment rate than the Canadian average, whereas Ontario and the Western provinces were usually below the average.
Wage rateThe evolution of real hourly earnings (in 2013 dollars) in Canadian provinces is shown in figures 4a, 4b, and 4c. There is a 13% increase in real hourly wages for the Canadian average from $20.6 per hour in 1998 to $23.3 per hour in 2013. The sharpest increase in real wages is observed in Alberta dur-ing this period.
Among the Eastern provinces, Newfoundland & Labrador had the highest wage rate ($23.2 per hour) in 2013, which was close to the Canadian average. In contrast, the wage rate for New Brunswick, Nova Scotia, and Prince Edward Island was below the average.
8. In many cases (such as the CPP), the employer contribution rate is matched equally by the employee, meaning the total contribution is double.

14 / The Effect of Corporate Income and Payroll Taxes on the Wages of Canadian Workers
fraserinstitute.org
0
3
6
9
12
15
2012201120102009200820072006200520042003200220012000199919981997
0
3
6
9
12
15
2012201120102009200820072006200520042003200220012000199919981997
0
3
6
9
12
15
2012201120102009200820072006200520042003200220012000199919981997
Figures 2 a, b, c: Payroll Tax Rates in Canada, Federal and Provincial, 1997–2012Pe
rcen
tPe
rcen
tPe
rcen
t
Sources: Tre� and Perry (1998–2007); Tre� and Ort (2008–2012); calculations by authors.
Quebec
Federal
Ontario
British Columbia
Alberta
Manitoba
Saskatchewan
Prince Edward Island
Nova Scotia
Newfoundland & Labrador
New Brunswick

The Effect of Corporate Income and Payroll Taxes on the Wages of Canadian Workers / 15
fraserinstitute.org
0
5
10
15
20
2012201120102009200820072006200520042003200220012000199919981997
0
5
10
15
20
2012201120102009200820072006200520042003200220012000199919981997
0
5
10
15
20
2012201120102009200820072006200520042003200220012000199919981997
Figures 3 a, b, c: Unemployment Rates in Canada and the Provinces, 1997–2012
Percen
tPe
rcen
tPe
rcen
t
Sources: Statistics Canada, 2002b, 2010b, 2015b.
Quebec
Canada
Ontario
Saskatchewan
Alberta
British Columbia
Manitoba
New Brunswick
Prince Edward Island
Newfoundland & Labrador
Nova Scotia

16 / The Effect of Corporate Income and Payroll Taxes on the Wages of Canadian Workers
fraserinstitute.org
10
15
20
25
30
2013201220112010200920082007200620052004200320022001200019991998
10
15
20
25
30
2013201220112010200920082007200620052004200320022001200019991998
10
15
20
25
30
2013201220112010200920082007200620052004200320022001200019991998
Figures 4 a, b, c: Real Hourly Earnings in Canada and the Provinces, 1998–2013Rea
l hou
rly earning
s (average
$)
Rea
l hou
rly earning
s (average
$)
Rea
l hou
rly earning
s (average
$)
Sources: Statistics Canada, 1999–2013; calculation by authors.
Ontario
Quebec
Canada
Saskatchewan
Manitoba
Alberta
British Columbia
New Brunswick
Nova Scotia
Newfoundland & Labrador
Prince Edward Island

fraserinstitute.org / 17
3 Empirical Findings
This section first discusses the empirical results for the incidence of corpor-ate income taxes, and then the results for payroll taxes.
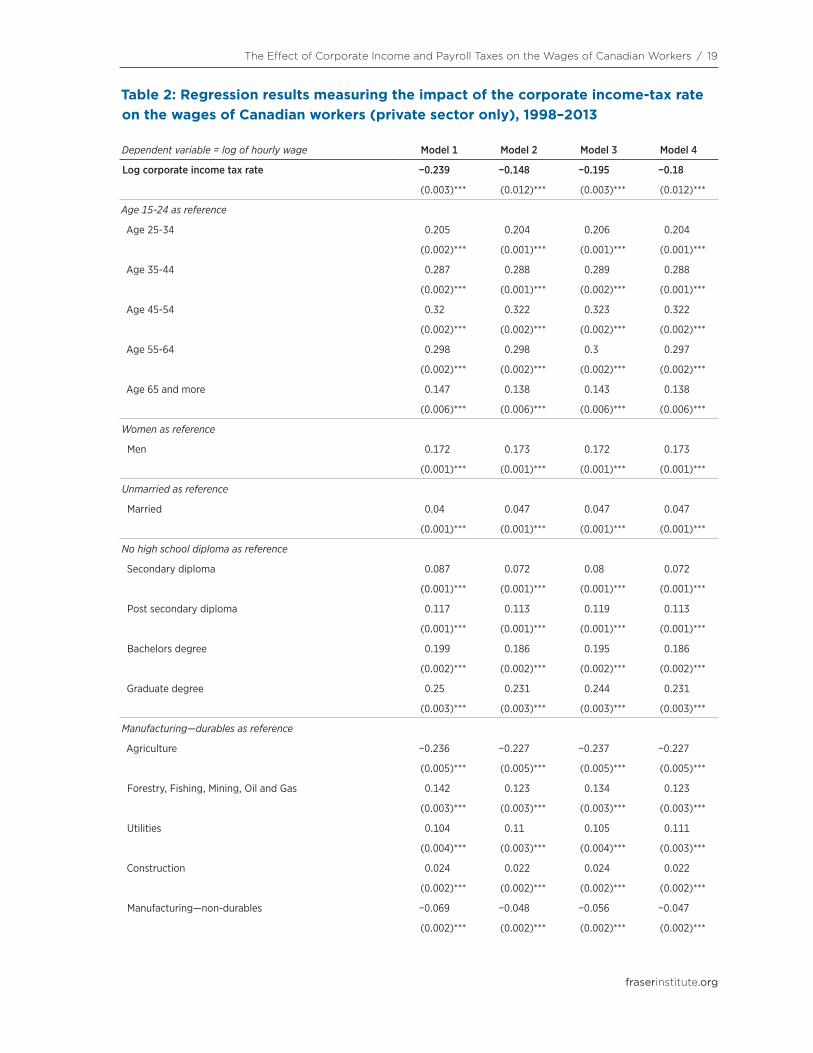
Corporate income taxesTable 2 presents the results from a series of regression models measuring the effect of the statutory CIT rate on the wages of Canadian private-sector workers.9 In all cases, we find an inverted U-shaped relationship between age and wages and a wage premium associated for male and married employees. The coefficients for education indicate that higher educational attainment is associated with a higher wage rate. The wage rate also varies across indus-tries and occupations. The firm size and union status variables have positive effects on a worker’s wage.
Model 1 in table 2 is the simplest of the four models. Model 2 adds time and provincial fixed effects to the first model. Model 3 removes the fixed effects variables but includes two additional control variables, the inflation rate and the unemployment rate, while model 4 contains time and provin-cial fixed effects in addition to the macro-economic control variables. In all cases, the CIT rate coefficient is negative and statistically significant. A 1% increase in the corporate income tax rate reduces the hourly wage rate by 0.15% to 0.24%.
What do the results mean in dollar terms? Consider the following esti-mate of the effect on wages from a one-percentage point increase the CIT rate. The unweighted average for the ten provinces of the combined federal and provincial corporate income-tax rate in 2012 is 27.34%. That means a one-percentage point increase in the average CIT rate yields a 3.66% change. If we multiply 3.66% by the regression coefficients, which range from 0.15% to 0.24%, this produces a reduction ranging from 0.55% to 0.88% in the average hourly wage rate. Since the national average hourly wage in 2013 was $23.27,
9. Further results measuring the impact of the CIT rate are presented in the appendix (see tables A-2, A-3, and A-4) which includes regressions with public-sector workers, regressions by firm size, and regressions by union status. We present some of the regres-sion results in the appendix for ease of exposition.

18 / The Effect of Corporate Income and Payroll Taxes on the Wages of Canadian Workers
fraserinstitute.org
this then translates into an hourly wage reduction between $0.13 and $0.20. Assuming a 37.5-hour work week and 52 weeks of work, the reduction in wages over the course of a year is between $254 and $390.
The results reported in table 2 are for private-sector workers only as is the practice in the literature. We report in table A-2 in the appendix the results including both private- and public-sector workers since there can be spillover effects from the CIT in the private sector on wages in the public sector, given labour mobility. Again, we find that an increase in the statu-tory CIT rate reduces the hourly wage rate by roughly the same magnitude (between 0.13% and 0.24%).
To further investigate the link between firm size and the effect of the CIT rate on wages, we divided the private-sector workers in our sample into three groups depending on the size of their firm. Table A-3 in the appendix shows the regression results of model 1 and model 4 from table 2 for small firms, medium-sized firms, and large firms. The effect of the CIT rate on wages exhibits an inverse relation with firm size. That is, a higher burden of the tax falls on employee wages in smaller firms than those working in lar-ger firms.10 Specifically, the impact of a 1% increase in the CIT rate on wages is 0.22% to 0.31% for workers at small firms, 0.17% to 0.21% for workers at medium-sized firms, and 0.14% to 0.18% for workers at large firms. This result could be attributed to the greater pricing power of larger firms that allows them to shift the tax to purchasers (consumers) of their products.
Table A-4 in the appendix includes regressions for private-sector work-ers who are part of a union or collective agreements and those who are not part of such arrangements. We again use model 1 and model 4 from table 2. The wages of workers who are in a union or covered by a collective agreement are less negatively affected (0.04% to 0.07%) by a CIT rate hike than those who are not (0.23% to 0.29%). This is most likely explained by the greater power and ability of unions to resist wage reductions following CIT rate hikes compared to non-unionized workforces.
10. One should note that the small business CIT rate applies only to the first $500,000 of income for Canadian controlled corporations. Thus most employees work in firms subject to the general rate.
The Effect of Corporate Income and Payroll Taxes on the Wages of Canadian Workers / 19
fraserinstitute.org
Table 2: Regression results measuring the impact of the corporate income-tax rate on the wages of Canadian workers (private sector only), 1998–2013
Dependent variable = log of hourly wage Model 1 Model 2 Model 3 Model 4
Log corporate income tax rate −0.239 −0.148 −0.195 −0.18
(0.003)*** (0.012)*** (0.003)*** (0.012)***
Age 15-24 as reference
Age 25-34 0.205 0.204 0.206 0.204
(0.002)*** (0.001)*** (0.001)*** (0.001)***
Age 35-44 0.287 0.288 0.289 0.288
(0.002)*** (0.001)*** (0.002)*** (0.001)***
Age 45-54 0.32 0.322 0.323 0.322
(0.002)*** (0.002)*** (0.002)*** (0.002)***
Age 55-64 0.298 0.298 0.3 0.297
(0.002)*** (0.002)*** (0.002)*** (0.002)***
Age 65 and more 0.147 0.138 0.143 0.138
(0.006)*** (0.006)*** (0.006)*** (0.006)***
Women as reference
Men 0.172 0.173 0.172 0.173
(0.001)*** (0.001)*** (0.001)*** (0.001)***
Unmarried as reference
Married 0.04 0.047 0.047 0.047
(0.001)*** (0.001)*** (0.001)*** (0.001)***
No high school diploma as reference
Secondary diploma 0.087 0.072 0.08 0.072
(0.001)*** (0.001)*** (0.001)*** (0.001)***
Post secondary diploma 0.117 0.113 0.119 0.113
(0.001)*** (0.001)*** (0.001)*** (0.001)***
Bachelors degree 0.199 0.186 0.195 0.186
(0.002)*** (0.002)*** (0.002)*** (0.002)***
Graduate degree 0.25 0.231 0.244 0.231
(0.003)*** (0.003)*** (0.003)*** (0.003)***
Manufacturing—durables as reference
Agriculture −0.236 −0.227 −0.237 −0.227
(0.005)*** (0.005)*** (0.005)*** (0.005)***
Forestry, Fishing, Mining, Oil and Gas 0.142 0.123 0.134 0.123
(0.003)*** (0.003)*** (0.003)*** (0.003)***
Utilities 0.104 0.11 0.105 0.111
(0.004)*** (0.003)*** (0.004)*** (0.003)***
Construction 0.024 0.022 0.024 0.022
(0.002)*** (0.002)*** (0.002)*** (0.002)***
Manufacturing—non-durables −0.069 −0.048 −0.056 −0.047
(0.002)*** (0.002)*** (0.002)*** (0.002)***

20 / The Effect of Corporate Income and Payroll Taxes on the Wages of Canadian Workers
fraserinstitute.org
Table 2: Regression results measuring the impact of the corporate income-tax rate on the wages of Canadian workers (private sector only), 1998–2013
Dependent variable = log of hourly wage Model 1 Model 2 Model 3 Model 4
Wholesale trade −0.074 −0.071 −0.074 −0.071
(0.003)*** (0.003)*** (0.003)*** (0.003)***
Retail trade −0.224 −0.21 −0.217 −0.209
(0.002)*** (0.002)*** (0.002)*** (0.002)***
Transportation & Warehousing −0.057 −0.054 −0.057 −0.053
(0.002)*** (0.002)*** (0.002)*** (0.002)***
Finance, Insurance, Real Estate and Leasing −0.038 −0.033 −0.036 −0.032
(0.002)*** (0.002)*** (0.002)*** (0.002)***
Professional, Scientific and Technical Services 0.009 0.009 0.011 0.01
(0.003)*** (0.003)*** (0.003)*** (0.003)***
Management, Administrative and Other Support −0.193 −0.18 −0.184 −0.18
(0.003)*** (0.003)*** (0.003)*** (0.003)***
Information, Culture and Recreation −0.071 −0.064 −0.067 −0.064
(0.003)*** (0.003)*** (0.003)*** (0.003)***
Accommodation and Food Services −0.297 −0.29 −0.292 −0.289
(0.003)*** (0.003)*** (0.003)*** (0.003)***
Other Services −0.139 −0.132 −0.136 −0.132
(0.003)*** (0.003)*** (0.003)*** (0.003)***
Clerical occupations as reference
Senior Management occupations 0.614 0.609 0.613 0.608
(0.010)*** (0.009)*** (0.010)*** (0.009)***
Other Management occupations 0.406 0.402 0.404 0.401
(0.002)*** (0.002)*** (0.002)*** (0.002)***
Professional occupations in Business and Finance 0.341 0.339 0.341 0.339
(0.004)*** (0.003)*** (0.004)*** (0.003)***
Financial, Secretarial, and Administrative occupations 0.118 0.116 0.117 0.116
(0.003)*** (0.002)*** (0.002)*** (0.002)***
Natural and Applied Sciences and related occupations 0.278 0.277 0.279 0.277
(0.002)*** (0.002)*** (0.002)*** (0.002)***
Professionals in Health/Nurse supervisors/Registered Nurses 0.66 0.667 0.663 0.667
(0.012)*** (0.012)*** (0.012)*** (0.012)***
Technical, Assisting and related occupations in Health 0.117 0.116 0.115 0.116
(0.006)*** (0.006)*** (0.006)*** (0.006)***
Occupations in Social Science, Government and Religion 0.221 0.22 0.221 0.22
(0.005)*** (0.005)*** (0.005)*** (0.005)***
Teachers & Professors 0.284 0.287 0.288 0.288
(0.013)*** (0.013)*** (0.013)*** (0.013)***
Occupations in Art, Culture, Recreation and Sport 0.141 0.141 0.143 0.141
(0.004)*** (0.004)*** (0.004)*** (0.004)***
Table 2, continued: Regression results measuring the impact of the corporate income-tax rate on the wages of Canadian workers (private sector only), 1998–2013

The Effect of Corporate Income and Payroll Taxes on the Wages of Canadian Workers / 21
fraserinstitute.org
Table 2: Regression results measuring the impact of the corporate income-tax rate on the wages of Canadian workers (private sector only), 1998–2013
Dependent variable = log of hourly wage Model 1 Model 2 Model 3 Model 4
Wholesale/Technical/Insurance/Real Estate/Buyers 0.141 0.137 0.139 0.137
(0.003)*** (0.003)*** (0.003)*** (0.003)***
Retail sales person/Sales clerk/Cashier/retail supervisor −0.063 −0.063 −0.06 −0.063
(0.003)*** (0.002)*** (0.002)*** (0.002)***
Chefs/Cooks/Food and Beverage Service/Supervisors −0.027 −0.028 −0.028 −0.028
(0.003)*** (0.003)*** (0.003)*** (0.003)***
Occupations in Protective Services −0.158 −0.161 −0.159 −0.161
(0.006)*** (0.006)*** (0.006)*** (0.006)***
Childcare and Home Support workers −0.285 −0.292 −0.269 −0.293
(0.010)*** (0.010)*** (0.010)*** (0.010)***
Sales and Service not elsewhere classified −0.128 −0.131 −0.127 −0.131
(0.002)*** (0.002)*** (0.002)*** (0.002)***
Contractors/Supervisors in trade and transportation 0.223 0.213 0.216 0.213
(0.004)*** (0.004)*** (0.004)*** (0.004)***
Construction Trades 0.068 0.069 0.07 0.068
(0.003)*** (0.003)*** (0.003)*** (0.003)***
Other Trades occupations 0.124 0.116 0.12 0.116
(0.002)*** (0.002)*** (0.002)*** (0.002)***
Transport and Equipment operators −0.007 −0.009 −0.006 −0.009
(0.002)*** (0.002)*** (0.002)** (0.002)***
Trades Helper/Construction/transportation labourer/related −0.072 −0.074 −0.069 −0.074
(0.003)*** (0.003)*** (0.003)*** (0.003)***
Occupations unique to Primary Industry −0.013 −0.002 −0.005 −0.001
(0.004)*** −0.004 −0.004 −0.004
Machine Operator/Assembler in manufacturing/Supervisors −0.044 −0.048 −0.045 −0.049
(0.002)*** (0.002)*** (0.002)*** (0.002)***
Labourer in Processing, Manufacturing and Utilities −0.153 −0.151 −0.149 −0.151
(0.003)*** (0.003)*** (0.003)*** (0.003)***
Small-size firm as reference
Medium-size firm 0.079 0.073 0.076 0.073
(0.001)*** (0.001)*** (0.001)*** (0.001)***
Large-size firm 0.14 0.13 0.134 0.13
(0.001)*** (0.001)*** (0.001)*** (0.001)***
Non-union as reference
Union 0.115 0.128 0.119 0.127
(0.001)*** (0.001)*** (0.001)*** (0.001)***
Québec as reference
Ontario 0.11 0.09
(0.002)*** (0.002)***
Table 2, continued: Regression results measuring the impact of the corporate income-tax rate on the wages of Canadian workers (private sector only), 1998–2013

22 / The Effect of Corporate Income and Payroll Taxes on the Wages of Canadian Workers
fraserinstitute.org
Table 2: Regression results measuring the impact of the corporate income-tax rate on the wages of Canadian workers (private sector only), 1998–2013
Dependent variable = log of hourly wage Model 1 Model 2 Model 3 Model 4
British Columbia 0.102 0.076
(0.002)*** (0.002)***
Alberta 0.185 0.131
(0.002)*** (0.003)***
Saskatchewan 0.075 0.025
(0.003)*** (0.003)***
Manitoba 0.008 −0.045
(0.002)*** (0.003)***
Newfoundland −0.074 0.042
(0.003)*** (0.006)***
Prince Edward Island −0.079 −0.017
(0.003)*** (0.004)***
Nova Scotia −0.042 −0.025
(0.003)*** (0.003)***
New Brunswick −0.076 −0.049
(0.002)*** (0.003)***
Year 2013 as reference
1998 −0.046 0.001
(0.006)*** −0.006
1999 −0.036 −0.008
(0.006)*** −0.006
2000 −0.025 −0.001
(0.006)*** −0.006
2001 −0.017 0.002
(0.006)*** −0.006
2002 −0.024 −0.001
(0.006)*** −0.006
2003 −0.04 −0.016
(0.005)*** (0.005)***
2004 −0.046 −0.021
(0.004)*** (0.005)***
2005 −0.049 −0.039
(0.004)*** (0.004)***
2006 −0.044 −0.037
(0.004)*** (0.004)***
2007 −0.031 −0.034
(0.004)*** (0.004)***
2008 −0.013 −0.02
(0.004)*** (0.004)***
Table 2, continued: Regression results measuring the impact of the corporate income-tax rate on the wages of Canadian workers (private sector only), 1998–2013

The Effect of Corporate Income and Payroll Taxes on the Wages of Canadian Workers / 23
fraserinstitute.org
Table 2: Regression results measuring the impact of the corporate income-tax rate on the wages of Canadian workers (private sector only), 1998–2013
Dependent variable = log of hourly wage Model 1 Model 2 Model 3 Model 4
2009 0.004 −0.001
−0.003 −0.003
2010 0.01 0.021
(0.003)*** (0.004)***
2011 −0.004 0.012
−0.003 (0.003)***
2012 −0.002 0.014
−0.003 (0.003)***
Inflation rate −1.06 −0.77
(0.054)*** (0.094)***
Unemployment rate −2.358 −1.647
(0.020)*** (0.066)***
Constant 2.149 2.208 2.387 2.313
(0.004)*** (0.017)*** (0.005)*** (0.017)***
R-squared 0.49 0.52 0.50 0.52
Observations 545,420 545,420 545,420 545,420
Notes: Robust standard errors in parentheses * significant at 10%; ** significant at 5%; *** significant at 1%. In table A-2 the authors include workers from both private- and public-sector workers to examine the spill-over effects from the imposition of the CIT in the private sector on wages in the public sector given labour mobility.
Sources: Statistics Canada (1999–2013); calculation by authors.
Table 2, continued: Regression results measuring the impact of the corporate income-tax rate on the wages of Canadian workers (private sector only), 1998–2013

24 / The Effect of Corporate Income and Payroll Taxes on the Wages of Canadian Workers
fraserinstitute.org
Payroll taxes
Table 3 presents regression results using the same four models as in table 2 to measure the effect on wages of the employer portion of the payroll tax rate.11 The coefficients for the payroll tax rate in all four models point to a negative and statistically significant impact on the hourly wage of private-sector work-ers. A 1% increase in the payroll tax rate results in a 0.03%% to 0.14% decrease in the real hourly wage rate. In dollar terms, using the same methodology for the CIT calculations above, a one-percentage point increase in the aver-age federal-provincial payroll tax rate in 2012 translates into an hourly wage reduction between $0.07 and $0.31 (this is based on an unweighted average payroll tax rate of 10.52% and a national average hourly wage rate of $23.27). Assuming a 37.5-hour work week and 52 weeks of work, the reduction in wages over the course of a year is between $137 and $605.
The results, including both private- and public-sector workers are dis-played in table A-5 in the appendix and similarly point to a negative effect from the payroll tax rate variable (ranging from 0.01% to 0.11%).
After dividing our sample of workers into those working at small, medium, and large firms, we find that the burden of the payroll tax rate falls most heavily on employees at medium-sized firms as shown in table A-6 in the appendix: 0.08% to 0.13% for those at small firms, 0.17% to 0.19% for those at medium-sized firms, and 0.08% to 0.18% for those at large firms.
Table A-7 in the appendix includes regressions for private-sector work-ers by union status (using model 1 and model 4 from table 3). In contrast to the CIT rate results, the burden of the payroll tax rate is higher for Canadian workers who are part of a union or covered by a collective agreement (0.19% to 0.23%) than those who are not (0.14%). Unionization may make it easier for employers to implement lower wages as decisions targeting individual workers are not necessary.
Table 4 and table 5 summarize the estimated coefficients in our regres-sions for the effect of the statutory corporate income-tax rate and payroll tax rate, respectively. Both taxes reduced wages in Canada over the period from 1998 to 2013 but to varying degrees, depending on the model specification.
11. Further results measuring the impact of the payroll tax rate are presented in the appendix (see tables A-5, A-6, and A-7) which includes regressions with public-sector workers, regressions by firm size, and regressions by union status. We present some of the regression results in the appendix for ease of exposition.

The Effect of Corporate Income and Payroll Taxes on the Wages of Canadian Workers / 25
fraserinstitute.org
Table 3: Regression results measuring the impact of the payroll tax rate (employer portion) on the wages of Canadian workers (private sector only), 1998–2013
Dependent variable = log of hourly wage Model 1 Model 2 Model 3 Model 4
Log payroll tax rate −0.139 −0.102 −0.032 −0.139
(0.003)*** (0.022)*** (0.003)*** (0.022)***
Age 15-24 as reference
Age 25-34 0.207 0.204 0.208 0.204
(0.002)*** (0.001)*** (0.001)*** (0.001)***
Age 35-44 0.289 0.288 0.291 0.288
(0.002)*** (0.001)*** (0.002)*** (0.001)***
Age 45-54 0.331 0.322 0.331 0.322
(0.002)*** (0.002)*** (0.002)*** (0.002)***
Age 55-64 0.314 0.297 0.312 0.297
(0.002)*** (0.002)*** (0.002)*** (0.002)***
Age 65 and more 0.168 0.138 0.16 0.138
(0.006)*** (0.006)*** (0.006)*** (0.006)***
Women as reference
Men 0.172 0.173 0.171 0.173
(0.001)*** (0.001)*** (0.001)*** (0.001)***
Non married as reference
Married 0.03 0.047 0.039 0.047
(0.001)*** (0.001)*** (0.001)*** (0.001)***
No high school diploma as reference
Secondary diploma 0.088 0.072 0.082 0.072
(0.001)*** (0.001)*** (0.001)*** (0.001)***
Post secondary diploma 0.125 0.113 0.125 0.113
(0.001)*** (0.001)*** (0.001)*** (0.001)***
Bachelors degree 0.21 0.186 0.204 0.186
(0.002)*** (0.002)*** (0.002)*** (0.002)***
Graduate degree 0.26 0.23 0.253 0.23
(0.003)*** (0.003)*** (0.003)*** (0.003)***
Manufacturing durables as reference
Agriculture −0.245 −0.228 −0.239 −0.227
(0.005)*** (0.005)*** (0.005)*** (0.005)***
Forestry, Fishing, Mining, Oil and Gas 0.133 0.123 0.136 0.124
(0.003)*** (0.003)*** (0.003)*** (0.003)***
Utilities 0.099 0.11 0.105 0.111
(0.004)*** (0.003)*** (0.004)*** (0.003)***
Construction 0.024 0.022 0.03 0.022
(0.002)*** (0.002)*** (0.002)*** (0.002)***
Manufacturing—non-durables −0.071 −0.048 −0.057 −0.047
(0.002)*** (0.002)*** (0.002)*** (0.002)***

26 / The Effect of Corporate Income and Payroll Taxes on the Wages of Canadian Workers
fraserinstitute.org
Table 3: Regression results measuring the impact of the payroll tax rate (employer portion) on the wages of Canadian workers (private sector only), 1998–2013
Dependent variable = log of hourly wage Model 1 Model 2 Model 3 Model 4
Wholesale trade −0.077 −0.071 −0.073 −0.071
(0.003)*** (0.003)*** (0.003)*** (0.003)***
Retail trade −0.226 −0.21 −0.215 −0.209
(0.002)*** (0.002)*** (0.002)*** (0.002)***
Transportation & Warehousing −0.064 −0.054 −0.057 −0.054
(0.002)*** (0.002)*** (0.002)*** (0.002)***
Finance, Insurance, Real Estate and Leasing −0.041 −0.033 −0.036 −0.032
(0.002)*** (0.002)*** (0.002)*** (0.002)***
Professional, Scientific and Technical Services 0.009 0.009 0.013 0.009
(0.003)*** (0.003)*** (0.003)*** (0.003)***
Management, Administrative and Other Support −0.194 −0.18 −0.182 −0.18
(0.003)*** (0.003)*** (0.003)*** (0.003)***
Information, Culture and Recreation −0.078 −0.064 −0.068 −0.064
(0.003)*** (0.003)*** (0.003)*** (0.003)***
Accommodation and Food Services −0.302 −0.29 −0.291 −0.289
(0.003)*** (0.003)*** (0.003)*** (0.003)***
Other Services −0.142 −0.132 −0.135 −0.132
(0.003)*** (0.003)*** (0.003)*** (0.003)***
Clerical occupation as reference
Senior Management occupations 0.605 0.609 0.604 0.608
(0.010)*** (0.009)*** (0.010)*** (0.009)***
Other Management occupations 0.403 0.401 0.402 0.401
(0.002)*** (0.002)*** (0.002)*** (0.002)***
Professional occupations in Business and Finance 0.342 0.339 0.341 0.339
(0.004)*** (0.003)*** (0.004)*** (0.003)***
Financial, Secretarial, and Administrative occupations 0.114 0.116 0.115 0.116
(0.003)*** (0.002)*** (0.002)*** (0.002)***
Natural and Applied Sciences and related occupations 0.279 0.277 0.279 0.277
(0.002)*** (0.002)*** (0.002)*** (0.002)***
Professionals in Health/Nurse supervisors/Registered Nurses 0.655 0.667 0.66 0.667
(0.012)*** (0.012)*** (0.012)*** (0.012)***
Technical, Assisting and related occupations in Health 0.125 0.116 0.12 0.116
(0.006)*** (0.006)*** (0.006)*** (0.006)***
Occupations in Social Science, Government and Religion 0.216 0.219 0.218 0.22
(0.005)*** (0.005)*** (0.005)*** (0.005)***
Teachers & Professors 0.293 0.287 0.294 0.287
(0.013)*** (0.013)*** (0.013)*** (0.013)***
Occupations in Art, Culture, Recreation and Sport 0.144 0.141 0.144 0.141
(0.004)*** (0.004)*** (0.004)*** (0.004)***
Table 3, continued: Regression results measuring the impact of the payroll tax rate (employer portion) on the wages of Canadian workers (private sector only), 1998–2013

The Effect of Corporate Income and Payroll Taxes on the Wages of Canadian Workers / 27
fraserinstitute.org
Table 3: Regression results measuring the impact of the payroll tax rate (employer portion) on the wages of Canadian workers (private sector only), 1998–2013
Dependent variable = log of hourly wage Model 1 Model 2 Model 3 Model 4
Wholesale/Technical/Insurance/Real Estate/Buyers 0.141 0.137 0.139 0.137
(0.003)*** (0.003)*** (0.003)*** (0.003)***
Retail sales person/Sales clerk/Cashier/retail supervisor −0.063 −0.063 −0.059 −0.063
(0.003)*** (0.002)*** (0.003)*** (0.002)***
Chefs/Cooks/Food and Beverage Service/Supervisors −0.027 −0.028 −0.028 −0.028
(0.003)*** (0.003)*** (0.003)*** (0.003)***
Occupations in Protective Services −0.16 −0.161 −0.16 −0.161
(0.006)*** (0.006)*** (0.006)*** (0.006)***
Childcare and Home Support workers −0.285 −0.292 −0.266 −0.293
(0.010)*** (0.010)*** (0.010)*** (0.010)***
Sales and Service not elsewhere classified −0.128 −0.131 −0.126 −0.131
(0.002)*** (0.002)*** (0.002)*** (0.002)***
Contractors/Supervisors in trade and transportation 0.224 0.213 0.218 0.213
(0.004)*** (0.004)*** (0.004)*** (0.004)***
Construction Trades 0.068 0.069 0.071 0.068
(0.003)*** (0.003)*** (0.003)*** (0.003)***
Other Trades occupations 0.123 0.116 0.12 0.116
(0.002)*** (0.002)*** (0.002)*** (0.002)***
Transport and Equipment operators −0.007 −0.009 −0.005 −0.009
(0.002)*** (0.002)*** (0.002)** (0.002)***
Trades Helper/Construction/transportation labourer/related −0.07 −0.074 −0.067 −0.074
(0.003)*** (0.003)*** (0.003)*** (0.003)***
Occupations unique to Primary Industry −0.012 −0.002 −0.004 −0.001
(0.004)*** −0.004 −0.004 −0.004
Machine Operator/Assembler in manufacturing/Supervisors −0.044 −0.048 −0.045 −0.048
(0.002)*** (0.002)*** (0.002)*** (0.002)***
Labourer in Processing, Manufacturing and Utilities −0.154 −0.151 −0.148 −0.151
(0.003)*** (0.003)*** (0.003)*** (0.003)***
Small-size firm as reference
Medium-size firm 0.08 0.073 0.076 0.073
(0.001)*** (0.001)*** (0.001)*** (0.001)***
Large-size firm 0.14 0.13 0.135 0.13
(0.001)*** (0.001)*** (0.001)*** (0.001)***
Non union as reference
Union 0.119 0.127 0.12 0.127
(0.001)*** (0.001)*** (0.001)*** (0.001)***
Quebec as reference
Ontario 0.076 0.047
(0.004)*** (0.004)***
Table 3, continued: Regression results measuring the impact of the payroll tax rate (employer portion) on the wages of Canadian workers (private sector only), 1998–2013

28 / The Effect of Corporate Income and Payroll Taxes on the Wages of Canadian Workers
fraserinstitute.org
Table 3: Regression results measuring the impact of the payroll tax rate (employer portion) on the wages of Canadian workers (private sector only), 1998–2013
Dependent variable = log of hourly wage Model 1 Model 2 Model 3 Model 4
British Columbia 0.048 0.004
(0.009)*** −0.01
Alberta 0.131 0.061
(0.010)*** (0.011)***
Saskatchewan 0.012 −0.056
−0.009 (0.010)***
Manitoba −0.035 −0.098
(0.005)*** (0.006)***
Newfoundland −0.104 0
(0.004)*** −0.006
Prince Edward Island −0.143 −0.103
(0.009)*** (0.009)***
Nova Scotia −0.102 −0.102
(0.008)*** (0.008)***
New Brunswick −0.134 −0.126
(0.009)*** (0.009)***
Year 2013 as reference
1998 −0.118 −0.088
(0.003)*** (0.003)***
1999 −0.109 −0.098
(0.003)*** (0.003)***
2000 −0.099 −0.092
(0.003)*** (0.003)***
2001 −0.089 −0.087
(0.003)*** (0.003)***
2002 −0.089 −0.082
(0.003)*** (0.003)***
2003 −0.092 −0.08
(0.003)*** (0.003)***
2004 −0.086 −0.071
(0.003)*** (0.003)***
2005 −0.083 −0.079
(0.003)*** (0.003)***
2006 −0.077 −0.077
(0.003)*** (0.003)***
2007 −0.064 −0.074
(0.003)*** (0.003)***
2008 −0.048 −0.062
(0.003)*** (0.003)***
Table 3, continued: Regression results measuring the impact of the payroll tax rate (employer portion) on the wages of Canadian workers (private sector only), 1998–2013

The Effect of Corporate Income and Payroll Taxes on the Wages of Canadian Workers / 29
fraserinstitute.org
Table 3: Regression results measuring the impact of the payroll tax rate (employer portion) on the wages of Canadian workers (private sector only), 1998–2013
Dependent variable = log of hourly wage Model 1 Model 2 Model 3 Model 4
2009 −0.025 −0.037
(0.003)*** (0.003)***
2010 −0.017 −0.012
(0.003)*** (0.003)***
2011 −0.025 −0.013
(0.003)*** (0.003)***
2012 −0.011 0.001
(0.003)*** −0.003
Inflation rate −1.271 −0.676
(0.055)*** (0.095)***
Unemployment rate −2.463 −1.581
(0.020)*** (0.066)***
Constant 2.091 2.217 2.528 2.288
(0.007)*** (0.043)*** (0.008)*** (0.044)***
R-squared 0.49 0.52 0.50 0.52
Observations 545,420 545,420 545,420 545,420
Notes: Robust standard errors in parentheses * significant at 10%; ** significant at 5%; *** significant at 1%. In table A-5 the authors include workers from both private- and public-sector workers to examine the spill-over effects from the imposition of the payroll tax rate (employer portion) in the private sector on wages in the public sector given labour mobility.
Sources: Statistics Canada (1999–2013); calculation by authors.
Table 3, continued: Regression results measuring the impact of the payroll tax rate (employer portion) on the wages of Canadian workers (private sector only), 1998–2013

30 / The Effect of Corporate Income and Payroll Taxes on the Wages of Canadian Workers
fraserinstitute.org
Table 4: Summary of regression results measuring the impact of a 1% increase in the corporate income tax rate on the wages of Canadian workers, 1998–2013
Dependent variable = log of hourly wage Model 1 Model 2 Model 3 Model 4
Overall Private −0.239 −0.148 −0.195 −0.18
Private & public −0.242 −0.13 −0.202 −0.156
By firm size Small −0.314 — — −0.219
Medium −0.214 — — −0.17
Large −0.18 — — −0.137
By union status Unionized −0.068 — — −0.037
Not unionized −0.294 — — −0.233
Notes: See table 2.
Sources: Table 2; table A-2; table A-3; table A-4.
Table 5: Summary of regression results measuring the impact of a 1% increase in the payroll tax rate (employer portion) on the wages of Canadian workers, 1998–2013
Dependent variable = log of hourly wage Model 1 Model 2 Model 3 Model 4
Overall Private −0.139 −0.102 −0.032 −0.139
Private & public −0.106 −0.079 −0.01 −0.097
By firm size Small −0.134 — — −0.082
Medium −0.166 — — −0.19
Large −0.08 — — −0.176
By union status Unionized −0.189 — — −0.229
Not unionized −0.143 — — −0.136
Note: See table 3.
Sources: Table 3; table A-5; table A-6; table A-7.

fraserinstitute.org / 31
Conclusion
The purpose of this study was to identify and measure the incidence of corpor-ate income and payroll taxes on the wages of Canadian workers. The Labour Force Survey (LFS) provided us with data on the characteristics of individual workers that are likely to affect wages. After controlling for those character-istics in our regressions, we find a negative and significant effect of the cor-porate income-tax rate and of the employer portion of the payroll tax rate on wages, which we define as the inflation-adjusted hourly wage rate of a worker.

32 / fraserinstitute.org

fraserinstitute.org / 33
Appendix
Table A-1a: Descriptive Statistics, Canada, 1998–2013 Variable Mean Standard
DeviationMin Max Number of
observations
Real hourly wage $23.1 $11.5 $2.2 $155.5 739,849
Corporate income tax rate (1997-2012) 35.5% 5.7% 25.0% 45.0% 739,849
Alberta 33.7% 6.2% 25.0% 43.5% 80,324
British Columbia 34.9% 6.5% 25.0% 44.5% 73,419
Manitoba 36.6% 6.3% 27.0% 45.0% 58,284
New Brunswick 36.6% 6.6% 25.0% 45.0% 40,203
Newfoundland 36.1% 4.3% 29.0% 42.0% 25,194
Nova Scotia 38.6% 4.3% 31.0% 44.0% 39,689
Ontario 36.3% 5.2% 26.5% 43.5% 222,376
Prince Edward Island 38.4% 4.2% 31.0% 44.0% 19,903
Québec 32.4% 3.3% 26.9% 37.1% 128,438
Saskatchewan 37.1% 6.4% 27.0% 45.0% 52,019
Payroll tax rate (1997-2012) 11.1% 1.8% 8.1% 14.3% 739,849
Alberta 8.9% 0.5% 8.1% 9.8% 80,324
British Columbia 9.2% 0.3% 8.8% 9.8% 73,419
Manitoba 11.1% 0.4% 9.9% 11.7% 58,284
New Brunswick 9.3% 0.4% 8.5% 9.9% 40,203
Newfoundland 12.4% 0.5% 11.9% 13.3% 25,194
Nova Scotia 10.0% 0.3% 9.5% 10.5% 39,689
Ontario 11.7% 0.2% 11.4% 12.0% 222,376
Prince Edward Island 9.6% 0.4% 9.0% 10.3% 19,903
Québec 14.0% 0.2% 13.6% 14.3% 128,438
Saskatchewan 9.2% 0.3% 8.7% 9.7% 52,019
Inflation rate 2.0% 0.9% -0.4% 5.0% 739,849
Unemployment rate 7.5% 2.5% 3.4% 18.6% 739,849
Note: Data on hourly wages is for both private and public sector workers.
Source: Statistics Canada (1999–2014), Labour Force Survey.

34 / The Effect of Corporate Income and Payroll Taxes on the Wages of Canadian Workers
fraserinstitute.org
Table A-1b: Summary Statistics, Canada, 1998–2013
Variable Frequency Percent of Total
Age group
Age 15 to 24 87,510 11.8%
Age 25 to 34 166,782 22.5%
Age 35 to 44 199,545 27.0%
Age 45 to 54 195,743 26.5%
Age 55 to 64 83,494 11.3%
Age 65 and over 6,775 0.9%
Education
No high school diploma as reference 93,303 12.6%
Secondary diploma 218,730 29.6%
Post secondary diploma 280,263 37.9%
Bachelors degree 103,948 14.1%
Graduate degree 43,605 5.9%
Married 508,851 68.8%
Male 413,460 55.9%
Union member 255,767 34.6%
Firm Size (number of employees)
Up to 99 266,563 36.0%
100 to 500 112,903 15.3%
More than 500 360,383 48.7%
Industry
Agriculture 9,472 1.3%
Forestry, Fishing, Mining, Oil and Gas 24,900 3.4%
Utilities 9,642 1.3%
Construction 48,166 6.5%
Manufacturing - durables 65,583 8.9%
Manufacturing - non-durables 52,869 7.2%
Wholesale trade 28,849 3.9%
Retail trade 76,833 10.4%
Transportation & Warehousing 38,628 5.2%
Finance, Insurance, Real Estate and Lea 40,362 5.5%
Professional, Scientific and Technical 33,774 4.6%

The Effect of Corporate Income and Payroll Taxes on the Wages of Canadian Workers / 35
fraserinstitute.org
Table A-1b: Summary Statistics, Canada, 1998–2013
Variable Frequency Percent of Total
Management, Administrative and Other Su 24,149 3.3%
Educational Services 53,581 7.2%
Health Care and Social Assistance 84,063 11.4%
Information, Culture and Recreation 27,992 3.8%
Accommodation and Food Services 37,422 5.1%
Other Services 26,779 3.6%
Public Administration 56,785 7.7%
Occupation
Senior Management occupations 3,967 0.5%
Other Management occupations 53,589 7.2%
Professional occupations in Business and Finance 18,519 2.5%
Financial, Secretarial, and Administrative occupations 40,145 5.4%
Clerical occupations 81,321 11.0%
Natural and Applied Sciences and related occupations 54,785 7.4%
Professionals in Health/Nurse supervisors/Registered Nurses 18,937 2.6%
Technical, Assisting and related occupations in Health 25,466 3.4%
Occupations in Social Science, Government and Religion 30,679 4.2%
Teachers & Professors 30,918 4.2%
Occupations in Art, Culture, Recreation and Sport 12,523 1.7%
Wholesale/Technical/Insurance/Real Estate/Buyers 19,731 2.7%
Retail sales person/Sales clerk/Cashier/retail supervisor 37,433 5.1%
Chefs/Cooks/Food and Beverage Service/Supervisors 21,674 2.9%
Occupations in Protective Services 13,198 1.8%
Childcare and Home Support workers 7,103 1.0%
Sales and Service not elsewhere classified 52,022 7.0%
Contractors/Supervisors in trade and transportation 8,919 1.2%
Construction Trades 17,542 2.4%
Other Trades occupations 55,364 7.5%
Transport and Equipment operators 34,104 4.6%
Trades Helper/Construction/transportation labourer/related 19,637 2.7%
Occupations unique to Primary Industry 23,158 3.1%
Machine Operator/Assembler in manufacturing/Supervisors 47,690 6.5%
Labourer in Processing, Manufacturing and Utilities 11,425 1.5%
Note: Data on workers is for both private- and public-sector workers.
Source: Statistics Canada (1999–2014), Labour Force Survey.
Table A-1b, continued: Summary Statistics, Canada, 1998–2013

36 / The Effect of Corporate Income and Payroll Taxes on the Wages of Canadian Workers
fraserinstitute.org
Table A-2: Regression results measuring the impact of the corporate income tax rate on the wages of Canadian workers (private- and public-sectors), 1998–2013
Dependent variable = log of hourly wage Model 1 Model 2 Model 3 Model 4
Log corporate income tax rate −0.242 −0.13 −0.202 −0.156
(0.003)*** (0.010)*** (0.002)*** (0.010)***
Age 15-24 as reference
Age 25-34 0.209 0.207 0.209 0.207
(0.001)*** (0.001)*** (0.001)*** (0.001)***
Age 35-44 0.296 0.296 0.298 0.296
(0.001)*** (0.001)*** (0.001)*** (0.001)***
Age 45-54 0.333 0.333 0.335 0.333
(0.001)*** (0.001)*** (0.001)*** (0.001)***
Age 55-64 0.314 0.311 0.315 0.311
(0.002)*** (0.002)*** (0.002)*** (0.002)***
Age 65 and more 0.167 0.156 0.163 0.156
(0.005)*** (0.005)*** (0.005)*** (0.005)***
Women as reference
Men 0.148 0.15 0.148 0.15
(0.001)*** (0.001)*** (0.001)*** (0.001)***
Unmarried as reference
Married 0.038 0.044 0.044 0.044
(0.001)*** (0.001)*** (0.001)*** (0.001)***
No high school diploma as reference
Secondary diploma 0.09 0.075 0.083 0.075
(0.001)*** (0.001)*** (0.001)*** (0.001)***
Post secondary diploma 0.126 0.121 0.127 0.121
(0.001)*** (0.001)*** (0.001)*** (0.001)***
Bachelors degree 0.217 0.205 0.213 0.205
(0.002)*** (0.002)*** (0.002)*** (0.002)***
Graduate degree 0.28 0.265 0.278 0.265
(0.002)*** (0.002)*** (0.002)*** (0.002)***
Manufacturing durables as reference
Agriculture −0.234 −0.222 −0.234 −0.222
(0.005)*** (0.005)*** (0.005)*** (0.005)***
Forestry, Fishing, Mining, Oil and Gas 0.146 0.133 0.139 0.134
(0.003)*** (0.003)*** (0.003)*** (0.003)***
Utilities 0.104 0.11 0.105 0.111
(0.004)*** (0.003)*** (0.004)*** (0.003)***
Construction 0.028 0.027 0.028 0.027
(0.002)*** (0.002)*** (0.002)*** (0.002)***
Manufacturing—non-durables −0.073 −0.053 −0.062 −0.052
(0.002)*** (0.002)*** (0.002)*** (0.002)***

The Effect of Corporate Income and Payroll Taxes on the Wages of Canadian Workers / 37
fraserinstitute.org
Table A-2: Regression results measuring the impact of the corporate income tax rate on the wages of Canadian workers (private- and public-sectors), 1998–2013
Dependent variable = log of hourly wage Model 1 Model 2 Model 3 Model 4
Wholesale trade −0.076 −0.072 −0.076 −0.072
(0.003)*** (0.003)*** (0.003)*** (0.003)***
Retail trade −0.227 −0.212 −0.221 −0.212
(0.002)*** (0.002)*** (0.002)*** (0.002)***
Transportation & Warehousing −0.058 −0.053 −0.058 −0.053
(0.002)*** (0.002)*** (0.002)*** (0.002)***
Finance, Insurance, Real Estate and Leasing −0.046 −0.04 −0.045 −0.04
(0.002)*** (0.002)*** (0.002)*** (0.002)***
Professional, Scientific and Technical Services 0.009 0.01 0.01 0.01
(0.003)*** (0.003)*** (0.003)*** (0.003)***
Management, Administrative and Other Support −0.221 −0.207 −0.213 −0.207
(0.003)*** (0.003)*** (0.003)*** (0.003)***
Educational Services −0.055 −0.049 −0.053 −0.049
(0.003)*** (0.003)*** (0.003)*** (0.003)***
Health Care and Social Assistance −0.114 −0.101 −0.108 −0.1
(0.002)*** (0.002)*** (0.002)*** (0.002)***
Information, Culture and Recreation −0.077 −0.07 −0.074 −0.07
(0.003)*** (0.003)*** (0.003)*** (0.003)***
Accommodation and Food Services −0.303 −0.295 −0.298 −0.294
(0.003)*** (0.003)*** (0.003)*** (0.003)***
Other Services −0.149 −0.141 −0.145 −0.141
(0.003)*** (0.003)*** (0.003)*** (0.003)***
Public Administration 0.017 0.035 0.027 0.035
(0.002)*** (0.002)*** (0.002)*** (0.002)***
Clerical occupations as reference
Senior Management occupations 0.553 0.549 0.551 0.548
(0.008)*** (0.008)*** (0.008)*** (0.008)***
Other Management occupations 0.41 0.407 0.409 0.407
(0.002)*** (0.002)*** (0.002)*** (0.002)***
Professional occupations in Business and Finance 0.321 0.32 0.321 0.32
(0.003)*** (0.003)*** (0.003)*** (0.003)***
Financial, Secretarial, and Administrative occupations 0.094 0.096 0.096 0.096
(0.002)*** (0.002)*** (0.002)*** (0.002)***
Natural and Applied Sciences and related occupations 0.262 0.261 0.262 0.261
(0.002)*** (0.002)*** (0.002)*** (0.002)***
Professionals in Health/Nurse supervisors/Registered Nurses 0.444 0.442 0.445 0.442
(0.003)*** (0.003)*** (0.003)*** (0.003)***
Technical, Assisting and related occupations in Health 0.13 0.127 0.127 0.127
(0.003)*** (0.003)*** (0.003)*** (0.003)***
Table A-2, continued: Regression results measuring the impact of the corporate income tax rate on the wages of Canadian workers (private- and public-sectors), 1998–2013

38 / The Effect of Corporate Income and Payroll Taxes on the Wages of Canadian Workers
fraserinstitute.org
Table A-2: Regression results measuring the impact of the corporate income tax rate on the wages of Canadian workers (private- and public-sectors), 1998–2013
Dependent variable = log of hourly wage Model 1 Model 2 Model 3 Model 4
Occupations in Social Science, Government and Religion 0.194 0.192 0.193 0.192
(0.003)*** (0.003)*** (0.003)*** (0.003)***
Teachers & Professors 0.261 0.265 0.264 0.265
(0.003)*** (0.003)*** (0.003)*** (0.003)***
Occupations in Art, Culture, Recreation and Sport 0.133 0.134 0.135 0.134
(0.004)*** (0.004)*** (0.004)*** (0.004)***
Wholesale/Technical/Insurance/Real Estate/Buyers 0.135 0.132 0.133 0.132
(0.003)*** (0.003)*** (0.003)*** (0.003)***
Retail sales person/Sales clerk/Cashier/retail supervisor −0.071 −0.07 −0.068 −0.069
(0.002)*** (0.002)*** (0.002)*** (0.002)***
Chefs/Cooks/Food and Beverage Service/Supervisors −0.036 −0.035 −0.036 −0.035
(0.003)*** (0.003)*** (0.003)*** (0.003)***
Occupations in Protective Services 0.042 0.031 0.036 0.031
(0.004)*** (0.004)*** (0.004)*** (0.004)***
Childcare and Home Support workers −0.175 −0.177 −0.173 −0.177
(0.004)*** (0.004)*** (0.004)*** (0.004)***
Sales and Service not elsewhere classified −0.131 −0.132 −0.129 −0.131
(0.002)*** (0.002)*** (0.002)*** (0.002)***
Contractors/Supervisors in trade and transportation 0.218 0.21 0.212 0.21
(0.004)*** (0.004)*** (0.004)*** (0.004)***
Construction Trades 0.067 0.069 0.069 0.068
(0.003)*** (0.003)*** (0.003)*** (0.003)***
Other Trades occupations 0.125 0.119 0.122 0.119
(0.002)*** (0.002)*** (0.002)*** (0.002)***
Transport and Equipment operators −0.007 −0.007 −0.005 −0.007
(0.002)*** (0.002)*** (0.002)** (0.002)***
Trades Helper/Construction/transportation labourer/related −0.069 −0.071 −0.067 −0.071
(0.003)*** (0.003)*** (0.003)*** (0.003)***
Occupations unique to Primary Industry −0.017 −0.009 −0.011 −0.009
(0.004)*** (0.003)** (0.004)*** (0.003)**
Machine Operator/Assembler in manufacturing/Supervisors −0.044 −0.048 −0.045 −0.048
(0.002)*** (0.002)*** (0.002)*** (0.002)***
Labourer in Processing, Manufacturing and Utilities −0.15 −0.147 −0.146 −0.147
(0.003)*** (0.003)*** (0.003)*** (0.003)***
Small-size firm as reference
Medium-size firm 0.086 0.079 0.082 0.079
(0.001)*** (0.001)*** (0.001)*** (0.001)***
Large-size firm 0.141 0.132 0.137 0.132
(0.001)*** (0.001)*** (0.001)*** (0.001)***
Table A-2, continued: Regression results measuring the impact of the corporate income tax rate on the wages of Canadian workers (private- and public-sectors), 1998–2013

The Effect of Corporate Income and Payroll Taxes on the Wages of Canadian Workers / 39
fraserinstitute.org
Table A-2: Regression results measuring the impact of the corporate income tax rate on the wages of Canadian workers (private- and public-sectors), 1998–2013
Dependent variable = log of hourly wage Model 1 Model 2 Model 3 Model 4
Non union as reference
Union 0.107 0.12 0.111 0.12
(0.001)*** (0.001)*** (0.001)*** (0.001)***
Québec as reference
Ontario 0.111 0.096
(0.002)*** (0.002)***
British Columbia 0.094 0.073
(0.002)*** (0.002)***
Alberta 0.167 0.127
(0.002)*** (0.003)***
Saskatchewan 0.064 0.026
(0.002)*** (0.003)***
Manitoba 0.005 −0.036
(0.002)** (0.003)***
Newfoundland −0.071 0.019
(0.003)*** (0.005)***
Prince Edward Island −0.06 −0.011
(0.003)*** (0.004)***
Nova Scotia −0.04 −0.026
(0.003)*** (0.003)***
New Brunswick −0.076 −0.055
(0.002)*** (0.002)***
Year 2013 as reference
1998 −0.055 −0.018
(0.005)*** (0.005)***
1999 −0.047 −0.026
(0.005)*** (0.005)***
2000 −0.037 −0.017
(0.005)*** (0.005)***
2001 −0.031 −0.012
(0.005)*** (0.005)**
2002 −0.034 −0.014
(0.005)*** (0.005)***
2003 −0.048 −0.027
(0.004)*** (0.004)***
2004 −0.049 −0.027
(0.004)*** (0.004)***
2005 −0.052 −0.043
(0.003)*** (0.003)***
Table A-2, continued: Regression results measuring the impact of the corporate income tax rate on the wages of Canadian workers (private- and public-sectors), 1998–2013

40 / The Effect of Corporate Income and Payroll Taxes on the Wages of Canadian Workers
fraserinstitute.org
Table A-2: Regression results measuring the impact of the corporate income tax rate on the wages of Canadian workers (private- and public-sectors), 1998–2013
Dependent variable = log of hourly wage Model 1 Model 2 Model 3 Model 4
2006 −0.046 −0.039
(0.003)*** (0.003)***
2007 −0.033 −0.034
(0.003)*** (0.003)***
2008 −0.016 −0.02
(0.003)*** (0.003)***
2009 0.003 0.001
−0.003 −0.003
2010 0.01 0.015
(0.003)*** (0.003)***
2011 −0.004 0.009
(0.002)* (0.003)***
2012 −0.003 0.013
−0.002 (0.003)***
Inflation rate −1.073 −0.822
(0.046)*** (0.081)***
Unemployment rate −2.105 −1.28
(0.016)*** (0.056)***
Constant 2.155 2.242 2.37 2.325
(0.004)*** (0.014)*** (0.004)*** (0.015)***
R-squared 0.50 0.52 0.51 0.52
Observations 739,849 739,849 739,849 739,849
Note: See table 2.
Source1: Statistics Canada (1999–2013); calculation by authors.
Table A-2, continued: Regression results measuring the impact of the corporate income tax rate on the wages of Canadian workers (private- and public-sectors), 1998–2013
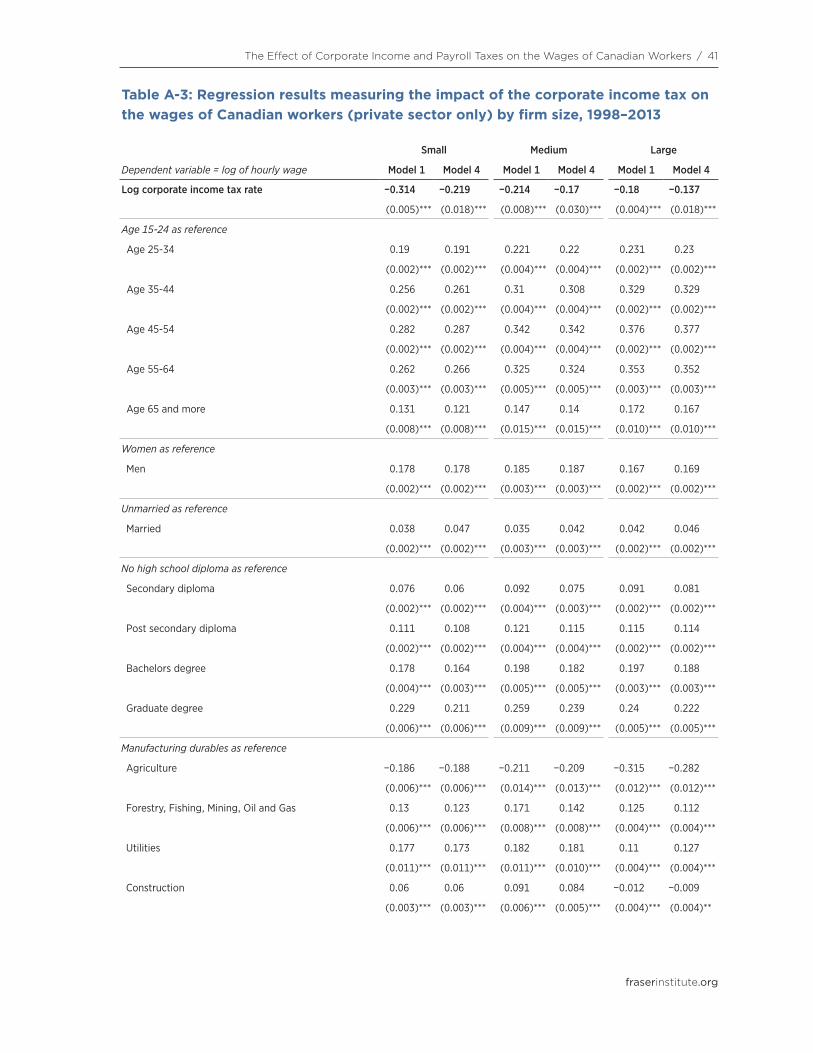
The Effect of Corporate Income and Payroll Taxes on the Wages of Canadian Workers / 41
fraserinstitute.org
Table A-3: Regression results measuring the impact of the corporate income tax on the wages of Canadian workers (private sector only) by firm size, 1998–2013
Small Medium Large
Dependent variable = log of hourly wage Model 1 Model 4 Model 1 Model 4 Model 1 Model 4
Log corporate income tax rate −0.314 −0.219 −0.214 −0.17 −0.18 −0.137
(0.005)*** (0.018)*** (0.008)*** (0.030)*** (0.004)*** (0.018)***
Age 15-24 as reference
Age 25-34 0.19 0.191 0.221 0.22 0.231 0.23
(0.002)*** (0.002)*** (0.004)*** (0.004)*** (0.002)*** (0.002)***
Age 35-44 0.256 0.261 0.31 0.308 0.329 0.329
(0.002)*** (0.002)*** (0.004)*** (0.004)*** (0.002)*** (0.002)***
Age 45-54 0.282 0.287 0.342 0.342 0.376 0.377
(0.002)*** (0.002)*** (0.004)*** (0.004)*** (0.002)*** (0.002)***
Age 55-64 0.262 0.266 0.325 0.324 0.353 0.352
(0.003)*** (0.003)*** (0.005)*** (0.005)*** (0.003)*** (0.003)***
Age 65 and more 0.131 0.121 0.147 0.14 0.172 0.167
(0.008)*** (0.008)*** (0.015)*** (0.015)*** (0.010)*** (0.010)***
Women as reference
Men 0.178 0.178 0.185 0.187 0.167 0.169
(0.002)*** (0.002)*** (0.003)*** (0.003)*** (0.002)*** (0.002)***
Unmarried as reference
Married 0.038 0.047 0.035 0.042 0.042 0.046
(0.002)*** (0.002)*** (0.003)*** (0.003)*** (0.002)*** (0.002)***
No high school diploma as reference
Secondary diploma 0.076 0.06 0.092 0.075 0.091 0.081
(0.002)*** (0.002)*** (0.004)*** (0.003)*** (0.002)*** (0.002)***
Post secondary diploma 0.111 0.108 0.121 0.115 0.115 0.114
(0.002)*** (0.002)*** (0.004)*** (0.004)*** (0.002)*** (0.002)***
Bachelors degree 0.178 0.164 0.198 0.182 0.197 0.188
(0.004)*** (0.003)*** (0.005)*** (0.005)*** (0.003)*** (0.003)***
Graduate degree 0.229 0.211 0.259 0.239 0.24 0.222
(0.006)*** (0.006)*** (0.009)*** (0.009)*** (0.005)*** (0.005)***
Manufacturing durables as reference
Agriculture −0.186 −0.188 −0.211 −0.209 −0.315 −0.282
(0.006)*** (0.006)*** (0.014)*** (0.013)*** (0.012)*** (0.012)***
Forestry, Fishing, Mining, Oil and Gas 0.13 0.123 0.171 0.142 0.125 0.112
(0.006)*** (0.006)*** (0.008)*** (0.008)*** (0.004)*** (0.004)***
Utilities 0.177 0.173 0.182 0.181 0.11 0.127
(0.011)*** (0.011)*** (0.011)*** (0.010)*** (0.004)*** (0.004)***
Construction 0.06 0.06 0.091 0.084 −0.012 −0.009
(0.003)*** (0.003)*** (0.006)*** (0.005)*** (0.004)*** (0.004)**

42 / The Effect of Corporate Income and Payroll Taxes on the Wages of Canadian Workers
fraserinstitute.org
Table A-3: Regression results measuring the impact of the corporate income tax on the wages of Canadian workers (private sector only) by firm size, 1998–2013
Small Medium Large
Dependent variable = log of hourly wage Model 1 Model 4 Model 1 Model 4 Model 1 Model 4
Manufacturing—non-durables −0.075 −0.064 −0.049 −0.027 −0.071 −0.046
(0.003)*** (0.003)*** (0.004)*** (0.004)*** (0.003)*** (0.003)***
Wholesale trade −0.056 −0.055 −0.046 −0.049 −0.116 −0.109
(0.004)*** (0.004)*** (0.006)*** (0.006)*** (0.004)*** (0.004)***
Retail trade −0.159 −0.143 −0.18 −0.167 −0.31 −0.296
(0.004)*** (0.003)*** (0.006)*** (0.006)*** (0.003)*** (0.003)***
Transportation & Warehousing −0.044 −0.043 −0.029 −0.028 −0.053 −0.041
(0.004)*** (0.004)*** (0.006)*** (0.006)*** (0.003)*** (0.003)***
Finance, Insurance, Real Estate and Leasing 0 0.003 −0.012 −0.009 −0.09 −0.084
−0.005 −0.005 (0.006)* −0.006 (0.003)*** (0.003)***
Professional, Scientific and Technical Services 0.041 0.04 0.056 0.051 −0.042 −0.039
(0.004)*** (0.004)*** (0.007)*** (0.007)*** (0.004)*** (0.004)***
Management, Administrative and Other Support −0.09 −0.092 −0.158 −0.148 −0.314 −0.286
(0.005)*** (0.004)*** (0.007)*** (0.007)*** (0.004)*** (0.004)***
Information, Culture and Recreation −0.099 −0.093 −0.01 −0.008 −0.052 −0.04
(0.005)*** (0.005)*** −0.007 −0.007 (0.004)*** (0.004)***
Accommodation and Food Services −0.231 −0.222 −0.232 −0.231 −0.399 −0.39
(0.005)*** (0.005)*** (0.008)*** (0.008)*** (0.005)*** (0.005)***
Other Services −0.094 −0.088 −0.083 −0.085 −0.268 −0.259
(0.004)*** (0.004)*** (0.008)*** (0.008)*** (0.007)*** (0.006)***
Clerical occupation as reference
Senior Management occupations 0.631 0.625 0.593 0.591 0.56 0.549
(0.015)*** (0.014)*** (0.021)*** (0.021)*** (0.016)*** (0.016)***
Other Management occupations 0.344 0.34 0.411 0.408 0.416 0.408
(0.004)*** (0.004)*** (0.006)*** (0.006)*** (0.003)*** (0.003)***
Professional occupations in Business and Finance 0.319 0.32 0.344 0.342 0.337 0.332
(0.007)*** (0.007)*** (0.009)*** (0.009)*** (0.005)*** (0.005)***
Financial, Secretarial, and Administrative occupations 0.082 0.084 0.129 0.129 0.13 0.125
(0.004)*** (0.004)*** (0.007)*** (0.007)*** (0.004)*** (0.004)***
Natural and Applied Sciences and related occupations 0.23 0.229 0.25 0.251 0.295 0.292
(0.005)*** (0.004)*** (0.006)*** (0.006)*** (0.003)*** (0.003)***
Professionals in Health/Nurse supervisors/Registered Nurses 0.605 0.623 0.574 0.582 0.727 0.727
(0.020)*** (0.020)*** (0.036)*** (0.037)*** (0.015)*** (0.015)***
Technical, Assisting and related occupations in Health 0.088 0.085 0.128 0.141 0.142 0.145
(0.009)*** (0.008)*** (0.019)*** (0.019)*** (0.011)*** (0.011)***
Occupations in Social Science, Government and Religion 0.169 0.169 0.229 0.233 0.271 0.27
(0.007)*** (0.007)*** (0.014)*** (0.014)*** (0.009)*** (0.009)***
Table A-3, continued: Regression results measuring the impact of the corporate income tax on the wages of Canadian workers (private sector only) by firm size, 1998–2013

The Effect of Corporate Income and Payroll Taxes on the Wages of Canadian Workers / 43
fraserinstitute.org
Table A-3: Regression results measuring the impact of the corporate income tax on the wages of Canadian workers (private sector only) by firm size, 1998–2013
Small Medium Large
Dependent variable = log of hourly wage Model 1 Model 4 Model 1 Model 4 Model 1 Model 4
Teachers & Professors 0.228 0.241 0.223 0.208 0.301 0.303
(0.036)*** (0.035)*** (0.035)*** (0.036)*** (0.015)*** (0.014)***
Occupations in Art, Culture, Recreation and Sport 0.11 0.118 0.158 0.161 0.184 0.179
(0.006)*** (0.006)*** (0.010)*** (0.010)*** (0.007)*** (0.007)***
Wholesale/Technical/Insurance/Real Estate/Buyers 0.138 0.133 0.145 0.144 0.106 0.102
(0.005)*** (0.005)*** (0.008)*** (0.008)*** (0.005)*** (0.005)***
Retail sales person/Sales clerk/Cashier/retail supervisor −0.075 −0.073 −0.06 −0.058 −0.055 −0.056
(0.004)*** (0.004)*** (0.007)*** (0.007)*** (0.004)*** (0.004)***
Chefs/Cooks/Food and Beverage Service/Supervisors −0.057 −0.054 −0.06 −0.059 −0.018 −0.022
(0.005)*** (0.005)*** (0.010)*** (0.010)*** (0.005)*** (0.005)***
Occupations in Protective Services −0.173 −0.166 −0.187 −0.182 −0.076 −0.088
(0.012)*** (0.012)*** (0.013)*** (0.013)*** (0.007)*** (0.007)***
Childcare and Home Support workers −0.338 −0.341 −0.088 −0.061 −0.102 −0.107
(0.010)*** (0.010)*** −0.067 −0.069 (0.041)** (0.039)***
Sales and Service not elsewhere classified −0.149 −0.146 −0.14 −0.14 −0.095 −0.099
(0.004)*** (0.004)*** (0.006)*** (0.006)*** (0.003)*** (0.003)***
Contractors/Supervisors in trade and transportation 0.223 0.214 0.199 0.188 0.218 0.212
(0.006)*** (0.006)*** (0.010)*** (0.009)*** (0.006)*** (0.006)***
Construction Trades 0.051 0.057 0.074 0.076 0.128 0.123
(0.004)*** (0.004)*** (0.009)*** (0.009)*** (0.006)*** (0.006)***
Other Trades occupations 0.11 0.106 0.124 0.122 0.155 0.148
(0.004)*** (0.003)*** (0.005)*** (0.005)*** (0.003)*** (0.003)***
Transport and Equipment operators −0.006 −0.001 −0.031 −0.026 0.01 0.005
−0.004 −0.004 (0.006)*** (0.006)*** (0.004)*** −0.004
Trades Helper/Construction/transportation labourer/related −0.093 −0.089 −0.082 −0.078 −0.037 −0.039
(0.004)*** (0.004)*** (0.007)*** (0.007)*** (0.004)*** (0.004)***
Occupations unique to Primary Industry −0.075 −0.053 −0.014 0.001 0.064 0.065
(0.006)*** (0.005)*** −0.011 −0.01 (0.006)*** (0.006)***
Machine Operator/Assembler in manufacturing/Supervisors −0.076 −0.072 −0.066 −0.063 0.012 0.006
(0.004)*** (0.004)*** (0.005)*** (0.005)*** (0.003)*** (0.003)*
Labourer in Processing, Manufacturing and Utilities −0.161 −0.152 −0.157 −0.149 −0.1 −0.098
(0.006)*** (0.006)*** (0.007)*** (0.007)*** (0.005)*** (0.005)***
Quebec as reference
Ontario 0.079 0.096 0.065
(0.003)*** (0.005)*** (0.003)***
British Columbia 0.08 0.101 0.05
(0.003)*** (0.006)*** (0.004)***
Table A-3, continued: Regression results measuring the impact of the corporate income tax on the wages of Canadian workers (private sector only) by firm size, 1998–2013

44 / The Effect of Corporate Income and Payroll Taxes on the Wages of Canadian Workers
fraserinstitute.org
Table A-3: Regression results measuring the impact of the corporate income tax on the wages of Canadian workers (private sector only) by firm size, 1998–2013
Small Medium Large
Dependent variable = log of hourly wage Model 1 Model 4 Model 1 Model 4 Model 1 Model 4
Alberta 0.123 0.144 0.094
(0.005)*** (0.008)*** (0.005)***
Saskatchewan 0.014 0.052 0.007
(0.005)*** (0.008)*** −0.005
Manitoba −0.036 −0.043 −0.074
(0.005)*** (0.008)*** (0.005)***
Newfoundland 0.014 0.074 0.027
−0.009 (0.015)*** (0.009)***
Prince Edward Island 0.005 −0.052 −0.084
−0.006 (0.012)*** (0.007)***
Nova Scotia −0.043 −0.015 −0.046
(0.005)*** (0.008)* (0.005)***
New Brunswick −0.056 −0.044 −0.088
(0.004)*** (0.007)*** (0.004)***
Year 2013 as reference
1998 −0.011 0.004 0.011
−0.01 −0.017 −0.01
1999 −0.019 −0.009 0.002
(0.010)** −0.016 −0.01
2000 −0.009 0.007 0.006
−0.009 −0.016 −0.01
2001 −0.004 0.007 0.005
−0.009 −0.016 −0.01
2002 −0.01 0.001 0.006
−0.009 −0.015 −0.009
2003 −0.021 −0.011 −0.012
(0.008)*** −0.013 −0.008
2004 −0.032 −0.021 −0.013
(0.007)*** (0.012)* (0.007)*
2005 −0.046 −0.029 −0.036
(0.006)*** (0.010)*** (0.006)***
2006 −0.042 −0.026 −0.035
(0.006)*** (0.010)*** (0.006)***
2007 −0.04 −0.022 −0.03
(0.006)*** (0.010)** (0.006)***
2008 −0.021 −0.016 −0.017
(0.006)*** −0.01 (0.006)***
Table A-3, continued: Regression results measuring the impact of the corporate income tax on the wages of Canadian workers (private sector only) by firm size, 1998–2013

The Effect of Corporate Income and Payroll Taxes on the Wages of Canadian Workers / 45
fraserinstitute.org
Table A-3: Regression results measuring the impact of the corporate income tax on the wages of Canadian workers (private sector only) by firm size, 1998–2013
Small Medium Large
Dependent variable = log of hourly wage Model 1 Model 4 Model 1 Model 4 Model 1 Model 4
2009 −0.004 0.003 0.001
−0.005 −0.009 −0.005
2010 0.027 0.015 0.014
(0.005)*** −0.009 (0.005)***
2011 0.014 0.017 0.008
(0.005)*** (0.008)** (0.005)*
2012 0.01 0.017 0.013
(0.005)** (0.008)** (0.005)***
Inflation rate −0.651 −0.605 −0.887
(0.146)*** (0.246)** (0.141)***
Unemployment rate −1.755 −1.484 −1.361
(0.103)*** (0.176)*** (0.102)***
Constant 2.102 2.314 2.229 2.349 2.371 2.511
(0.006)*** (0.026)*** (0.010)*** (0.044)*** (0.006)*** (0.027)***
R-squared 0.41 0.44 0.45 0.48 0.51 0.53
Observations 224,393 224,393 81,618 81,618 239,409 239,409
Note: See table 2.
Sources: Statistics Canada (1999-2013); calculation by authors.
Table A-3, continued: Regression results measuring the impact of the corporate income tax on the wages of Canadian workers (private sector only) by firm size, 1998–2013

46 / The Effect of Corporate Income and Payroll Taxes on the Wages of Canadian Workers
fraserinstitute.org
Table A-4: Regression results measuring the impact of the corporate income tax on the wages of Canadian workers (private sector only) by union status, 1998–2013
Unionized Not unionized
Dependent variable = log of hourly wage Model 1 Model 4 Model 1 Model 4
Log corporate income tax rate −0.068 −0.037 −0.294 −0.233
(0.006)*** (0.022)* (0.003)*** (0.014)***
Age 15-24 as reference
Age 25-34 0.264 0.26 0.192 0.192
(0.004)*** (0.004)*** (0.002)*** (0.002)***
Age 35-44 0.336 0.331 0.276 0.278
(0.004)*** (0.004)*** (0.002)*** (0.002)***
Age 45-54 0.378 0.373 0.309 0.311
(0.004)*** (0.004)*** (0.002)*** (0.002)***
Age 55-64 0.367 0.356 0.279 0.279
(0.004)*** (0.004)*** (0.002)*** (0.002)***
Age 65 and more 0.192 0.178 0.127 0.119
(0.014)*** (0.014)*** (0.007)*** (0.006)***
Women as reference
Men 0.16 0.164 0.175 0.175
(0.003)*** (0.002)*** (0.001)*** (0.001)***
Non married as reference
Married 0.021 0.027 0.045 0.053
(0.002)*** (0.002)*** (0.001)*** (0.001)***
No high school diploma
Secondary diploma 0.093 0.071 0.097 0.081
(0.003)*** (0.002)*** (0.002)*** (0.002)***
Post secondary diploma 0.11 0.102 0.131 0.127
(0.003)*** (0.003)*** (0.002)*** (0.002)***
Bachelors degree 0.136 0.115 0.227 0.214
(0.005)*** (0.004)*** (0.002)*** (0.002)***
Graduate degree 0.187 0.158 0.279 0.26
(0.008)*** (0.008)*** (0.004)*** (0.004)***
Manufacturing durables as reference
Agriculture −0.223 −0.199 −0.259 −0.252
(0.016)*** (0.016)*** (0.006)*** (0.005)***
Forestry, Fishing, Mining, Oil and Gas 0.111 0.111 0.184 0.153
(0.005)*** (0.005)*** (0.004)*** (0.004)***
Utilities 0.132 0.14 0.175 0.175
(0.004)*** (0.004)*** (0.008)*** (0.008)***
Construction 0.053 0.055 −0.029 −0.029
(0.004)*** (0.004)*** (0.003)*** (0.003)***

The Effect of Corporate Income and Payroll Taxes on the Wages of Canadian Workers / 47
fraserinstitute.org
Table A-4: Regression results measuring the impact of the corporate income tax on the wages of Canadian workers (private sector only) by union status, 1998–2013
Unionized Not unionized
Dependent variable = log of hourly wage Model 1 Model 4 Model 1 Model 4
Manufacturing—non-durables −0.086 −0.059 −0.056 −0.036
(0.003)*** (0.003)*** (0.003)*** (0.002)***
Wholesale trade −0.11 −0.107 −0.084 −0.081
(0.006)*** (0.006)*** (0.003)*** (0.003)***
Retail trade −0.194 −0.184 −0.232 −0.216
(0.005)*** (0.005)*** (0.003)*** (0.003)***
Transportation & Warehousing −0.013 −0.007 −0.074 −0.07
(0.004)*** (0.004)* (0.003)*** (0.003)***
Finance, Insurance, Real Estate and Leasing −0.05 −0.034 −0.021 −0.019
(0.006)*** (0.006)*** (0.003)*** (0.003)***
Professional, Scientific and Technical Services −0.007 −0.011 −0.026 −0.023
−0.008 −0.008 (0.003)*** (0.003)***
Management, Administrative and Other Support −0.196 −0.191 −0.197 −0.184
(0.007)*** (0.007)*** (0.003)*** (0.003)***
Information, Culture and Recreation 0 0.013 −0.096 −0.09
−0.004 (0.004)*** (0.004)*** (0.003)***
Accommodation and Food Services −0.251 −0.245 −0.305 −0.298
(0.008)*** (0.008)*** (0.003)*** (0.003)***
Other Services −0.078 −0.072 −0.191 −0.181
(0.007)*** (0.007)*** (0.003)*** (0.003)***
Clerical occupation as reference
Senior Management occupations 0.415 0.414 0.61 0.604
(0.037)*** (0.037)*** (0.010)*** (0.010)***
Other Management occupations 0.296 0.293 0.413 0.409
(0.007)*** (0.007)*** (0.003)*** (0.003)***
Professional occupations in Business and Finance 0.313 0.32 0.345 0.343
(0.009)*** (0.009)*** (0.004)*** (0.004)***
Financial, Secretarial, and Administrative occupations 0.101 0.106 0.099 0.1
(0.007)*** (0.007)*** (0.003)*** (0.003)***
Natural and Applied Sciences and related occupations 0.227 0.231 0.302 0.299
(0.005)*** (0.005)*** (0.003)*** (0.003)***
Professionals in Health/Nurse supervisors/Registered Nurses 0.507 0.489 0.676 0.686
(0.028)*** (0.028)*** (0.013)*** (0.013)***
Technical, Assisting and related occupations in Health 0.09 0.088 0.096 0.098
(0.017)*** (0.016)*** (0.007)*** (0.007)***
Occupations in Social Science, Government and Religion 0.251 0.266 0.21 0.208
(0.013)*** (0.013)*** (0.006)*** (0.006)***
Table A-4, continued: Regression results measuring the impact of the corporate income tax on the wages of Canadian workers (private sector only) by union status, 1998–2013

48 / The Effect of Corporate Income and Payroll Taxes on the Wages of Canadian Workers
fraserinstitute.org
Table A-4: Regression results measuring the impact of the corporate income tax on the wages of Canadian workers (private sector only) by union status, 1998–2013
Unionized Not unionized
Dependent variable = log of hourly wage Model 1 Model 4 Model 1 Model 4
Teachers & Professors 0.256 0.267 0.315 0.316
(0.023)*** (0.022)*** (0.016)*** (0.015)***
Occupations in Art, Culture, Recreation and Sport 0.139 0.137 0.11 0.114
(0.008)*** (0.008)*** (0.005)*** (0.005)***
Wholesale/Technical/Insurance/Real Estate/Buyers 0.038 0.044 0.136 0.133
(0.010)*** (0.010)*** (0.004)*** (0.003)***
Retail sales person/Sales clerk/Cashier/retail supervisor −0.064 −0.066 −0.068 −0.067
(0.007)*** (0.006)*** (0.003)*** (0.003)***
Chefs/Cooks/Food and Beverage Service/Supervisors −0.1 −0.099 −0.048 −0.046
(0.010)*** (0.010)*** (0.004)*** (0.004)***
Occupations in Protective Services −0.155 −0.148 −0.14 −0.146
(0.009)*** (0.009)*** (0.007)*** (0.007)***
Childcare and Home Support workers −0.236 −0.246 −0.314 −0.318
(0.050)*** (0.050)*** (0.010)*** (0.010)***
Sales and Service not elsewhere classified −0.134 −0.138 −0.137 −0.138
(0.005)*** (0.005)*** (0.003)*** (0.003)***
Contractors/Supervisors in trade and transportation 0.161 0.154 0.237 0.226
(0.007)*** (0.006)*** (0.005)*** (0.005)***
Construction Trades 0.094 0.098 0.004 0.006
(0.005)*** (0.005)*** −0.004 −0.004
Other Trades occupations 0.123 0.117 0.1 0.092
(0.004)*** (0.004)*** (0.003)*** (0.003)***
Transport and Equipment operators −0.002 −0.009 −0.042 −0.038
−0.004 (0.004)** (0.003)*** (0.003)***
Trades Helper/Construction/transportation labourer/related −0.029 −0.034 −0.108 −0.107
(0.005)*** (0.005)*** (0.003)*** (0.003)***
Occupations unique to Primary Industry −0.007 0.002 −0.058 −0.042
−0.007 −0.007 (0.005)*** (0.004)***
Machine Operator/Assembler in manufacturing/Supervisors −0.019 −0.025 −0.066 −0.068
(0.004)*** (0.004)*** (0.003)*** (0.003)***
Labourer in Processing, Manufacturing and Utilities −0.092 −0.092 −0.211 −0.206
(0.005)*** (0.005)*** (0.004)*** (0.004)***
Quebec as reference
Ontario 0.115 0.096
(0.004)*** (0.002)***
British Columbia 0.113 0.065
(0.004)*** (0.003)***
Table A-4, continued: Regression results measuring the impact of the corporate income tax on the wages of Canadian workers (private sector only) by union status, 1998–2013

The Effect of Corporate Income and Payroll Taxes on the Wages of Canadian Workers / 49
fraserinstitute.org
Table A-4: Regression results measuring the impact of the corporate income tax on the wages of Canadian workers (private sector only) by union status, 1998–2013
Unionized Not unionized
Dependent variable = log of hourly wage Model 1 Model 4 Model 1 Model 4
Alberta 0.144 0.135
(0.006)*** (0.003)***
Saskatchewan 0.041 0.026
(0.006)*** (0.004)***
Manitoba −0.039 −0.036
(0.006)*** (0.004)***
Newfoundland 0.02 0.065
(0.011)* (0.007)***
Prince Edward Island −0.086 0.004
(0.009)*** −0.005
Nova Scotia −0.008 −0.013
−0.006 (0.004)***
New Brunswick −0.022 −0.035
(0.006)*** (0.003)***
Year 2013 as reference
1998 −0.026 0.008
(0.012)** −0.008
1999 −0.039 0
(0.011)*** −0.008
2000 −0.034 0.009
(0.011)*** −0.007
2001 −0.029 0.012
(0.011)*** −0.007
2002 −0.04 0.011
(0.010)*** −0.007
2003 −0.051 −0.004
(0.009)*** −0.006
2004 −0.04 −0.014
(0.008)*** (0.005)***
2005 −0.056 −0.033
(0.007)*** (0.005)***
2006 −0.063 −0.03
(0.007)*** (0.005)***
2007 -0.051 -0.028
(0.007)*** (0.005)***
2008 −0.048 −0.011
(0.007)*** (0.005)**
Table A-4, continued: Regression results measuring the impact of the corporate income tax on the wages of Canadian workers (private sector only) by union status, 1998–2013

50 / The Effect of Corporate Income and Payroll Taxes on the Wages of Canadian Workers
fraserinstitute.org
Table A-4: Regression results measuring the impact of the corporate income tax on the wages of Canadian workers (private sector only) by union status, 1998–2013
Unionized Not unionized
Dependent variable = log of hourly wage Model 1 Model 4 Model 1 Model 4
2009 −0.024 0.004
(0.007)*** −0.004
2010 −0.008 0.031
−0.007 (0.004)***
2011 −0.012 0.021
(0.006)** (0.004)***
2012 −0.005 0.02
−0.006 (0.003)***
Inflation rate −0.887 −0.758
(0.197)*** (0.107)***
Unemployment rate −0.987 −1.996
(0.127)*** (0.078)***
Constant 2.511 2.619 2.171 2.343
(0.008)*** (0.032)*** (0.005)*** (0.021)***
R-squared 0.39 0.43 0.48 0.50
Observations 123,745 123,745 421,675 421,675
Note: See table 2.
Sources: Statistics Canada (1999-2013); calculation by authors.
Table A-4, continued: Regression results measuring the impact of the corporate income tax on the wages of Canadian workers (private sector only) by union status, 1998–2013

The Effect of Corporate Income and Payroll Taxes on the Wages of Canadian Workers / 51
fraserinstitute.org
Table A-5: Regression results measuring the impact of the payroll tax rate (employer portion) on the wages of Canadian workers (private and public sectors), 1998–2013
Dependent variable = log of hourly wage Model 1 Model 2 Model 3 Model 4
Log payroll tax rate −0.106 −0.079 −0.01 −0.097
(0.002)*** (0.019)*** (0.003)*** (0.019)***
Age 15-24 as reference
Age 25-34 0.211 0.208 0.211 0.207
(0.001)*** (0.001)*** (0.001)*** (0.001)***
Age 35-44 0.297 0.296 0.299 0.296
(0.001)*** (0.001)*** (0.001)*** (0.001)***
Age 45-54 0.341 0.333 0.341 0.333
(0.001)*** (0.001)*** (0.001)*** (0.001)***
Age 55-64 0.328 0.311 0.326 0.311
(0.002)*** (0.002)*** (0.002)*** (0.002)***
Age 65 and more 0.188 0.157 0.181 0.157
(0.005)*** (0.005)*** (0.005)*** (0.005)***
Women as reference
Men 0.148 0.15 0.148 0.15
(0.001)*** (0.001)*** (0.001)*** (0.001)***
Unmarried as reference
Married 0.029 0.044 0.037 0.044
(0.001)*** (0.001)*** (0.001)*** (0.001)***
No high school diploma as reference
Secondary diploma 0.092 0.075 0.086 0.075
(0.001)*** (0.001)*** (0.001)*** (0.001)***
Post secondary diploma 0.134 0.12 0.134 0.12
(0.001)*** (0.001)*** (0.001)*** (0.001)***
Bachelors degree 0.228 0.205 0.223 0.205
(0.002)*** (0.002)*** (0.002)*** (0.002)***
Graduate degree 0.29 0.265 0.286 0.265
(0.002)*** (0.002)*** (0.002)*** (0.002)***
Manufacturing durables as reference
Agriculture −0.241 −0.223 −0.234 −0.222
(0.005)*** (0.005)*** (0.005)*** (0.005)***
Forestry, Fishing, Mining, Oil and Gas 0.141 0.134 0.144 0.134
(0.003)*** (0.003)*** (0.003)*** (0.003)***
Utilities 0.101 0.11 0.105 0.111
(0.004)*** (0.003)*** (0.004)*** (0.003)***
Construction 0.03 0.027 0.035 0.027
(0.002)*** (0.002)*** (0.002)*** (0.002)***
Manufacturing—non-durables −0.075 −0.053 −0.062 −0.052
(0.002)*** (0.002)*** (0.002)*** (0.002)***

52 / The Effect of Corporate Income and Payroll Taxes on the Wages of Canadian Workers
fraserinstitute.org
Table A-5: Regression results measuring the impact of the payroll tax rate (employer portion) on the wages of Canadian workers (private and public sectors), 1998–2013
Dependent variable = log of hourly wage Model 1 Model 2 Model 3 Model 4
Wholesale trade −0.078 −0.072 −0.074 −0.072
(0.003)*** (0.003)*** (0.003)*** (0.003)***
Retail trade −0.228 −0.212 −0.218 −0.212
(0.002)*** (0.002)*** (0.002)*** (0.002)***
Transportation & Warehousing −0.062 −0.054 −0.057 −0.053
(0.002)*** (0.002)*** (0.002)*** (0.002)***
Finance, Insurance, Real Estate and Leasing −0.049 −0.041 −0.044 −0.04
(0.002)*** (0.002)*** (0.002)*** (0.002)***
Professional, Scientific and Technical Services 0.009 0.01 0.013 0.01
(0.003)*** (0.003)*** (0.003)*** (0.003)***
Management, Administrative and Other Support −0.222 −0.208 −0.21 −0.207
(0.003)*** (0.003)*** (0.003)*** (0.003)***
Educational Services −0.062 −0.049 −0.053 −0.049
(0.003)*** (0.003)*** (0.003)*** (0.003)***
Health Care and Social Assistance −0.118 −0.101 −0.107 −0.1
(0.002)*** (0.002)*** (0.002)*** (0.002)***
Information, Culture and Recreation −0.083 −0.07 −0.074 −0.07
(0.003)*** (0.003)*** (0.003)*** (0.003)***
Accommodation and Food Services −0.306 −0.295 −0.296 −0.295
(0.003)*** (0.003)*** (0.003)*** (0.003)***
Other Services −0.151 −0.141 −0.143 −0.141
(0.003)*** (0.003)*** (0.003)*** (0.003)***
Public Administration 0.012 0.035 0.028 0.035
(0.002)*** (0.002)*** (0.002)*** (0.002)***
Clerical occupations as reference
Senior Management occupations 0.544 0.549 0.543 0.548
(0.008)*** (0.008)*** (0.008)*** (0.008)***
Other Management occupations 0.407 0.407 0.406 0.407
(0.002)*** (0.002)*** (0.002)*** (0.002)***
Professional occupations in Business and Finance 0.322 0.319 0.321 0.319
(0.003)*** (0.003)*** (0.003)*** (0.003)***
Financial, Secretarial, and Administrative occupations 0.093 0.096 0.094 0.096
(0.002)*** (0.002)*** (0.002)*** (0.002)***
Natural and Applied Sciences and related occupations 0.263 0.261 0.263 0.26
(0.002)*** (0.002)*** (0.002)*** (0.002)***
Professionals in Health/Nurse supervisors/Registered Nurses 0.44 0.442 0.443 0.442
(0.003)*** (0.003)*** (0.003)*** (0.003)***
Technical, Assisting and related occupations in Health 0.13 0.127 0.129 0.127
(0.003)*** (0.003)*** (0.003)*** (0.003)***
Table A-5, continued: Regression results measuring the impact of the payroll tax rate (employer portion) on the wages of Canadian workers (private and public sectors), 1998–2013

The Effect of Corporate Income and Payroll Taxes on the Wages of Canadian Workers / 53
fraserinstitute.org
Table A-5: Regression results measuring the impact of the payroll tax rate (employer portion) on the wages of Canadian workers (private and public sectors), 1998–2013
Dependent variable = log of hourly wage Model 1 Model 2 Model 3 Model 4
Occupations in Social Science, Government and Religion 0.197 0.192 0.194 0.192
(0.003)*** (0.003)*** (0.003)*** (0.003)***
Teachers & Professors 0.26 0.265 0.263 0.265
(0.003)*** (0.003)*** (0.003)*** (0.003)***
Occupations in Art, Culture, Recreation and Sport 0.136 0.134 0.136 0.134
(0.004)*** (0.004)*** (0.004)*** (0.004)***
Wholesale/Technical/Insurance/Real Estate/Buyers 0.135 0.132 0.134 0.132
(0.003)*** (0.003)*** (0.003)*** (0.003)***
Retail sales person/Sales clerk/Cashier/retail supervisor −0.071 −0.069 −0.068 −0.069
(0.002)*** (0.002)*** (0.002)*** (0.002)***
Chefs/Cooks/Food and Beverage Service/Supervisors −0.036 −0.035 −0.036 −0.035
(0.003)*** (0.003)*** (0.003)*** (0.003)***
Occupations in Protective Services 0.042 0.031 0.036 0.031
(0.004)*** (0.004)*** (0.004)*** (0.004)***
Childcare and Home Support workers −0.177 −0.177 −0.173 −0.177
(0.004)*** (0.004)*** (0.004)*** (0.004)***
Sales and Service not elsewhere classified −0.13 −0.131 −0.128 −0.131
(0.002)*** (0.002)*** (0.002)*** (0.002)***
Contractors/Supervisors in trade and transportation 0.219 0.21 0.214 0.21
(0.004)*** (0.004)*** (0.004)*** (0.004)***
Construction Trades 0.066 0.069 0.069 0.069
(0.003)*** (0.003)*** (0.003)*** (0.003)***
Other Trades occupations 0.124 0.119 0.122 0.119
(0.002)*** (0.002)*** (0.002)*** (0.002)***
Transport and Equipment operators −0.007 −0.007 −0.005 −0.007
(0.002)*** (0.002)*** (0.002)** (0.002)***
Trades Helper/Construction/transportation labourer/related −0.068 −0.071 −0.065 −0.071
(0.003)*** (0.003)*** (0.003)*** (0.003)***
Occupations unique to Primary Industry −0.017 −0.009 −0.011 −0.009
(0.004)*** (0.003)** (0.004)*** (0.003)**
Machine Operator/Assembler in manufacturing/Supervisors −0.043 −0.047 −0.045 −0.047
(0.002)*** (0.002)*** (0.002)*** (0.002)***
Labourer in Processing, Manufacturing and Utilities −0.15 −0.147 −0.145 −0.147
(0.003)*** (0.003)*** (0.003)*** (0.003)***
Small-size firm as reference
Medium-size firm 0.086 0.079 0.082 0.079
(0.001)*** (0.001)*** (0.001)*** (0.001)***
Large-size firm 0.143 0.132 0.138 0.132
(0.001)*** (0.001)*** (0.001)*** (0.001)***
Table A-5, continued: Regression results measuring the impact of the payroll tax rate (employer portion) on the wages of Canadian workers (private and public sectors), 1998–2013

54 / The Effect of Corporate Income and Payroll Taxes on the Wages of Canadian Workers
fraserinstitute.org
Table A-5: Regression results measuring the impact of the payroll tax rate (employer portion) on the wages of Canadian workers (private and public sectors), 1998–2013
Dependent variable = log of hourly wage Model 1 Model 2 Model 3 Model 4
Non union as reference
Union 0.11 0.12 0.111 0.12
(0.001)*** (0.001)*** (0.001)*** (0.001)***
Québec as reference
Ontario 0.083 0.063
(0.004)*** (0.004)***
British Columbia 0.051 0.021
(0.008)*** (0.008)**
Alberta 0.125 0.077
(0.009)*** (0.009)***
Saskatchewan 0.014 −0.033
(0.008)* (0.009)***
Manitoba −0.03 −0.076
(0.005)*** (0.005)***
Newfoundland −0.096 −0.016
(0.003)*** (0.005)***
Prince Edward Island −0.112 −0.076
(0.007)*** (0.008)***
Nova Scotia −0.089 −0.085
(0.007)*** (0.007)***
New Brunswick −0.122 −0.112
(0.008)*** (0.008)***
Year 2013 as reference
1998 −0.118 −0.094
(0.002)*** (0.003)***
1999 −0.111 −0.103
(0.002)*** (0.002)***
2000 −0.101 −0.095
(0.002)*** (0.002)***
2001 −0.094 −0.088
(0.002)*** (0.002)***
2002 −0.091 −0.083
(0.002)*** (0.002)***
2003 −0.094 −0.082
(0.002)*** (0.002)***
2004 −0.084 −0.07
(0.002)*** (0.002)***
2005 −0.082 −0.079
(0.002)*** (0.002)***
Table A-5, continued: Regression results measuring the impact of the payroll tax rate (employer portion) on the wages of Canadian workers (private and public sectors), 1998–2013

The Effect of Corporate Income and Payroll Taxes on the Wages of Canadian Workers / 55
fraserinstitute.org
Table A-5: Regression results measuring the impact of the payroll tax rate (employer portion) on the wages of Canadian workers (private and public sectors), 1998–2013
Dependent variable = log of hourly wage Model 1 Model 2 Model 3 Model 4
2006 −0.075 −0.074
(0.002)*** (0.002)***
2007 −0.063 −0.069
(0.002)*** (0.002)***
2008 −0.046 −0.056
(0.002)*** (0.002)***
2009 −0.023 −0.029
(0.002)*** (0.002)***
2010 −0.014 −0.013
(0.002)*** (0.002)***
2011 −0.022 −0.013
(0.002)*** (0.002)***
2012 −0.011 0.002
(0.002)*** −0.002
Inflation rate −1.296 −0.759
(0.047)*** (0.082)***
Unemployment rate −2.254 −1.208
(0.017)*** (0.056)***
Constant 2.17 2.271 2.568 2.349
(0.006)*** (0.037)*** (0.007)*** (0.037)***
R-squared 0.49 0.52 0.50 0.52
Observations 739,849 739,849 739,849 739,849
Note: See table 3.
Sources: Statistics Canada (1999-2013); calculation by authors.
Table A-5, continued: Regression results measuring the impact of the payroll tax rate (employer portion) on the wages of Canadian workers (private and public sectors), 1998–2013

56 / The Effect of Corporate Income and Payroll Taxes on the Wages of Canadian Workers
fraserinstitute.org
Table A-6: Regression results measuring the impact of the payroll tax rate (employer portion) on the wages of Canadian workers (private sector only) by firm size, 1998–2013
Small Medium Large
Dependent variable = log of hourly wage Model 1 Model 4 Model 1 Model 4 Model 1 Model 4
Log payroll tax rate −0.134 −0.082 −0.166 −0.19 −0.08 −0.176
(0.004)*** (0.034)** (0.007)*** (0.058)*** (0.005)*** (0.034)***
Age 15-24 as reference
Age 25-34 0.194 0.192 0.223 0.22 0.233 0.23
(0.002)*** (0.002)*** (0.004)*** (0.004)*** (0.002)*** (0.002)***
Age 35-44 0.259 0.261 0.314 0.308 0.332 0.329
(0.002)*** (0.002)*** (0.004)*** (0.004)*** (0.002)*** (0.002)***
Age 45-54 0.296 0.287 0.353 0.342 0.384 0.377
(0.002)*** (0.002)*** (0.004)*** (0.004)*** (0.002)*** (0.002)***
Age 55-64 0.283 0.265 0.34 0.324 0.366 0.352
(0.003)*** (0.003)*** (0.005)*** (0.005)*** (0.003)*** (0.003)***
Age 65 and more 0.155 0.121 0.165 0.14 0.191 0.167
(0.008)*** (0.008)*** (0.015)*** (0.015)*** (0.010)*** (0.010)***
Women as reference
Men 0.178 0.178 0.185 0.187 0.167 0.169
(0.002)*** (0.002)*** (0.003)*** (0.003)*** (0.002)*** (0.002)***
Non married as reference
Married 0.025 0.047 0.026 0.042 0.035 0.045
(0.002)*** (0.002)*** (0.003)*** (0.003)*** (0.002)*** (0.002)***
No high school diploma as reference
Secondary diploma 0.078 0.06 0.092 0.075 0.092 0.081
(0.002)*** (0.002)*** (0.004)*** (0.003)*** (0.002)*** (0.002)***
Post secondary diploma 0.122 0.108 0.128 0.115 0.122 0.114
(0.002)*** (0.002)*** (0.004)*** (0.004)*** (0.002)*** (0.002)***
Bachelors degree 0.193 0.164 0.205 0.181 0.206 0.188
(0.004)*** (0.003)*** (0.006)*** (0.005)*** (0.003)*** (0.003)***
Graduate degree 0.242 0.211 0.266 0.239 0.248 0.222
(0.006)*** (0.006)*** (0.009)*** (0.009)*** (0.005)*** (0.005)***
Manufacturing durables as reference
Agriculture −0.197 −0.189 −0.218 −0.209 −0.317 −0.282
(0.006)*** (0.006)*** (0.014)*** (0.013)*** (0.012)*** (0.012)***
Forestry, Fishing, Mining, Oil and Gas 0.118 0.124 0.157 0.142 0.122 0.112
(0.006)*** (0.006)*** (0.008)*** (0.008)*** (0.004)*** (0.004)***
Utilities 0.176 0.173 0.176 0.182 0.109 0.126
(0.011)*** (0.011)*** (0.011)*** (0.010)*** (0.004)*** (0.004)***
Construction 0.06 0.06 0.09 0.084 −0.008 −0.01
(0.003)*** (0.003)*** (0.006)*** (0.005)*** (0.004)** (0.004)**
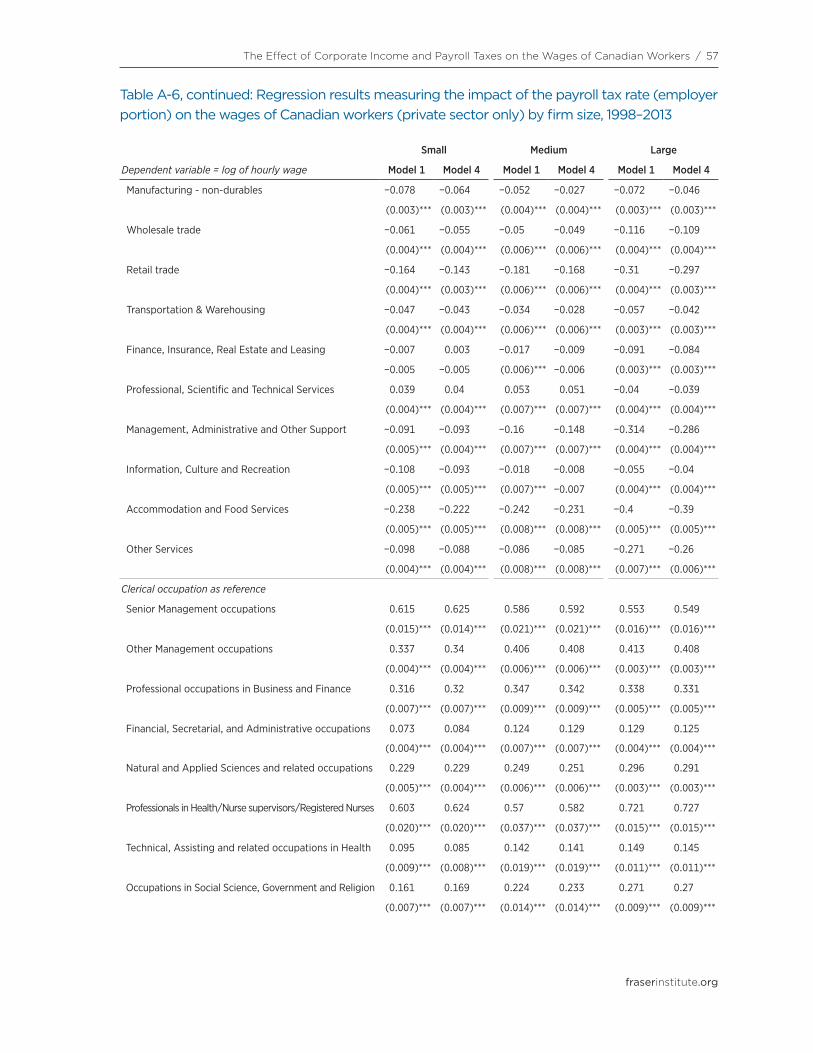
The Effect of Corporate Income and Payroll Taxes on the Wages of Canadian Workers / 57
fraserinstitute.org
Table A-6: Regression results measuring the impact of the payroll tax rate (employer portion) on the wages of Canadian workers (private sector only) by firm size, 1998–2013
Small Medium Large
Dependent variable = log of hourly wage Model 1 Model 4 Model 1 Model 4 Model 1 Model 4
Manufacturing - non-durables −0.078 −0.064 −0.052 −0.027 −0.072 −0.046
(0.003)*** (0.003)*** (0.004)*** (0.004)*** (0.003)*** (0.003)***
Wholesale trade −0.061 −0.055 −0.05 −0.049 −0.116 −0.109
(0.004)*** (0.004)*** (0.006)*** (0.006)*** (0.004)*** (0.004)***
Retail trade −0.164 −0.143 −0.181 −0.168 −0.31 −0.297
(0.004)*** (0.003)*** (0.006)*** (0.006)*** (0.004)*** (0.003)***
Transportation & Warehousing −0.047 −0.043 −0.034 −0.028 −0.057 −0.042
(0.004)*** (0.004)*** (0.006)*** (0.006)*** (0.003)*** (0.003)***
Finance, Insurance, Real Estate and Leasing −0.007 0.003 −0.017 −0.009 −0.091 −0.084
−0.005 −0.005 (0.006)*** −0.006 (0.003)*** (0.003)***
Professional, Scientific and Technical Services 0.039 0.04 0.053 0.051 −0.04 −0.039
(0.004)*** (0.004)*** (0.007)*** (0.007)*** (0.004)*** (0.004)***
Management, Administrative and Other Support −0.091 −0.093 −0.16 −0.148 −0.314 −0.286
(0.005)*** (0.004)*** (0.007)*** (0.007)*** (0.004)*** (0.004)***
Information, Culture and Recreation −0.108 −0.093 −0.018 −0.008 −0.055 −0.04
(0.005)*** (0.005)*** (0.007)*** −0.007 (0.004)*** (0.004)***
Accommodation and Food Services −0.238 −0.222 −0.242 −0.231 −0.4 −0.39
(0.005)*** (0.005)*** (0.008)*** (0.008)*** (0.005)*** (0.005)***
Other Services −0.098 −0.088 −0.086 −0.085 −0.271 −0.26
(0.004)*** (0.004)*** (0.008)*** (0.008)*** (0.007)*** (0.006)***
Clerical occupation as reference
Senior Management occupations 0.615 0.625 0.586 0.592 0.553 0.549
(0.015)*** (0.014)*** (0.021)*** (0.021)*** (0.016)*** (0.016)***
Other Management occupations 0.337 0.34 0.406 0.408 0.413 0.408
(0.004)*** (0.004)*** (0.006)*** (0.006)*** (0.003)*** (0.003)***
Professional occupations in Business and Finance 0.316 0.32 0.347 0.342 0.338 0.331
(0.007)*** (0.007)*** (0.009)*** (0.009)*** (0.005)*** (0.005)***
Financial, Secretarial, and Administrative occupations 0.073 0.084 0.124 0.129 0.129 0.125
(0.004)*** (0.004)*** (0.007)*** (0.007)*** (0.004)*** (0.004)***
Natural and Applied Sciences and related occupations 0.229 0.229 0.249 0.251 0.296 0.291
(0.005)*** (0.004)*** (0.006)*** (0.006)*** (0.003)*** (0.003)***
Professionals in Health/Nurse supervisors/Registered Nurses 0.603 0.624 0.57 0.582 0.721 0.727
(0.020)*** (0.020)*** (0.037)*** (0.037)*** (0.015)*** (0.015)***
Technical, Assisting and related occupations in Health 0.095 0.085 0.142 0.141 0.149 0.145
(0.009)*** (0.008)*** (0.019)*** (0.019)*** (0.011)*** (0.011)***
Occupations in Social Science, Government and Religion 0.161 0.169 0.224 0.233 0.271 0.27
(0.007)*** (0.007)*** (0.014)*** (0.014)*** (0.009)*** (0.009)***
Table A-6, continued: Regression results measuring the impact of the payroll tax rate (employer portion) on the wages of Canadian workers (private sector only) by firm size, 1998–2013

58 / The Effect of Corporate Income and Payroll Taxes on the Wages of Canadian Workers
fraserinstitute.org
Table A-6: Regression results measuring the impact of the payroll tax rate (employer portion) on the wages of Canadian workers (private sector only) by firm size, 1998–2013
Small Medium Large
Dependent variable = log of hourly wage Model 1 Model 4 Model 1 Model 4 Model 1 Model 4
Teachers & Professors 0.241 0.24 0.221 0.208 0.308 0.303
(0.037)*** (0.035)*** (0.034)*** (0.036)*** (0.015)*** (0.014)***
Occupations in Art, Culture, Recreation and Sport 0.111 0.117 0.161 0.161 0.187 0.179
(0.007)*** (0.006)*** (0.011)*** (0.010)*** (0.007)*** (0.007)***
Wholesale/Technical/Insurance/Real Estate/Buyers 0.137 0.133 0.146 0.144 0.106 0.102
(0.005)*** (0.005)*** (0.008)*** (0.008)*** (0.005)*** (0.005)***
Retail sales person/Sales clerk/Cashier/retail supervisor −0.076 −0.073 −0.063 −0.058 −0.054 −0.056
(0.004)*** (0.004)*** (0.007)*** (0.007)*** (0.004)*** (0.004)***
Chefs/Cooks/Food and Beverage Service/Supervisors −0.058 −0.054 −0.06 −0.06 −0.016 −0.022
(0.005)*** (0.005)*** (0.010)*** (0.010)*** (0.005)*** (0.005)***
Occupations in Protective Services −0.178 −0.166 −0.187 −0.182 −0.076 −0.088
(0.012)*** (0.012)*** (0.013)*** (0.013)*** (0.007)*** (0.007)***
Childcare and Home Support workers −0.34 −0.341 −0.077 −0.061 −0.098 −0.108
(0.010)*** (0.010)*** −0.069 −0.069 (0.041)** (0.039)***
Sales and Service not elsewhere classified −0.15 −0.145 −0.139 −0.14 −0.093 −0.099
(0.004)*** (0.004)*** (0.006)*** (0.006)*** (0.003)*** (0.003)***
Contractors/Supervisors in trade and transportation 0.226 0.215 0.197 0.188 0.219 0.212
(0.006)*** (0.006)*** (0.010)*** (0.009)*** (0.006)*** (0.006)***
Construction Trades 0.05 0.058 0.073 0.076 0.127 0.123
(0.005)*** (0.004)*** (0.009)*** (0.009)*** (0.007)*** (0.006)***
Other Trades occupations 0.109 0.107 0.122 0.122 0.155 0.149
(0.004)*** (0.003)*** (0.005)*** (0.005)*** (0.003)*** (0.003)***
Transport and Equipment operators −0.008 −0.001 −0.031 −0.026 0.011 0.005
(0.004)* −0.004 (0.006)*** (0.006)*** (0.004)*** −0.004
Trades Helper/Construction/transportation labourer/related −0.093 −0.089 −0.077 −0.078 −0.034 −0.039
(0.004)*** (0.004)*** (0.007)*** (0.007)*** (0.005)*** (0.004)***
Occupations unique to Primary Industry −0.078 −0.053 −0.01 0.001 0.067 0.065
(0.006)*** (0.005)*** −0.011 −0.01 (0.006)*** (0.006)***
Machine Operator/Assembler in manufacturing/Supervisors −0.076 −0.072 −0.063 −0.063 0.012 0.006
(0.004)*** (0.004)*** (0.005)*** (0.005)*** (0.003)*** (0.003)*
Labourer in Processing, Manufacturing and Utilities −0.162 −0.152 −0.155 −0.149 −0.1 −0.098
(0.006)*** (0.006)*** (0.007)*** (0.007)*** (0.005)*** (0.005)***
Quebec as reference
Ontario 0.043 0.044 0.018
(0.007)*** (0.012)*** (0.007)***
British Columbia 0.03 0.009 −0.034
(0.015)** −0.025 (0.015)**
Table A-6, continued: Regression results measuring the impact of the payroll tax rate (employer portion) on the wages of Canadian workers (private sector only) by firm size, 1998–2013

The Effect of Corporate Income and Payroll Taxes on the Wages of Canadian Workers / 59
fraserinstitute.org
Table A-6: Regression results measuring the impact of the payroll tax rate (employer portion) on the wages of Canadian workers (private sector only) by firm size, 1998–2013
Small Medium Large
Dependent variable = log of hourly wage Model 1 Model 4 Model 1 Model 4 Model 1 Model 4
Alberta 0.079 0.05 0.007
(0.017)*** (0.029)* −0.017
Saskatchewan −0.046 −0.049 −0.086
(0.016)*** (0.027)* (0.016)***
Manitoba −0.078 −0.106 −0.132
(0.009)*** (0.016)*** (0.009)***
Newfoundland −0.031 0.028 −0.011
(0.009)*** (0.015)* −0.009
Prince Edward Island −0.068 −0.154 −0.175
(0.014)*** (0.024)*** (0.014)***
Nova Scotia −0.108 −0.107 −0.129
(0.012)*** (0.021)*** (0.012)***
New Brunswick −0.116 −0.141 −0.174
(0.014)*** (0.024)*** (0.014)***
Year 2013 as reference
1998 −0.118 −0.081 −0.057
(0.005)*** (0.008)*** (0.004)***
1999 −0.126 −0.095 −0.069
(0.004)*** (0.007)*** (0.004)***
2000 −0.116 −0.081 −0.067
(0.004)*** (0.007)*** (0.004)***
2001 −0.108 −0.078 −0.065
(0.005)*** (0.008)*** (0.004)***
2002 −0.105 −0.076 −0.057
(0.004)*** (0.007)*** (0.004)***
2003 −0.1 −0.071 −0.061
(0.004)*** (0.007)*** (0.004)***
2004 −0.095 −0.065 −0.049
(0.005)*** (0.008)*** (0.004)***
2005 −0.097 −0.065 −0.065
(0.004)*** (0.007)*** (0.004)***
2006 −0.092 −0.061 −0.065
(0.004)*** (0.007)*** (0.004)***
2007 −0.089 −0.059 −0.06
(0.004)*** (0.007)*** (0.004)***
2008 −0.071 −0.055 −0.05
(0.004)*** (0.007)*** (0.004)***
Table A-6, continued: Regression results measuring the impact of the payroll tax rate (employer portion) on the wages of Canadian workers (private sector only) by firm size, 1998–2013

60 / The Effect of Corporate Income and Payroll Taxes on the Wages of Canadian Workers
fraserinstitute.org
Table A-6: Regression results measuring the impact of the payroll tax rate (employer portion) on the wages of Canadian workers (private sector only) by firm size, 1998–2013
Small Medium Large
Dependent variable = log of hourly wage Model 1 Model 4 Model 1 Model 4 Model 1 Model 4
2009 −0.045 −0.032 −0.028
(0.004)*** (0.007)*** (0.004)***
2010 −0.012 −0.017 −0.011
(0.004)*** (0.007)** (0.004)***
2011 −0.015 −0.008 −0.013
(0.004)*** −0.007 (0.004)***
2012 −0.004 0.004 0.002
−0.004 −0.007 −0.004
Inflation rate −0.595 −0.483 −0.767
(0.148)*** (0.249)* (0.142)***
Unemployment rate −1.619 −1.434 −1.355
(0.102)*** (0.176)*** (0.102)***
Constant 2.136 2.451 2.09 2.211 2.379 2.359
(0.011)*** (0.068)*** (0.017)*** (0.114)*** (0.011)*** (0.067)***
R-squared 0.40 0.44 0.44 0.48 0.51 0.53
Observations 224,393 224,393 81,618 81,618 239,409 239,409
Note: See table 3.
Sources: Statistics Canada (1999-2013); calculation by authors.
Table A-6, continued: Regression results measuring the impact of the payroll tax rate (employer portion) on the wages of Canadian workers (private sector only) by firm size, 1998–2013

The Effect of Corporate Income and Payroll Taxes on the Wages of Canadian Workers / 61
fraserinstitute.org
Table A-7: Regression results measuring the impact of the payroll tax rate (employer portion) on the wages of Canadian workers (private sector only) by union status, 1998–2013
Unionized Not unionized
Dependent variable = log of hourly wage Model 1 Model 4 Model 1 Model 4
Log payroll tax rate −0.189 −0.229 −0.143 −0.136
(0.005)*** (0.043)*** (0.004)*** (0.026)***
Age 15-24 as reference
Age 25-34 0.262 0.26 0.196 0.192
(0.004)*** (0.004)*** (0.002)*** (0.002)***
Age 35-44 0.333 0.331 0.281 0.278
(0.004)*** (0.004)*** (0.002)*** (0.002)***
Age 45-54 0.378 0.373 0.323 0.311
(0.004)*** (0.004)*** (0.002)*** (0.002)***
Age 55-64 0.367 0.356 0.3 0.279
(0.004)*** (0.004)*** (0.002)*** (0.002)***
Age 65 and more 0.191 0.177 0.153 0.119
(0.014)*** (0.014)*** (0.007)*** (0.006)***
Women as reference
Men 0.16 0.164 0.175 0.175
(0.002)*** (0.002)*** (0.001)*** (0.001)***
Non married as reference
Married 0.019 0.027 0.033 0.053
(0.002)*** (0.002)*** (0.001)*** (0.001)***
No high school diploma as reference
Secondary diploma 0.087 0.071 0.099 0.081
(0.003)*** (0.002)*** (0.002)*** (0.002)***
Post secondary diploma 0.111 0.101 0.141 0.127
(0.003)*** (0.003)*** (0.002)*** (0.002)***
Bachelors degree 0.133 0.115 0.241 0.214
(0.005)*** (0.004)*** (0.002)*** (0.002)***
Graduate degree 0.185 0.157 0.292 0.26
(0.008)*** (0.008)*** (0.004)*** (0.004)***
Manufacturing durables as reference
Agriculture −0.235 −0.199 −0.269 −0.252
(0.016)*** (0.016)*** (0.006)*** (0.005)***
Forestry, Fishing, Mining, Oil and Gas 0.094 0.111 0.177 0.154
(0.005)*** (0.005)*** (0.004)*** (0.004)***
Utilities 0.124 0.14 0.17 0.175
(0.004)*** (0.004)*** (0.008)*** (0.008)***
Construction 0.048 0.055 −0.029 −0.029
(0.004)*** (0.004)*** (0.003)*** (0.003)***

62 / The Effect of Corporate Income and Payroll Taxes on the Wages of Canadian Workers
fraserinstitute.org
Table A-7: Regression results measuring the impact of the payroll tax rate (employer portion) on the wages of Canadian workers (private sector only) by union status, 1998–2013
Unionized Not unionized
Dependent variable = log of hourly wage Model 1 Model 4 Model 1 Model 4
Manufacturing—non-durables −0.087 −0.059 −0.06 −0.036
(0.003)*** (0.003)*** (0.003)*** (0.002)***
Wholesale trade −0.117 −0.107 −0.088 −0.081
(0.006)*** (0.006)*** (0.003)*** (0.003)***
Retail trade −0.197 −0.184 −0.235 −0.216
(0.005)*** (0.005)*** (0.003)*** (0.003)***
Transportation & Warehousing −0.025 −0.007 −0.078 −0.071
(0.004)*** (0.004)* (0.003)*** (0.003)***
Finance, Insurance, Real Estate and Leasing −0.055 −0.033 −0.026 −0.019
(0.006)*** (0.006)*** (0.003)*** (0.003)***
Professional, Scientific and Technical Services −0.016 −0.011 −0.026 −0.023
(0.008)* −0.008 (0.003)*** (0.003)***
Management, Administrative and Other Support −0.197 −0.191 −0.2 −0.184
(0.007)*** (0.007)*** (0.003)*** (0.003)***
Information, Culture and Recreation −0.013 0.013 −0.102 −0.09
(0.004)*** (0.004)*** (0.004)*** (0.003)***
Accommodation and Food Services −0.262 −0.245 −0.31 −0.298
(0.008)*** (0.008)*** (0.003)*** (0.003)***
Other Services −0.083 −0.072 −0.195 −0.181
(0.007)*** (0.007)*** (0.003)*** (0.003)***
Clerical occupation as reference
Senior Management occupations 0.418 0.414 0.596 0.604
(0.037)*** (0.037)*** (0.010)*** (0.010)***
Other Management occupations 0.292 0.293 0.409 0.408
(0.007)*** (0.007)*** (0.003)*** (0.003)***
Professional occupations in Business and Finance 0.318 0.32 0.345 0.342
(0.009)*** (0.009)*** (0.004)*** (0.004)***
Financial, Secretarial, and Administrative occupations 0.1 0.106 0.094 0.1
(0.007)*** (0.007)*** (0.003)*** (0.003)***
Natural and Applied Sciences and related occupations 0.226 0.23 0.303 0.299
(0.005)*** (0.005)*** (0.003)*** (0.003)***
Professionals in Health/Nurse supervisors/Registered Nurses 0.494 0.488 0.672 0.686
(0.028)*** (0.028)*** (0.013)*** (0.013)***
Technical, Assisting and related occupations in Health 0.091 0.088 0.106 0.097
(0.016)*** (0.016)*** (0.007)*** (0.007)***
Occupations in Social Science, Government and Religion 0.253 0.265 0.204 0.208
(0.013)*** (0.013)*** (0.006)*** (0.006)***
Table A-7, continued: Regression results measuring the impact of the payroll tax rate (employer portion) on the wages of Canadian workers (private sector only) by union status, 1998–2013

The Effect of Corporate Income and Payroll Taxes on the Wages of Canadian Workers / 63
fraserinstitute.org
Table A-7: Regression results measuring the impact of the payroll tax rate (employer portion) on the wages of Canadian workers (private sector only) by union status, 1998–2013
Unionized Not unionized
Dependent variable = log of hourly wage Model 1 Model 4 Model 1 Model 4
Teachers & Professors 0.265 0.267 0.324 0.315
(0.023)*** (0.022)*** (0.015)*** (0.015)***
Occupations in Art, Culture, Recreation and Sport 0.142 0.137 0.113 0.113
(0.008)*** (0.008)*** (0.005)*** (0.005)***
Wholesale/Technical/Insurance/Real Estate/Buyers 0.037 0.044 0.136 0.133
(0.010)*** (0.010)*** (0.004)*** (0.003)***
Retail sales person/Sales clerk/Cashier/retail supervisor −0.065 −0.066 −0.068 −0.067
(0.007)*** (0.006)*** (0.003)*** (0.003)***
Chefs/Cooks/Food and Beverage Service/Supervisors −0.098 −0.099 −0.048 −0.046
(0.010)*** (0.010)*** (0.004)*** (0.004)***
Occupations in Protective Services −0.152 −0.148 −0.148 −0.146
(0.009)*** (0.009)*** (0.008)*** (0.007)***
Childcare and Home Support workers −0.242 −0.247 −0.313 −0.318
(0.050)*** (0.050)*** (0.010)*** (0.010)***
Sales and Service not elsewhere classified −0.133 −0.138 −0.137 −0.137
(0.005)*** (0.005)*** (0.003)*** (0.003)***
Contractors/Supervisors in trade and transportation 0.158 0.154 0.238 0.227
(0.007)*** (0.006)*** (0.005)*** (0.005)***
Construction Trades 0.099 0.098 0 0.006
(0.005)*** (0.005)*** −0.004 −0.004
Other Trades occupations 0.121 0.117 0.1 0.093
(0.004)*** (0.004)*** (0.003)*** (0.003)***
Transport and Equipment operators −0.002 −0.009 −0.043 −0.038
−0.004 (0.004)** (0.003)*** (0.003)***
Trades Helper/Construction/transportation labourer/related −0.03 −0.034 −0.106 −0.107
(0.005)*** (0.005)*** (0.003)*** (0.003)***
Occupations unique to Primary Industry −0.004 0.002 −0.06 −0.042
−0.007 −0.007 (0.005)*** (0.004)***
Machine Operator/Assembler in manufacturing/Supervisors −0.018 −0.025 −0.066 −0.068
(0.004)*** (0.004)*** (0.003)*** (0.003)***
Labourer in Processing, Manufacturing and Utilities −0.095 −0.092 −0.21 −0.205
(0.005)*** (0.005)*** (0.004)*** (0.004)***
Quebec as reference
Ontario 0.069 0.048
(0.009)*** (0.005)***
British Columbia 0.014 −0.009
−0.019 −0.011
Table A-7, continued: Regression results measuring the impact of the payroll tax rate (employer portion) on the wages of Canadian workers (private sector only) by union status, 1998–2013

64 / The Effect of Corporate Income and Payroll Taxes on the Wages of Canadian Workers
fraserinstitute.org
Table A-7: Regression results measuring the impact of the payroll tax rate (employer portion) on the wages of Canadian workers (private sector only) by union status, 1998–2013
Unionized Not unionized
Dependent variable = log of hourly wage Model 1 Model 4 Model 1 Model 4
Alberta 0.037 0.063
(0.021)* (0.013)***
Saskatchewan −0.061 −0.06
(0.020)*** (0.012)***
Manitoba −0.097 −0.095
(0.012)*** (0.007)***
Newfoundland −0.011 0.017
−0.011 (0.007)**
Prince Edward Island −0.179 −0.09
(0.018)*** (0.011)***
Nova Scotia −0.092 −0.099
(0.015)*** (0.009)***
New Brunswick −0.12 −0.116
(0.018)*** (0.011)***
Year 2013 as reference
1998 −0.047 −0.107
(0.005)*** (0.004)***
1999 −0.062 −0.116
(0.005)*** (0.003)***
2000 −0.06 −0.108
(0.005)*** (0.003)***
2001 −0.054 −0.102
(0.005)*** (0.003)***
2002 −0.061 −0.093
(0.005)*** (0.003)***
2003 −0.063 −0.088
(0.005)*** (0.003)***
2004 −0.044 −0.08
(0.005)*** (0.003)***
2005 −0.058 −0.087
(0.005)*** (0.003)***
2006 −0.066 −0.083
(0.005)*** (0.003)***
2007 −0.057 −0.081
(0.005)*** (0.003)***
2008 −0.058 −0.066
(0.005)*** (0.003)***
Table A-7, continued: Regression results measuring the impact of the payroll tax rate (employer portion) on the wages of Canadian workers (private sector only) by union status, 1998–2013
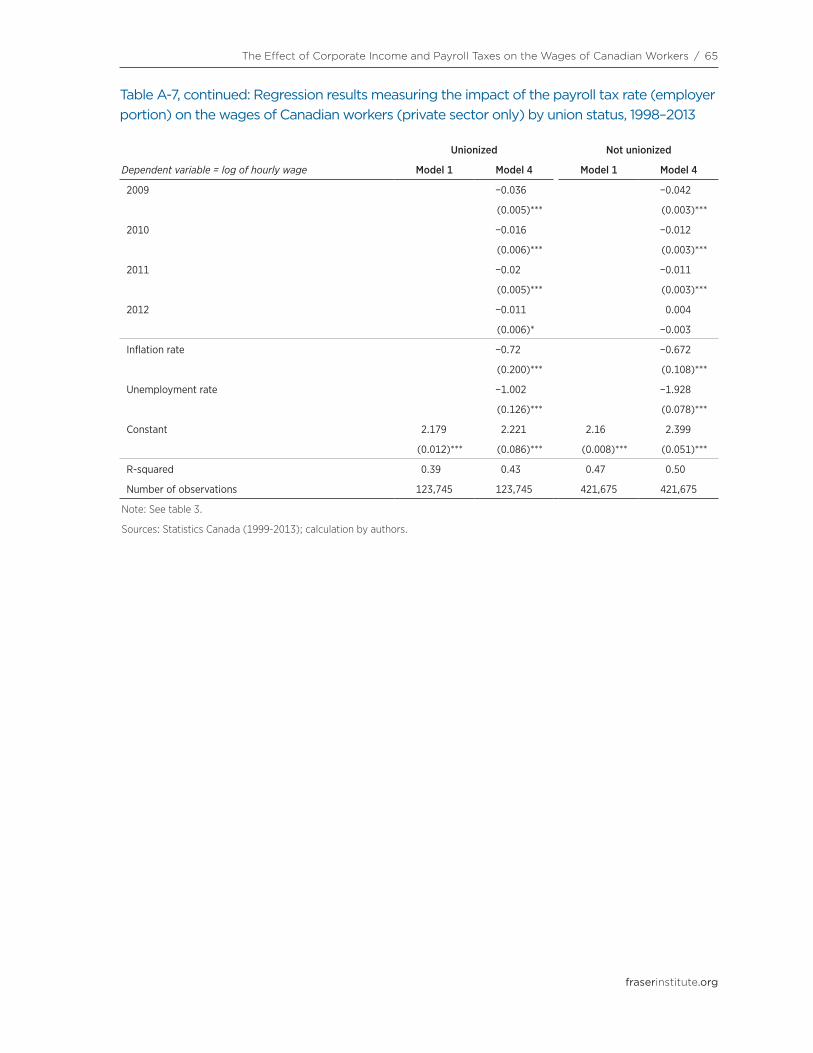
The Effect of Corporate Income and Payroll Taxes on the Wages of Canadian Workers / 65
fraserinstitute.org
Table A-7: Regression results measuring the impact of the payroll tax rate (employer portion) on the wages of Canadian workers (private sector only) by union status, 1998–2013
Unionized Not unionized
Dependent variable = log of hourly wage Model 1 Model 4 Model 1 Model 4
2009 −0.036 −0.042
(0.005)*** (0.003)***
2010 −0.016 −0.012
(0.006)*** (0.003)***
2011 −0.02 −0.011
(0.005)*** (0.003)***
2012 −0.011 0.004
(0.006)* −0.003
Inflation rate −0.72 −0.672
(0.200)*** (0.108)***
Unemployment rate −1.002 −1.928
(0.126)*** (0.078)***
Constant 2.179 2.221 2.16 2.399
(0.012)*** (0.086)*** (0.008)*** (0.051)***
R-squared 0.39 0.43 0.47 0.50
Number of observations 123,745 123,745 421,675 421,675
Note: See table 3.
Sources: Statistics Canada (1999-2013); calculation by authors.
Table A-7, continued: Regression results measuring the impact of the payroll tax rate (employer portion) on the wages of Canadian workers (private sector only) by union status, 1998–2013

66 / fraserinstitute.org
References
Abbott, M., and C. Beach (1997). The Impact of Employer Payroll Taxes on Employment and Wages: Evidence for Canada, 1970–93. In M. Abbott, C. Beach, and R. Chaykowski (eds), Transition and Structural Change in the North American Labour Market (IRC Press): 154–234.
Arulampalam, Wiji, Michael P. Devereux, and Giorgia Maffini (2012). The Direct Incidence of Corporate Income Tax on Wages. European Economic Review 56, 6: 1038–1054.
Brittain, John A. (1974). The Payroll Tax for Social Security. Journal of Business 47, 1 (Jan.): 114–116.
Canada, Department of Finance (2014). Tax Expenditures and Evaluations 2013. Government of Canada. <http://www.fin.gc.ca/taxexp-depfisc/2013/
taxexp1303-eng.asp>.
Cragg, John G., Arnold C. Harberger, and Peter Mieszkowski (1967). Empirical Evidence on the Incidence of the Corporation Income Tax. Journal of Political Economy 75: 811–821.
Dusansky, Richard, and J. Ernest Tanner (1974). The Shifting of the Profits Tax in Canadian Manufacturing, 1935–65. Canadian Journal of Economics 7, 1: 112–121.
Ebrahimi, Pouya, Marylène Roy, and François Vaillancourt (2015). L’incidence de l’impôt sur les bénéfices des taxes sur la masse salariale et des taxes générales sur les transactions: Revue des écrits et résultats pour le Canada, 2000-2012. Étude réalisée sous contrat pour la Commission d’examen sur la fiscalité québécoise. <http://www.examenfiscalite.gouv.qc.ca/
fileadmin/user_upload/etudes/incidence_impot_sur_benefices_des_taxes.pdf>.
Felix, R. Alison (2009). Do State Corporate Income Taxes Reduce Wages? Economic Review (Q II): 77–102.

The Effect of Corporate Income and Payroll Taxes on the Wages of Canadian Workers / 67
fraserinstitute.org
Felix, R. Alison, and James R. Hines, Jr. (2009). Corporate Taxes and Union Wages in the United States. (NBER Working Paper w15263). National Bureau of Economic Research.
Holmlund, Bertil (1983). Payroll Tax and Wage Inflation: The Swedish Experience. Scandinavian Journal of Economics 85, 1: 1–15.
Krzyzaniak, Marion, and Richard A. Musgrave (1963). The Shifting of the Corporation Income Tax. Johns Hopkins University Press.
Liu, Li, and Rosanne Altshuler (2013). Measuring the Burden of the Corporate Income Tax under Imperfect Competition. National Tax Journal 66, 1: 215–237.
Marceau, Nicolas, and François Vaillancourt (1990). Do General and Firm-Specific Employer Payroll Taxes Have the Same Incidence? Theory and Evidence. Economics Letters 34, 2: 175–181.
Oakland, William H. (1972). Corporate Earnings and Tax Shifting in U.S. Manufacturing, 1930–1968. Review of Economics and Statistics 54, 3: 235–244.
Roy-César, Édison, and François Vaillancourt (2010). The Incidence of Payroll Taxes in Ontario and Quebec: Evidence from Collective Agreements for 1985-2007. Scientific Series, 2010s-36. CIRANO. <http://www.cirano.qc.ca/
pdf/publication/2010s-36.pdf>
Sebold, Frederick D. (1979). The Short-Run Shifting of the Corporation Income Tax: A Simultaneous Equation Approach. Review of Economics and Statistics, 61, 3: 401–409.
Spencer, Byron G. (1969). The Shifting of the Corporation Income Tax in Canada. Canadian Journal of Economics 2, 1: 21–34.
Suarez Serrato, Juan C., and Owen Zidar (2014). Who Benefits from State Corporate Tax Cuts? A Local Labor Markets Approach with Heterogeneous Firms. NBER Working Paper w20289. National Bureau of Economic Research.
Statistics Canada (1999). Labour Force Survey (monthly). Microdata file (January to December 1998). Statistics Canada.
Statistics Canada (2000). Labour Force Survey (monthly). Microdata file (January to December 1999). Statistics Canada.

68 / The Effect of Corporate Income and Payroll Taxes on the Wages of Canadian Workers
fraserinstitute.org
Statistics Canada (2001). Labour Force Survey (monthly). Microdata file (January to December 2000). Statistics Canada.
Statistics Canada (2002a). Labour Force Survey (monthly). Microdata file (January to December 2001). Statistics Canada.
Statistics Canada (2002b). CANSIM Table 109-5004. Unemployment Rate, Canada, Provinces, Health Regions and Peer Groups Annual (Percent). *Terminated*. Statistics Canada.
Statistics Canada (2003). Labour Force Survey (monthly). Microdata file (January to December 2002). Statistics Canada.
Statistics Canada (2004). Labour Force Survey (monthly). Microdata file (January to December 2003). Statistics Canada.
Statistics Canada (2005). Labour Force Survey (monthly). Microdata file (January to December 2004). Statistics Canada.
Statistics Canada (2006). Labour Force Survey (monthly). Microdata file (January to December 2005). Statistics Canada.
Statistics Canada (2007). Labour Force Survey (monthly). Microdata file (January to December 2006). Statistics Canada.
Statistics Canada (2008). Labour Force Survey (monthly). Microdata file (January to December 2007). Statistics Canada.
Statistic Canada (2009a). CANSIM Table 385-0001. Consolidated Federal, Provincial, Territorial and Local Government Revenue and Expenditures. *Terminated*. Statistics Canada. <http://www5.statcan.gc.ca/
cansim/a26?lang=eng&retrLang=eng&id=3850001&paSer=&pattern=&stByVal=1&p1=1
&p2=-1&tabMode=dataTable&csid=>.
Statistics Canada (2009b). Labour Force Survey (monthly). Microdata file (January to December 2008). Statistics Canada.
Statistics Canada (2010a). Labour Force Survey (monthly). Microdata file (January to December 2009). Statistics Canada.
Statistics Canada (2010b). CANSIM Table 109-5304. Unemployment Rate, Canada, Provinces, Health Regions and Peer Groups Annual (Percent). *Terminated*. Statistics Canada.

The Effect of Corporate Income and Payroll Taxes on the Wages of Canadian Workers / 69
fraserinstitute.org
Statistics Canada (2011). Labour Force Survey (monthly). Microdata file (January to December 2010). Statistics Canada.
Statistics Canada (2012). Labour Force Survey (monthly). Microdata file (January to December 2011). Statistics Canada.
Statistics Canada (2013). Labour Force Survey (monthly). Microdata file (January to December 2012). Statistics Canada.
Statistics Canada (2014). Labour Force Survey (monthly). Microdata file (January to December 2013). Statistics Canada.
Statistics Canada (2015a). CANSIM Table 326-0021. Consumer Price Index, Annual (2002=100). Statistics Canada. <http://www5.statcan.gc.ca/cansim/
a26?lang=eng&retrLang=eng&id=3260021&paSer=&pattern=&stByVal=1&p1=1&p2=-
1&tabMode=dataTable&csid=>.
Statistics Canada (2015b). CANSIM Table 109-5324. Unemployment Rate, Canada, Provinces, Health Regions (2013 Boundaries) and Peer Groups Annual (Percent). Statistics Canada.
Treff, Karin, and David B. Perry (1998-2007). Finances of the Nation [1998-2007]. Canadian Tax Foundation [CTF]. <http://www.ctf.ca/ctfweb/EN/CTF_
Publications/Books/Finances_of_the_Nation/EN/Publications/Finances_of_the_Nation.
aspx?hkey=0638cad2-e583-4e10-8ab2-0805350b3500>
Treff, Karin, and Deborah Ort (2008-2012). Finances of the Nation [2008–2012]. Canadian Tax Foundation [CTF]. <http://www.ctf.ca/ctfweb/EN/CTF_
Publications/Books/Finances_of_the_Nation/EN/Publications/Finances_of_the_Nation.
aspx?hkey=0638cad2-e583-4e10-8ab2-0805350b3500>.
Zodrow, George R. (2005). Incidence of Taxes. In Joseph J. Cordes, Robert D. Ebel, and Jane G. Gravelle (eds.), The Encyclopedia of Taxation and Tax Policy (Urban Institute Press): 186–190.

70 / The Effect of Corporate Income and Payroll Taxes on the Wages of Canadian Workers
fraserinstitute.org
About the Authors
Pouya EbrahimiPouya Ebrahimi is a research professional at CIRANO. He holds an M.Sc. (economics) from Université de Montréal and is a doctoral candidate at HEC Montréal. He has published in the public policy area.
François VaillancourtFrançois Vaillancourt (PhD, Queen’s University, 1978) is a Fellow at CIRANO, an Emeritus Professor (Economics) at Université de Montréal, and a member of the Royal Society of Canada. He has published extensively in areas of public policy such as fiscal federalism, taxation, and language policy. He has been a Shastri lecturer (1993, India), a Fulbright Scholar (2009, Atlanta), and a visi-tor at the Federalism Research Centre ANU (1991, Canberra), the Institute for Policy Analysis (1991, Toronto), the Andrew Young School (2007 and 2009, Atlanta), and École Normale Supérieure (2006 and 2008, Cachan). He has done consulting work for bodies in Québec, in Canada, and outside Canada.
Acknowledgments
The authors wish to thank Charles Lammam, Director of Fiscal Studies at the Fraser Institute, and Feixue Ren for their assistance in preparing the study. They also thank the anonymous reviewers for their comments, suggestions, and insights. Any re maining errors or oversights are the sole responsibility of the authors. As the researchers have worked independently, the views and conclusions expressed in this study do not necessarily reflect those of the Board of Directors of the Fraser Institute, the staff, or supporters.

The Effect of Corporate Income and Payroll Taxes on the Wages of Canadian Workers / 71
fraserinstitute.org
Publishing Information
DistributionThese publications are available from <http://www.fraserinstitute.org> in Portable Document Format (PDF) and can be read with Adobe Acrobat® or Adobe Reader®, versions 7 or later. Adobe Reader® XI, the most recent version, is avail-able free of charge from Adobe Systems Inc. at <http://get.adobe.com/reader/>. Readers having trouble viewing or printing our PDF files using applications from other manufacturers (e.g., Apple’s Preview) should use Reader® or Acrobat®.
Ordering publicationsTo order printed publications from the Fraser Institute, please contact:
• e-mail: [email protected] • telephone: 604.688.0221 ext. 580 or, toll free, 1.800.665.3558 ext. 580 • fax: 604.688.8539.
MediaFor media enquiries, please contact our Communications Department:
• 604.714.4582 • e-mail: [email protected].
CopyrightCopyright © 2016 by the Fraser Institute. All rights reserved. No part of this pub-lication may be reproduced in any manner whatsoever without written permis-sion except in the case of brief passages quoted in critical articles and reviews.
Date of issueJanuary 2016
ISBN978-0-88975-377-8
CitationPouya Ebrahimi and François Vaillancourt (2016). The Effect of Corporate Income and Payroll Taxes on the Wages of Canadian Workers. Fraser Institute. <http://www.fraserinstitute.org>.
Cover design and creditsDesign Monica ThomasPhoto ©microvector, Shutterstock® (sitting and walking young people)

72 / The Effect of Corporate Income and Payroll Taxes on the Wages of Canadian Workers
fraserinstitute.org
Purpose, Funding, and Independence
The Fraser Institute provides a useful public service. We report objective information about the economic and social effects of current public policies, and we offer evidence-based research and education about policy options that can improve the quality of life.
The Institute is a non-profit organization. Our activities are funded by charitable donations, unrestricted grants, ticket sales, and sponsorships from events, the licensing of products for public distribution, and the sale of publications.
All research is subject to rigorous review by external experts, and is conducted and published separately from the Institute’s Board of Directors and its donors.
The opinions expressed by authors are their own, and do not neces-sarily reflect those of the Institute, its Board of Directors, its donors and supporters, or its staff. This publication in no way implies that the Fraser Institute, its directors, or staff are in favour of, or oppose the passage of, any bill; or that they support or oppose any particular political party or candidate.
As a healthy part of public discussion among fellow citizens who de-sire to improve the lives of people through better public policy, the Institute welcomes evidence-focused scrutiny of the research we publish, including verification of data sources, replication of analytical methods, and intelligent debate about the practical effects of policy recommendations.
Supporting the Fraser Institute
To learn how to support the Fraser Institute, please contact • Development Department, Fraser Institute
Fourth Floor, 1770 Burrard Street Vancouver, British Columbia, V6J 3G7 Canada
• telephone, toll-free: 1.800.665.3558 ext. 586 • e-mail: [email protected] • website: <http://www.fraserinstitute.org/support-us/overview.aspx>

The Effect of Corporate Income and Payroll Taxes on the Wages of Canadian Workers / 73
fraserinstitute.org
About the Fraser Institute
Our mission is to improve the quality of life for Canadians, their families and future generations by studying, measuring and broadly communicat-ing the effects of government policies, entrepreneurship and choice on their well-being.
Notre mission consiste à améliorer la qualité de vie des Canadiens et des générations à venir en étudiant, en mesurant et en diffusant les effets des poli-tiques gouvernementales, de l’entrepreneuriat et des choix sur leur bien-être.
Peer review —validating the accuracy of our researchThe Fraser Institute maintains a rigorous peer review process for its research. New research, major research projects, and substantively modified research conducted by the Fraser Institute are reviewed by experts with a recognized expertise in the topic area being addressed. Whenever possible, external review is a blind process. Updates to previously reviewed research or new editions of previously reviewed research are not reviewed unless the update includes substantive or material changes in the methodology.
The review process is overseen by the directors of the Institute’s re-search departments who are responsible for ensuring all research published by the Institute passes through the appropriate peer review. If a dispute about the recommendations of the reviewers should arise during the Institute’s peer review process, the Institute has an Editorial Advisory Board, a panel of scholars from Canada, the United States, and Europe to whom it can turn for help in resolving the dispute.

74 / The Effect of Corporate Income and Payroll Taxes on the Wages of Canadian Workers
fraserinstitute.org
Members
Past members
Editorial Advisory Board
* deceased; † Nobel Laureate
Prof. Terry L. Anderson
Prof. Robert Barro
Prof. Michael Bliss
Prof. Jean-Pierre Centi
Prof. John Chant
Prof. Bev Dahlby
Prof. Erwin Diewert
Prof. Stephen Easton
Prof. J.C. Herbert Emery
Prof. Jack L. Granatstein
Prof. Herbert G. Grubel
Prof. James Gwartney
Prof. Ronald W. Jones
Dr. Jerry Jordan
Prof. Ross McKitrick
Prof. Michael Parkin
Prof. Friedrich Schneider
Prof. Lawrence B. Smith
Dr. Vito Tanzi
Prof. Armen Alchian*
Prof. James M. Buchanan* †
Prof. Friedrich A. Hayek* †
Prof. H.G. Johnson*
Prof. F.G. Pennance*
Prof. George Stigler* †
Sir Alan Walters*
Prof. Edwin G. West*