corporate presentation september 2017 - amazon s3 · corporate presentation september 2017. ......
TRANSCRIPT

Corporate Presentation
September 2017
Disclaimers
General Advisory
The information contained in this presentation does not purport to be all-inclusive or contain all information that readers may require. Prospective investors are encouraged to conduct their own analysis and review of Source Energy
Services Ltd. (“Source” or the “Company”) and of the information contained in this presentation. Without limitation, prospective investors should read the entire record of publicly filed documents relating to Source, consider the advice
of their financial, legal, accounting, tax and other professional advisors and such factors they consider appropriate in investigating and analyzing Source. An investor should rely only on the information provided by Source and is not
entitled to rely on parts of that information to the exclusion of others. Source has not authorized anyone to provide investors with additional or different information, and any such information, including statements in media articles
about Source, should not be relied upon. In this presentation, unless otherwise indicated, all dollar amounts are expressed in Canadian dollars.
An investment in the securities of Source is speculative and involves a high degree of risk that should be considered by potential investors. Source’s’ business is subject to the risks normally encountered in the oil and gas industry
and, more specifically, the frac sand sector of the oilfield services industry, and certain other risks that are associated with Source’s’ stage of development. An investment in Source’s securities is suitable only for those purchasers
who are willing to risk a loss of some or all of their investment and who can afford to lose some or all of their investment.
Forward-Looking Statements
Certain statements contained in this presentation constitute “forward-looking information” or “forward-looking statements” (collectively, “forward-looking statements”) within the meaning of applicable Canadian and United States securities laws relating
to, without limitation, expectations, intentions, plans and beliefs, including information as to the future events, results of operations and Source’s future performance (both operational and financial) and business prospects. In certain cases, forward-
looking statements can be identified by the use of words such as “expects”, “estimates”, “forecasts”, “intends”, “anticipates”, “believes”, “plans”, “seeks”, “projects” or variations of such words and phrases, or state that certain actions, events or results
“may” or “will” be taken, occur or be achieved. Such forward-looking statements reflect Source’s beliefs, estimates and opinions regarding its future growth, results of operations, future performance (both operational and financial), and business
prospects and opportunities at the time such statements are made, and Source undertakes no obligation to update forward-looking statements if these beliefs, estimates and opinions or circumstances should change. Forward-looking statements are
necessarily based upon a number of estimates and assumptions made by Source that are inherently subject to significant business, economic, competitive, political and social uncertainties and contingencies. Forward-looking statements are not
guarantees of future performance. In particular, this presentation contains forward-looking statements pertaining, but not limited, to: changes to laws and regulations affecting Source’s business; expectations regarding the price of proppants and
sensitivity to changes in such prices; expectations regarding the supply of proppants; outlook for operations; expectations respecting future competitive conditions; industry activity levels; industry conditions pertaining to the frac sand industry; frac sand
costs as a portion of total well costs, logistics costs as a proportion of frac sand landed costs and Source’s objectives, strategies and competitive strengths.
By their nature, forward-looking statements involve numerous current assumptions, known and unknown risks, uncertainties and other factors which may cause the actual results, performance or achievements of Source to differ materially from those
anticipated by Source and described in the forward-looking statements.
With respect to the forward-looking statements contained in this presentation, assumptions have been made regarding, among other things: proppant market prices; future oil, natural gas and natural gas liquids prices; future global economic and
financial conditions; future commodity prices, demand for oil and gas and the product mix of such demand; levels of activity in the oil and gas industry in the areas in which Source operates; the continued availability of timely and safe transportation for
Source’s products, including without limitation, rail accessibility; the maintenance of Source’s key customers and the financial strength of its key customers; the maintenance of Source’s significant contracts or their replacement with new contracts on
substantially similar terms and that contractual counterparties will comply with current contractual terms; operating costs; that the regulatory environment in which Source operates will be maintained in the manner currently anticipated by Source; future
exchange and interest rates; geological and engineering estimates in respect of Source’s resources; the recoverability of Source’s resources; the accuracy and veracity of information and projections sourced from third parties respecting, among other
things, future industry conditions and product demand; demand for horizontal drilling and hydraulic fracturing and the maintenance of current techniques and procedures, particularly with respect to the use of proppants; Source’s ability to obtain
qualified staff and equipment in a timely and cost-efficient manner; the regulatory framework governing royalties, taxes and environmental matters in the jurisdictions in which Source conducts its business and any other jurisdictions in which Source
may conduct its business in the future; future capital expenditures to be made by Source; future sources of funding for Source’s capital program; Source’s future debt levels; the impact of competition on Source; and Source’s ability to obtain financing
on acceptable terms; and, where applicable, each of those assumptions set forth in the footnotes provided herein in respect of particular forward-looking statements
A number of factors, risks and uncertainties could cause results to differ materially from those anticipated and described herein including, among others: the effects of competition and pricing pressures; risks inherent in key customer dependence;
effects of fluctuations in the price of proppants; risks related to indebtedness and liquidity, including Source’s leverage, restrictive covenants in Source’s debt instruments and Source’s capital requirements; risks related to interest rate fluctuations and
foreign exchange rate fluctuations; changes in general economic, financial, market and business conditions in the markets in which Source operates; changes in the technologies used to drill for and produce oil and natural gas; Source’s ability to
obtain, maintain and renew required permits, licenses and approvals from regulatory authorities; the stringent requirements of and potential changes to applicable legislation, regulations and standards; the ability of Source to comply with unexpected
costs of government regulations; liabilities resulting from Source’s operations; the results of litigation or regulatory proceedings that may be brought against Source; the ability of Source to successfully bid on new contracts and the loss of significant
contracts; uninsured and underinsured losses; risks related to the transportation of Source’s products, including potential rail line interruptions or a reduction in rail car availability; the geographic and customer concentration of Source; the ability of
Source to retain and attract qualified management and staff in the markets in which Source operates; labour disputes and work stoppages and risks related to employee health and safety; general risks associated with the oil and natural gas industry,
loss of markets, consumer and business spending and borrowing trends; limited, unfavourable, or a lack of access to capital markets; uncertainties inherent in estimating quantities of mineral resources; sand processing problems; and the use and
suitability of Source’s accounting estimates and judgments.
Although Source has attempted to identify important factors that could cause actual actions, events or results to differ materially from those described in its forward-looking statements, there may be other factors, including those described under the
heading “Risk Factors” in Source’s final prospectus dated April 6, 2017 (the “Final Prospectus”), that cause actions, events or results not to be as anticipated, estimated or intended. There can be no assurance that forward-looking statements will
materialize or prove to be accurate, as actual results and future events could differ materially from those anticipated in such statements. The forward-looking statements contained in this presentation are expressly qualified by this cautionary statement.
Readers should not place undue reliance on forward-looking statements. These statements speak only as of the date of this presentation. Except as may be required by law, Source expressly disclaims any intention or obligation to revise or update any
forward-looking statements or information whether as a result of new information, future events or otherwise.
2

> SOURCE IS A LEADING FULLY INTEGRATED CANADIAN PROPPANT PROVIDER
Source’s Integrated Platform
3
Mining &
Processing
Rail
Shipping
Transload
StorageDelivery Wellsite
▪ Northern White
resource base
▪ Closed-loop wet plants
can operate year round
▪ Annual production
capacity of over three
million metric tonnes
▪ Fleet of over 1280 railcars
▪ Unit train capable
▪ CN origin-destination
paired
▪ Only Source railcars in
fleet – does not manage
customer railcars
▪ Owned and operated
▪ Largest WCSB network
▪ 3.3 million metric
tonnes of throughput
capacity
▪ Identified expansion
opportunities of 1.5
million metric tonnes of
throughput capacity
▪ Logistics team
manages third party
trucking companies to
coordinate deliveries
▪ Active dispatch
monitoring to minimize
load times and pre-
loading of trailers
▪ Captures additional
margins for logistics
services
▪ Sahara provides capability to
ship and store inventory
directly at the wellsite
▪ Source field solutions team
provides wellsite logistics and
quality control
▪ Presence at the wellsite
provides additional revenue
opportunities
Robust
North
American
Market
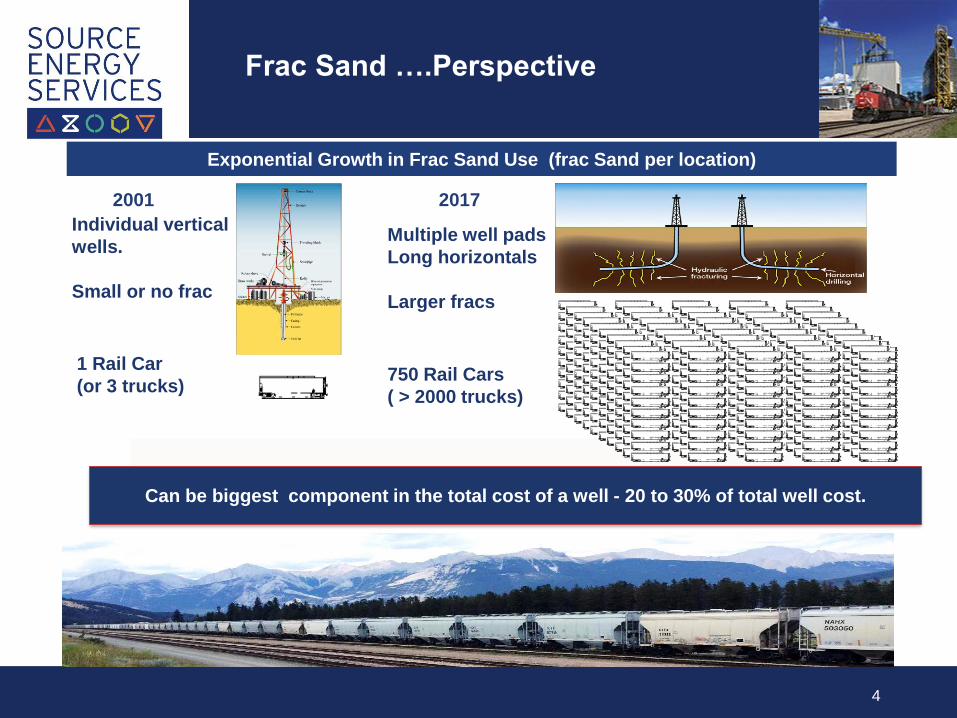
Frac Sand ….Perspective
4
1 Rail Car
(or 3 trucks) 750 Rail Cars
( > 2000 trucks)
Exponential Growth in Frac Sand Use (frac Sand per location)
Individual vertical
wells.
Small or no frac
2001 2017
Multiple well pads
Long horizontals
Larger fracs
Can be biggest component in the total cost of a well - 20 to 30% of total well cost.
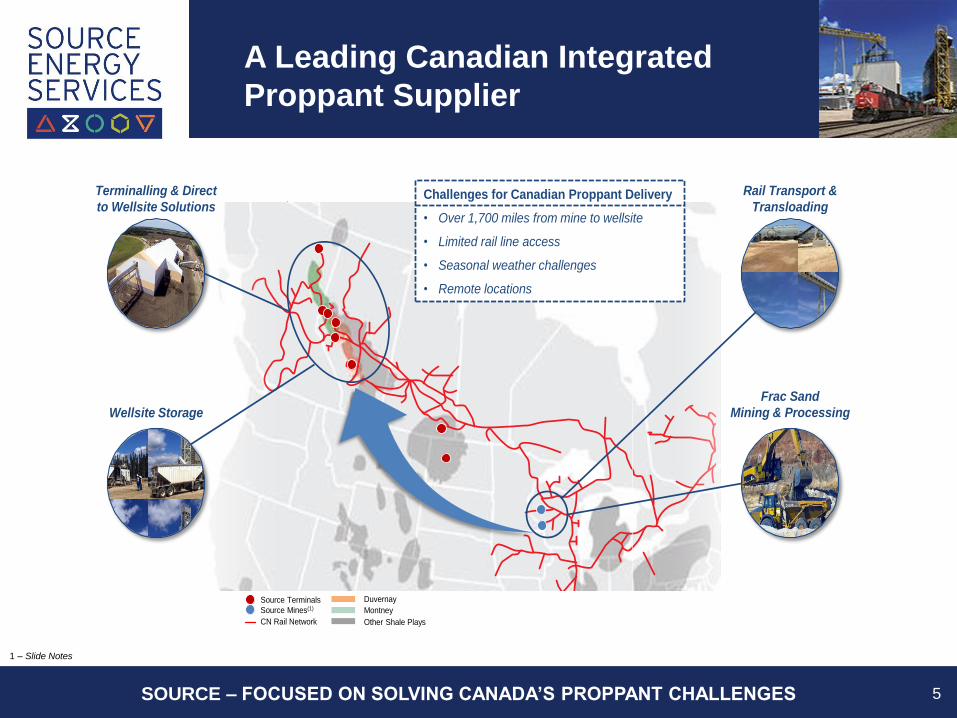
A Leading Canadian Integrated
Proppant Supplier
5
1 – Slide Notes
SOURCE – FOCUSED ON SOLVING CANADA’S PROPPANT CHALLENGES
CN Rail Network
Source Terminals
Source Mines(1)
Wellsite Storage
Terminalling & Direct
to Wellsite Solutions
Rail Transport &
Transloading
Frac Sand
Mining & Processing
Challenges for Canadian Proppant Delivery
• Over 1,700 miles from mine to wellsite
• Limited rail line access
• Seasonal weather challenges
• Remote locations
Duvernay
Montney
Other Shale Plays

The Importance of Logistics
6Cost of logistics can represent more than 80% of cost of sand landed in WCSB
Mining
Rail Shipping
Transloading
Trucking to Well
Well Site Storage &
Handling
Rail Car
Leasing
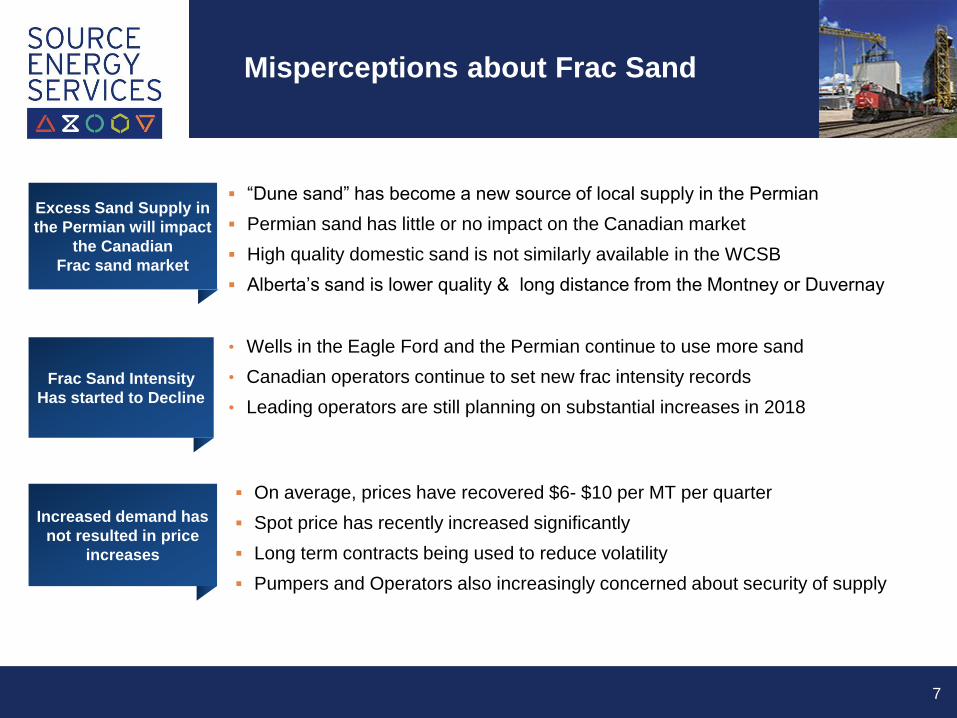
Misperceptions about Frac Sand
7
▪ “Dune sand” has become a new source of local supply in the Permian
▪ Permian sand has little or no impact on the Canadian market
▪ High quality domestic sand is not similarly available in the WCSB
▪ Alberta’s sand is lower quality & long distance from the Montney or Duvernay
Excess Sand Supply in
the Permian will impact
the Canadian
Frac sand market
▪ On average, prices have recovered $6- $10 per MT per quarter
▪ Spot price has recently increased significantly
▪ Long term contracts being used to reduce volatility
▪ Pumpers and Operators also increasingly concerned about security of supply
Increased demand has
not resulted in price
increases
• Wells in the Eagle Ford and the Permian continue to use more sand
• Canadian operators continue to set new frac intensity records
• Leading operators are still planning on substantial increases in 2018
Frac Sand Intensity
Has started to Decline
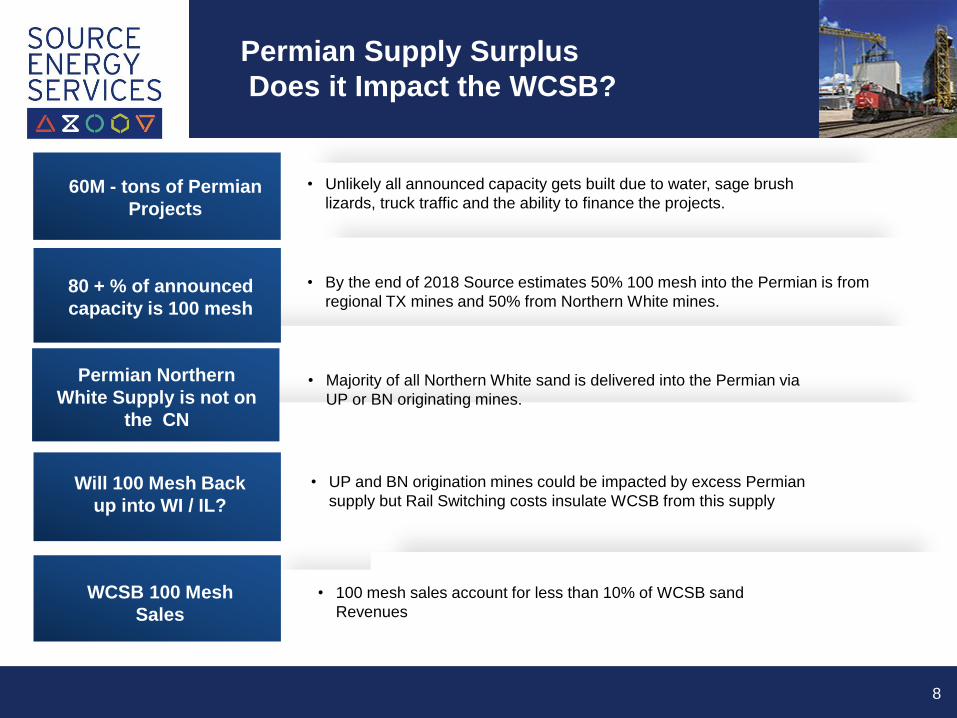
Permian Supply Surplus
Does it Impact the WCSB?
8
• Unlikely all announced capacity gets built due to water, sage brush
lizards, truck traffic and the ability to finance the projects.
Increasing Horizontal
Well Count
Will 100 Mesh Back
up into WI / IL?
Permian Northern
White Supply is not on
the CN
80 + % of announced
capacity is 100 mesh
60M - tons of Permian
Projects
• By the end of 2018 Source estimates 50% 100 mesh into the Permian is from
regional TX mines and 50% from Northern White mines.
• Majority of all Northern White sand is delivered into the Permian via
UP or BN originating mines.
• UP and BN origination mines could be impacted by excess Permian
supply but Rail Switching costs insulate WCSB from this supply
Estimated Impact
to SHLE
WCSB 100 Mesh
Sales
• 100 mesh sales account for less than 10% of WCSB sand
Revenues

Capex forecasted to increase by approximately 55%
from 2016 – 2017 for key Canadian resource plays(2)
Industry moving to longer laterals to improve rate &
recovery via increased reservoir contact
Stages per well have increased >40%
basin-wide since 2013(1)
Increased proppant intensity driving improved economics
Increasing Horizontal
Well Count
Longer Laterals
Tighter
Stage Spacing
Increasing
Proppant per Stage
Drivers of Increasing
Proppant Demand in the WCSB
9
Established Industry Trends Result in
Increased Proppant Demand
1, 2 – Slide Notes
Canadian Proppant Demand is Expected
to Grow
3.2mm MT 5.9mm MT
(see slide 9 for details)
2015 2018E Midpoint
Intensity increases will
likely result in 2018
volumes in excess of
recent estimates

Canadian Proppant Demand
- Continuing to Increase-
10> PROPPANT DEMAND POISED TO INCREASE DUE TO INCREASED FRAC INTENSITY
AND WELL COUNT
1, 2, 3, 4 – Slide Notes
Estimated Canadian Proppant Demand by Play(1)(2)(3)(4)
Million Metric Tonnes
2.4
3.7
3.2
2.4
0.0
1.0
2.0
3.0
4.0
5.0
6.0
7.0
8.0
2013 2014 2015 2016 2017E 2018E
Historical Completion Intensity Modern Completion Intensity
Montney
Duvernay
Deep Basin
Viking
Cardium
Bakken/Torquay
Midale/Shaunavon
Higher Frac Intensity
Lower Frac Intensity
90th Percentile
Proppant Intensity
(Q1 2016 Data)
Flat
Proppant Intensity
(Q1 2016 Data)
5 leading operators
report well intensity of
> 5,000 MT in Q1 17(3)
P90 projections for
2018 could exceed
9.0 MM Tonnes
2018 Potential based on
2017 intensity increases

Sand Pricing in the WCSB
11
• Increase in WCSB frac sand demand has resulted in strong
price response
• Prices have recovered $6 - $10 per MT per quarter
• Some operators have commented about 40% price increases
in 2017
• Spot pricing in Montney rumored to be as high as $225 per
MT
• Customers are entering into contacts that protect them from
price volatility and afford greater certainty of supply
Current Pricing Trends
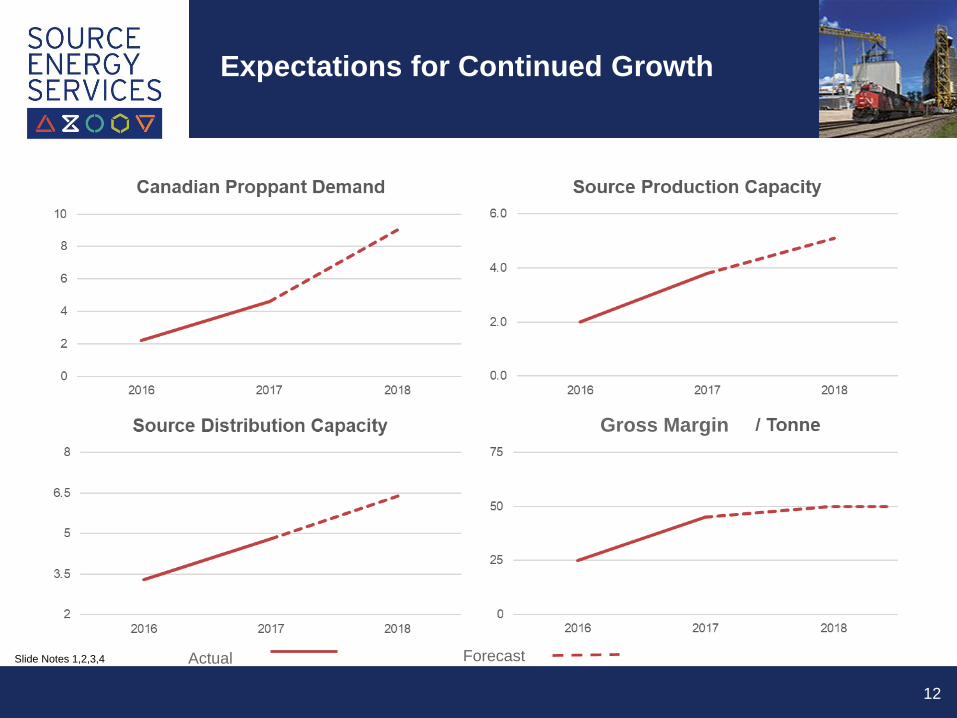
Expectations for Continued Growth
12
Gross Margin
Slide Notes 1,2,3,4 Actual Forecast
Disclaimers
Non-IFRS Measures
In addition to using financial measures prescribed by International Financial Reporting Standards (“IFRS”), references are made in this presentation to “Adjusted
EBITDA”, “EBITDA” and “Adjusted Gross Margin”, which are measures that do not have any standardized meaning as prescribed by IFRS. Accordingly, Source’s use of
such terms may not be comparable to similarly defined measures presented by other entities and comparisons should not be made between such measures provided
by the Company and by other companies without also taking into account any differences in the way that the calculations were prepared.
Adjusted EBITDA represents, for the period presented, EBITDA as adjusted to add back or deduct, as applicable, the following expenses, costs, charges or benefits
incurred in such period which in management’s view are not indicative of the underlying business performance: (a) finance expense excluding interest expense; (b)
Management Fee; (c) fair value adjustment of the Shareholder loan; (d) loss (gain) on asset disposal; (e) loss (gain) on impairment; (f) transaction and professional
fees; (g) loss (gain) on derivative liability; and (h) gain on settlement of deferred revenue (i) stock based compensation. The reconciliation of Net Income to EBITDA and
Adjusted EBITDA is found in Source’s final prospectus dated April 6, 2017 on page FS42 for the years ended December 31, 2014, 2015 and 2016. The reconciliation
of Net Income to EBITDA and Adjusted EBITDA for the three and six ended June 30, 2017 and June 30,2016 is found in Source’s second quarter MD&A. Source’s
prospectus and second quarter MD&A are found on SEDAR and on the Company’s website.
EBITDA represents, for the period presented, net income (loss) plus: (a) income taxes; (b) interest expense; (c) cost of sales – depreciation; (d) depreciation; and (e)
amortization, in each case to the extent deducted from net income in such period determined on a combined basis in accordance with IFRS.
Adjusted Gross Margin represents, for the period presented, gross margin plus costs of sales – depreciation. The reconciliation of gross margin to adjusted gross
margin for the years ended December 31, 2014, 2015 and 2016 is found in Source’s final prospectus dated April 6, 2017 on page FS42. The reconciliation of Gross
Margin to Adjusted Gross Margin for the three and six ended June 30, 2017 and June 30,2016 is found in Source’s second quarter MD&A. Source’s prospectus and
second quarter MD&A are found on SEDAR and on the Company’s website.
13
Slide Notes
14
Slide 5 (The Leading Canadian Integrated Proppant Supplier)--------
1) Includes the Sumner Facility and the Blair Facility.
Slide 12 (Canadian Proppant Demand is Increasing)---------------------
1.)The demand for proppant for 2016 is estimated by multiplying the
historical number of wells drilled based on data provided by geoSCOUT
as of January 25, 2017 in each play by the average amount of proppant
pumped per well, by play, using data for the first quarter of 2016 to
calculate proppant intensity from the data (based on data provided by
the Well Completions & Frac Database as of January 18, 2017).
2) This forecast is based on the assumption that an increase in
producers’ overall capital expenditures will yield a proportional increase
in the number of wells drilled. However, the actual increase in wells
drilled could differ from the increase in capital expenditures in the event
of a relatively greater increase in non-drilling capital expenditures, such
as facility construction or maintenance.
3.) Source’s production capacity, distribution capacity and gross margin
beyond 2017 are based on management’s estimates. The increase in
production includes the potential expansion of the Blair Mine. The
distribution increase includes the previously announced terminal
expansions being completed.
4) Although Source believes the above assumptions and forecasts to be
reasonable, there can be no assurance that these assumptions and
forecasts are accurate, and, as such, undue reliance should not be
placed thereon. See “Forward-Looking Statements” herein and “Risk
Factors” in the Final Prospectus.