corporate presentation...corporate presentation march 2018. 2 forward-looking statements this...
TRANSCRIPT

CORPORATE PRESENTATION
March 2018
2
Forward-looking Statements
This presentation contains projections and
other forward-looking statements within the
meaning of Section 27A of the U.S.
Securities Act of 1933 and Section 21E of
the U.S. Securities Exchange Act of 1934.
These projections and statements reflect the
Company’s current views with respect to
future events and financial performance. No
assurances can be given, however, that
these events will occur or that these
projections will be achieved, and actual
results could differ materially from those
projected as a result of certain factors. A
discussion of these factors is included in the
Company’s periodic reports filed with the
U.S. Securities and Exchange Commission.
Contact:
Karen AciernoDirector – Investor [email protected]
Cimarex Energy Co.1700 Lincoln Street, Suite 3700Denver, CO 80203303-295-3995

3
Who is Cimarex?
1 As of February 14, 20182 As of and for the twelve months ended 12/31/17. See Appendix for non-GAAP definitions and reconciliations to nearest comparable GAAP measure.
Market Cap1 $ 10 billion
Debt/Adj. EBITDA2 1.3x
Production (4Q 17) 201 MBOE/d
Proved Reserves (YE 17) 559 MMBOE
— % Natural gas 48%
— % Proved Developed 83%
— R/P Ratio 8.0x
Quarterly Dividend $0.16/share

4
Returns drive our decisions
Balanced portfolio of assets
– Premier position in the Delaware Basin and Mid-Continent region
– Flexibility through commodity cycles
Continuous idea generation
Strong, disciplined execution
Solid financial position
– Conservative debt levels and ample liquidity
– $401 million in cash at December 31, 2017
What’s Important

5
Improved well performance
– Enhanced completion design
– Allows tighter development well spacing
Six successful spacing pilots announced in 2017
– Additional spacing tests underway
14-wells/section Lower Wolfcamp in Culberson County
18-wells/section Upper Wolfcamp in Reeves County
Wolfcamp and Avalon tests in Lea County, NM
Woodford spacing in Lone Rock
Result: infill development that preserves returns while adding locations (NPV)
2017 Achievements

6
Debt-adjusted production growth per share of 15% year-over-year
Oil led the way growing 27% and grew 36% 4Q17 vs 4Q16
Total E&D capital – $1.28 billion
– D&C capital of $980 million
– 98 net wells brought on production
Proved reserves – 559 MMBOE
– Increase of 16%: PUDs now17% of total proved
– Replaced 211% of 2017 production
30%
25%
45%
Oil NGL Natural Gas
2017 Growth in Production and Reserves
Proved Reserves(MMBOE)
416
522485 482
559
2013 2014 2015 2016 2017
Oil NGL Natural Gas
Daily Production(MBOE)
Total190 MBOE/D

7
26
18
30
24
47
1QA 2QA 3QA 4QA Wells Drilling &Waiting on
Completion at12/31/17Permian Basin Mid-Continent
2017 Net Wells Online
98 net wells completed in 2017

8
High return projects expected to generate 2018 production growth of 11 – 16%
Oil expected to grow 21 – 26% in 2018
– Oil growth estimated at 29 – 34% 4Q18 vs 4Q17
Return driven production growth continues in 2018
Daily Production(MBOE)
30%31% 28%
30%33%
145
164 161
190
211-221
2014 2015 2016 2017 2018E
Oil NGL Natural Gas

9
E&D Capital of $1.6 – 1.7 billion
– 29% increase from 2017
– Within cash available
D&C Capital $1.3 – 1.4 billion
– 82% of Total E&D capital
– Permian Basin ~70%
– Mid-Continent Region ~30%
Additional $80 – 90 million budgeted for midstream
Currently operating 14 rigs
– Ten in Permian
– Four in Mid-Continent
2018 Capital Investment Program
Wolfcamp
Bone Spring
Avalon
Woodford
Meramec
Other
D&C Capital$1.3 – 1.4 billion

10
13
32
51
31
48
1QE 2QE 3QE 4QE Wells Drilling &Waiting on
Completion at12/31/18
Permian Basin Mid-Continent
2018 Net Wells Online
127 net wells planned in 2018

11
2018 Delaware Basin Plans
Wolfcamp
Avalon
Bone Spring
$890 – 940mm
Total D&C Capital
Reeves
Culberson
Lea
Eddy
Ward
Economies of Scale
Multi-well
Single well
83 Net Wells
Wells Drilled by Area
~90% multi-well drilling or takes advantage of existing facilities

12
~216,000 net acres in the fairway
Multiple Wolfcamp Targets
– Culberson/White City Area
~100,000+ net acres
Upper & Lower Wolfcamp
JDA with Chevron
– Reeves County
~63,000 net acres
Upper Wolfcamp
– Lea County
~32,000 net acres
– Ward County
~16,000 net acres
188 total Wolfcamp wells drilled
– 103 long laterals (>7,000’)
Delaware Basin Wolfcamp Overview
2017/18 wells
Lower Wolfcamp
Upper Wolfcamp
Bone Spring
13
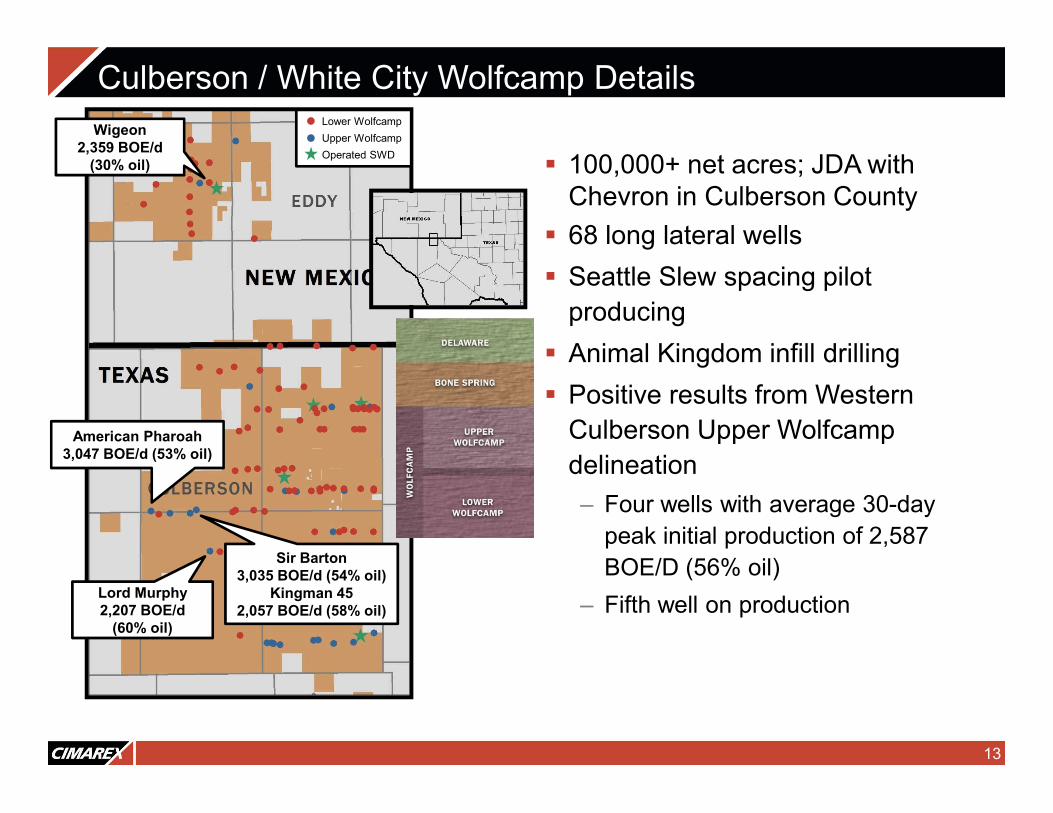
100,000+ net acres; JDA with Chevron in Culberson County
68 long lateral wells
Seattle Slew spacing pilot
producing
Animal Kingdom infill drilling
Positive results from Western
Culberson Upper Wolfcamp
delineation
– Four wells with average 30-day
peak initial production of 2,587
BOE/D (56% oil)
– Fifth well on production
Culberson / White City Wolfcamp DetailsLower Wolfcamp
Upper Wolfcamp
Operated SWD
American Pharoah3,047 BOE/d (53% oil)
Wigeon2,359 BOE/d
(30% oil)
Lord Murphy2,207 BOE/d
(60% oil)
Sir Barton3,035 BOE/d (54% oil)
Kingman 452,057 BOE/d (58% oil)

14
Changes to completion design have resulted in better wells
Fifteen wells with new frac design have average 30-day peak IP of 2,172 BOE/D (52% oil)
– ~30% increase in first year cumulative production
Now testing new landings within Upper Wolfcamp zone
Improving Upper Wolfcamp Results
0
100
200
300
400
500
600
700
0 60 120 180 240 300 360
Days
Old Completion New Completion
Cumuative Production(MBOE)
Culberson Area Long Lateral Upper Wolfcamp

15
Production Improvement - Upper Wolfcamp
731
871
1,239
1,482
1,749
0
500
1,000
1,500
2,000
2013 2014 2015 2016 2017
5,058 5,309 6,926 8,409 9,750Average Lateral
Length (ft)
180 day Average Daily Production per Well(BOE)
Delaware Basin Upper Wolfcamp Wells

16
Resilient Long Lateral ReturnsCulberson Long Lateral Wolfcamp
0%
50%
100%
150%
200%
$30 $40 $50 $60 $70
Realized Oil Price
Upper Wolfcamp - $2/Mcf Lower Wolfcamp - $2/Mcf
Upper Wolfcamp - $1/Mcf Lower Wolfcamp - $1/Mcf
BTAX IRR*
*Assumes full NGL recovery, NGL price is 30% of oil price

17
Tim Tam infill wells generated 67%+ ATAX return
Infills have surpassed parent wells in both landing zones
Results lead to 14 wells per section test
– Animal Kingdom now drilling
-
100
200
300
400
500
600
700
0 60 120 180 240 300 360
Days
Parent well (lower landing)
Tim Tam Infill well (lower landing)
Parent well ( upper landing)
Tim Tam Infill well (upper landing)
Culberson County – Tim Tam Development
1,756’
1,756’200’
Low
er
Wolfca
mp
Tim Tam spacing
Cumulative Production(MBOE)
Lower Wolfcamp
1,216’
1,216’225’
Low
er
Wolfca
mp
Animal Kingdom spacing
225’

18
Similar, strong early cumulative per well production testing 6, 8 or 12 wells per section
Upper Wolfcamp development to begin in 2018
– Two developments planned
0
100
200
0 60 120 180
Days
Gato average well (6 wells/section)
Sunny's average well (8 wells/section)
Seattle Slew average well (12 wells/section)
Culberson County – Upper Wolfcamp Development
Extrapolated Average Cumulative Production per 7,500 ft well (MBOE)

19
32 long lateral wells
– Targeting Upper Wolfcamp
26 – 10,000 ft laterals producing
– Average 30-day peak IP of 1,774 BOE/D (49% oil)
Two downspacing pilots producing
– Wood State (12 wells/section)
– Pagoda State (16 wells/section)
Snowshoe development drilling
– 8 wells; 3 landings (18 wells/section)
Reeves County Focus Area
Wood State
Snowshoe
Pagoda State
Upper Wolfcamp
Operated SWD

20
Upper Wolfcamp
– 10,000 ft laterals
Wood State: 6 wells testing 12 wells per section
– Surpassed Big Timber, previously best long lateral to date
– Average well performing 28% above parent well
Pagoda State: 4 wells testing 16 wells per section
– Average well performing 20% above parent well
Reeves County – Strong Infill Well Results
Pagoda spacing
680’
680’
340’
Uppe
r W
olfc
am
p
Wood State spacing
880’
880’
340’
Uppe
r W
olfca
mp
0
100
200
300
400
500
600
0 60 120 180 240 300 360
Days
Big Timber well
Wood State parent well
Average Wood State well
Average Pagoda State well
Daily Production(MBOE)

21
Exciting multi-pay area
$225 million capital spend in 2018
Avalon activity
– 24,000 net prospective acres
– Triste Draw infill spacing pilot currently drilling
Wolfcamp activity
– 32,000 net prospective acres
– Hallertau infill spacing pilot waiting on completion
Lea County
Red Hills
Red Tank
Triste Draw
Hallertau
Upper Wolfcamp
Avalon
Bone Spring

22
Mid-Continent Basin 2018 Outlook
MeramecWoodford
$370 – 420 million
Total D&C Capital
Meramec
Lone Rock
Other Woodford
Economies of Scale
Multi-well
Single well
43 Net Wells
Activity by Area
~75% multi-well drilling takes advantage of existing facilities

23
Meramec and Woodford Stacked Targets
Meramec: 116,500 net prospective acres
– 100% HBP
Woodford: 136,500 net undeveloped acres (88% HBP)
Mid-Continent Overview
Cana core
Meramec play outline
Woodford play outline

24
52 wells producing with average lateral length of ~7,100 ft– Average 30-day IP of 1,742 BOE/D
(38% oil)
Thirteen – 10,000 ft lateral wells brought online in 2017– Average 30-day IP of 2,383 BOE/D
(37% oil)
28 downspacing pilots online or underway in the play– XEC has interest or data on all but
four
Formulating development plans in the 14N-10W area– Stacked Meramec & Woodford
– Operated almost all of the 24,000 acres leased
– Average 62% working interest
Meramec – The Big Picture
5,000 ft Meramec
10,000 ft Meramec
Meramec play outline
Tillman BIA 1H2,389 BOE/d
(45% oil)
Dupree BIA 1H2,877 BOE/d
(56% oil)
Rocky 1-17H1,912 BOE/d
(67% oil)
Woolfolk 2H2,878 BOE/d
(18% oil)
14N10W
Mike Com 1H4,353 BOE/d
(10% oil)

25
2018 developments
– Steve O - developing remaining section with 8 well spacing
– Lehman - developing remaining section with 8 well spacing
– Miss Mary - testing landing zone with 8 well spacing
Future14N-10W develoment
– Stacked Meramec/Woodford
– Successfully tested 19 wells per section (Leon Gundy)
– Positive results with zone completion sequence at Woolfolk/NIB
Another zone completion test planned
Meramec Development Plans
5,000 ft Meramec
10,000 ft Meramec
Meramec play outline
14N10W
Steve O
Lehman
Miss Mary
Woolfolk /NIB
Mike Com 1H

26
Long history of activity
Emerging Lone Rock play yielding best results to date
Clyde Copeland high density spacing pilot yielding good results
Formulating development plans in the 14N-10W area
Long lateral Leota Jacobs infill deferred to 2019
Woodford Activity
Operated well
Non-operated well
Clyde Copeland
Lone Rock
14N10W
Leota Jacobs

27
Increased density pilot
– 8 wells testing 16 and 20 wells per section
Results positive for future well spacing
– Interference testing on-going
Clyde Copeland Results
0
50
100
150
200
0 30 60 90 120 150 180
Days
Average well (20 well spacing)
Average well (16 well spacing)
Average parent well (9 well spacing)
Cumulative Production(MBOE)
Woodford
Osage
330’16 well spacing
80’
528’20 well spacing
Clyde Copeland development

28
Best Woodford returns in portfolio
~16,000 net contiguous acres
Multiple completion design factors enhance productivity
Infill testing:
– Shelly testing 8 and 12 wells per section (currently drilling)
– JD Hoppinscotch testing 8 wells per section in Woodford
Lone Rock Activity
Shelly
Hines Federal 1H17.2 MMcfed (38% oil)
Meyers 1H13.4 MMcfed (24% oil)
Jimmie Com10.2 MMcfed (22% oil)
Woodford
0
100
200
300
0 30 60 90 120 150 180 210
Days
1st Gen (~1,440 lb/ft)
2nd Gen (~2,800 lb/ft)
3rd Gen (~2,800 lb/ft)
Average Cumulative Production per Well(MBOE)
Woodford 440’
12 well spacing
660’
8 well spacing
Shelly Spacing
JD Hoppinscotch
Woodford640’
JD Hoppinscotch Spacing
160’
Meramec

29
Solid returns from large portfolio
Strong financial position
– $401 million of cash on the balance sheet at 12/31/17
Emphasis on execution
– Preserve returns in inflationary environment
Idea generation
– Technical enhancements to completion design
– Testing even tighter infill well spacing
Ultimate field optimization provides best returns to shareholders
Well-positioned for 2018

30
Appendix

31
2018 Guidance
First Quarter Full Year
Daily Production (BOE) 198 – 207 211 – 221
% Oil 33%
Capital Expenditures ($billion)
E & D $1.6 – 1.7
D & C $1.3 – 1.4
Midstream $0.08 – 0.09
Expenses ($/BOE)
Production $3.75 – 4.35
Transportation, processing & other $3.20 – 3.80
DD&A and ARO accretion $7.50 – 8.10
General and administrative $1.20 – 1.50
Taxes other than income (% of oil and gas revenue) 5.0 – 5.5%

32
Hedges as of February 14, 20182018 2019
First Quarter
Second Quarter
Third Quarter
Fourth Quarter
First Quarter
Second Quarter
Third Quarter
OIL
WTI Oil Collars1
Volume (Bbl/d) 29,000 29,000 25,000 19,000 13,000 13,000 6,000
Weighted Average Floor 47.28 47.83 47.48 48.63 48.92 48.92 50.00
Weighted Average Ceiling 56.33 57.93 57.76 58.80 61.04 61.04 66.82
WTI Swaps2
Volume (Bbl/d) 13,000 14,000 14,000 9,000 6,000 6,000 1,000
Weighted Average Differential3 (0.72) (0.72) (0.72) (0.59) (0.51) (0.51) (0.70)
GAS
PEPL Collars4
Volume (MMBtu/d) 130,000 120,000 90,000 60,000 50,000 50,000 20,000
Weighted Average Floor 2.57 2.39 2.33 2.28 2.23 2.23 1.98
Weighted Average Ceiling 2.93 2.70 2.56 2.49 2.46 2.46 2.16
El Paso Perm Collars5
Volume (MMBtu/d) 90,000 90,000 70,000 50,000 40,000 40,000 20,000
Weighted Average Floor 2.52 2.22 2.14 2.06 1.98 1.98 1.65
Weighted Average Ceiling 2.84 2.48 2.32 2.23 2.14 2.14 1.80
Total Natural Gas Collars
Volume (MMBtu/d) 220,000 210,000 160,000 110,000 90,000 90,000 40,000
Notes:1 WTI refers to West Texas Intermediate oil prices as quoted on the New York Mercantile Exchange 4 PEPL refers to Panhandle Eastern Pipe Line Tex/OK Mid-Continent as quoted on Platt’s Inside FERC 2 Index price on basis swaps is WTI Midland as quoted by Argus Americas Crude 5 El Paso Perm refers to El Paso Permian Basin index as quoted on Platt’s Inside FERC3 Index price on basis swaps is WTI NYMEX less weighted average differential shown in table

33
Permian Region Production
Daily Production(MBOE)
68
74
81
99
94
87
80
85 86 85
96
107105
112
0
25
50
75
100
Q3 14 Q4 14 Q1 15 Q2 15 Q3 15 Q4 15 Q1 16 Q2 16 Q3 16 Q4 16 Q1 17 Q2 17 Q3 17 Q4 17
Oil NGL Natural Gas

34
Mid-Continent Region Production
Daily Production(MBOE)
6864
5856
54
64
70
65
5963
70
85 8588
0
25
50
75
Q3 14 Q4 14 Q1 15 Q2 15 Q3 15 Q4 15 Q1 16 Q2 16 Q3 16 Q4 16 Q1 17 Q2 17 Q3 17 Q4 17
Oil NGL Natural Gas

35
Efficiency Gains Continue in LOE
$0.81 $0.62 $0.49 $0.44
$1.63 $1.49
$1.30 $1.17
$0.83
$0.61
$0.28 $0.37
$1.97
$1.45
$1.15 $1.11
$1.25
$0.83
$0.73 $0.68
$6.48
$5.00
$3.95 $3.77
2014 2015 2016 2017
Compressor Rental & Repair Labor/OtherWater Disposal Repairs, Maintenance, Chemicals & RentalsWorkovers
$/BOE

36
Non-GAAP Reconciliation
Reconciliation of Net Income to EBITDA and Adjusted EBITDA1
($ in Millions) 2014 2015 2016 2017
Net income (loss) $ 526 $(2,580) $ (409) $ 494
Income tax expense (benefit) 310 (1,472) (214) 188
Interest expense, net of capitalized 37 55 62 52
DD&A and ARO accretion 786 741 400 462
EBITDA 1,659 (3,256) (161) 1,196
Impairment of oil and gas - 4,033 758 -
Adjusted EBITDA 1,659 778 597 1,196
1The above table provides a reconciliation from generally accepted accounting principles (GAAP) net income (loss) to non-GAAP EBITDA and non-GAAP adjusted EBITDA, which excludes ceiling test impairments
Debt Adjusted Shares (Using trailing 12-mo (TTM) stock price)
2016 2017
Basic shares outstanding (in 000s) 95,124 95,437
Debt adjusted shares outstandingYE Debt, net
TTM stock price847,124
115.071,099,466
114.00
Equivalent shares issued using TTM stock price 7,362 9,644
Debt adjusted shares using TTM stock price 102,485 105,082

37
Non-GAAP Reconciliation
Reconciliation of cash flow from operations1
Three months Ended Dec 31
($ in Millions) 2017 2016
Net cash provided by operating activities $ 341 $ 185
Change in operating assets and liabilities
16 34
Adjusted cash flow from operations $ 357 $ 219
Finding & development (F&D) cost
2017
Additions to proved reserves (MMBOE)
Revisions of previous estimates (10.0)
Extensions & discoveries 156.8
Purchase of reserves 0.2
Total Additions (all sources) 147.0
Total Capital ($MM) $ 1,281
F&D Costs (all sources) ($/BOE) $ 8.71
Drilling F&D cost (extensions & discoveries) ($/BOE) $ 8.17
Debt/Cap calculation
($ in Millions)Dec 31,
2017
Long-term debt (principal) $ 1,500
Stockholders equity 2,568
Total capitalization 4,068
Long-term debt/total capitalization 37%
Debt/Adjusted EBITDA calculation
Twelve monthsEnded Dec 31
($ in Millions) 2015 2016 2017
Long-term debt (principal)
$1,500 $1,500 $1,500
Adjusted EBITDA 778 597 1,196
Debt/Adjusted EBITDA 1.9x 2.5x 1.3x
1Management uses the non‐GAAP measure of adjusted cash flow from operations as a means of measuring the company's ability to fund its capital program and dividends, without fluctuations caused by changes in current assets and liabilities, which are included in the GAAP measure of cash flow from operating activities. Management believes this non‐GAAP measure provides useful information to investors for the same reasons, and that it is also used by professional research analysts in providing investment recommendations pertaining to companies in the oil and gas exploration and production industry.
38
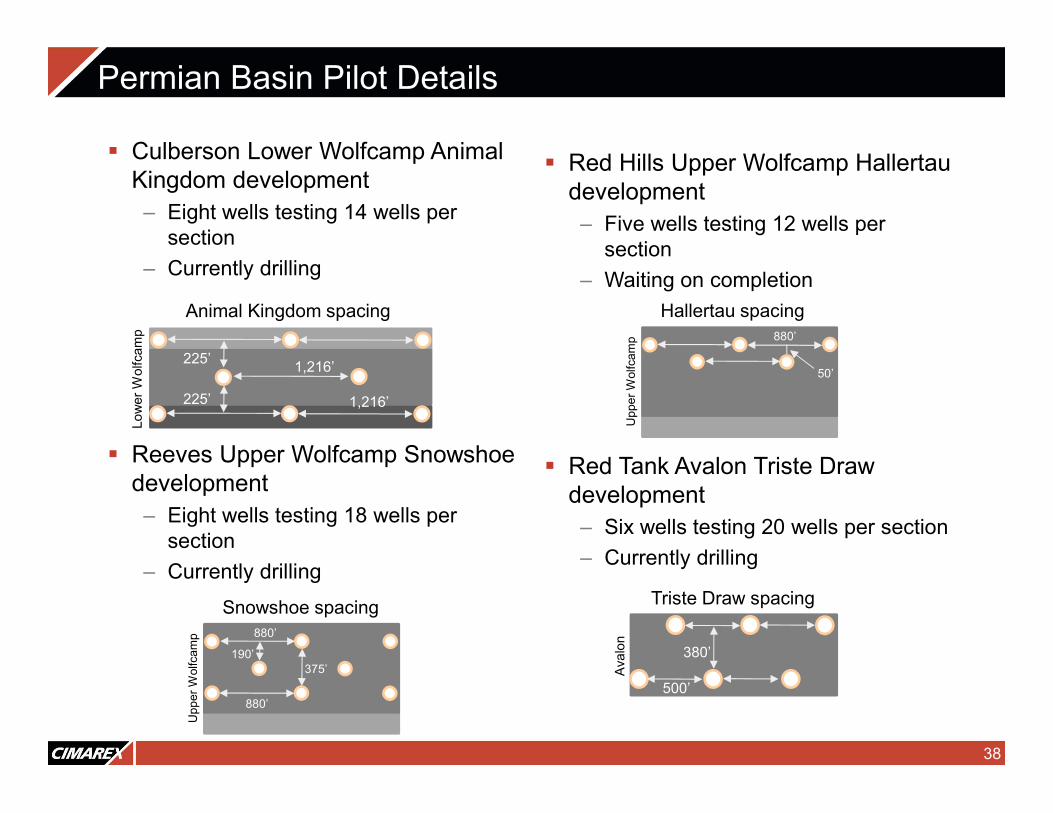
Culberson Lower Wolfcamp Animal Kingdom development
– Eight wells testing 14 wells per section
– Currently drilling
Reeves Upper Wolfcamp Snowshoe development
– Eight wells testing 18 wells per section
– Currently drilling
Red Hills Upper Wolfcamp Hallertaudevelopment
– Five wells testing 12 wells per section
– Waiting on completion
Red Tank Avalon Triste Draw development
– Six wells testing 20 wells per section
– Currently drilling
Permian Basin Pilot Details
1,216’
1,216’225’
Low
er
Wolfca
mp
Animal Kingdom spacing
225’
Snowshoe spacing880’
880’
375’
Upp
er
Wolfc
am
p
190’
500’
380’
Ava
lon
Triste Draw spacing
Hallertau spacing880’
Uppe
r W
olfca
mp
50’