corporate presentation as of 3q17 · corporate presentation as of 3q17. this presentation includes...
TRANSCRIPT

January 2018
Corporate Presentation as of 3Q17

This presentation includes forward-looking statements. We have based these forward-looking statements largely on our current beliefs, expectations and projections about future
events and financial trends affecting our business and our market. Many important factors could cause our actual results to differ substantially from those anticipated in our forward-
looking statements, including: political, social and macroeconomic conditions in Latin America; currency exchange rates and inflation; current competition and the emergence of new
market participants in our industry; government regulation; our expectations regarding the continued growth of internet usage and e-commerce in Latin America; failure to maintain
and enhance our brand recognition; our ability to maintain and expand our supplier relationships; our reliance on technology; the growth in the usage of mobile devices and our ability
to successfully monetize this usage; our ability to attract, train and retain executives and other qualified employees; and our ability to successfully implement our growth strategies.
We operate in a competitive and rapidly changing environment. New risks and uncertainties emerge from time to time, and it is not possible for us to predict all risks and uncertainties
that could have an impact on the forward-looking statements contained in this presentation. The words “believe,” “may,” “should,” “aim,” “estimate,” “continue,” “anticipate,” “intend,”
“will,” “expect” and similar words are intended to identify forward-looking statements. Forward-looking statements include information concerning our possible or assumed future
results of operations, business strategies, capital expenditures, financing plans, competitive position, industry environment, potential growth opportunities, the effects of future
regulation and the effects of competition. Forward-looking statements speak only as of the date they are made, and we undertake no obligation to update publicly or to revise any
forward-looking statements after the date of this presentation because of new information, future events or other factors, except as required by law. In light of the risks and
uncertainties described above, the future events and circumstances discussed in this presentation might not occur or come into existence and forward-looking statements are thus not
guarantees of future performance. Considering these limitations, you should not make any investment decision in reliance on forward-looking statements contained in this
presentation.
This presentation includes industry, market and competitive position data and forecasts that we have derived from independent consultant reports, publicly available information,
industry publications, official government information, other third-party sources and our internal data and estimates. Independent consultant reports, industry publications and other
published sources generally indicate that the information contained therein was obtained from sources believed to be reliable. The inclusion of market estimations in this presentation
is based upon information obtained from third-party sources and our understanding of industry conditions. Although we believe that this information is reliable, the information has not
been independently verified by us. Trademarks and service marks appearing in this presentation are the property of their respective holders. This presentation includes data from
Euromonitor. Information sourced to Euromonitor is from independent market research carried out by Euromonitor International Limited as part of its annual Passport research.
Euromonitor makes no warranties about the fitness of this intelligence for investment decisions.
This presentation is strictly confidential, is for informational purposes only and may not be relied upon in connection with the purchase or sale of any security. You may not disclose
any of the information contained herein to any other parties without the company’s prior express written permission. This presentation is made pursuant to Section 5(d) of the
Securities Act of 1933, as amended, and is intended solely for investors that are either qualified institutional buyers or institutions that are accredited investors (as such terms are
defined under Securities and Exchange Commission (“SEC”) rules) solely for the purpose of determining whether such investors might have an interest in a securities offering
contemplated by Despegar.com, Corp. Any such offering of securities will only be made by means of a registration statement (including a prospectus) filed with the SEC, after such
registration statement is declared effective. No such registration statement has been declared effective as of the date of this presentation. This presentation shall not constitute an
offer to sell or the solicitation of an offer to buy these securities, nor shall there be any sale of these securities in any state or jurisdiction in which such offer, solicitation or sale would
be unlawful prior to registration or qualification under the securities laws of any such state or jurisdiction.
2
Disclaimer
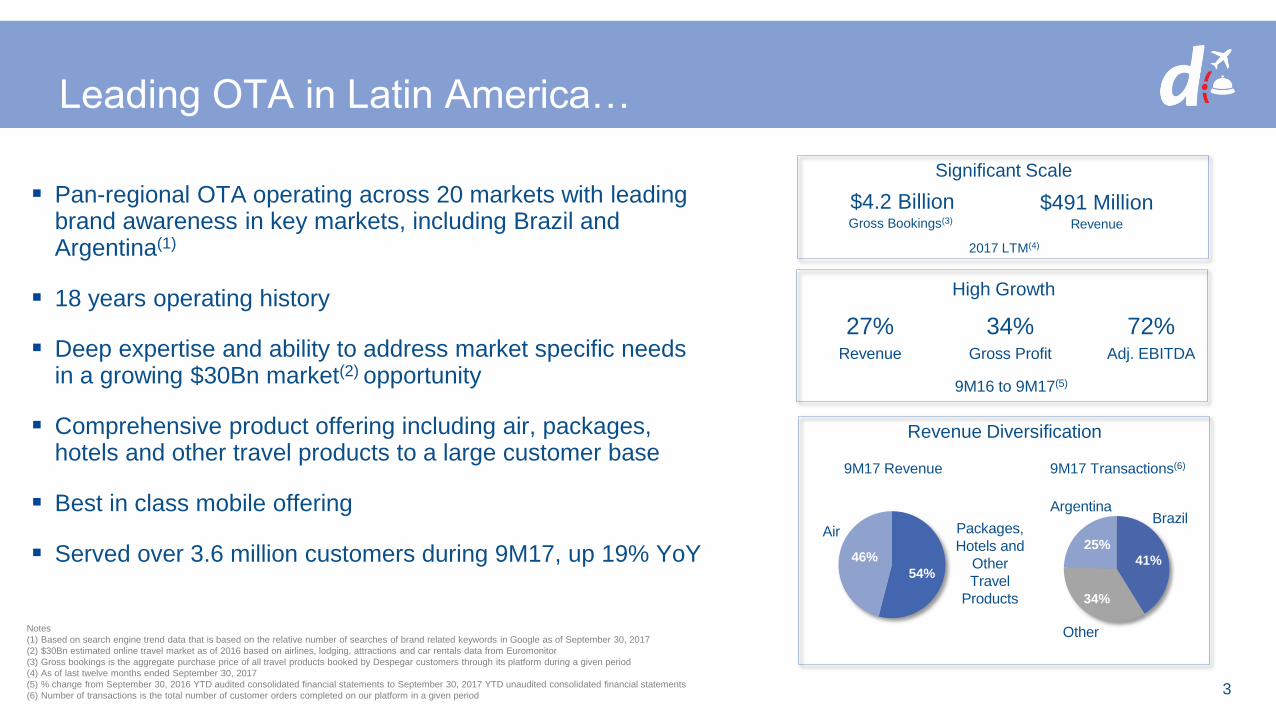
Leading OTA in Latin America…
Pan-regional OTA operating across 20 markets with leading brand awareness in key markets, including Brazil and Argentina(1)
18 years operating history
Deep expertise and ability to address market specific needs in a growing $30Bn market(2) opportunity
Comprehensive product offering including air, packages, hotels and other travel products to a large customer base
Best in class mobile offering
Served over 3.6 million customers during 9M17, up 19% YoY
3
$491 MillionRevenue
$4.2 BillionGross Bookings(3)
High Growth
27%Revenue
34%Gross Profit
9M16 to 9M17(5)
2017 LTM(4)
Revenue Diversification
54%
46%
Air Packages,
Hotels and
Other
Travel
Products
9M17 Revenue
41%
34%
25%
9M17 Transactions(6)
Other
Brazil Argentina
Significant Scale
72% Adj. EBITDA
Notes
(1) Based on search engine trend data that is based on the relative number of searches of brand related keywords in Google as of September 30, 2017
(2) $30Bn estimated online travel market as of 2016 based on airlines, lodging, attractions and car rentals data from Euromonitor
(3) Gross bookings is the aggregate purchase price of all travel products booked by Despegar customers through its platform during a given period
(4) As of last twelve months ended September 30, 2017
(5) % change from September 30, 2016 YTD audited consolidated financial statements to September 30, 2017 YTD unaudited consolidated financial statements
(6) Number of transactions is the total number of customer orders completed on our platform in a given period

…with a Track Record of Continued Growth in New Markets
and Products
4
Start-Up Successfully Established and Grew Our Strategic Platform Path to Further Growth
Launched travel affiliates
program and travel
insurance product
2015
10 million downloads of
our mobile app
Reached ~50% mobile
traffic
Deepened strategic
partnership with Expedia,
including its equity
investment in our
company
Launched bus
business and local
concierge product as
part of destination
services
2016
Migrated all call center
sales to online
2007
Expanded to
Peru
2014
2012
Launched packages,
rental cars and cruise
products
2013
Launched destination
services and
vacation rentals offering
2009
Expanded to Bolivia, Costa Rica, Dominican
Republic, Ecuador, Guatemala, Nicaragua,
Panama, Paraguay and Puerto Rico
Launched Hotels product
Launched mobile app
1999
2000
2001
Launched site in Argentina
Expanded to Brazil,
Chile, Colombia,
Mexico, and Uruguay
Expanded to United States and Venezuela
Reached 1 million
downloads of the mobile app
2.7 MM4.0 MM48% Growth in
Customers
2012 2016
2017

Why Despegar
Virtuous Cycle Underpinned by Scale, Brand and Effective Marketing
Strong Financial Position with Significant Growth Potential
Experienced Management Team
Significant Market Opportunity Driven by Multiple Secular Trends
Leading & Comprehensive Travel Offering, with Numerous Payment Methods
Leading Mobile Offering & Powerful Data Analytics
1
2
3
4
5
6
5

Operating at Significant Scale in a Rapidly Growing
Online Travel Market…
6
USD Bn
Notes
(1) Online travel market from Euromonitor including airlines, lodging, attractions and car rentals. Air segment includes all Latin American countries and outbound globally; US$ ticket values includes round trip for intra-country, single trip for intra-region and single trip for outbound
trips; Online Air includes direct and intermediaries sales; Offline Air covers all transactions that are not booked or paid over the internet
(2) Despegar market share in terms of online travel market in Latin America by gross bookings
$3.3Bn
Bookings
$30Bn
Online Travel
Market
$98Bn(1)
Total Travel Market
$48Bn
Estimated
Online Travel Market
$131Bn(1)
Estimated
Total Travel Market
Market Share(2): ~11%
Despegar
Online Travel Market
$30Bn
50%
48%
Airlines
Lodging
Attractions &
Car Rentals 2%
2020E2016
Source: Euromonitor
Latin America Travel Market Size
1

…That is Highly Underpenetrated
(% Online Penetration)
Source: Euromonitor
2016 Online Travel Penetration by Region
$3.3Bn
Bookings
Despegar
30%
36%
49%
52%
LatinAmerica
Asia US WesternEurope
1
7
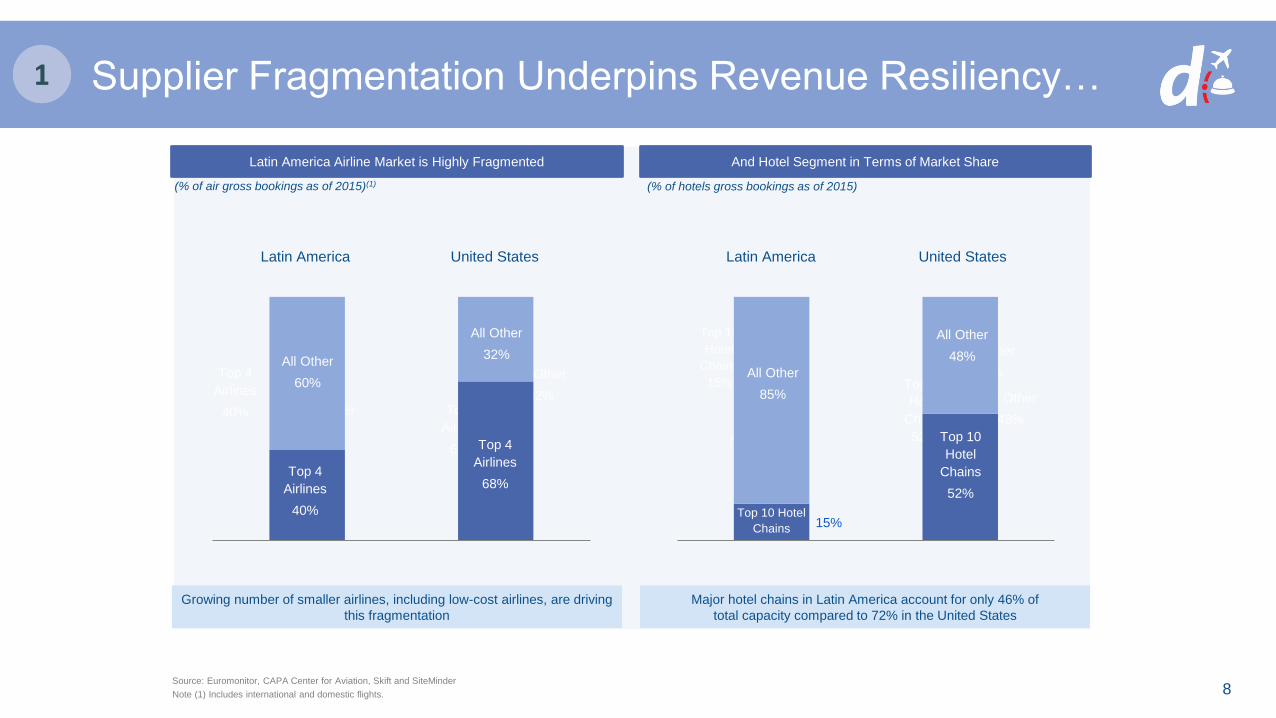
Supplier Fragmentation Underpins Revenue Resiliency…
And Hotel Segment in Terms of Market Share
United StatesLatin America
(% of hotels gross bookings as of 2015)
All Other
32%
All Other
85%
Top 10
Hotel
Chains
15%
Latin America Airline Market is Highly Fragmented
United States
All Other
60%
Top 4
Airlines
40%All Other
48%
Top 10
Hotel
Chains
52%
(% of air gross bookings as of 2015)(1)
All Other
32%Top 4
Airlines
68%
Major hotel chains in Latin America account for only 46% of
total capacity compared to 72% in the United States
Growing number of smaller airlines, including low-cost airlines, are driving
this fragmentation
All Other
85%
Top 4
Airlines
68%
All Other
32%
Top 10 Hotel
Chains 15%
All Other
48%
Top 4
Airlines
40%
All Other
60%
Top 10
Hotel
Chains
52%
Latin America
Source: Euromonitor, CAPA Center for Aviation, Skift and SiteMinder
Note (1) Includes international and domestic flights.
1
8

… while Attractive Consumer & Economic Trends Support
Online Travel Growth
35%
74% 71%
52%
82% 81%
50%
66%
AsiaPacific
Latin America WesternEurope
North America
Notes
(1) Retail value (RSVP) including sales tax, at fixed 2016 exchange rates
(2) Percentage of total population using internet
(3) Millions of credit card transactions CAGR calculated for 2015-2020E period
Source: Euromonitor
Strong Regional Economic Rebound And Increasing Credit Card Use as a Means of Payment
Real GDP CAGR (%)
2012 – 2016 2017E – 2021E
2017E – 2021E
Secular Ecommerce Growth Driven by Increasing Internet Penetration
Internet User Penetration (%)(2)Internet Retail Market Size CAGR (%)(1)
2015 2020E
10%
14% 14%
20%
Western
Europe
North
America
Asia
Pacific
Latin
America
+2.9x
+1.3x
3.5%
6.3%
9.6%
Argentina Brazil U.S.
2015 – 2020E
Credit Card Transactions CAGR (%)(3)
1
9
1.8%2.1%
0.9%
5.6%
1.7% 1.9%2.6%
5.3%
WesternEurope
US Latin America Asia Pacific

Local Knowledge and Industry Leadership Provide
Unique Competitive Advantages
Complexities of Latin America Market Present Significant Barriers to Entry
Over 20 Different Tax Regimes Across Despegar’s Markets
Political & Regulatory Intricacies
Different Languages, Local Customs and Travel Preferences
Transitioning from Cash to Electronic Payments and
Installments
Proven Experience in Managing Currency Volatility
Highly Fragmented Market
10
2
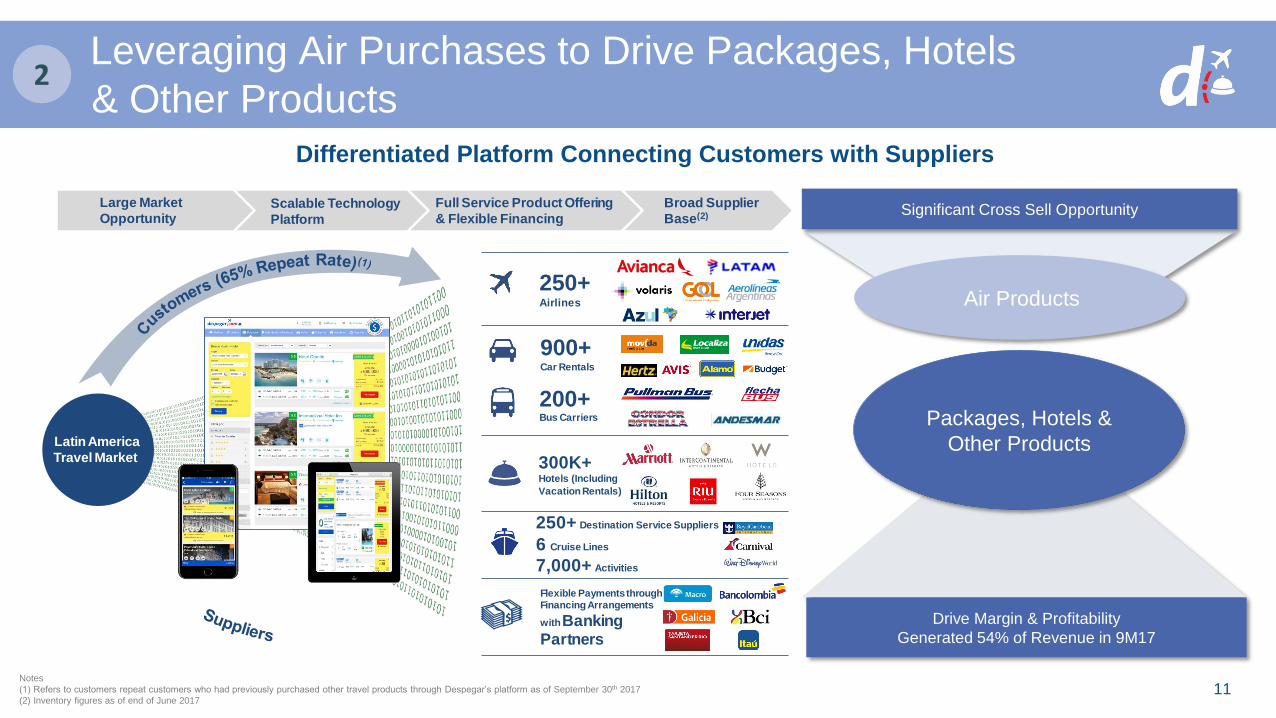
Leveraging Air Purchases to Drive Packages, Hotels
& Other Products
Air Products
Packages, Hotels &
Other Products
Significant Cross Sell Opportunity
Differentiated Platform Connecting Customers with Suppliers
Drive Margin & Profitability
Generated 54% of Revenue in 9M17
11Notes
(1) Refers to customers repeat customers who had previously purchased other travel products through Despegar’s platform as of September 30th 2017
(2) Inventory figures as of end of June 2017
2
250+Airlines
300K+Hotels (Including
Vacation Rentals)
900+Car Rentals
200+Bus Carriers
250+ Destination Service Suppliers
6 Cruise Lines
7,000+ Activities
Flexible Payments through Financing Arrangements
with Banking Partners
Large Market
OpportunityScalable Technology
Platform
Full Service Product Offering
& Flexible Financing
Broad Supplier
Base(2)
Latin America
Travel Market

Flexible Payment Solutions Enhance Market Appeal…
Note
(1) In Brazil, we generally receive payment from the installment financing bank only after each scheduled payment due date from the customer (whether or not the makes the scheduled payments to the bank)
• ~54% of Despegar Transactions in
1H2017 were in installments
• Installments Paid Upfront to Despegar in
Most Markets(1)
• No Collection Risk for Despegar
Despegar
Primarily Merchant of Record Rather Than Agent1
Overlapping Customer Base with Banks2
Brand / Scale Attract Partnerships3
Dynamic Marketing Campaigns4
Increase Customers’ Purchase Capacity5
Key Characteristics
2
12

… and Customer Experience2
13
Pay with 1 or 2 credit cards
Installments with no interest
Pay at destination
Limited time offer
More bank options

Broader and Differentiated Competitive Position2
14
Global OTAs
Local Offline Travel
Agencies
Smaller Online Travel
Agencies
Pan RegionalBrand
and Scale(1)
InstallmentPayment Options
Multi-Product Offering
Air + HotelInsurance + Cars
+ Dest. Serv.
Latin American Customer Focused
(Argentina)
Pre-Set Packages(Chile)
(Colombia)
(Mexico)
(Brazil)
Note
(1) Based on presence across Latin America (Argentina, Brazil, Mexico, Chile, Colombia) measured by branded search recognition for September 30th 2017 from Google’s Share of Voice report (Google’s Trend data)
Vacation Rentals

Virtuous Cycle Based on Increasing Scale and Brand
Recognition 3
15

Strong Brand Recognition and Awareness3
US$1Bn+ Invested Since
our Founding(1)
Notes
(1) Marketing investments include marketing personnel as of June 30th 2017
(2) Includes traffic on desktop website, mobile desktop and mobile App
(3) As of September 30, 2017
Strong Brand Awareness Drives Direct Traffic to Platform
% Traffic Source by Channel as of 1H2017(2)
Direct
~52%
Indirect
~48%
1999 9M2017
Cumulative Marketing Investment
Approximately 9MM user
generated reviews(3)
16

Marketing Dollars Focused on Driving Profitable Growth…
…Drives Growth Proven Marketing Investment Strategy…
(US$MM)
Dynamic Budget Allocation
Performance Optimization Tailored to our
Business Needs and Markets
Custom Attribution Model
Maximize Growth at ROI target
“Always On” Strategy
Cross-Device Insights and Custom Attribution
Model and Bidding Tools
3
$422$411
$300
$380
40%
30% 30%32%
20%
25%
30%
35%
40%
45%
50%
55%
60%
65%
100
150
200
250
300
350
400
450
500
FY15 FY16 9M16 9M17
Revenue Sales & Marketing % of Revenue
17

…And Supporting Our High Brand Recognition3
Argentina
Brazil Chile
Colombia
Mexico Latin America
1st
1st
Branded Search Recognition by Country for 3Q2017
Global Player Local Player
Source: Google’s Share of Voice report based on Google’s Trend data as of September 30th 2017. Graph shows the relative number of searches of the Brand related keywords.
23%
15%11%
8% 7% 7%
Tiquetes Decameron Booking Trivago Atrapalo
34%
16%
9% 9% 7% 5%
Booking.com Trivago Almundo AirBnB Tripadvisor
28%
18%14%
11%7%
4%
CVC Booking Trivago AirBnB Hotel Urbano
32%
16%12%
8% 7% 6%
Booking Falabella Trivago AirBnB Cocha
27%
13% 11% 9% 8%4%
Booking Trivago CVC AirBnb Tripadvisor
22%
15% 14% 12%9% 7%
Trivago Bestday AirBnB Expedia Booking
18

Scalable Technology Platform Built for Continuous
Innovation~$189MM(3) Invested in Technology and Product Development Over the Last 3 Years
Notes
(1) From company data, in a period of approximately three months (March 20, 2017 to June 12, 2017) during the first half of 2017
(2) As of June 30, 2017
(3) Includes investments in Technology and Product Development during the year ended December 31, 2015 and 2016 and nine months ended September 30, 2017
4
19
Sophisticated Data Collection and Analytics…
Tracking search history
Geolocation
Personalized landing pages
Self-Managed
Post Sale Experience
Personalization
And Cross-Selling Robust User
Centric Team
Tracking
Performance
Metrics
…To Better Understand Local Customers And Travel Preferences
Supported by 800
Developers & Technology
Professionals
Rapid Product
Development(One update approximately
every 3 minutes)(1)
Enhanced Fraud
Prevention
Mechanisms
Award Winning
Mobile Platform

Our Mobile First Approach4
20
Source: Internal data
Notes
(1) Despegar believes its iOS App Store and Google Play apps are the most downloaded OTA apps in Latin America for the period from 2012 to 2017
(2) Downloads based on internal data, and as of November 30, 2017. Star ratings as of December 26, 2017
(3) Includes reviews for both Despegar and Decolar apps on iOS App Store and Google Play as of end-of-month December 2017
35+ MillionCumulative App Downloads(2)
4.4 Stars Rating on Apple App Store
Based on 2.39k reviews(3)
Most Downloaded OTA App in the Region(1)
Apple App Store Google Play App Store
4.4 Stars Rating on Google Play
Based on 147,405 reviews(3)
Mobile Transactions up +56% 9M16 to 9M17
Share of mobile transactions
+550bps YoY to 29%9M16 to 9M17

Differentiated Pricing to Incentivize Specific Customer
Behavior
No Discount Special Discount for Being
Logged In as a User
Special Discount for Having
Booked a Flight Recently
Exclusive In-App
Special Discount
4
21

41%
13%6%
20%
20%
Experienced Management Team and Blue Chip Investors
Focused on Long Term Success5
Damián Scokin Chief Executive Officer
Mike Doyle Chief Financial Officer
Gonzalo Estebarena Commercial Director
Sebastián Mackinnon Head of Air
Martín Molinari Head of Packages, Hotels
and Other Travel Products
Andres Patetta Chief Marketing Officer
Leandro MalandriniHead of Product Mgmt. &
UX
Alejandro Stein Head of Operations
BackgroundTitleExecutive BackgroundTitleExecutiveOwnership Structure*
22
* Includes vested and unvested employees options of 3.8
million @ $26 per share plus ~0.2 million of vested restricted
shares

Financial Highlights6
1. Operating at Significant Scale in a Rapidly
Growing, Multi-Billion Dollar Market
2. Accelerating Revenue Growth Driven by
Packages and Hotel Segments
3. Strong Transaction Growth Driven by High
Repeat Customer Purchase Activity
4. Operating Leverage Driving Increased
Margins
5. Favorable Working Capital Dynamics
23

Strong Business Momentum in 2017 with Strategic Initiatives
Driving Higher Margin Packages, Hotels and OTPs…
Total Transactions by Segment
In millions
Gross Bookings
In US$ Bn
3.6 3.3
2.3
3.2
'-
0.6
1.1
1.7
2.2
2.8
3.3
3.9
2015 2016 9M16 9M17
6
4.4 4.3
3.03.9
3.33.0
2.2
2.7
7.77.2
5.2
6.6
'-
1.3
2.5
3.8
5.0
6.3
7.5
8.8
2015 2016 9M16 9M17
24

52% 50% 49% 46%
48% 50% 51% 54%
0
0.25
0.5
0.75
1
1.25
2015 2016 9M16 9M17
Air Packages, Hotels & OTPs
… Supporting Revenue Growth and an Increasingly
Diversified Mix…
Total Revenue
In US$ millions
421.7 411.2
300.0
379.9
'-
65.0
130.0
195.0
260.0
325.0
390.0
455.0
2015 2016 9M16 9M17
Revenue Mix
% of total revenue
60.8 69.3 71.2 74.8
2015 2016 9M16 9M17
Revenue per Transaction
In US$
50.148.4 48.5
44.9
2015 2016 9M16 9M17
6
25

… along with Robust Adjusted EBITDA Expansion
Adjusted EBITDA and Adjusted EBITDA margin (%)
In US$ millions and % of revenues
-39.1
48.637.4
64.2
2015 2016 9M16 9M17
11.8%-9.3% 12.5% 16.9%Adjusted EBITDA Margin
6
26

Increase in Cash and Cash Equivalents
In US$ millions
-55
1239
4
-19
10
254
1Q16 1Q17 2Q16 2Q17 3Q16 3Q17
Cash Excluding IPO Proceeds IPO Proceeds
Solid Balance Sheet and Strong Cash Flow Generation
Cash Flow Cycle In the Pre-Pay / Merchant Business Model
Consolidated Cash Flow Data
In US$ millions
Installments are only offered in transactions sold with the Pre-Pay /
Merchant Model and represent ~54% of total transactions(2)
Average Time
to Check-in
Booking by
Customers
Despegar
Pays Supplier
Despegar Receives
Cash from Customer
Payments
21 3 4
Typically less than one month(3)
Brazil w/
Installments
All
Other
Scheduled payment due date from the customer
Cash Positive (+)
Notes
(1) Cash flows timeline for illustrative purposes only. Various factors could cause actual payment timing to differ from those in the
example timeline, including supplier practices, payment method and factoring arrangements
(2) Approximately 54% of our transactions in 1H2017 were paid by installment
(3) In all markets except Brazil, we typically receive payment in less than one month after booking
6
27
2015 2016 9M16 9M17
Net cash flow provided by / (used in) operating activities (24.2) (43.3) (60.9) 36.0
Net cash flows (used in) / provided by investing activities (81.0) 14.4 24.2 (11.3)
Net cash flows provided by financing activities 198.8 5.1 3.5 255.3
- Net IPO proceeds 254.3
Effect of FX rate changes on cash and cash equivalents (12.5) (2.4) (2.0) 0.1
Net Increase/ (decrease) in cash and cash equivalents 81.1 (26.1) (35.3) 280.1

Operating Model
2015 2016 9M16 9M17
Revenue as % of Gross
Bookings11.7% 12.6% 13.3% 11.9%
Gross Profit 63.4% 69.2% 68.9% 72.6%
Selling & Marketing 40.3% 29.5% 29.7% 31.6%
Technology & Product
Development17.4% 15.4% 15.7% 13.7%
General & Administrative 18.5% 15.7% 14.2% 13.9%
Adjusted EBITDA(2) -9.3% 11.8% 12.5% 16.9%
Notes
(1) As a percentage of revenue unless otherwise stated
(2) Adjusted EBITDA removes the effects of Depreciation, Amortization and Share Based Compensation expense; refer to last page for EBITDA reconciliation
(3) Based on unaudited consolidated financial statements for the nine months ended September 30, 2017
6
28

Strategic Priorities Driving Growth and Leadership
REPEAT PURCHASE RATE
ADDRESS NEW CUSTOMERS
CAPTURE HIGH SHARE OF
WALLET
INCREASE & OPTIMIZE
INVENTORY
EXPAND MARGINS
BROADEN PLATFORM &
MARKET SHARE GAIN
IMPROVE CUSTOMER
EXPERIENCE
INCREASE CONSUMER
ENGAGEMENT
EXPAND REACH
IN THE REGION
ENHANCE PRODUCT
OFFERING & CROSS-SELL
DEEPEN RELATINOSHIPS
WITH SUPPLIERS
FURTHER INVESTMENT
IN MOBILE PRODUCTS
INVEST IN IT & DATA TO DRIVE
OPERATIONAL EFFICIENCY
PURSUE STRATEGIC
ACQUISITIONS
29

Appendix

Key Financial & Operating Trended Metrics (in thousands U.S. dollars, unless otherwise stated)
31
1Q16 2Q16 3Q16 4Q16 1Q17 2Q17 3Q17
FINANCIAL RESULTS
Revenue $95,115 $98,797 $106,088 $111,162 $124,999 $123,462 $131,468
Cost of revenue 33,494 33,752 26,150 33,279 31,140 35,087 37,869
Gross profit 61,621 65,045 79,938 77,883 93,859 88,375 93,599
Operating expenses
Selling and marketing 28,577 29,133 31,374 32,382 35,546 43,289 41,097
General and administrative 15,186 13,960 13,576 21,961 18,869 18,618 15,318
Technology and product development 15,561 15,942 15,718 16,030 15,408 17,644 18,907
Total operating expenses 59,324 59,035 60,668 70,373 69,823 79,551 75,322
Operating income 2,297 6,010 19,270 7,510 24,036 8,824 18,277
Net financial income (expense) (386) (3,653) (850) (1,863) (6,156) (1,611) (2,880)
Net income before income taxes 1,911 2,357 18,420 5,647 17,880 7,213 15,397
Income tax expense 2,646 2,178 4,067 1,647 2,486 3,806 4,190
Net income /(loss) (735) 179 14,353 4,000 15,394 3,407 11,207
Net income/ (loss) ($735) $179 $14,353 $4,000 $15,394 $3,407 $11,207
Add (deduct):
Financial expense, net 386 3,653 850 1,863 6,156 1,611 2,880
Income tax expense 2,646 2,178 4,067 1,647 2,486 3,806 4,190
Depreciation expense 1,265 1,263 1,450 1,111 1,343 1,362 1,337
Amortization of intangible assets 1,728 1,918 2,060 2,129 1,517 2,039 2,454
Share-based compensation expense 50 50 50 424 1,176 930 959
Adjusted EBITDA $5,340 $9,241 $22,830 $11,174 $28,072 $13,155 $23,027
Net Increase (Decrease) in Cash & Cash
Equivalents($55,203) $38,656 ($18,707) $9,106 $12,314 $3,825 $263,911

Key Financial & Operating Trended Metrics (cont.)(in thousands U.S. dollars, unless otherwise stated)
32
1Q16 2Q16 3Q16 4Q16 1Q17 2Q17 3Q17
KEY METRICS
Operational
Number of transactions 1,632 1,706 1,839 2,035 2,129 2,210 2,298
- YoY growth (6%) (8%) (9%) (3%) 30% 30% 25%
Air 927 1,009 1,089 1,225 1,246 1,325 1,328
- YoY growth (1%) (4%) (4%) (3%) 34% 31% 22%
Packages, Hotels & Other Travel Products 704 697 750 810 883 885 970
- YoY growth (13%) (12%) (16%) (2%) 25% 27% 29%
Gross bookings $661,577 $755,413 $844,782 $998,462 $1,019,102 $1,061,026 $1,116,022
- YoY growth (19%) (13%) (10%) 3% 54% 40% 32%
Revenue per transaction $58.3 $57.9 $57.7 $54.6 $58.7 $55.9 $57.2
- YoY growth 5% 4% 8% 0% 1% (4%) (1%)
Air $44.8 $50.2 $50.1 $48.1 $44.8 $46.0 $44.1
- YoY growth (11%) (4%) 4% (4%) (0%) (8%) (12%)
Packages, Hotels & Other Travel Products $76.1 $69.1 $68.6 $64.4 $78.4 $70.7 $75.2
- YoY growth 23% 16% 13% 5% 3% 2% 10%
ASP $405 $443 $459 $491 $479 $480 $486
- YoY growth (13%) (6%) (1%) 6% 18% 8% 6%

Unaudited Consolidated Balance Sheets (in thousands U.S. dollars)
33
As of September 30, 2017 As of December 31, 2016
LIABILITIES AND SHAREHOLDERS’ DEFICIT
Current liabilities
Accounts payable and accrued expenses 39,512 25,335
Travel suppliers payable 132,502 102,237
Related party payable 80,962 71,006
Loans and other financial liabilities 8,092 7,179
Deferred Revenue 24,003 29,095
Other liabilities 51,961 49,686
Contingent liabilities 4,546 3,613
Total current liabilities 341,578 288,151
Non-current liabilities
Other liabilities 1,302 409
Contingent liabilities 10,011 22,413
Related party liability 125,000 125,000
Total non-current liabilities 136,313 147,822
TOTAL LIABILITIES 477,891 435,973
SHAREHOLDERS’ EQUITY (DEFICIT)
Common stock 1 254,311 6
Additional paid-in capital 315,220 312,155
Other reserves (728) (728)
Accumulated other comprehensive income 16,469 16,286
Accumulated losses (379,974) (409,982)
Total Shareholders' Equity Attributable to
Despegar.com Corp205,298 (82,263)
TOTAL LIABILITIES AND SHAREHOLDERS’
EQUITY683,189 353,710
1. Represents 58,518 (at USD 0.0001) and 10,579 (issued at USD 26, incorporated at USD 24, net of issuance expenses) thousands
shares issued and outstanding at September 30, 2017 and 58,518 (at USD 0.0001) thousands shares issued and outstanding at
December 31, 2016.
As of September 30, 2017 As of December 31, 2016
ASSETS
Current assets
Cash and cash equivalents $356,018 $75,968
Restricted cash and cash equivalents 30,020 22,738
Accounts receivable net of allowances 160,061 121,098
Related party receivable 4,581 2,240
Other current assets and prepaid expenses 32,837 27,184
Total current assets 583,517 249,228
Non-current assets
Restricted cash and cash equivalents 10,000 20,459
Property and equipment net 15,413 13,717
Intangible assets net 34,236 31,412
Goodwill 40,023 38,894
Total non-current assets 99,672 104,482
TOTAL ASSETS 683,189 353,710

Investor Relations Contact
Ines Lanusse
IR and External Communications Manager
Phone: (+5411) 4894 3582
E-mail: [email protected]