cornwall local energy market residential project
TRANSCRIPT

Cornwall Local Energy Market Residential Project
A Whistle-stop Tour
Knowledge Exchange and Stakeholder Sign-off Event19th November 2020
Dr David Kane, Dr Andrew Peacock, Dr Peter McCallum
Trilemma Consulting Limited

Residential Project Workstreams
• Vendors & technologies: Considered BESS, smart storage heating and EV charging
• Participants: Web Questionnaire, Desktop & Physical Surveys
• Systems: PV Design & BESS SizingSelection
• Installed 100 BESS: 54 dc-coupled (new PV) & 46 ac-coupled (existing PV)
• Installed independent monitoring system [IMS] (grid, BESS, PV & Major Loads)
• Regular quality assurance of BESS, PV & IMS operationInstallation & Support
• Supported development & test of Sonnen’s Virtual Power Plant [VPP] platform
• Integrated Sonnen VPP with Centrica’s in-house aggregation platform
• Independent Monitoring System to support flexibility trading decisions & FFR pre-qualificationIntegration
• Dominated by un-restricted Self-Consumption operation
• Delivered flexibility as contracted via LEM Platform
• National Grid FFR pre-qualification and pilot deliveryTesting
• Site-specific Participant Annual Savings Report
• Participant Event
• Studies on performance, sizing & headroomReporting & Analysis

Publications Available Soon
• LEM Residential Fleet Self-Consumption Summary Report: Analysis of baseline, PV-only and BESS+PV system performance
• LEM Residential BESS Utilisation Summary Report: BESS utilisation and VPP dispatch headroom under various sizing scenarios, with associated cost and CO2 impacts
• LEM Residential Data Dictionary: Description of system performance monitoring datapoints, and associated data coverage summary
• LEM Residential MetaData Summary Report: Description of metadata datapoints, and associated metadata coverage summary
• Public-domain Datasets: System Performance and Site Metadata
Today’s Whistle-stop Tour
• Meet the LEM Residential Fleet
• Learning 1: The Role of Smart Metering
• Learning 2: Options to Improve Financial Returns of BESS
• Learning 3: CO2 savings from residential BESS: a VPP perspective
• Conclusions

Meet the LEM Residential Fleet

Meet our Participants – a diverse bunch!
Figure 1: Locational map of participating dwellings
Boiler, 78
Electric storage, 14
Electric other, 2ASHP, 5 GSHP, 1
Heating system type
0
5
10
15
20
25
30
35
40
45
1 2 3 4 5 >5
Co
un
t (%
)
Number of occupants
Household Occupancy
Count (%) UK (%)
No of occupants per dwelling
0
5
10
15
20
25
30
35
<50 50-75 75-100 100-150 150-200 >200
Co
un
t (%
)
Floor area (m2)
Average floor area of cohort = 135m2
Average for SW England = 108m2
Floor area distribution
Condition 1, 56Condition 2, 30
Condition 3, 14
Daily occupancy pattern
• Dispersed installations• Diverse Building Sizes & Heating Systems
• Range of household sizes & Occupancy Patterns
Wide spectrum of Annual Consumption & Generation
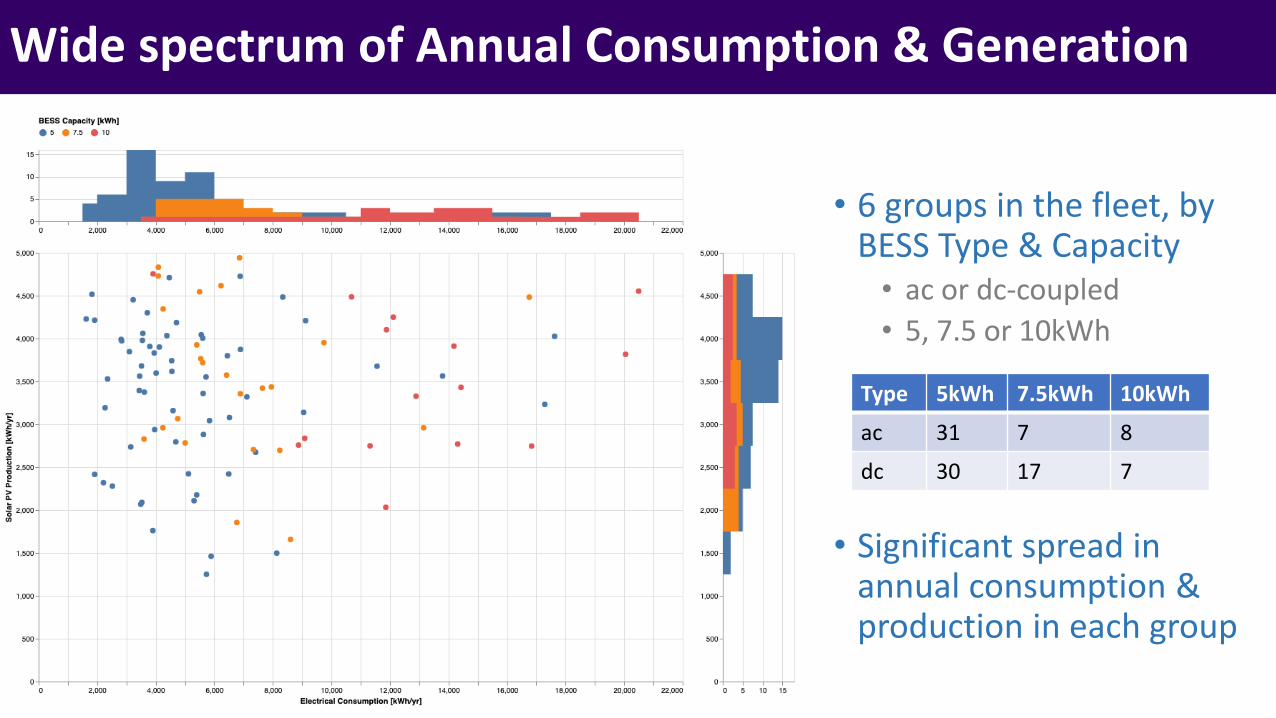
• 6 groups in the fleet, by BESS Type & Capacity• ac or dc-coupled
• 5, 7.5 or 10kWh
• Significant spread in annual consumption & production in each group
Type 5kWh 7.5kWh 10kWh
ac 31 7 8
dc 30 17 7

Learning 1: The Role of Smart Metering

Total Financial Value from self-consumption
• Total Financial Value from Self-Consumption:• Import avoidance• Export income
• Value Driven by:• Production• Consumption• Profiles, not annual values
• Incremental Value of BESS• Increased import avoidance• Reduced Export income
• Marginal Benefit unless you monetise headroom via:• Time-of-Use arbitrage• Trading & Grid Services

Seasonal Average Production & Consumption
• Annual data hides• Variation by Season• Variation by HH
• Predicting BESS utilisation is difficult• Limited effectiveness
of sizing calculations• Uncertain savings• Low confidence in
available Headroom (for trading/flex)

Understanding Production Surplus & Production Deficit
Production Surplus
Production not instantly consumed on-site
Production Deficit
Consumption not instantly met by on-site production

Improving Value Prediction with Smart Meter Data
• Example uses half-hourly data
• Calculate production surplus/deficit every 30minutes
• Limited by the performance characteristics & BESS sizing of the training datasets
• Does not rely upon the “average” load shapes from the consumption & production training datasets
• Further improve accuracy with time-of-use tariffs or other price signals

Advantages of Smart Metering
• Data Availability pre-deployment could aid several stakeholders:• Savings prediction for consumer (from self-consumption and/or trading)
• Assessment of headroom value for a Virtual Power Plant operator
• Effective sizing algorithms; reduce CAPEX & improve RoI for asset owners
• Integration with BESS - avoiding duplicate metering - could improve the customer experience, and reduce costs:• Reduce hardware & install cost
• Minimising physical footprint & installation disruption
• Reduce installation or commissioning errors
• Transparency of energy flows for billing & trading settlement
• Minimise data collection costs

Learning 2: Options to Improve Financial Returns of BESS

Low BESS energy utilisation limits financial returns
• Annual average: 0.4-1 full charge cycle equivalents per day
• Warranties could support >more than 1 cycle/day
• Driven by lack of production surplus
• Production surplus limited by Solar PV capacity
• Even with larger Solar PV, eventual Production Deficit will limit BESS Utilisation
1 full charge/discharge cycle per day

How do we limit Round Trip losses?
• Round Trip Efficiency [RTE]• Ratio of Discharge Energy to Charge Energy• Fleet Average was 70.3%
• Losses are primarily driven by the operating profile:• Parasitic Loads: control systems, user displays,
metering, communications• Charging Losses: driven by varying Production
Surplus• Discharging Losses: driven by Production Deficit /
Consumption
Options to improve returns:• Product development to reduce CAPEX & increase RTE;
which comes with monetary & time costs
• Reduce sizing of dwelling-scale BESS; limit headroomearnings with minor impact on CAPEX
• Aggressive headroom trading; headroom value needs to outweigh impacts on BESS cycling & lifetime
• Community-Scale BESS to leverage diversity whilst reducing CAPEX; regulatory hurdles

• Why downsize?• Increase BESS Utilisation
• Improved RTE
• Reduced CAPEX
BESS Resizing Factor
Energy Capacity [kWh]
Net Value70% RTE Dyn. RTE
100% 635 - -90% 572 £80 £2080% 508 £500 £23070% 445 £1,060 £63060% 381 £1,740 £1,18050% 318 £2,470 £1,840
Community-scale BESS: The trade off
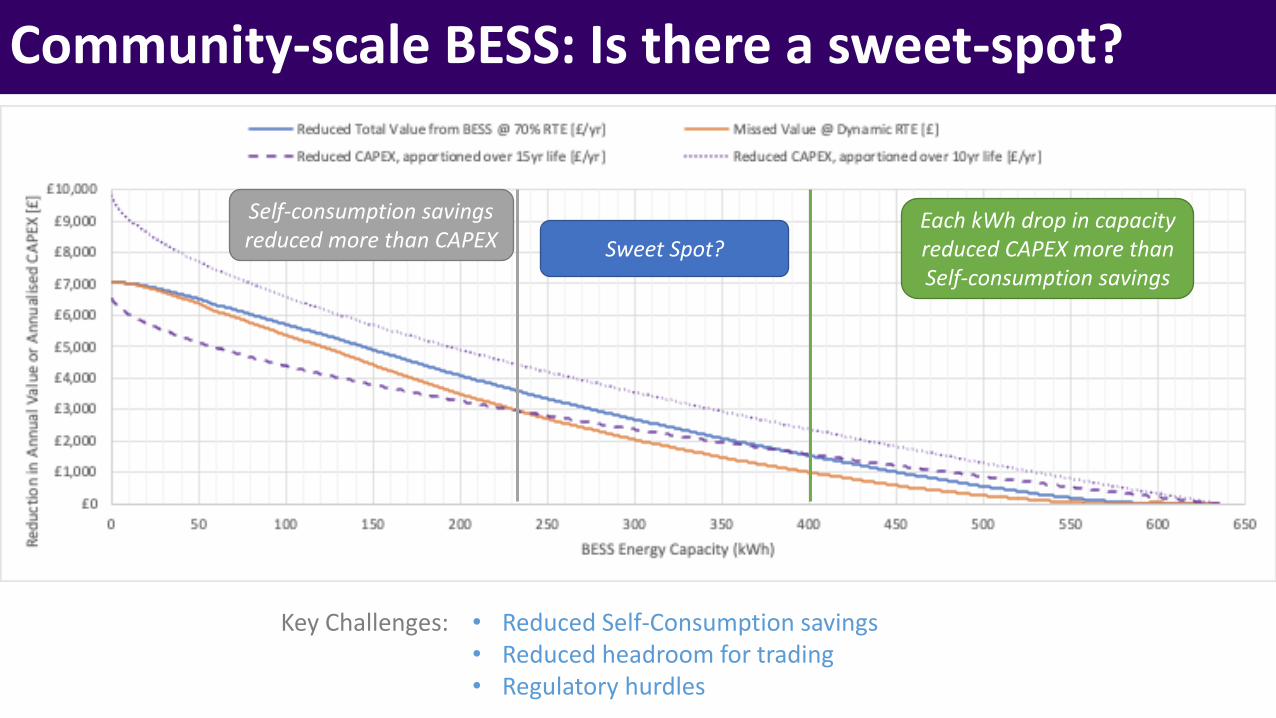
Each kWh drop in capacity reduced CAPEX more thanSelf-consumption savings
Sweet Spot?
Self-consumption savings reduced more than CAPEX
• Reduced Self-Consumption savings• Reduced headroom for trading• Regulatory hurdles
Community-scale BESS: Is there a sweet-spot?
Key Challenges:

Leveraging Headroom to increase BESS Utilisation
BESS Capacity used for PV self-consumption
Headroom
Charge opportunity with low cost grid import
Discharge opportunity to capture high value
Low Value
High Value
Mid Value
Value was based on 3 trading events to maximise BESS Utilisation

Headroom: Confidence Level
£0£0£0
£25.00£37.50£50.00
£50.00£75.00
£100.00
£75.00£112.50£150.00
£100.00£150.00£200.00
£125.00£187.50£250.00
£- £5.00 £10.00 £15.00 £20.00 £25.00
Annual Earnings Potential (Retail Time-of-use Tariff)
£- £5.00 £10.00 £15.00 £20.00 £25.00
Annual Earnings Potential (Retail Time-of-use Tariff)
£- £5.00 £10.00 £15.00 £20.00 £25.00
Annual Earnings Potential (Retail Time-of-use Tariff)
£- £5.00 £10.00 £15.00 £20.00 £25.00
Annual Earnings Potential (Retail Time-of-use Tariff)
£- £5.00 £10.00 £15.00 £20.00 £25.00
Annual Earnings Potential (Retail Time-of-use Tariff)
£0
Annual Earnings (5kWh batt.)Annual Earnings (7.5kWh batt.)Annual Earnings (10kWh batt.)
• Use confidence limits to determine the probability of headroom being available at different periods during the day• Compute your trading value, here based on ToU arbitrage based on different confidence levels
Annual Earnings (£/kWh Capacity)

• The headroom profile significantly varies by season; a wide range of trading options may be required
• Using this confidence limit approach, it is possible to allow for significant self-consumption to occur whilst reserving significant capacity for arbitrage/services
To unlock Headroom, aggregation is needed

Learning 3: CO2 savings from residential BESS: a VPP perspective

Fleet level CO2 emission saving
-20 0 20 40 60 80 100 120
Dwelling Consumption
Grid import - PV only
Grid Import - PV & BESS
Dwelling - PV Only including grid spill
Dwelling - PV & BESS including grid spill
FLEET LEVEL CO2 EMISSIONS (TCO2 PA)
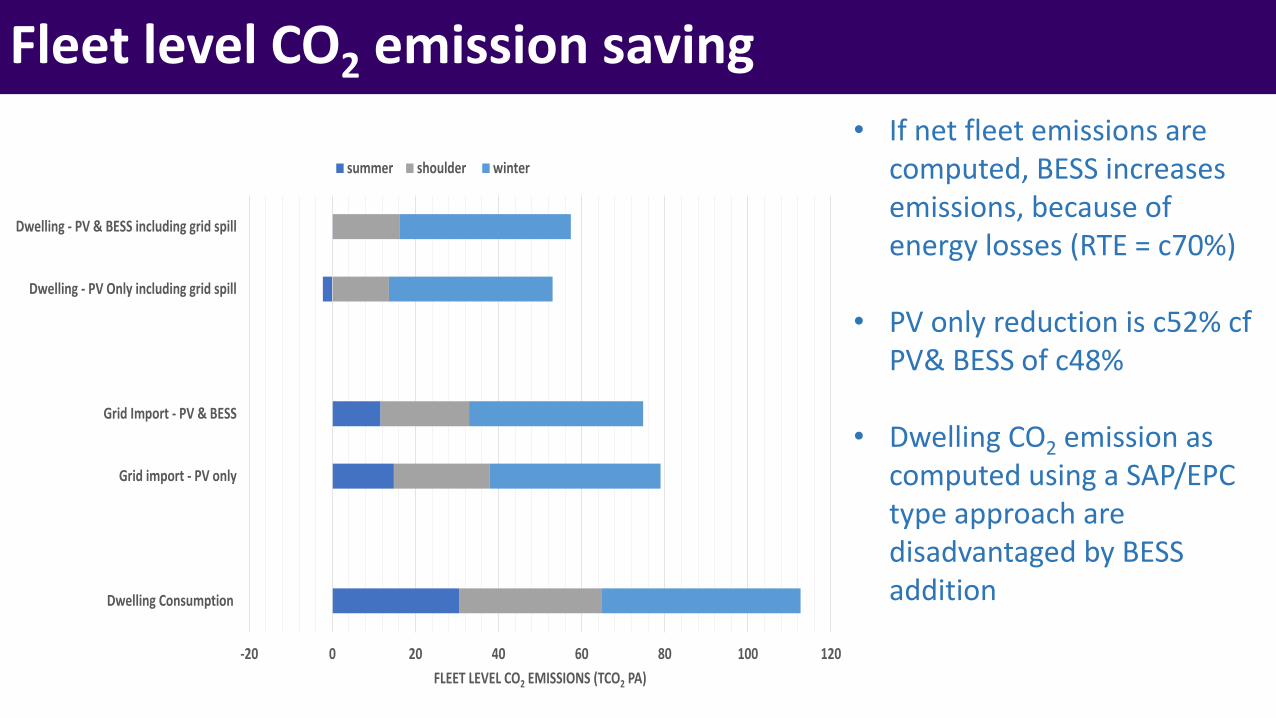
Fleet Level View of CO2 emissions of dwelling under different criteria
summer shoulder winter • Compute CO2 emissions using 12 month data at 30 minute temporal precision.
• Use National Grid half-hourly GEF for period of analysishttps://carbonintensity.org.uk/

Fleet level CO2 emission saving
-20 0 20 40 60 80 100 120
Dwelling Consumption
Grid import - PV only
Grid Import - PV & BESS
Dwelling - PV Only including grid spill
Dwelling - PV & BESS including grid spill
FLEET LEVEL CO2 EMISSIONS (TCO2 PA)
Fleet Level View of CO2 emissions of dwelling under different criteria
summer shoulder winter
• Fleet CO2 emissions attributable to grid import fall by c22% by the provision of PV and fall by c30% by the provision of PV&BESS
Fleet level CO2 emission saving
-20 0 20 40 60 80 100 120
Dwelling Consumption
Grid import - PV only
Grid Import - PV & BESS
Dwelling - PV Only including grid spill
Dwelling - PV & BESS including grid spill
FLEET LEVEL CO2 EMISSIONS (TCO2 PA)
Fleet Level View of CO2 emissions of dwelling under different criteria
summer shoulder winter
• If net fleet emissions are computed, BESS increases emissions, because of energy losses (RTE = c70%)
• PV only reduction is c52% cfPV& BESS of c48%
• Dwelling CO2 emission as computed using a SAP/EPC type approach are disadvantaged by BESS addition

Seasonal Time of day variation in GEF
It is possible to evaluate the impact of ‘CO2
arbitrage’, where charging at night at low GEF offsets import at evening during high GEF
The number of days pa where CO2 differential night to peak is large enough to overcome RTE losses is limited
• Have to question the validity of this type of carbon accounting for flexibility assets
• Emission savings is not at the level of the dwelling but rather at the level of grid
• Flexibility is permits access of VRE and reduced deployment of fossil fuel peaking plant
• System average GEF, even if time of use is perhaps not the best accounting metric
Time-of-Use CO2 arbitrage

Conclusions

• Combined self-consumption & trading revenue from behind the meter, residential BESS generates c£160-£200 pa on capital costs that are about 30x this value• Self-consumption only delivers £25-160 per year of net savings within the home
• Based on capital, efficiencies and utilisation, community-scale seems to make more sense than individual dwelling BESS• Individual dwelling may allow increased consumer participation and may deliver hyper localised flexibility
• Grid independence may be a key motivation for participants but it is neither tenable nor the purpose of the technology• Without high BESS utilisation, return of investment (financial or other embodied costs) is limited• Education and transparency are critical
• Access to temporally precise data (e.g. half-hourly Smart Meter data) is key to unlocking more optimal sizing, control options and understanding multiple intra-day trading/flex opportunities
• Revised carbon accounting methodologies are required that reflect how flexibility aids the low carbon transition
Conclusions