corn situation and outlook historical perspective and outlook for 2008
Post on 21-Dec-2015
216 views
TRANSCRIPT

Corn Situation and Outlook
Historical Perspective and Outlook for 2008

Corn Production, Ending Stocks, and Price, 1992-2008
0
2000
4000
6000
8000
10000
12000
14000
1992 1993 1994 1995 1996 1997 1998 1999 2000 2001 2002 2003 2004 2005 2006 2007 2008
Mill
ion
bu
$0.00
$1.00
$2.00
$3.00
$4.00
$5.00
$6.00
Production Ending Stocks Price/Bu

U.S. Corn Ending Stocks and Price, 1992-2008
0
500
1000
1500
2000
2500
1992 1993 1994 1995 1996 1997 1998 1999 2000 2001 2002 2003 2004 2005 2006 2007 2008
Mill
ion
bu
$1.50
$2.00
$2.50
$3.00
$3.50
$4.00
$4.50
$5.00
$5.50
$6.00
Ending Stocks Price/Bu

U.S. & Foreign Corn Ending Stocks 1996-2008
010002000300040005000600070008000
1996
1997
1998
1999
2000
2001
2002
2003
2004
2005
2006
2007
2008
Year
Mill
ion
bu
sh
els
Foreign Stocks U.S. Ending Stocks

Supply/Demand Projections:2008/2009 Corn ----------Supply/Demand ----------
Low/High Exp/Exp High/Low
Beginning Stocks(MB) 1576 1576 1576Acres (MPA) 85.0 87.0 89.0Acres (MHA) 77.5 79.3 81.1Yield 150.5 155.0 159.5Supply(M. Bu) 13251 13878 14530 Use:
Feed 5300Ethanol 4100 Food, Seed 1345 Exports 2000
Ending Stocks 825 1133 1441Projected Price $5.50 $5.00 $4.50

Wheat Situation and Outlook
Historical Perspective and Outlook for 2008

Wheat Production, Ending Stocks, and Price, 1993-2008
0
500
1000
1500
2000
2500
3000
1993 1994 1995 1996 1997 1998 1999 2000 2001 2002 2003 2004 2005 2006 2007 2008
Mill
ion
Bu
$0.00
$1.00
$2.00
$3.00
$4.00
$5.00
$6.00
$7.00
$8.00
Production Ending Stocks Price/Bu

U.S. Wheat Ending Stocks and Price, 1993-2008
0
200
400
600
800
1000
1993 1994 1995 1996 1997 1998 1999 2000 2001 2002 2003 2004 2005 2006 2007 2008
Mill
ion
Bu
$2.00
$3.00
$4.00
$5.00
$6.00
$7.00
$8.00
Ending Stocks Price/Bu
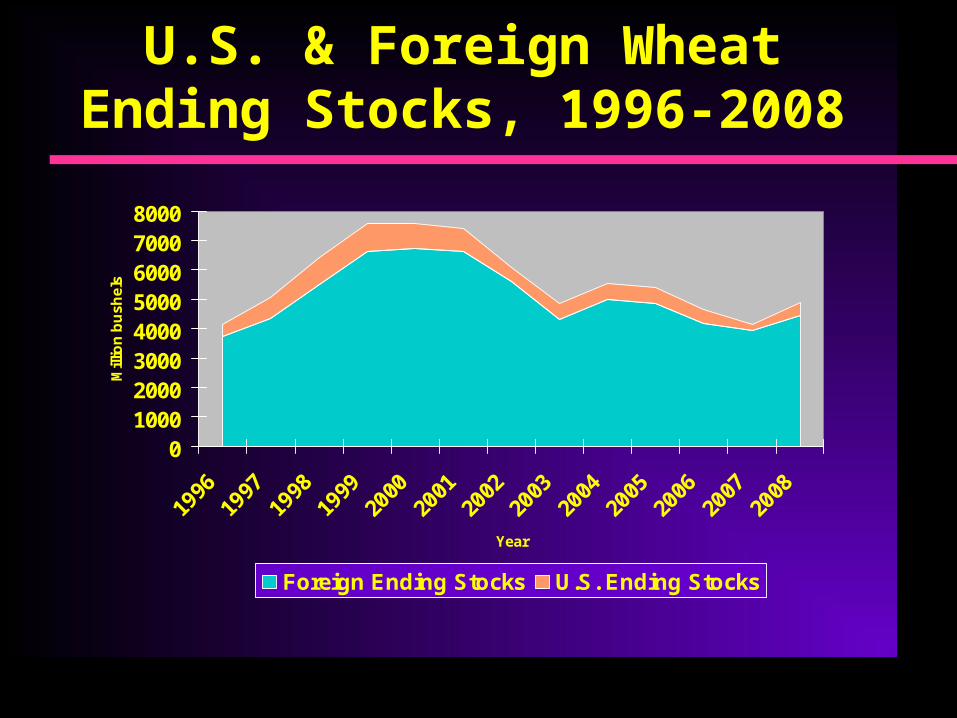
U.S. & Foreign Wheat Ending Stocks, 1996-2008
010002000300040005000600070008000
1996
1997
1998
1999
2000
2001
2002
2003
2004
2005
2006
2007
2008
Year
Mill
ion
bu
sh
els
Foreign Ending Stocks U.S. Ending Stocks

Supply/Demand Projections:2008/2009 Wheat ----------Supply/Demand ----------
Low/High Exp/Exp High/LowBeginning Stocks(MB) 306 306 306Acres (M. A. Planted) 63.0 63.5 64.0Acres (M.A. Harvested) 56.2 56.6 57.1Yield 43.0 43.5 44.0Supply(M. Bu) 2822 2868 2917 Use:
Food, Seed 1044 Feed, Resid 250 Exports 1000
Ending Stocks 494 574 654Projected Price $7.25 $6.50 $5.75
Soybean Situation and Outlook
Historical Perspective and Outlook for 2008

Soybean Production, Ending Stocks, and Price, 1993-2008
0
500
1000
1500
2000
2500
3000
3500
1993 1994 1995 1996 1997 1998 1999 2000 2001 2002 2003 2004 2005 2006 2007 2008
Mill
ion
Bu
$0.00
$2.00
$4.00
$6.00
$8.00
$10.00
$12.00
$14.00
Production Ending Stocks Price/Bu

U.S. Soybean Ending Stocks and Price, 1993-2008
0
100
200
300
400
500
600
700
1993 1994 1995 1996 1997 1998 1999 2000 2001 2002 2003 2004 2005 2006 2007 2008
Mill
ion
Bu
$4.00
$5.00
$6.00
$7.00
$8.00
$9.00
$10.00
$11.00
$12.00
$13.00
Ending Stocks Price/Bu

U.S. & Foreign Soybean Ending Stocks, 1996-2008
0
500
1000
1500
2000
2500
1996
1997
1998
1999
2000
2001
2002
2003
2004
2005
2006
2007
2008
Year
Mil
lio
n B
ush
els
Foreign Ending Stocks U.S. Ending Stocks
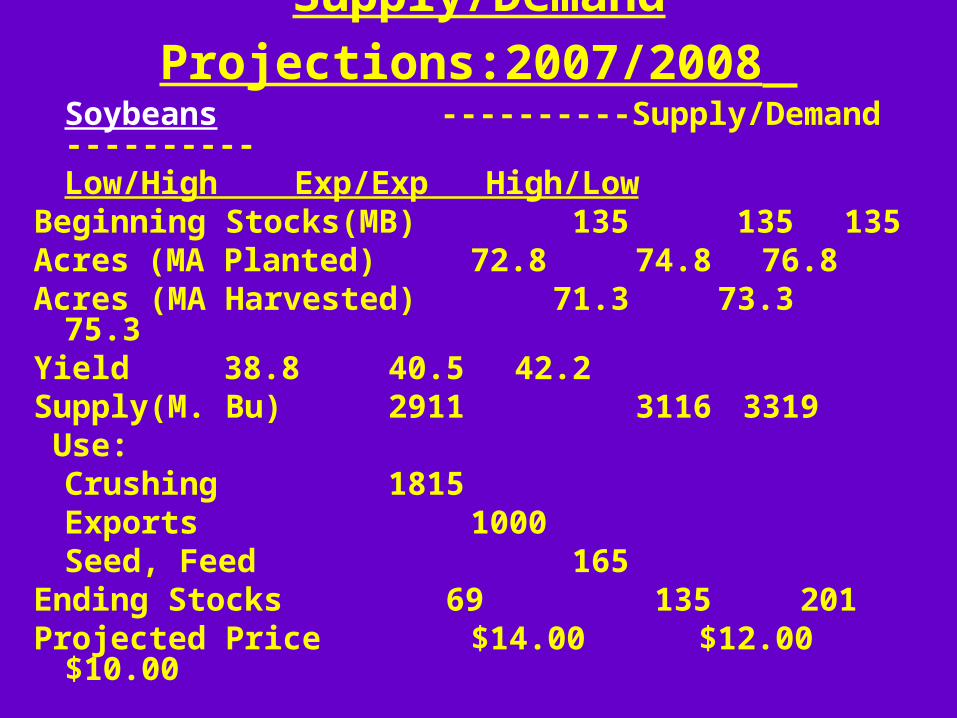
Supply/Demand Projections:2007/2008 Soybeans ----------Supply/Demand ----------
Low/High Exp/Exp High/LowBeginning Stocks(MB) 135 135 135Acres (MA Planted) 72.8 74.8 76.8Acres (MA Harvested) 71.3 73.3 75.3Yield 38.8 40.5 42.2Supply(M. Bu) 2911 3116 3319 Use:
Crushing 1815 Exports 1000 Seed, Feed 165
Ending Stocks 69 135 201Projected Price $14.00 $12.00 $10.00

Cotton Situation and Outlook
Historical Perspective and Outlook for 2008

Cotton Production, Ending Stocks, and Price, 1993-2008
0
5000
10000
15000
20000
25000
30000
1993 1994 1995 1996 1997 1998 1999 2000 2001 2002 2003 2004 2005 2006 2007 2008
Th
ou
san
d B
ales
0
10
20
30
40
50
60
70
80
90
Production Ending Stocks Price(cents/lb)

U.S. Cotton Ending Stocks and Price, 1993-2008
0
2000
4000
6000
8000
10000
12000
1993 1994 1995 1996 1997 1998 1999 2000 2001 2002 2003 2004 2005 2006 2007 2008
Th
ou
san
d B
ales
30
35
40
45
50
55
60
65
70
75
80
Ending Stocks Price(cents/lb)

U.S. & Foreign Cotton Ending Stocks, 1997-2008
0
10000
20000
30000
40000
50000
60000
70000
1997
1998
1999
2000
2001
2002
2003
2004
2005
2006
2007
2008
Year
Th
ou
san
d B
ales
Foreign Ending Stocks U.S. Ending Stocks

Supply/Demand Projections:2008/2009 Cotton ----------Supply/Demand ----------
Low/High Exp/Exp High/Low
Beginning Stocks(MB) 10.2 10.2 10.2Acres (M. P. A.) 9.00 9.25 9.50Acres (MA Harvested) 7.64 7.85 8.07Yield 810 842 872Supply(MB) 23.1 24.0 24.9 Use:
Domestic 4.4 Exports 15.0
Ending Stocks 3.1 4.6 6.1Projected Price/lb $0.74 $0.64 $0.54

What Could Change The Outlook?
South America Plant Mix Non-Farm Economic Conditions in U.S.,
World – Oil Supplies, War Exchange Rates China Weather