copyright by travis kyle mcevoy 2011
TRANSCRIPT

Copyright
by
Travis Kyle McEvoy
2011

The Thesis Committee for Travis Kyle McEvoy Certifies that this is the approved version of the following thesis:
Wind Energy Harvesting for Bridge Health Monitoring
APPROVED BY
SUPERVISING COMMITTEE:
Kristin L. Wood
Richard H. Crawford
Supervisor:

Wind Energy Harvesting for Bridge Health Monitoring
by
Travis Kyle McEvoy, B.S.M.E.
Thesis
Presented to the Faculty of the Graduate School of
The University of Texas at Austin
in Partial Fulfillment
of the Requirements
for the Degree of
Master of Science in Engineering
The University of Texas at Austin
May 2011

Dedication
Dedicated to loving, supportive, and extremely patient parents who know when to push,
when to heckle, and when to simply say "I love you".

v
Acknowledgements
The author would here like to acknowledge to support and aid of Drs. Kris Wood
and Richard Crawford for seeing the potential in a lost student, and in bringing together a
group of diverse personalities to work together and be successful as a unit.
May 5, 2011

vi
Abstract
Wind Energy Harvesting for Bridge Health Monitoring
Travis Kyle McEvoy, M.S.E.
The University of Texas at Austin, 2011
Supervisor: Kristin L. Wood
The work discussed in this thesis provides a review of pertinent literature, a
design methodology, analytical model, concept generation and development, and
conclusions about energy harvesting to provide long-term power for bridge health
monitoring. The methodology gives structure for acquiring information and parameters
to create effective energy harvesters. The methodology is used to create a wind energy
harvester to provide long-term power to a wireless communication network. An
analytical model is developed so the system can be scaled for different aspects of the
network. A proof of concept is constructed to test the methodology's effectiveness, and
validate the feasibility and analytical model.

vii
Table of Contents
LIST OF TABLES .............................................................................................................. IX LIST OF FIGURES .............................................................................................................. X CHAPTER 1: INTRODUCTION............................................................................................ 1
1.1 What is Energy Harvesting and Scavenging?....................................................... 1 1.2 Motivation............................................................................................................. 7 1.3 Challenges and Opportunities ............................................................................. 10 1.4 Hypothesis, Research, and Objectives ................................................................ 10 1.5 Organization of thesis ......................................................................................... 20
CHAPTER 2: REVIEW OF LITERATURE ........................................................................... 22 2.1 Introduction......................................................................................................... 22 2.2 What are the main/essential components to a wind turbine? Is there a size threshold of feasibility?............................................................................................. 27 2.3 What are the most popular fin/turbine architectures, and what are their advantages and disadvantages?................................................................................. 31 2.4 What is the field of pioneering technologies being used to produce electricity using wind energy harvesting?.................................................................................. 43 2.5 What methods are available to increase the power output, operation range, robustness, and operation in urban settings?............................................................. 50 2.6 What work has already been completed in extremely small wind turbine technology? ............................................................................................................... 56 2.7 Discussion ........................................................................................................... 59
CHAPTER 3: CONCEPT DEVELOPMENT: WIND ENERGY SYSTEMS FOR HEALTH MONITORING ................................................................................................................. 61
3.1 Ideation Methodology......................................................................................... 61 3.2 Ideation Resources .............................................................................................. 67 3.3 Executing the Methodology................................................................................ 70 3.4 Functional Modeling........................................................................................... 80 3.5 Innovation Function ............................................................................................ 85 3.6 Concept Results .................................................................................................. 88
CHAPTER 4: DESIGN MODELING AND DESIGN OF EXPERIMENTATION........................... 95 4.1 Quantifying the Constraints, Requirements, and Assumptions .......................... 95 4.2 Analytical Modeling of the Wind Turbine........................................................ 101 4.3 Design of Experimentation ............................................................................... 115
CHAPTER 5: PROTOTYPE DEVELOPMENT AND EXPERIMENTATION.............................. 120 5.1 Proof of Concept ............................................................................................... 120 5.2 Experimentation................................................................................................ 124 5.3 Hybrid Redesign ............................................................................................... 142
CHAPTER 6: CONCLUSIONS AND FUTURE WORK......................................................... 148

viii
6.1 Objectives ......................................................................................................... 148 6.2 Future Research ................................................................................................ 156 6.3 Future Work ...................................................................................................... 160 6.4 Concluding Remarks......................................................................................... 165
APPENDIX A: BETZ'S MAXIMUM EFFICIENCY DERIVATION ......................................... 168 APPENDIX B: DATA ANALYSIS CODE .......................................................................... 171 APPENDIX C: DAMPING CALCULATION CODE.............................................................. 180 APPENDIX D: POWER VS. WIND SPEED CODE .............................................................. 183 APPENDIX E: SIMULATING RANDOM WIND CODE ....................................................... 187 APPENDIX F: LABVIEW BLOCK DIAGRAM ................................................................. 193 APPENDIX G: EXPERIMENTAL PROCEDURE.................................................................. 194 REFERENCES ................................................................................................................ 198

ix
List of Tables
Table 1: Rated power consumption of example node............................................. 13Table 2: Breakdown of power consumption. .......................................................... 14Table 3: Power and energy consumption for text scenarios. .................................. 16Table 4: Power and energy consumption for test scenarios. ................................... 19Table 5: Summary of different control combinations (A. D. Hansen, Iov, Blaabjerg,
& L. H. Hansen, 2004).............................................................................................. 36Table 6: Advantages and disadvantages of HAWTs and VAWTs. ........................ 42Table 7: Previous work on miniature wind turbines (Xu et al., 2010).................... 56Table 8: Parameters used in miniature wind turbine simulations/tests (Xu et al.,
2010)....... .................................................................................................................. 58Table 9: Insights gathered from different literature resources. ............................... 60Table 10: Bill of Materials for Air Force Academy VAWT prototype. ................... 68Table 11: Most common functions to energy harvesting, and inspiration
synonyms..... ............................................................................................................. 82Table 12: Constraints for energy harvesting in a bridge environment...................... 96Table 13: Time span requirements of an energy harvesting system in a bridge
environment. ............................................................................................................. 98Table 14: Operation requirement of the health monitoring sensors and network..... 98Table 15: Safety requirements for the bridge environment. ................................... 100Table 16: Bill of Materials to be used when searching for commercial products... 112

x
List of Figures
Figure 1: Wireless interrogation of embedded passive sensor using external reader coil (Yousef et al., 2010)........................................................................................... 11
Figure 2: Snooper Truck performing maintenance on a bridge (American Association of State Highway and Transportation Officials, n d). ........................... 12
Figure 3: Waveform of power consumption during sampling. ................................ 14 Figure 4: Average power consumption by sample rate. ........................................... 15 Figure 5: Wind speed vs. Capacity factor histogram for Austin, Tx 2009............... 18 Figure 6: Timeline of important events in wind harvesting. .................................... 26 Figure 7: Horizontal axis wind turbine with major subsystems labeled. ................. 28 Figure 8: Wind speed boundary of a 600 Watt wind turbine (Wright & D. Wood,
2004)....... .................................................................................................................. 31 Figure 9: Horizontal and Vertical ("H-Rotor") wind turbines.................................. 32 Figure 10: Helical VAWT in downtown Chicago (Boyle, 2010). ............................. 40 Figure 11: Hymini wind powered personal charger (Craziest Gadgets, 2008). ......... 44 Figure 12: Nheolis 3D wind turbine (Heliosolaire Energies Renouvelables, n d). .... 45 Figure 13: Micro Windbelt by Humdinger Wind Energy, LLC (Forced Green, 2008).
46 Figure 14: Yuji Oha's wind lens concept (Schwartz, 2010b). .................................... 48 Figure 15: Flanged diffuser and wind turbine with flow vectors (Abe & Ohya,
2004)......................................................................................................................... 52 Figure 16: Fixed DC-to-DC compared to controlled power converter (Knight &
Peters, 2005)...... ....................................................................................................... 54 Figure 17: Comparison of controlling methods (Mirecki et al., 2007). ..................... 55 Figure 18: Predicted and actual power outputs of miniature wind turbine (Xu et al.,
2010)....... .................................................................................................................. 58 Figure 19: Energy Harvesting development methodology......................................... 63 Figure 20: Air Force Academy student's piezoelectric fatigue test platform (Walker et
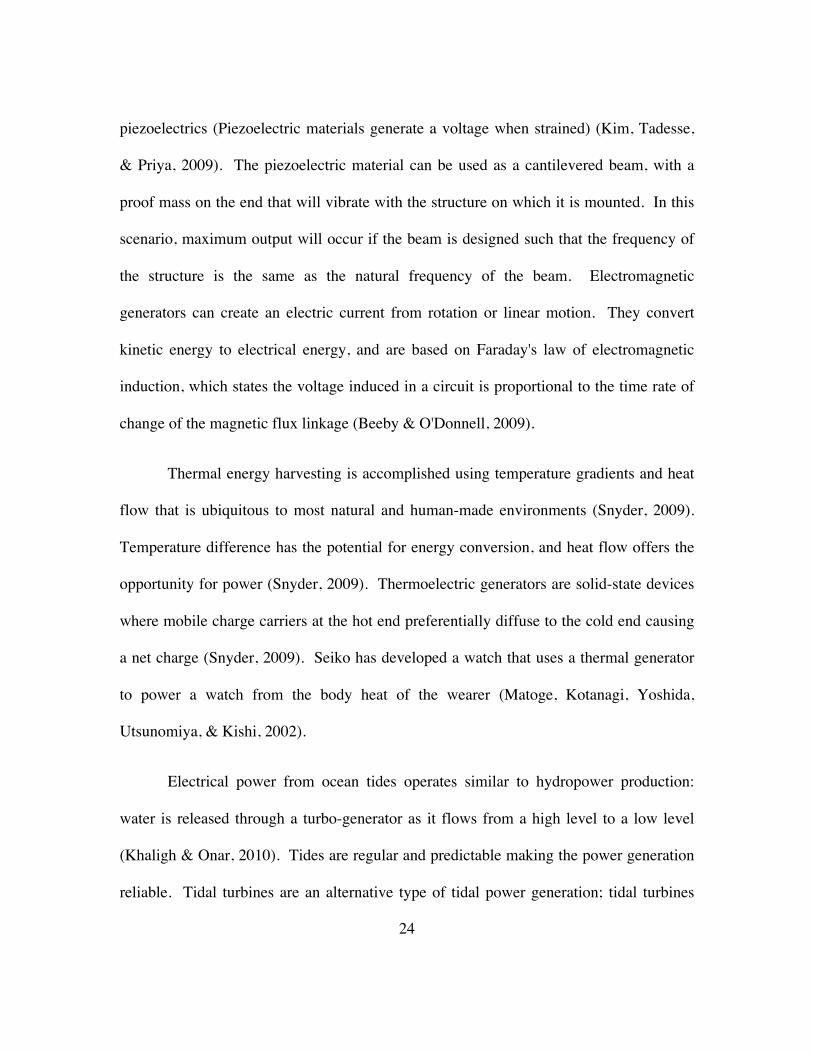
al., 2010). .................................................................................................................. 69 Figure 21: Measured wind speeds at different heights within structure..................... 72 Figure 22: Cross-frame and I-girders of the San Antonio 410 bridge........................ 73 Figure 23: Comparison of wind at girder to surrounding wind and yearly average... 75 Figure 24: Distribution of wind speed at the bottom flange....................................... 77 Figure 25: Mindmap results from Brainstorming with graduate students.................. 78 Figure 26: Hierarchal energy harvesting function structure....................................... 81 Figure 27: Wind function structure with highlighted points of discussion. ............... 83 Figure 28: Counter-rotating concept drawing. ........................................................... 89 Figure 29: Flow accelerating with magnetic attachment concept drawing. ............... 90 Figure 30: Typical wind turbine power output for varying wind speeds. .................. 91 Figure 31: Hybrid wind harvester with striking arm, piezoelectric strip clamp, and
turbine...... ................................................................................................................. 92 Figure 32: Final concept solid model embodiment. ................................................... 93

xi
Figure 33: Full concept mounted to I-girder bridge cross-frame. .............................. 94 Figure 34: Bond graph representation of wind turbine system. ............................... 102 Figure 35: Trial simulation of the analytical model. ................................................ 105 Figure 36: Predicted power from analytical model of two generator sizes, and the
predicted power by Betz's Law. .............................................................................. 107 Figure 37: Comparison of two (4 W and 10 W) motors acting as generators.......... 108 Figure 38: Comparison of different size turbine blades. .......................................... 109 Figure 39: Bond graph including the electrical load. ............................................... 110 Figure 40: Simulating the relationship between charge and time. ........................... 111 Figure 41: State variable results, input wind of 7 m/s. ............................................. 114 Figure 42: Circuit design to measure the prototype turbine output power............... 116 Figure 43: Embodiment of the proof of concept wind turbine................................. 123 Figure 44: Voltage signatures measure from generator and piezoelectric. .............. 125 Figure 45: Anemometer raw data output.................................................................. 126 Figure 46: Piezoelectric voltage events by wind speed............................................ 128 Figure 47: Single voltage event from striking the piezoelectric strip. ..................... 129 Figure 48: Comparison of rotor speed vs. wind speed with the generator coupled and
uncoupled................................................................................................................ 130 Figure 49: Measured average power of prototype wind harvester. .......................... 132 Figure 50: Energy captured by piezoelectric strip in different scenarios. ................ 133 Figure 51: Comparison of analytical vs. empirical power data................................ 134 Figure 52: Determining the damping coefficient of the bushings............................ 135 Figure 53: Determining the damping coefficient of the generator. .......................... 136 Figure 54: Varying damping coefficient in model to better describe data. .............. 137 Figure 55: Comparison of rotor speed to average wind speed with variable damping
coefficient. .............................................................................................................. 138 Figure 56: Correlation of output power and rotor velocity. ..................................... 139 Figure 57: Matching the model to the empirical data by varying the transformer
coefficient. .............................................................................................................. 140 Figure 58: Simulated charge time of updated model................................................ 141 Figure 59: Pivoting rotor assembly and exploded stator assembly. ......................... 144 Figure 60: Wind energy harvester with variable rotor inertia. ................................. 145 Figure 61: Concept mounted to cross frame on the bridge structure. ...................... 146 Figure 62: Comparison of power output to large generators.................................... 152 Figure 63: Large generator with increased swept area. ............................................ 153 Figure 64: Simulation of a wind harvester large enough to power a gateway. ........ 154 Figure 65: Wireframe for the next generation wind harvester. ................................ 159 Figure 66: Close up of wind harvesting components and exploded view of
mechanical switch................................................................................................... 160 Figure 67: Power ratio as a function of wind speed ratio......................................... 170

1
Chapter 1: Introduction
1.1 WHAT IS ENERGY HARVESTING AND SCAVENGING?
Energy Evolution
The advancement of human technology and potential has closely mimicked the
efficient use of energy and the availability of increasingly dense sources of power.
Burning wood allowed early hominins to stay warm and advance into colder climates
(Goren-Inbar et al., 2004). Harnessing wind allowed early explorers to sail to new lands;
steam engines used coal to produce power to run locomotives and began the industrial
revolution. Many other technologies had to be developed to coincide with new energy
forms, for example energy storage and transportation. In addition, the effects our
consumption of energy forms become apparent the longer we use them; carbon emissions
may be having large effects on the climate and subsequently our lives. This is a
debatable topic, as is the opinions regarding the extent of our remaining reserves of our
primary energy sources: coal, oil, and gas. However, without debate there will be an end
to those reserves, at which point new energy is going to be needed.
Harvesting has been the method that humans have used for millennia to gather
food, the energy source for our bodies. Energy harvesting for use in the technologies we
have developed though requires a slightly different definition. Energy harvesting is
defined to be the direct use of in situ environmental energy for the purpose of
transforming it into a form, typically electricity, usable by the technology it is to power.
Traditionally, oil, gas, and coal are not considered harvested energy because humans
merely drill or mine to remove them from the ground in one location, and then transport
them to the location it is needed, which will be here viewed as more analogous to a
hunting and gathering model of food acquisition. Jared Diamond discusses in Guns,

2
Germs, and Steel, why the successful hunter-gatherer adopted food production despite
demonstrations that “the first farmers in many areas were smaller and less well nourished,
suffered from more serious diseases, and died on the average at a younger age than the
hunter-gatherers they replaced” (Diamond, 1999). So then what is going to tip “the
competitive advantage away from the former,” hunting and gathering for them and fossil
fuels for us, “toward the latter” farming for them and an energy alternative for us
(Diamond, 1999)? The first factor Diamond cites is “decline in the availability of wild
foods. The lifestyles of hunter-gatherers has become increasingly less rewarding over the
past 13,000 years, as resources on which they depended have become less abundant or
even disappeared” (Diamond, 1999).
Oil and natural gas reserves are declining; instead of geysers of oil exploding
from the top of a small hill in Texas, we are drilling holes thousands of feet under the
ocean (Knowles, 1978). Hunting and gathering oil is essentially becoming “increasingly
less rewarding.” Harvesting sources like wind and solar energy by cultivating it using
panels or turbines follows a farming analogy. Harvesting sets aside resources to grow a
reserve that can be tapped when necessary, much the same as a harvest of crops can be
set aside during the summer for food during the winter. Perhaps energy harvesting is the
next evolution for our society to sustain the way we live despite the fact that it is less
developed and more difficult to obtain. That leaves one final model of acquiring food:
scavenging, which can also be used as an analogy for a form of energy acquisition.
Scavenging is defined in the Oxford American Dictionary as searching for usable
objects or material among rubbish or discarded things (Ehrlich, Flexner, Carruth, &
Hawkins, 1986). Energy scavenging can then be defined as the acquisition of a power
source from the wastes of other technologies, for example using the waste heat from an
internal combustible engine for some other purpose. Scavenging is using energy that an

3
agent is losing and would otherwise be dissipated or discarded into the environment. Just
as there was a shift in human history from hunter-gatherer societies to agriculture, there is
large potential for our energy society to do the same. Gathering societies had to remain
small so that the environment could supply them with enough food, but as agriculture
began, societies could expand into cities. Microbes and bacteria are the ultimate
scavengers, but there is even a subculture that lives off the wastes of society: Freeganism
is an alternative lifestyle where the people live off the wastes of the population (“What is
a Freegan,” 2008).
Finding the niches where harvesting and scavenging energy are viable resources
will be very helpful in diversifying how humans obtain the energy we need to continue to
progress. Innovation in these areas is going to be even more crucial to finding new ways
to use the technologies and resources we have.
Past, Present, and Future of Energy Harvesting and Scavenging
Resources drive societies to success, and ultimately failure. Jared Diamond
explores several societies that originally flourished, only to eventually fall to pieces. A
striking example cited by Diamond in Collapse is the society on Easter Island, where a
society which constructed the infamous monuments, fell apart after deforestation
wrecked the island’s environment; “the collapse of Easter society followed swiftly upon
the society’s reaching its peak of population, monument construction, and environmental
impact” (Diamond, 2005). Diamond muses “’What did the Easter Islander who cut down
the last palm tree say while he was doing it?’ Like modern loggers, did he shout ‘Jobs,
not trees!’? Or: ‘Technology will solve our problems, never fear, we’ll find a substitute
for wood’? Or: ‘We don’t have proof that there aren’t palms somewhere else on Easter,
we need more research…’” (Diamond, 2005). I can see a correlation to the man who
pumps the last barrel of oil. The resources current societies use are being depleted, and it

4
is important to make the most out of what is left. To continue consuming oil the way
we do, oil companies are going to pursue ever more extreme locations to drill for oil.
Diamond sums up the parallel in a concluding paragraph:
“The Easter Islanders’ isolation probably also explains why I have found
that their collapse, more than the collapse of any other pre-industrial
society, haunts my readers and students. The parallels between Easter
Island and the whole modern world are chillingly obvious. Thanks to
globalization, international trade, jet planes, and the internet, all
countries on Earth today share resources and affect each other, just as did
Easter’s dozen clans. Polynesian Easter Island was as isolated in the
Pacific Ocean as the Earth is today in space. When the Easter Islanders
got into difficulties, there was nowhere which they could flee, nor to which
they could turn for help; nor shall we modern Earthlings have recourse
elsewhere if our troubles increase. Those are the reasons why people see
the collapse of Easter Island society as a metaphor, a worst case scenario,
for what may lie ahead of us in our own future.”
One solution may be to more efficiently use the resources that remain. However,
efficiencies must improve if we are going to continue using these resources; efficiencies
not necessarily in the machines, but in the overall process. Humans may have done this
before: the Running Man Theory by Drs. Dennis Bramble and Dan Lieberman, explains
how efficiently getting oxygen into the blood stream, and becoming bipedal made us the
most efficient runners, explaining why early ancestors may have left the tree tops in the
first place (McDougal, 2009). To become as efficient as possible is going to require
recovering any energy loses to be used in other aspects of the system; energy scavenging
is a way to accomplish this goal. An immediate application is to scavenge energy to

5
power sensors that can be used to monitor the system; feedback and information can be
used to improve operation efficiency and prevent destructive actions. In biological
systems pain signals the system (animal) of a problem with the current operation which
requires attention to prevent a destructive failure (McDougal, 2009). Efficiencies are
going to be tightly controlled in these systems so that they provide the optimal outputs.
Intelligent systems are going to be vital to developing systems that can provide such
efficient designs. There is a vast environment to create intelligent machines and devices,
making a large possible demand for scavenging systems to power those sensors.
In addition to scavenging to improve system efficiencies, diversifying what we
use as sources is going to need to begin playing a much larger role in our energy
equation. The human animal is at the top of the food chain because we have developed
the ability to live in every environment, and find sustenance in each. We have a diverse
palette to choose from, and the intelligence to obtain the food that we can eat, and make
edible the food we cannot (Kurlansky, 2002). In contrast, we currently get the majority
of our energy from coal, oil, and gas, with small contributions from nuclear and
hydroelectric, and minor contributions from solar, wind, and wave (Goldemberg, 2007).
Coal, oil, gas, and hydroelectric have environmental and climatic consequences (possibly
severe); nuclear has waste management issues. Minimizing the uses, or drastically
reducing them, has the potential to maintain and increase our energy capabilities while
solving some of the environmental problems.
Introduction and competition with current technologies are going to hinder new
technologies the most. Therefore, perfecting systems first in niches where they can be
cost effective are going to be important and viable entrances. Off the grid and remote
locations are great testing grounds for new technologies to prove their abilities and
develop the technology. Using in situ energy in remote bridge locations is one such

6
example of a niche where new innovations can be used to power lights, signs, and sensors
on bridges. To power these devices using the current system requires major transmission
lines, which have many loses and are expensive to install and maintain.
The future for energy harvesting and scavenging is bright; society is going to
move to an extremely diverse set of acquisition methods unique to each environment, and
network them together. In addition, hopefully we will begin to cherish each bit of energy
to maximize how it is used in our lives. These tasks are by no means trivial, and it is
going to take a lot of initiative to accomplish. Diamond states this in the concluding
paragraph on Easter Island by offering the warning “if mere thousands of Easter Islanders
with just some stone tools and their own muscle power sufficed to destroy their
environment and thereby destroyed their society, how can billions of people with metal
tools and machine power now fail to do worse?” (Diamond, 2005). This is where
technology, communication, and innovation can make the difference; smart infrastructure
is going to aid us in this pursuit by giving us feedback on the state our energy systems are
in. Energy management will be as important as energy production. I can see the energy
system developing into an ecological system, where the waste of one part is the energy
source for another; each component working in a symbiotic relationship to survive on
what is available. Diamond echoes these sentiments in his concluding chapter of
Collapse: “the world would not even have to decrease its current consumption rates of
timber products or of seafood: those rates could be sustained or even increased, if the
world’s forests and fisheries were properly managed… we have the opportunity to learn
from the mistakes of distant peoples and past peoples. That’s an opportunity that no past
society enjoyed to such a degree” (Diamond, 2005).
Diamond, a geography professor at UCLA, looks to save our society by showing
what was successful and unsuccessful in previous civilizations, and how the management

7
of the environment and resources is exceedingly important. All the resources he
discusses can be broken down into energy; our resources, which are directly related to
energy, have the same need for diversification and management if we are going to be
successful.
Energy comes in many forms: kinetic, potential, chemical, thermal, and electrical
(Beaman & Paynter, 1993). Humans have widely adopted electrical energy as the
preferred means to transfer the energy from source to application. The current main
sources of energy are from coal, natural gas, oil, and nuclear which is converted into
electricity (with the exception of oil). The conversion is carried out mostly in turbines
that convert the kinetic motion after combustion of the coal or gas or the fusion of the
atoms into electricity. This same process can be used to convert anything with kinetic
energy into electricity. A readily available source of kinetic energy is wind, a direct
consequence of the interaction of the atmosphere and sun (Smil, 2003).
Wind energy is an underutilized energy “crop;” large wind farms are growing, but
they are located far from where the energy is needed. Urban wind harvesting is possible,
and is beginning to be pursued as viable technologies with minimal noise and operation at
low wind speeds. Unused urban real estate would be ideal places to mount wind
capturing devices to power local buildings. Structures like house rooftops, telephone
poles, bridges, and light poles offer unused structures for mounting, and are near energy
consumptive products.
1.2 MOTIVATION
Similar to the biological systems previously discussed, our society needs feedback
on the supporting structures that aid us in conducting our lives. What would we do if we
no longer had access to running water? How would we react if everything were dark as

8
soon as the sun went down? Can we imagine what it would be like if all the roadways
suddenly became impassable? Keeping these systems healthy and working properly are
the motivations for the research presented here, specifically in powering the information
acquisition and communication systems.
1.2.1 Health Monitoring of Infrastructure
Infrastructure is defined as "the basic physical and organizational structures
needed for the operation of a society or enterprise (Online Compact Oxford English
Dictionary, 2011), or the services and facilities necessary for an economy to function"
(Sullivan & Sheffrin, 2003). Many of these structures were built many decades ago, and
are being pushed to and beyond their designed lives. As a result, there are deteriorations
in these structures that can have catastrophic ramifications. The collapse of the Interstate
35 bridge in Minneapolis, Minnesota in 2007 was a display of such ramifications
(National Transportation Safety Board, 2008). Monitoring the health of structures, such
as bridges, is important for scheduling maintenance and keeping the patrons who use
these structures safe.
Bridges are an example of infrastructure with aging members that are difficult,
time consuming, and expensive to inspect (Bai, Atiquzzaman, & Liljia, 2004; Ko & Ni,
2004; Memmott, 2007). Currently, visual inspections of cracks on a bridge are scheduled
based on age and previous conditions of the bridge. Performing this inspection is
difficult due to the need to reroute traffic, use of specialized vehicles, special training of
inspectors, and the environments bridges span. Of a population of 600,000 bridges in the
United States, a reported 70,000 have been labeled in critical condition. With the
collapse of the IH-35 bridge in Minnesota, the public's attention has been drawn to the
danger posed by failing bridges (Hohmann, O'Toole, Ramsey, & Smith, 2008).

9
As a potential solution to current inspection difficulties, wireless sensor nodes are
being developed for bridge application. A key issue involved in this development is the
method of powering the nodes across all bridge types and locations. Harvesting energy
from the environment is identified as a potential solution to powering the sensor and
wireless network (Weaver, K. L. Wood, Crawford, & D. Jensen, 2010). Harvesting can
potentially lengthen the life cycle of a system, decreasing maintenance and costs. Many
requirements, constraints, and design variables must be addressed when developing an
energy harvesting system.
1.2.2 Environmental Impacts
Where are we going to get energy from in the future? Three of the fourteen
Grand Challenges identified by the National Academy of Engineering are directly related
to energy production or the use of fossil fuels. In addition, there is a debate about the
remaining reserves of fossil fuels, specifically oil, and other rare materials that are
available for use (Roberts, 2004). These are two of the many reasons why finding
alternative ways to harness energy available and transform it into electrical energy
deserves attention.
There is much research being committed to large energy generation; large wind
farms, and many solar farms are used similar to classic coal, nuclear, and natural gas
power plants to produce electricity in vast quantities for a large grid which is then
distributed to customers. These systems typically capture energy when it is available in
an optimum range, but there is energy also available during non-peak range that can be
used in the proper application. Providing electricity for low power sensors in remote
locations, with difficult maintenance procedures, and extreme environments is an

10
example of such an application; monitoring infrastructures has these requirements and
constraints and provides a good research and design opportunity.
1.3 CHALLENGES AND OPPORTUNITIES
The challenge is to power sensors, which assess the condition of a bridge, and be
able to communicate the assessment to the appropriate entities. The opportunity is to be
innovative in accomplishing the challenge, furthering the technology, innovation, and
aspirations of the things that follow. Laying a foundation that others may use to expand
the abilities of energy harvesting, health monitoring, and innovative thinking has greater
implications than merely finding a solution.
1.4 HYPOTHESIS, RESEARCH, AND OBJECTIVES
1.4.1 Previous Work: Harvesting Feasibility
There is a larger project occurring, for which the research presented here
represents just the aspect concentrating on energy harvesting, specifically harvesting
wind energy. A brief overview of the other aspects of the project is discussed here to
give direction and a point of reference.
As previously discussed, the research is focusing on the health monitoring of
bridges' structural components such as girders and reinforcement material. Two kinds of
sensors are used to provide information about the physical condition of the bridge:
corrosion sensors and strain gauges.
A corrosion sensor is used to detect the initiation of corrosive degradation within
concrete bridges. The sensors are idealized as RLC circuits, embedded in the bridge
during construction, with a resonant frequency dependent on the inductance and

11
capacitance (Yousef, Pasupathy, S. Wood, & Neikirk, 2010). The resonant
characteristics are used to make inferences about the condition within the bridge, and
suggest the need for action to ensure the safety of the structure. The sensors do not
require an outside power source because they are powered and interrogated wirelessly by
inductively-coupled magnetic fields. Figure 1 shows a schematic of the sensor embedded
in the concrete, and the reader above the surface of the bridge.
Figure 1: Wireless interrogation of embedded passive sensor using external reader coil (Yousef et al., 2010). Strain gauges are used on the structure to determine crack propagation on the
girders that support the deck of the bridge. These sensors are typically located under the
bridge, and are extremely difficult to reach. Special equipment is required to access the
underside of a bridge, such as the snooper truck seen in Figure 2. Acquiring the data
wirelessly becomes very attractive in this application due to this limited accessibility.
However, the wireless monitoring system has problems near large masses of steel, such
as a bridge (Fasl et al., 2010). Other aspects of the project are developing the
communication of the wireless nodes, and testing the monitoring schemes. The radio
transmission has been identified as one of the most power hungry components to the

12
network; instead of transmitting all the data, local processing of the data has been
suggested in order to decrease this power consumption (Fasl et al., 2010). The gauges,
transmitter, and processor all require a power source, which presents the inspiration for
the research presented here.
Figure 2: Snooper Truck performing maintenance on a bridge (American Association of State Highway and Transportation Officials, 2011).
The power requirements for the wireless sensor network have been previously
assessed. There are a variety of sensing needs that can be used to obtain different
information from the bridge; several of the different schemes were assessed for
feasibility. The node consists of a transmitter and a sensor, and was assessed for duty
13
cycles of constant transmission, 30 Hz sampling with hourly transmission, one sample
and transmission per second, minute, hour, day, and month (Weaver, K. L. Wood,
Crawford, & D. Jensen, 2010). The constant transmission scheme has sustained node
active to serve as a router passing information from low-power end nodes back through
the network to the data processing or storage components.
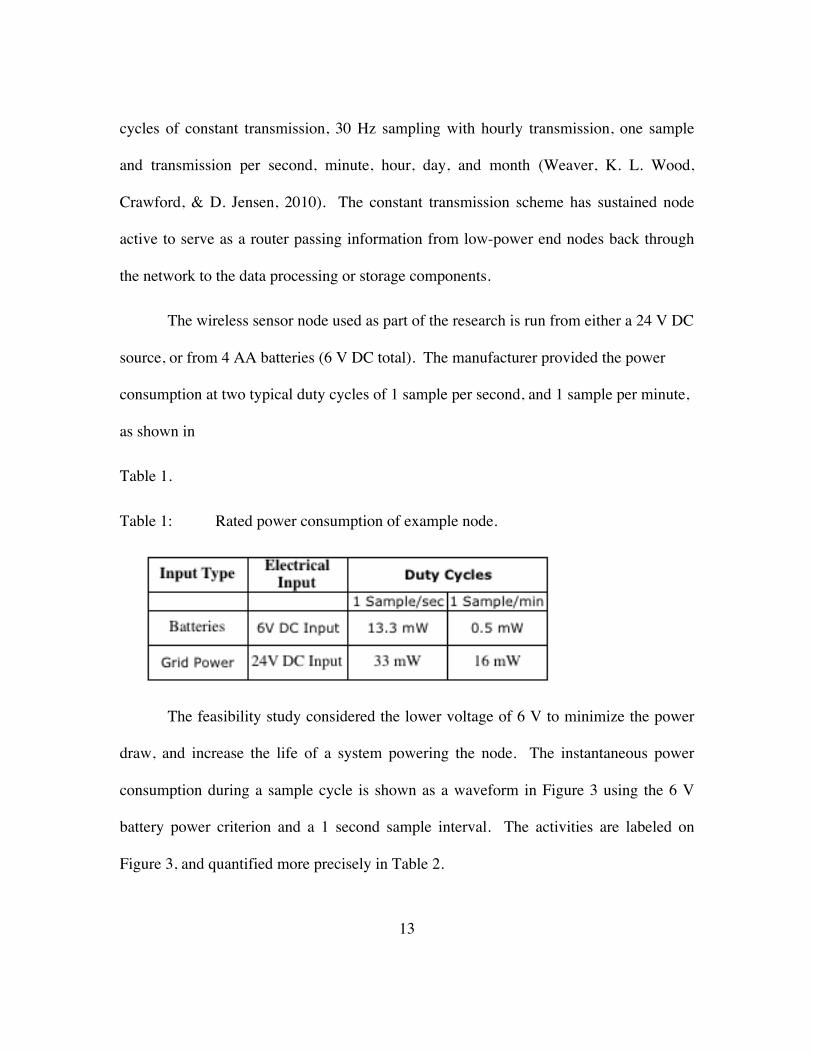
The wireless sensor node used as part of the research is run from either a 24 V DC
source, or from 4 AA batteries (6 V DC total). The manufacturer provided the power
consumption at two typical duty cycles of 1 sample per second, and 1 sample per minute,
as shown in
Table 1.
Table 1: Rated power consumption of example node.
The feasibility study considered the lower voltage of 6 V to minimize the power
draw, and increase the life of a system powering the node. The instantaneous power
consumption during a sample cycle is shown as a waveform in Figure 3 using the 6 V
battery power criterion and a 1 second sample interval. The activities are labeled on
Figure 3, and quantified more precisely in Table 2.

14
Figure 3: Waveform of power consumption during sampling. Table 2: Breakdown of power consumption.
Function Power (mW) Δt (ms) Power-up 200 12.4
Settle power 52.5 14.5 Measure analog 73.4 13.0
Prepare data 37.9 12.0 Radio activity (transmit data) 207 29.0
Total – active period
154 (average) 81
Sleep period 0.3 variable
The yearly average for the different sampling rates was calculated for three
transmitter modes: always on, deep sleep, and completely off between samples. Figure 4
shows a chart of the calculated average power requirements.

15
Figure 4: Average power consumption by sample rate. The feasibility was examined using high, medium, and low power scenarios, and
then compared to the available energy that may be harvested. The high power mode is
for constant transmission, when the node is acting as a router; the medium power mode
transmits at 30 Hz for ten weeks, and then once per hour for the rest of the year; and the
low power mode samples once per day with a deep sleep between samples (Weaver, K.
L. Wood, Crawford, & D. Jensen, 2010). Table 3 summarizes the power and energy
requirements for the different scenarios.

16
Table 3: Power and energy consumption for text scenarios.
Scenario Average Power Yearly Energy
Router mode (radio always on) 207 mW 6.53
MJ 1.81 kWh
30 Hz (10 weeks) / hourly
rest of year
60.7 mW (30Hz) 300 µW (hourly)
11.9 kJ 3.30 Wh
One sample / day (with deep sleep) 9 µW 284 J 78.8
mWh
For some locations grid power is readily available, but many bridges are located
in remote areas where running wires to transmit grid electricity is not economically
feasible. The feasibility study considered solar, wind, and vibration energy densities, as
well as disposable batteries. The life cycle of the system exceeds the shelf life of
batteries, creating a challenge for alternative forms of power. The feasibility determined
solar, wind, and vibration would be capable of powering different aspects of the system
(Weaver, K. L. Wood, Crawford, & D. Jensen, 2010).
Harvesting the energy in the wind has been utilized for centuries from wind mills
used to pump water to propelling boats around the world (Meyers, 2009a). Converting
wind energy into electricity is a more recent development, which has increased
dramatically at different times in history. A more complete assessment of the history is
presented later in Chapter 2. More focused on the application, the feasibility of a wind
system for health monitoring on a bridge has been previously demonstrated showing that

17
adequate energy could be harvested in many environments for wireless monitoring
(Weaver, K. L. Wood, Crawford, & D. Jensen, 2010).
1.4.2 Development of Analytical Modeling
An analytical model of a sample wind turbine was conducted to gain insights into
important parameters of miniature wind turbines. A Mathmos Miniature LED wind
turbine was used during the experimentation, and in developing the models. Metamodels
developed from the experimental data were used to determine the relationship between
design variables and power output. Finally, an optimization to minimize size while
maximizing duty cycle (operating time) of this system was carried out to set up an
analytical model and the basis for simulation. The simulation is designed to predict the
life of the system based on the number of discharges required of the battery. A random
number generator using a normal distribution produces the simulated wind input value.
The parameters used to describe the normal distribution came from a year of data on
wind speeds in Austin, TX. A histogram of this data was developed to show the capacity
factor vs. wind speed, using a regression line to approximate the trend for the simulation.
The capacity factor is the normalized amount of time the value, in this case wind speed,
occurs. Figure 5 shows the histogram and regression line.

18
Figure 5: Wind speed vs. Capacity factor histogram for Austin, Tx 2009.
The miniature wind turbine utilized a vane style of fin, and was used during initial
experimentation, and to develop the coefficient of performance. However, other fin
architectures needed to be investigated, and so two other fin designs were constructed
using SLS technology: a Savonius and helical fin. The different architectures are
described in more detail in Chapter 2. Table 4 shows selected results from the
simulations, where the utility is almost identical for the different architectures. The
optimization was carried out using compromise programming, which uses weights as
variables in addition to the input variables (Chen, Wiecek, & Zhang, 1999; Yu &
Leitmann, 1974; Zeleny, 1973). These values are reflected in the results. Alternatives to
vane turbine fins are investigated because they offer similar results in a miniature wind
turbine application. The comparison of the fin architectures was an important
investigation during this stage of the research.

19
Table 4: Power and energy consumption for test scenarios.
The analytical modeling presented here was used as background research, and to
set up future modeling. The use of a miniature turbine was chosen to map to the project,
and to give comparable variables to the expected requirements and constraints presented
in the problem. Further discussion of the information and insights gathered will be
discussed in Chapter 4, but the optimization shows the importance of determining the
coefficient of performance for the generator, the optimal speed of the performance, and
matching that to the environment. In addition, the aerodynamic effects play a strict role
in the efficiency of the turbine; making the turbine fins with very few inaccuracies is
important. This is just the start of insights that will be documented throughout the
process.
1.4.3 Objectives
The purpose of this research is to demonstrate the use of wind energy to power
remote systems for health monitoring. A direct result of this research is concept
generation, modeling, and an implementable prototype that is developed to validate the
research being conducted. Within the scope of the research, several objectives are
identified below:
1. Review the previous art and literature, and evaluate the effectiveness of these to
provide innovative avenues.

20
2. Use ideation and concept generation techniques to develop a plethora of concepts
to potentially be implemented.
3. Use design modeling to develop an understanding of the important parameters,
constraints, and design variables to be used during implementation.
4. Use the previous work to develop a prototype, and validate the modeling by
testing prototype and analyzing the results.
5. Draw conclusions about the consequences, ramifications, and opportunities of
wind energy harvesting, and discuss potential future research in the area.
1.5 ORGANIZATION OF THESIS
Chapter 1: Introduction to Energy Harvesting and Scavenging and Bridge Health
Monitoring
Chapter 2: A Review of the Field of Literature and Technology
Chapter 2 is a review of literature about wind energy harvesting, and the different
components involved in a wind harvesting system. In addition, an investigation of the
prior art and field of wind harvesting products available commercially is presented.
Chapter 3: Concept Development for Low Power Wind Energy Harvesting
Chapter 3 discusses the concept generation methodology, the results from several
techniques and a methodology that is developed to guide harvester development.
Chapter 4: Design Modeling
Chapter 4 describes the design modeling used when developing the energy
harvesting system. It quantifies the constraints, requirements, and assumptions. In
addition, the equations and laws used in the modeling are presented, ending with lab and
field experiments.
Chapter 5: Prototype Development and Experimentation

21
Chapter 5 presents the proof of concept and the developed system. In addition, a
next-generation concept is described.
Chapter 6: Conclusions and Future Research Opportunities
Chapter 6 presents a summary of the previous work carried out in this research,
and the pertinent conclusions. Future work is discussed, both as potential next generation
of the system and research topics of interest.

22
Chapter 2: Review of Literature
A review of the literature describing different aspects of wind turbines is
conducted to obtain an understanding of the state of the art and the historical progress of
the technology. The review begins with a broader introduction to energy harvesting
sources and technologies, and is then more focused to harvesting wind energy. To drive
the review, five initial questions are posed; the questions provide both direction to the
research and organization to the review. The questions begin with general technology
involving wind turbines, and become more focused on the topic of small-scale turbines
for low power applications. Many resources are utilized as part of the literature review,
including journal articles, periodicals, books, and patents.
2.1 INTRODUCTION
Energy harvesting occurs all around the world; a definition of energy harvesting
can be quite broad. The broadest definition found is "the process of capturing and storing
energy" (Parker, 2011). This definition leaves open the source of the energy that is being
captured, and the medium of storage. Storing electrical energy, for instance, can be
obtained directly by batteries or capacitors. What's to say that oil is not a medium that
stores cretaceous solar energy (Tuite, 2007)? A narrower definition, used in the
remainder of this thesis, is "capturing energy from a regularly present source to be used
or stored by a system."

23
This definition will typically exclude fossil fuels because they must typically be
extracted from the ground and then transported to power plants that subsequently
transform the stored energy into a usable form. Energy forms that are considered
harvesting include solar, thermal, wind, vibration, tidal, and hydro. Solar, thermal,
vibration, and tidal are discussed briefly before transitioning into the wind harvesting
literature review.
Harvesting solar energy can be carried out in many different ways. The most
common method to transform sunlight to electricity is using Photovoltaic (PV) cells.
Photovoltaic materials are made to absorb light. The absorbed energy from the light
excites the material’s electrons, which escape from their normal positions in the atoms of
the semiconductor and begin flowing (Khaligh & Onar, 2010). PV cells are typically
made of three types of semiconductor materials: silicon, polycrystalline thin films, and
single-crystalline thin films (Khaligh & Onar, 2010). Single-crystalline thin films require
less manufacturing, but have a lower efficiency than polycrystalline thin films. Silicon
PV cells are made by forming a film of silicon on a glass substrate. Alternative use of
solar energy utilizes parabolic mirrors to concentrate the sunlight onto a pipe containing
oil; the heat from the oil is then used to generate steam employed in a steam turbine to
create electricity (Tuite, 2007). Alternative solar powered technologies include the
Stirling Engine, solar powered steam engines, and greenhouses (Khaligh & Onar, 2010).
Vibration energy harvesting has a vast field of technology that involves
converting inherent vibrations to electricity using such technology as electromagnetic, or
24
piezoelectrics (Piezoelectric materials generate a voltage when strained) (Kim, Tadesse,
& Priya, 2009). The piezoelectric material can be used as a cantilevered beam, with a
proof mass on the end that will vibrate with the structure on which it is mounted. In this
scenario, maximum output will occur if the beam is designed such that the frequency of
the structure is the same as the natural frequency of the beam. Electromagnetic
generators can create an electric current from rotation or linear motion. They convert
kinetic energy to electrical energy, and are based on Faraday's law of electromagnetic
induction, which states the voltage induced in a circuit is proportional to the time rate of
change of the magnetic flux linkage (Beeby & O'Donnell, 2009).
Thermal energy harvesting is accomplished using temperature gradients and heat
flow that is ubiquitous to most natural and human-made environments (Snyder, 2009).
Temperature difference has the potential for energy conversion, and heat flow offers the
opportunity for power (Snyder, 2009). Thermoelectric generators are solid-state devices
where mobile charge carriers at the hot end preferentially diffuse to the cold end causing
a net charge (Snyder, 2009). Seiko has developed a watch that uses a thermal generator
to power a watch from the body heat of the wearer (Matoge, Kotanagi, Yoshida,
Utsunomiya, & Kishi, 2002).
Electrical power from ocean tides operates similar to hydropower production:
water is released through a turbo-generator as it flows from a high level to a low level
(Khaligh & Onar, 2010). Tides are regular and predictable making the power generation
reliable. Tidal turbines are an alternative type of tidal power generation; tidal turbines

25
are similar to wind turbines, and are located in river estuaries with strong currents or
wherever there is strong tidal flow (Khaligh & Onar, 2010).
Using wind energy to enhance our capabilities or ease our burdens is not new
technology. Evidence of the first practical wind turbines has been found in Iran dating to
700 A.D.; these turbines were likely used to pump water and operate grinding wheels
(Meyers, 2009a). Scottish Professor James Blyth constructed the first known electricity
generating wind turbines in 1887 (Nixon, 2008). Figure 6 shows a timeline of different
events in the history of wind harvesting to give an idea of the progression of the
technology and begin the discussion of the focus of the research; the remainder of the
literature presented follows the methodology discussed previously.

26
Figure 6: Timeline of important events in wind harvesting. The historical perspective and research conducted in preparation for this project
produced the five following queries:
• What are the main/essential components to a wind turbine? Is there a size
threshold of feasibility?
• What are the most popular fin/turbine architectures, and what are their
advantages and disadvantages?

27
• What is the field of pioneering technologies being used to produce electricity
using wind energy harvesting?
• What methods are available to increase the power output, operation range of
speeds, robustness, and operation in an urban environment?
• What work has already been completed in extremely small wind turbine
technology?
2.2 WHAT ARE THE MAIN/ESSENTIAL COMPONENTS TO A WIND TURBINE? IS THERE A SIZE THRESHOLD OF FEASIBILITY?
There are four main subsystems to a wind harvesting system: the fin blades, the
transmission system, the generator, and safety and control systems, which can be seen in
Figure 7 (Meyers, 2009b; Stiesdal, 1998). The fin blade shapes are governed by
aerodynamic properties; small deviations and alterations to shape can have drastic effects
on the performance characteristics (Stiesdal, 1998). In addition to shape, considering the
wind that is prevalent in the region has important ramifications on blade design (Meyers,
2009b).

28
Figure 7: Horizontal axis wind turbine with major subsystems labeled. The transmission system connects the fin blades to the turbine, and includes the
hub, the rotor shaft, bearings, any gearing, and a coupler (Stiesdal, 1998). The hub
connects the fin blades to the shaft, which transmits the rotation. Gearing is typically
used to increase or decrease the speed or torque, and the coupler connects the rotor shaft
to the generator. The generator converts the rotational motion from the transmission
system into electricity (Stiesdal, 1998). Many different types of generators are available

29
(Polinder, van der Pijl, Vilder, & Tavner, 2006). The different types, the advantages, and
disadvantages are discussed in more detail in a later section.
The safety and controls system encompasses many different components that
combine to increase the efficiency of the total wind harvesting system and protect it in
the case of dangerous situations (Stiesdal, 1998). Speed controllers are sometimes used
to categorize different types of wind turbines; the different categories are explained later
in more detail (A. D. Hansen, Iov, Blaabjerg, & L. H. Hansen, 2004). Safety controls
that stop the wind turbine during extreme conditions have been included to prevent
damage. An example is a system called "tip brakes" developed by Juul in 1956 to stop
rotation during extreme wind conditions (Nixon, 2008; Stiesdal, 1998).
When operating a wind system, the wind is going to vary in speed and regularity,
which causes the harvester's operation to fluctuate (Stiesdal, 1998). The trend in wind
power is to build larger turbines that produce more power per unit; the driving force
behind this trend is economics. The installation and foundation costs justify fewer large
units rather than using a large network of smaller turbines. However, it has been
suggested that the common wind turbines that resemble windmills have reached their
maximum size due the necessity of cyclically reversing gravity; the fins on these
megawatt turbines are extremely long causing significant stress at the hub when traveling
from the low position to vertical (Eriksson, Bernhoff, & Leijon, 2008).
Wright and Wood discuss the starting and low wind speed behavior of a small
Horizontal Axis Wind Turbine (HAWT); HAWTs are discussed in more detail in the next

30
section. The HAWT Wright and Wood tested is a three bladed turbine, rated at 600 W.
Results from testing the HAWT are shown in Figure 8. The plot shows the boundary
where the wind does not contain enough energy to sustain rotation; the result is a lack of
electricity production at lower wind speed, and a high wind speed to initiate rotation if
the rotor has become static (Wright & D. Wood, 2004). Wright and Wood characterized
the feasible space of wind speeds in relation to the speed of the rotor; they were able to
determine in what regime the rotor accelerates and in what regime the rotor decelerates in
relation to changing wind speeds. Wright and Wood conclude that reducing the starting
speed is the most important aspect to increasing power production at low wind speeds. In
addition, the authors measured the starting speed of the rotor, which ranged from 2.5 m/s
to 7 m/s (~5-14 mph); the authors were only detecting when the rotor first began to move
and they note that the rotor may still need time to reach power producing speed. For this
experiment it was important to know when the rotor was accelerating and decelerating to
know when the turbine would begin to produce electricity (Wright & D. Wood, 2004).

31
Figure 8: Wind speed boundary of a 600 Watt wind turbine (Wright & D. Wood, 2004).
2.3 WHAT ARE THE MOST POPULAR FIN/TURBINE ARCHITECTURES, AND WHAT ARE THEIR ADVANTAGES AND DISADVANTAGES?
There are two broad categories which the majority of wind turbines are classified:
Horizontal Axis Wind Turbines (HAWT) and Vertical Axis Wind Turbines (VAWT).
The differences in the categories have to do with the orientation of the axis of rotation
with respect to the direction of flow (Meyers, 2009c). A HAWT's axis of rotation is
parallel to the flow, and a VAWT has an axis of rotation that is perpendicular. Figure 9
shows an example of each type.

32
Figure 9: Horizontal and Vertical ("H-Rotor") wind turbines.
2.3.1 Horizontal Axis Wind Turbines (HAWT)
There is extensive literature on HAWTs; for the purposes of this research, it is
important to find comparisons with different components. There are three main sources
of information for this section of the research. In Hansen's review of contemporary wind
turbine concepts and their market penetration he classifies the different concepts by their
ability to control the speed of the turbine rotor, and the type of power control (A. D.
Hansen, Iov, Blaabjerg, & L. H. Hansen, 2004). Speed control classifications of wind
turbines lead to two main categories: fixed speed wind turbines, and variable speed wind
turbines. There are several advantages and disadvantages to each type of speed control,

33
as described by Hansen. Complexity is the main difference between fixed speed and
variable speed wind turbines, especially in terms of the electrical subsystem. Stall
control is the simplest and most robust control and involves designing the aerodynamics
of the blades to lose efficiency above a certain threshold. A pitch control system actively
changes the orientation of the blades with respect to the wind speeds. At low wind
speeds, maximum power is extracted, while at high wind speeds the blades are
intentionally made inefficient. An active stall control changes the angle of attack of the
blades to accomplish the same result as the pitch control. Disadvantages of the active
controls are increase complexity and significant fluctuations in power output in turbulent
wind. The stall system is simpler, but decreases the operating range of the system based
on the aerodynamic properties of the blades.
The power converter electronics make the variable speed wind turbine possible,
and allow the turbines to achieve a maximum power coefficient over a wider band of
wind speeds. The power from a turbine is calculated as a function of coefficient of
performance, Cp, swept area, S, air density, ρ, and wind speed, υ, by Betz's Law, as seen
in Equation 1 (Khaligh & Onar, 2010).
The power coefficient in Betz's Law describes how efficiently the turbine
converts the wind energy to electrical energy. The theoretical maximum is 59.2%; this
maximum is calculated using conservation of energy and mass equations (Khaligh &
Onar, 2010). If we assume the mass flow through the area of the rotor is the average of

34
the wind speed before and after the wind turbine, then we can solve for turbine energy as
the difference in the kinetic energy before and after the turbine, and mass flow as an
average of the wind velocities. For simplicity, a time span of 1 second is used, giving the
power, Equation 2, and mass, Equation 3:
Next, substitute the mass equation into the power equation, and then comparing to
the total power through the same area gives Equation 4. A full derivation of this
relationship is available in Appendix A.
Taking the derivative relative to and setting it equal to zero gives a local
maximum of a wind speed ratio of 1/3, and a maximum percentage of power capture of
59.2%, giving the coefficient of performance, Cp, a maximum value of 0.592. Typical
turbines have coefficient values between 20% and 40% though (Khaligh & Onar, 2010).
There are several ways designers have developed to achieve better efficiencies, which are
discussed further below.
For example, the presence of power converters can help reduce mechanical stress
on components such as the shaft and gearbox, smooth power fluctuations, increase the
power capture by maintaining the power coefficient at its maximum value, and reduce
acoustical noise. Disadvantages include power losses from power diverted to the

35
electronics, and increased complexity and number of components, which affect capital
costs and reliability.
Hansen classifies the speed control turbines into four types, labeled A-D and
summarized Table 5. Power control ability is the second category in which Hansen
classifies wind turbines, identifying three main differences in aerodynamic control: stall
control, pitch control, and active stall control. Stall control is the only passive control,
and consequently it is the simplest and least expensive subsystem. The turbine blades
will stall once the wind speed exceeds a certain level. Active pitch control allows the
blades to be rotated into or away from the wind to increase power during low wind
speeds, and limit it when speeds exceed the capabilities of the generator. Active stall
control uses the same method as active pitch control, but in the opposite direction. At
speeds greater than rated power, the pitch controller increases the angle of attack of the
blade to stall the turbine.
Table 5, taken from Hansen, shows the different combinations of the controls:
Types A through D. Type A is a constant speed turbine directly connected to a grid
through a transformer, and is subject to power fluctuations. Type B is variable speed
wind turbine with variable rotor resistance to control the power output. By altering the
rotor resistance, the turbine can operate at a constant speed. Type C is a variable speed
wind turbine with a partial frequency converter. Type D is a variable speed wind turbine
with a full-scale frequency converter. The frequency converters in Type C and Type D
concepts smooth the power output for better connection to the grid. Several

36
combinations are infeasible or not used in the wind turbine industry, and so are denoted
by gray shading.
Table 5: Summary of different control combinations (A. D. Hansen, Iov, Blaabjerg, & L. H. Hansen, 2004).
Hansen’s categories outline control methods for classic wind turbines. Turbines
are controlled either by reaching a specified stall, varying the pitch of the blades, or
actively controlling the stall. Most of these concepts use a gear-box to increase the speed
of the turbine to the rated speed of the generator. New concepts have begun to appear
that remove the need for a gearbox, citing lower costs and reduced maintenance. Grauers
suggests using a lower speed generator that is direct driven by the turbine that will
decrease the cost of the system and the acoustical noise produced. Acoustical noise is
especially important when the turbine will be in close proximity to a dwelling (Grauers,
1996). The main difference between conventional generators and direct drive generators
is the required rated torque, which is much higher in the direct drive generator. Grauers

37
describes six different direct drive generators and three electrically excited generators
listed below:
1. Sector induction generator,
2. Electrically excited synchronous generator,
3. Switch reluctance generator
4. Permanent magnet radial-flux synchronous generator
5. Permanent magnet axial-flux synchronous generator with toroidal stator or
double-sided stator
6. Permanent magnet transversal-flux generator.
Until the late 1990’s, most wind turbine manufacturers were designing and
constructing single speed wind turbines with a multistage gear box to increase the
rotational speed between the turbine and generator (Polinder et al., 2006). In the late
1990’s a shift to variable speed wind turbines occurred that are capable of greater power
production. However, since 1991 there has been increasing interest in direct driven
generators that do not utilize a gearbox; this approach has the potential to reduce failures
of the system originating in the gearbox due to a reduction in the number of components
and interfaces. Polinder compares five generator types: a Doubly Fed Induction
Generator with 3 stage gear box (DFIG3G), Direct Driven Synchronous Generator
(DDSG), Direct Driven Permanent Magnet Generator (DDPMG), Permanent Magnet
Generator with 1 Stage Gearbox (PMG1G), and Doubly Fed Induction Generator with 1
stage Gearbox (DFIG1G). Induction generators require input electricity to establish a
magnetic field, while the permanent magnet generators use rare earth magnets. For low

38
power applications, the permanent magnet generators are likely to be more effective,
leaving the decision between direct drive systems and one that uses a gear box.
The main advantages direct-drive wind turbines have are the decreased potential
for failure, acoustical noise, and weight (Grauers, 1996). They may also be less
expensive; however, they require more permanent magnets; demand for permanent
magnets may increase in the future, especially if large-scale implementation of these
systems occurs (Grauers, 1996). Demand for rare earth oxides is expected to jump by
70,000 tons from 2010 to 2014; China produces the vast majority of rare earth oxides
(96%), and have been cutting exports to retain the oxides for the manufacture of higher
value products (Markusen, 2011).
Variable control wind turbines allow a wider range of wind speeds to be included
in the optimal operating zone, but take energy away from the system to power, and
increase complexity (A. D. Hansen, Iov, Blaabjerg, & L. H. Hansen, 2004; Polinder et al.,
2006). A wider range of power producing wind speeds would help wind harvesting on
the bridge; however, the gains made by using control are not seen to outweigh the cost in
energy and complexity to implement the controls. There is also a concern that the
adjustments to the fins will occur quickly enough to keep up with the anticipated highly
variable speeds and directions. While these insights have proved to be helpful in
understanding wind turbines in general, more research is needed into miniature wind
harvesting.

39
2.3.2 Vertical Axis Wind Turbines (VAWT)
The most common wind turbine to a layperson is the horizontal axis wind turbine
(HAWT), which resembles a windmill, but there is another class whose axis is
perpendicular to the wind flow called a vertical axis wind turbine (VAWT) (Meyers,
2009c). The first known windmills were VAWT, used by the Persians in 900 A.D.; S.J.
Savonius and Georges Darrieus developed their wind turbine concepts in 1922 and 1931
respectively, both VAWTs (Eriksson et al., 2008). It is not clear why HAWTs became
more popular than VAWTs.
A striking difference between HAWTs and VAWTs is the requirement for a way
to orient the blades into the wind, known as a yaw mechanism. HAWTs require a yaw
mechanism to orient the turbine properly according to the instantaneous wind direction.
VAWTs do not need a yaw mechanism, and are often claimed to be omni-directional.
The yaw mechanism is an added expense, failure mode, and component, which may
require regular maintenance. The omni-directional characteristic of VAWTs allows them
to handle variable wind and changing wind directions better than HAWTs (Eriksson et
al., 2008).
In an urban setting space becomes a very large issue. Large structures in close
proximity to each other do not leave room for large free standing HAWTs with large
radial swept areas. On the other hand, VAWTs can be retrofitted to fit in smaller areas,
as is seen in Figure 10. This helical VAWT is found on the side of a Chicago parking
garage (Boyle, 2010).

40
Figure 10: Helical VAWT in downtown Chicago (Boyle, 2010).
Grant et al. discuss many of the issues with using wind turbines in urban settings
to produce power locally (Grant, Johnstone, & Kelly, 2008). The authors address three
strategies to implement wind turbines on buildings: siting conventional free-standing
turbines, retro-fitting turbines onto existing buildings, and integrating harvesters into new
buildings (Grant et al., 2008). The first strategy is dismissed because there is not room
for the flow characteristics or the blades to turn in an urban setting. The third strategy
requires new construction, which eliminates many buildings that are already established
from any harvesting. Grant et al. explore the second strategy; the preferred design chosen
uses a ducted wind turbine that uses pressure differentials to drive the air through the
blades. High pressures are experienced on the vertical walls facing into the wind, and

41
low pressures are found on the sides and rear, and especially low pressures are found on
the roof due to flow separation. The comparison of several roof top turbines and a
photovoltaic cell showed the turbines producing more power; alignment played a strong
role, as did the ducting. However, the capacity factor was quite low for all the turbines,
and was only half the value for on shore wind farms. The low capacity factor highlights
what is wrong with urban wind harvesting exploitation: the low quality of direct, laminar
flowing air.
The benefits and shortcomings of HAWTs and VAWTs are important results
from the literature; to conclude this section, a synopsis of these advantages and
disadvantages is presented in Table 6.

42
Table 6: Advantages and disadvantages of HAWTs and VAWTs.

43
2.4 WHAT IS THE FIELD OF PIONEERING TECHNOLOGIES BEING USED TO PRODUCE ELECTRICITY USING WIND ENERGY HARVESTING?
There are two categories of wind harvesting promoted through advertisements and
articles: commercial products and developing technologies. An additional resource is the
patent database. These categories of products, concept designs, and patents are grouped
below and briefly described. While this is not an exhaustive list of wind harvesting
technologies, these are generally the more innovative and radical designs in the field.
2.4.1 Commercial Products
The Hymini wind powered personal charger (Figure 11) is a miniature wind
turbine used for charging personal devices. The turbine charges an internal battery, and
then connects to small devices such as a cell phone or music player via a USB
connection. The Hymini is also capable of using a solar cell to create a hybrid solar and
wind powered energy harvester (Miniwiz Sustainable Energy Dev. LTD., n d).

44
Figure 11: Hymini wind powered personal charger (Craziest Gadgets, 2008).
Enviro-Energies Holdings, Inc. sells vertical axis wind turbines for residential and
commercial use. These turbines include a magnetic bearing that supports the rotor. The
magnetic bearing reduces mechanical friction, eliminating a source of loss compared to a
typical system. Enviro-Energies Holdings, Inc. is focusing on slow rotating vertical axis
wind turbines that can be used in urban and suburban areas where noise is a significant
concern and where turbulent winds make horizontal axis wind turbines unattractive
(Enviro-Energies Holdings Inc, 2009).
Nheolis 3D Wind Turbines have developed a radical horizontal axis wind turbine
(HAWT) that is less noisy, and captures energy at lower wind speeds than traditional

45
HAWTs (Nheolis SAS, 2010). The Nheolis Nheowind 3D series of turbines (Figure 12)
has little to no wind shear, making it quieter and more efficient. The turbines are rated
from 2.5 m/s to 45 m/s (~5 mph – 100 mph).
Figure 12: Nheolis 3D wind turbine (Heliosolaire Energies Renouvelables, 2011).
WhalePower has developed an efficient blade design for HAWTs by mimicking
humpback whale fins. Placing bumps, called tubercles, on the front of the blade changes
many of the characteristics that were previously limiting advancement; for example the
stall angle can be drastically increased (from 16 degrees to 31 degrees), and the turbine
stalls gradually. Stalling gradually is an important development because it protects the
generator and the structure from potentially catastrophic wind forces (Fish, Watts, &
Dewar, 2010).

46
Humdinger Wind Energy, LLC has developed a vibration wind harvester that uses
the vibration of a belt to produce electricity. The inventor, Shawn Frayne, got inspiration
from the collapse of the Tacoma Narrow’s bridge (Ward, 2007). The belt works based on
an aerodynamic phenomenon known as aeroelastic flutter where a tensioned membrane
oscillates similar to a blade of grass pinned between one's thumbs (Ward, 2007). A
magnet is attached to the membrane and oscillates through a coil producing a current.
The wind belt (Ward, 2007) is available in a variety of sizes capable of generating power
for small applications. Figure 13 shows the Micro Windbelt; the coil and magnet are next
to the thumb, with the fluttering belt between the thumb and pointer finger.
Figure 13: Micro Windbelt by Humdinger Wind Energy, LLC (Forced Green, 2008).
Frequency pumping is a method to produce electricity from a wind turbine using
piezoelectric transducers. The turbine spins, and then either strikes the piezoelectric
material, or uses magnets to strain the material, which generates electric current in the
piezoelectric material (Kim, Tadesse, & Priya, 2009).

47
2.4.2 Developing Technologies
A concept submitted by Palsajes Emergentes, a Columbian landscape architect,
uses large kites tethered to flexible posts that generate electricity using wind belt
technology (Scott, 2010). The architect’s plans are to power 600 homes from the
installation on a beach in Abu Dhabi.
Another concept for Abu Dhabi is energy generating wind stalks. The inspiration
for the wind stalk fields is wheat fields swaying in the breeze. Carbon fiber-reinforced
poles are constructed with piezoelectric discs which are excited as the stalks sway. The
plan has the poles measuring 55 meters tall, but no estimate of the potential power
production has been published (Schwartz, 2010a).
Yuji Ohya of Kyushu University and his team have an idea to increase the power
production by magnifying the wind using a "brimmed diffuser" that acts as a lens
(Schwartz, 2010b). These offshore turbines, seen in Figure 14, would be constructed in
honeycomb arrays. Diffusers will be discussed further in the next section.

48
Figure 14: Yuji Oha's wind lens concept (Schwartz, 2010b).
2.4.3 Patents
In addition to consumer products and theoretical concepts, patents offer a vast
resource of previous ideas that offer design avenues (Otto & K. L. Wood, 2001). Many
patents have been filed and granted on wind turbines; a broad search quickly becomes
overwhelming. Using the advanced search functions it was possible to narrow the scope
to find innovative inventions. The main focus was to identify possible ways to produce
power at low wind speeds, or increase the velocity at the turbine to achieve rated
generator value. Search terms that proved lucrative include flow amplifiers,
piezoelectrics, and contra-rotating turbines.
Contra-rotating turbines increase the velocity at the generator by creating a
velocity differential. As the rotor is spun one direction, the stator is spun in the opposite
direction, doubling the velocity at the generator. U.S. Patent 6,249,058 shows a contra-

49
rotating vertical axis wind driven generator. The invention includes brushes to transfer
the electricity, as well as magnets to induce current in the windings; the invention does
not mention the use of a gearing system, and so the generator is to be direct driven calling
for the use of a low rated speed. Additionally, cups attached to the periphery of the rotor
capture the wind (Rea, 2001).
U.S. Patent 6,278,197 describes a horizontal axis wind turbine with contra-
rotating blades (K. Appa, 2001). This invention is direct driven, similar to 6,249,058;
however it also uses a turbofan to decrease the wake produced by the first rotor. This
approach reduces the efficiency by requiring some of the produced electricity to drive the
turbofan; however it is claimed that the benefits of removing “air blockage” justify the
loss of that energy.
U.S. Patent 7,018,166 describes a ducted wind turbine that increases the velocity
of the fluid (air) by directing it through closed channels (Gaskell, 2006). The rotor of the
turbine resides within the narrowest part of the ducting ring. In the preferred embodiment
the ducting is executed as an airfoil shape to decrease any turbulent flow, a characteristic
that makes turbines less efficient. Exhaust apertures, such as flap valves, are used to
either aid in direct rotation (by increasing the flow into the fins), or decrease the flow (by
exhausting it) to protect the turbine from high wind speeds. A free rotor is also embodied
at the immediate exit of the duct. The free rotor is used to reduce the pressure behind the
drive rotor, effectively drawing air into the duct and drive rotor. The duct then increases
the velocity of the flow based on its geometry.

50
Patent 4,070,131 describes an alternative type of wind accelerator. The
embodiment claims to transform the wind flow (linear) into a vortex with a low-pressure
core (Yen, 1978). The top and bottom of the structure are open to admit wind, and the
sides are vertical vanes that induce the circular flow of air. The inertia of the vortex is
then used to overcome and compensate for fluctuations in the wind speed, so that the
vane blades rotate at a more uniform speed. The turbine is located within the structure, at
the center of the artificial vortex.
Patent Application US 2004/0096327 A1 describes a turbine system that uses two
turbines on a single mast (K. Appa & S. N. Appa, 2004). This concept seeks to increase
the production of large wind farms by increasing the energy generation per mast
structure. The downwind turbine has longer blades than the sister turbine which allows
the embodiment to self align as the wind changes direction. The preferred embodiment
describes how the two rotors will contra-rotate so the embodiment is statically and
dynamically stable. The embodiment is finally claimed to be able to reduce the blade
length, and output the same power per mast as more traditional turbines installed in wind
farms.
2.5 WHAT METHODS ARE AVAILABLE TO INCREASE THE POWER OUTPUT, OPERATION RANGE, ROBUSTNESS, AND OPERATION IN URBAN SETTINGS?
Analysis of Betz's Law shows that power output can be increased on the turbine
(mechanical) side through increasing the coefficient of performance, increasing the speed
of the wind, or increasing the swept area (Khaligh & Onar, 2010), but also can be

51
controlled on the electrical side. As discussed previously, Hansen described how the
control of the turbine blades could be used to affect the output power. The following
sections, describing ways to increase power output, operation time and how those can be
applied to urban settings, are broken into mechanical and electrical research.
2.5.1 Mechanical
Previously, a diffuser on the "Wind Lens" was discussed as a concept to increase
the power output of a wind turbine. The power extracted by a horizontal axis wind
turbine is the product of the volume flow rate of air through the turbine and the pressure
drop across the blades, which is a result of the thrust of the blades (M. O. L. Hansen,
Sorensen, & Flay, 2000). Increasing the thrust increases the pressure drop, but decreases
the volume flow rate, creating an optimum relationship between the two variables.
Diffusers may have different shapes, and two are discussed here: an airfoil cross-section,
and a diffuser with a flange on the exit end. The airfoil diffuser investigated by Hansen
generates a ring vortex; more air is sucked into the disc as the lift increases (M. O. L.
Hansen et al., 2000). The attempt is to exceed Betz's limit of power extraction for a wind
turbine. To investigate this, a CFD model was used to evaluate the diffuser's ability to
increase the extracted power. The models show an increase in extracted power from the
wind turbine if the diffuser is included. Additionally the ratio of the mass flow through a
diffuser and turbine to the mass flow through a bare turbine decreases as the thrust
coefficient increases; thus, the increase cannot exceed the relative speed-up in the
diffuser at zero thrust (M. O. L. Hansen et al., 2000).

52
Ohya et al. are also investigating the use of a diffuser to increase the flow over at
wind turbine. A large flange on the trailing edge differentiates this diffuser from the
shroud investigated by Hansen et al.; a schematic of the flange diffuser is shown in
Figure 15 (Abe & Ohya, 2004). Putting the flange on the trailing edge is supposed to
create a large area of separation, which creates a low-pressure area. This low pressure
draws more air into the diffuser, concentrating and accelerating the wind seen at the
entrance. The turbine is placed in this concentrated area for maximum output, as seen in
Figure 15 (Abe & Ohya, 2004).
Figure 15: Flanged diffuser and wind turbine with flow vectors (Abe & Ohya, 2004).
Abe et al. conducted a CFD model, and then validated that model using
experimental results conducted by Ohya at the Research Instute for Applied Mechanics,
Kyushu University (Abe & Ohya, 2004). Abe et al. conclude that the flange diffuser is
capable of increasing the wind speed at the entrance of the diffuser, but the different
characteristics are highly dependent on separation from the diffuser wall. It is also noted

53
that the use of a flange diffuser should be discussed only when the proper and specific
conditions occur.
2.5.2 Electrical
Knight et al. propose a power electronic converter to capture wind energy over
and expanded range of wind speeds (Knight & Peters, 2005). The DC-to-DC converter is
electrically controlled, where they are sensing the electrical angular frequency and the
voltage. Comparing these values, they are able to determine the ideal voltage for steady
state, constant wind speed, and operation (Knight & Peters, 2005). The frequency-
voltage relationship is not linear, and so an approximation is used; the frequency is then
used to vary the duty cycle to control the input dc voltage (the output voltage (battery) is
held constant (Knight & Peters, 2005). The results produced are shown in Figure 16; the
controlled turbine system is shown to perform significantly better, especially at low wind
speeds (Knight & Peters, 2005).

54
Figure 16: Fixed DC-to-DC compared to controlled power converter (Knight & Peters, 2005).
Mirecki et al investigated different power controlling mechanisms to be used with
a VAWT. The performance of a wind turbine is determined by its coefficient of
performance, which is a function of reduced tip speed. These characteristics are highly
dependent on the rotation speed of the rotor and the wind speed (Mirecki, Roboam, &
Richardeau, 2007). The rotational speed and torque are can be used to determine the
other variable, and so these two variables are measured to determine the control of the
wind turbine (Mirecki et al., 2007). Finally, a simple diode rectifier, which simplifies
and reduces the cost of the system, was tested as well; Mirecki et al. discuss the tradeoffs
between system complexity and operating at the optimal power coefficient (Mirecki et

55
al., 2007). Figure 17 gives the results of the comparison (Mirecki et al., 2007).
Controlling the turbine based on a torque or speed algorithm show similar efficiency; the
diode bridge has very similar power outputs, and it simplifies the system on several levels
and offers a viable alternative (Mirecki et al., 2007).
Figure 17: Comparison of controlling methods (Mirecki et al., 2007).
A hybrid between electrically and mechanically controlling the wind turbine is
investigated by Muljadi et al. During low and medium wind speeds (defined by the pitch
of the rotor blades) the output power is controlled electrically by the load connected to
the generator (Muljadi & Butterfield, 2001). This keeps the turbine operating at the
optimum coefficient of performance to tip speed ratio. During this time the pitch of the
rotor blades is kept constant. Then, during times of high wind speeds when the
maximum power rating of the converter is reach, the pitch of the rotor blades is increased
to shed the additional captured energy (Muljadi & Butterfield, 2001). Controlling the

56
pitch is an active control mechanism, and therefore requires power to accomplish, which
is justified in systems with excess produced power. Muljadi et al. found that this was an
effective way to maximize power output in their simulation while keeping the system in a
controllable (safe operation) range (Muljadi & Butterfield, 2001).
2.6 WHAT WORK HAS ALREADY BEEN COMPLETED IN EXTREMELY SMALL WIND TURBINE
TECHNOLOGY?
Xu et al. carried out the most recent work on what they describe as miniature
wind turbine systems; the authors design and build a miniature wind turbine after
modeling it with an equivalent circuit (Xu, Yuan, Hu, & Qiu, 2010). In addition, they
cite previous work on miniature scale wind turbines, as seen in Table 7 (Xu et al., 2010).
Table 7: Previous work on miniature wind turbines (Xu et al., 2010).
The equivalent circuit developed by Xu et al. is divided into a mechanical side
and an electrical side. On the mechanical side, a source is in parallel with a capacitor,

57
resistor, and transformer. The mechanical source is a conversion from wind to a torque
(seen as a voltage in the circuit analogy). The electrical side has an inductance and two
resistors in series; one resistor is the interal resistance, and the second represents the load
on the tubine. When building the turbine, Xu et al. used commercially available
products (COTS), including a subwatt brushless DC motor (by MABUCHI), plastic
blades, and no transmission. The turbine was then tested at several low wind speeds
between 3 m/s and 4.5 m/s, with varying resistive loads. The output power is shown in
Figure 18, and ranges from 2 mW to 17.5 mW. The parameters used are shown in
Table 8. These parameters are important benchmarks to compare to when constructing
an analytical model.

58
Figure 18: Predicted and actual power outputs of miniature wind turbine (Xu et al.,
2010).
Table 8: Parameters used in miniature wind turbine simulations/tests (Xu et al., 2010).
Xu et al. concluded that the wind turbine, built from COTS, would be suitable to
power low-power wireless sensors, although the type of sensors and the application are

59
unspecified. The experiment was run using a constant velocity fan, which neglects the
effects of varying wind. In addition, depending on application, turbulent airflow may
have some significant effects on the results. This work is left for future research and
development of the equivalent circuit model.
2.7 DISCUSSION
The literature review conducted effectively answers the questions posed at the
onset of research. The knowledge gained is essential during the subsequent phases of the
project; Table 9 summarizes the insights.

60
Table 9: Insights gathered from different literature resources.

61
Chapter 3: Concept Development: Wind Energy Systems for Health Monitoring
Chapter 3 describes different concepts generated, and the considerations guiding
the choice of a model to pursue, develop, and mature as a first prototype. The first step is
to develop a strategy to structure that maturation, and to document the steps, making
them available for others to replicate and critique. Next, the different uses of ideation
resources are discussed, followed by a discussion of the use of function structures to
expand innovative thought. The conclusion of Chapter 3 shows the concatenation of
different conceptual ideas that are chosen for embodiment.
3.1 IDEATION METHODOLOGY
Developing a methodology to guide the concept generation is an important aspect
of this thesis. The methodology gives a clear hierarchal procedure allowing others to
follow the research, and replicate it in the future. This section sets up the methodology
that may be used for any energy harvesting development, describing the different steps
and the actions occurring specific to a wind harvester. The results are described in detail
in the final section.
3.1.1 Energy Harvesting Design Methodology
The methodology used in this thesis is given in Figure 19. The first step is
assessing the power requirements of the sensors and wireless network that needs
powering. The second step involves characterizing the structure, and where the different
components will be located (i.e. under the bridge, between the girders, etc.). This step

62
will provide parameters necessary when designing the mounting and housing of the
system. The third step involves analyzing the environment that surrounds the structure.
The fourth step is choosing an energy harvesting technology. The fifth step is
determining the variability in the energy being harvested. The sixth step is calculating
the level of energy storage that is going to be required. The seventh is developing
innovative concepts and mapping chosen concepts into viable realizations through, e.g.,
off-the-shelf components that will fulfill the requirements while working together. The
eighth step is to combine these components, and fabricate any supporting component
unavailable commercially. The final step is to assemble the system and perform
systematic testing.

63
Figure 19: Energy Harvesting development methodology.
Step 1: Assessing the Power Requirements of the monitoring system
The power requirements of the monitoring system involve many different factors,
e.g., determining the power requirements of the sensors and the communication network,
and the duty cycle. Minimizing the power requirements of the different components of
the system will aid in creating energy harvesting alternatives that are viable and advance
the state-of-the-art. Exploring energy saving methods, such as sleep modes, is important
when developing the sensors and communication networks, but inevitably the system will

64
require power (Weaver, K. L. Wood, Crawford, & D. Jensen, 2010). Identifying these
factors will allow first the feasibility of energy harvesting to be determined, and then give
vital design parameters.
Step 2: Characterize the Structure
Characterizing the structure is essential when determining the available power,
and how it can be harvested, adding important technical scope and constraints to the
different systems. This step involves gathering raw data about the structure, from
vibration history and natural frequency, to typical wind speed and wind profile, to
insolation and angle of incidence of the sun's rays, among others. Analysis of this data
will provide many important design parameters, requirements, and constraints for the
energy harvester. In addition, mapping the geometry of the bridge and the surrounding
environment will be completed during this step. Information such as traffic patterns that
pass beneath the bridge, or environmental conditions such as waterway flow, will need to
be noted because this will add a height requirement to any system that hangs below the
bridge. Any points eligible for attachment should be identified during this stage. Data
acquisition and analysis will be discussed further later in the thesis in more application
specific sections.
Step 3: Analyze the Environment
The characterization of the structure represents a snapshot of the energy available
for the harvester, and the conditions it will need to survive. Collecting long-term data is
expensive, personnel and time intensive, and can become overwhelming. Instead, the
characterization should be compared to data from a wider window of time. Traffic (type

65
and frequency) and weather patterns (seasonal and yearly) provide adequate data volume
and time span to develop suitable models, and are essential for this analysis and
determining the design parameters for the system.
Research into the wildlife and the potential for vandalism should be carried out at
this point as well. Preventing wildlife disruption and intrusion is important for the safety
of the environment as well as the energy harvester. Preventing crime, such as theft, is
another problem that needs to be addressed.
Step 4: Select a Transformer
Selection of a transformer is determined by the structure, environment, and
component (power requirements). Balancing feasibility and cost will be the driving forces
in this decision, but several alternatives may be viable depending on power requirements.
Sun harvesting will have the highest power and energy density, followed by wind, and
vibration (Weaver, K. L. Wood, Crawford, & D. Jensen, 2010); however, these rankings
have tradeoffs associated with them. For instance, sun harvesting also has the most
constraints, is difficult to blend or hide with the bridge environment, and is most likely to
be vandalized. Often, a combination of multiple harvesting domains, at least within a
portfolio of designs or as hybrid solutions, will be the most beneficial to any system.
Step 5: Develop a Field Tunable Range
The design parameters determined by data analysis will result in a system unique
to the designer's choices. In the field, not every condition is going to be the same;
different locations on the bridge may even differ. Having a tunable range or tuning
parameters will increase the utility of the harvesting system (Otto & Antonsson, 1993).

66
A field technician should be capable of adjusting the harvester for maximum
effectiveness. In addition, if the harvester is designed to tune autonomously to account
for varying conditions, it may always operate near optimally. The mounting sub-system
is another area where tuning will be crucial in an effective design.
Step 6: Calculate the Variability of In Situ Power
Independence of the entire system is one of the major requirements, making a
power failure unacceptable. Statistical analysis of the variability in harvesting energy is
important to prevent power failure. Appropriate power storage and power storing
methods will be determined according to the results of the model. The customer and
design team should jointly analyze an acceptable probability of success
Step 7: Develop Innovative Concepts and Map to Viable Solutions
Energy harvesting represents a technological challenge. Available energy and
power densities make energy harvesting a difficult and non-trivial design problem.
While energy harvesting for infrastructure health monitoring requires modest or lower
power levels, innovative solutions are needed that efficiently and effectively capture,
store, and supply energy. In the context of steps 1-6, a first sub-step toward such
innovations is the ideation of inventive energy harvesting concepts.
A number of ideation methods may be employed in generating inventive
concepts. These include brainstorming combined with mindmapping, CSktech or the 6-
3-5 method, design-by-analogy, and transformational design (D. J. Jensen, Weaver, K. L.
Wood, Linsey, & J. Wood, 2009; White, Talley, D. J. Jensen, & K. L. Wood, 2010).

67
Following the ideation and selection of innovative concepts for energy harvesting,
chosen concepts are embodied, architected, and mapped to viable form solutions. Many
of the technologies that are used in an energy harvester are available commercially.
Commercial products have the advantage of reduced losses and costs because the
companies that sell them have optimized the product and perfected mass production.
Finding commercial products will also decrease build time. It is important to select
compatible components because compatibility is essential to creating an efficient system.
Incompatibilities will result in losses that could result in an unsuccessful system.
Step 8: Fabricate supporting components
The final key step before assembling and systematically testing the energy
harvester is to fabricate the necessary supporting components. Some examples of these
would be couplers from the rotor of the fin to the rotor of a wind generator. Careful
planning during this step will decrease unnecessary and hindering losses in the system.
3.2 IDEATION RESOURCES
The environment for ideation is important in order to produce quantity and quality
of different ideas. Research has also shown that the quantity of ideas is the most
important variable in producing a plethora of good ideas (Otto & K. L. Wood, 2001).
Another important aspect to being innovative is crossing the different domains that do not
typically interact (Johansson, 2006). The university environment provides both of these
qualifications: a variety of backgrounds, expertise, and interests as well as many people.
Two main sources for undergraduate ideation occurred at The University of Texas at
Austin, and the United States Air Force Academy. These initial sessions were followed

68
up by ideation using graduate students to gain a different and more experienced
perspective. A parallel prototype is developing at the United States Air Force Academy
by the students there, and their work is described here.
The Air Force students began by developing ideas using a variety of concept
generation techniques to harvest energy for the sensors on bridges, assembling a list of
the top ten concepts. The design they selected after completing a Pugh matrix was a
vertical axis wind turbine that used piezoelectrics as the electrical transducer. Seven
components became the focus of their search and development: the electrical circuit,
turbine, bearings, shaft, piezoelectric striker, clamps, and the housing. Table 10: Bill of
Materials for Air Force Academy VAWT prototype.
shows a Bill of Materials of the different components the Air Force students used
to create their prototype (Walker et al., 2010).
Table 10: Bill of Materials for Air Force Academy VAWT prototype.
The Air Force team performed many different tests to validate their design
decisions. They measured the start up speed of the system, the fatigue properties and the

69
electrical output of the piezoelectric transducer, and the time required to charge the
system at different wind speeds.
An anemometer and fan were used to determine the start up wind speed of the
turbine. The system and anemometer were placed a distance from the fan, and then
moved closer till the system began to rotate. The system was found to begin rotating at
5.6 mph, a satisfactory speed because it is significantly below the known national average
of 9.2 mph.
Figure 20 shows the fatigue test setup; a motor spun a striking member at the
same position the designed striker would. After more than 2.5 million cycles, the
piezoelectric strip did not show any signs of wear. The students concluded that this
proved infinite life, and the strips would survive the estimated 1.4 billion strikes that
would occur in a final product.
Figure 20: Air Force Academy student's piezoelectric fatigue test platform (Walker et al., 2010).

70
The electrical test was performed twice, once using a single piezoelectric strip,
and a second time using two strips connected in parallel. The experiment validated the
use of piezoelectric technology to charge a capacitor capable of powering the sensors.
The next step was to measure the time required for the capacitor to store enough energy
for a reading to be taken. Even at low wind speeds it was found that the system's
electrical storage was sufficiently charged in only a few hours, meaning the system could
reliably harvest enough energy to take one sample a day at minimum.
The work at the Air Force Academy is continuing to progress, and provides an
additional resource that is invaluable to the project. The use of a piezoelectric strip is an
intriguing alternative to using an induction generator. What the students built created the
inspiration for using multiple transducers in a system. This system can be seen in the
development presented in subsequent sections.
3.3 EXECUTING THE METHODOLOGY
3.3.1 Assess the Power Requirements
The exemplary bridge application is typically powered by a 6 V battery, and
operates on a 1 second sample interval (Bai et al., 2004). From previous discussion,
Figure 3 shows a plot of this interval, and Table 2 breaks the power draws down into
activities.
Solar has been shown to be feasible, and is common in many similar applications
such as emergency phones (Weaver, K. L. Wood, Crawford, & D. Jensen, 2010). In the
previous feasibility study, a photovoltaic panel of 1000 cm2 would be capable of
powering the system (Weaver, K. L. Wood, Crawford, & D. Jensen, 2010). Betz's law
describes the available power from wind as a function of wind speed, and swept area.

71
The previous feasibility study has shown that theoretically a small turbine (1 cm2 swept
area) would be capable of powering the low power components, and a slightly larger
turbine (92 cm2 swept area) would be capable of powering the high power component
(Weaver, K. L. Wood, Crawford, & D. Jensen, 2010). Therefore, the feasibility of
harvesting wind energy was determined to be valid. Vibration feasibility has been
previously calculated, and was demonstrated by Clarkson University using inductive
technology (Steingart, 2009). The vibration feasibility has a lower density, and therefore
would be used to power the low-power consuming components (Weaver, K. L. Wood,
Crawford, & D. Jensen, 2010).
3.3.2 Characterize the Structure
Wind data and vibration data for the bridge was collected during field testing.
This section describes the wind data collection and analysis. The field test was conducted
on a bridge where Loop 410 and IH-35 intersect in San Antonio.
To characterize the wind at the structure, wind data was collected on site at
multiple locations. The selected bridge had traffic that passed under it, and so no system
could hang below the bottom flange. Anemometers were utilized to collect data at
multiple points beginning at the bottom flange, and rising into the structure to give a
profile of flow above the bottom of the bridge. Figure 21 shows a plot of the average
wind speed at three heights within the structure.

72
Figure 21: Measured wind speeds at different heights within structure.
Analysis of the data showed the majority of the wind energy is concentrated at
and just above the bottom flange. Also, the wind has turbulent characteristics due to
obstructions affecting the flow. Lastly, attachment points of interest were investigated
during the field study. First, the system's mounting may not require modification of the
structure, disqualifying bolting or welding anything to the structure. The flange, and
cross frame were both available and viable attachment points. Figure 22 shows an
example of the I-girders and cross-frames.

73
Figure 22: Cross-frame and I-girders of the San Antonio 410 bridge. At the conclusion of the characterization, the following design considerations
were documented:

74
• System may not hang below structure
• Energy is concentrated very close to the bottom of the structure
• Turbulent flow
• Low wind speeds
• Flange and cross frame offer viable attachment points.
3.3.3 Analyze the Environment
Analysis of the wind at the structure was conducted on the bridge in San Antonio,
and is described in Sections 3.3.2. The environmental wind analysis was done using data
from San Antonio and is described in this section. Analyzing the environment offered
additional information, which is noted below, increasing the design considerations and
understanding.
When analyzing the data, the low wind speeds were an immediate concern. Betz's
law states that the available power is affected by the cubic of wind speed, making this
parameter very important to the design (Khaligh & Onar, 2010). A comparison was
conducted of the wind speed found during the characterization and the typical wind
conditions. Two aspects were researched: the average wind speed for that location
(“Weather Underground,” 2010), and the wind speeds for the same time as the data
acquisition (Renovation Headquarters, 2011). Figure 23 shows a plot of the data
gathered versus the average wind speed for San Antonio and the wind speed at different
times for the same day.
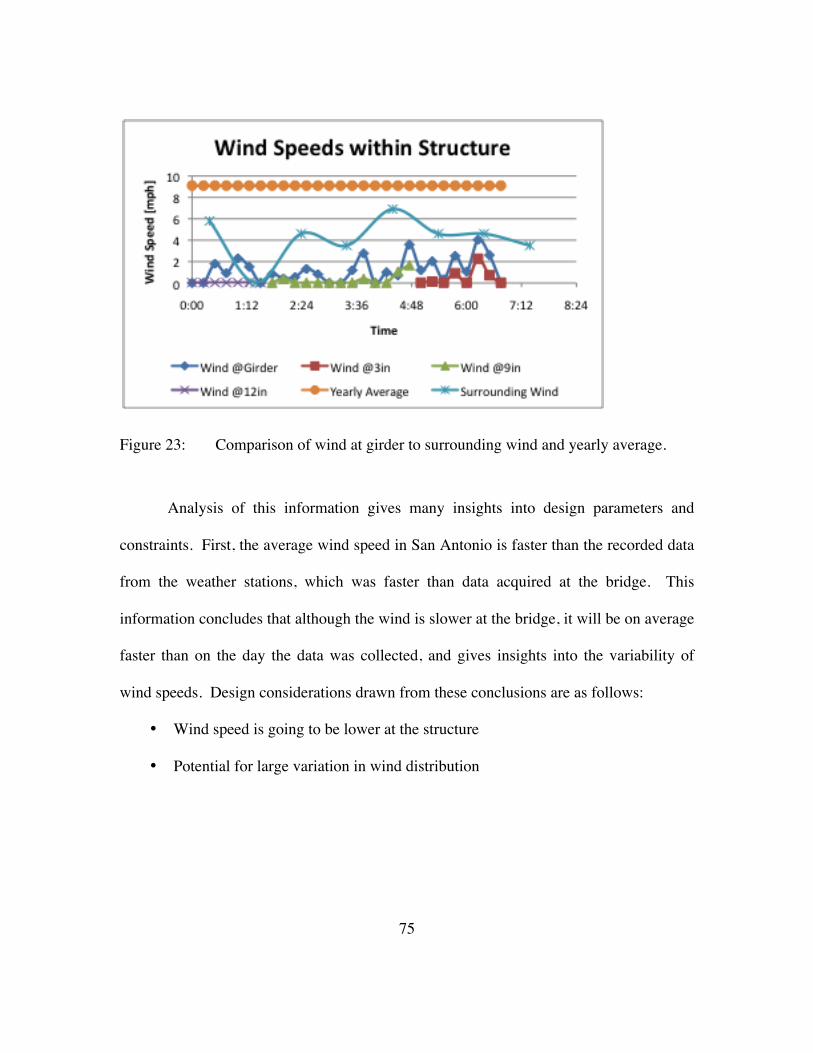
75
Figure 23: Comparison of wind at girder to surrounding wind and yearly average.
Analysis of this information gives many insights into design parameters and
constraints. First, the average wind speed in San Antonio is faster than the recorded data
from the weather stations, which was faster than data acquired at the bridge. This
information concludes that although the wind is slower at the bridge, it will be on average
faster than on the day the data was collected, and gives insights into the variability of
wind speeds. Design considerations drawn from these conclusions are as follows:
• Wind speed is going to be lower at the structure
• Potential for large variation in wind distribution

76
3.3.4 Choose a Transformer
Characterization of the bridge was completed as previously described. The
different domains were found to be feasible in powering different aspects of the bridge
monitoring system. The different domains (solar, wind, and vibration) were all pursued
for different components of the application. An example of wind and two vibration
harvesters are described below as examples for the purposes of demonstrating the
methodology. The remaining steps of the methodology are demonstrated in order and
grouped according to the example.
3.3.5 Develop a Field Tunable Range
Any harvester has a range of operation parameters; one of the concerns with wind
harvesting in this application is operation below the cut in speed of conventional systems
(Khaligh & Onar, 2010). Harvesting energy at lower wind speeds became an area of
concern during the design approach of this application. Concept generation for this
specific problem was addressed during the design phase.
3.3.6 Calculate the Variability of the in situ Power
The distribution of wind speed variability should be calculated for generator
selection, and will give insights into the storage capacities required. Depending on
available data, the distribution from the characterization of the structure or analysis of the
environment may be used. In this example, a histogram was developed from the acquired
data at the bottom of the flange, shown in Figure 24.

77
Figure 24: Distribution of wind speed at the bottom flange.
With the given data, a Rayleigh distribution was utilized during modeling for
generator parameters and to anticipate the needed storage capacity. Data for each kind of
bridge and location should be taken when determining the environment for a bridge. The
generator's peak operating speed was chosen to occur just above the peak Rayleigh curve
value. This will transform the most energy, while protecting the generator (Khaligh &
Onar, 2010).
3.3.7 Develop Innovative Concepts and Map to Viable Solutions
Idea generation is conducted on several occasions and at multiple locations to
maximize the quantity of available concepts. The Air Force Academy's contributions
were previously discussed in Section 3.2. Undergraduate contributions to the concept

78
generation involved rounds of 6-3-5/C-Sketch completed with senior students. Following
that, graduate students at different stages also participated in brainstorming and 6-3-5
sessions. Figure 25 shows exemplar results of ideation methods applied to the energy
harvesting problem for bridge monitoring.
Figure 25: Mindmap results from Brainstorming with graduate students.
3.3.8 Discussion
Low power energy harvesting is a challenging problem, and insights about the
methodology, design choices, and concepts were gained during the progression through

79
the methodology; these insights can be grouped into four main categories: holistic,
inventive, technological, and technical.
While following the methodology it became apparent that Step 2 is fundamental
for gathering holistic insights into the energy harvesting system. Many design decisions
are identified during this step, and attention to detail is important. A well thought out
Step 2 will provide valuable information that will determine the success of the developed
energy harvester as a system.
Many inventive insights occurred when mapping concepts to viable realizations.
A plethora of opportunities were discovered in this stage to fill gaps in the available
technology. This step also showed the importance of Step 7, how it is essential to be
expansive when generating concepts, generating multiple solutions to address each
problem.
The technological shortcomings discovered at different steps of the methodology
give insights into opportunities for innovation within energy harvesting. For example,
during Step 2, it was documented that the structure's natural frequency was dependent on
temperature, and changed throughout the day. This was also noted during Step 3 because
the temperature fluctuates from one season to the next. The vibration harvesters were
greatly affected by natural frequency, and so participants developed innovative ways to
tune the harvester. A hybrid wind harvester, utilizing multiple transducer technologies,
was pursued because energy conversion at very low wind speeds was missing in
commercial products.

80
Technical insights, such as addressing the 10-year life and no maintenance
requirements greatly influenced Step 5 (directly related to storage capabilities) and
minimizing failure modes. Inventive concepts directly led from discussions of this
technical insight. In addition, many of the concepts generated offered extreme technical
problems; the decision was made to pursue the "low-hanging fruit," those concepts which
can be made innovative and are likely to achieve success. The technically challenging
concepts are valuable because they provide the opportunity to develop inventive
technology that harvest some amount of energy; to be an innovative harvesters, the
concept must be realized and exploitable by the application (Johansson, 2006).
Although the application was specific to bridges, the methodology can be applied
to many other harvesting situations, and provide valuable insights to the field of energy
harvesting. Once a harvesting subsystem is determined to be capable of providing the
required power, other aspects such as cost, maintenance, and reliability will determine
implementation. Continued work in this field will offer new solutions and expand the
capabilities of health monitoring in the future.
3.4 FUNCTIONAL MODELING
Functional modeling was another technique used to spark creative thinking and
opportunity to develop innovations in the system. Work is completed to create a general
high level function structure that describes the functions associated with all harvesters.
The second structure is more particular to wind energy harvesting.

81
3.4.1 Function Structure: Energy Harvesting
The first functional model developed was one that could transcend all energy
harvesting domains. Solar, wind, and vibration share some functions, have similar
functions, and then have unique functions. Identifying similar functions may lead to ideas
and innovation for a technology that has previously not been used in that domain.
In a study exploring innovation of energy harvesters using function structures,
there were certain functions that were found to occur in every system: import, export,
separate, transfer, and convert (Weaver, K. L. Wood, Crawford, & D. Jensen, 2011).
Figure 26 shows a hierarchal function structure with much of the shared functionality in
any energy harvester. The other most frequent terms were change, position, guide, and
secure; these terms were used in the high-level function structure to provide a skeleton
for future functional modeling to be discussed in the next section. All of these functions
were arranged in Table 11, along with functional synonyms, and inspire creative thinking
on how to accomplish them in different energy domains.
Figure 26: Hierarchal energy harvesting function structure.

82
Table 11: Most common functions to energy harvesting and inspiring synonyms.
The common functions from the study are insightful, however they are also very
generic, and as ideation progresses they may not inspire quite as much creativity. Using
the synonyms to build upon the work completed using the common functions leads to
other ideas; for instance, when the function import appears, the first inclination is to
include the material, energy, and user. "Attract" inspires creative thinking on ways to
bring the material, energy, and/or user to the product. Attracting energy directly may not
be simple, but getting car operators to instinctually drive over strips on the road to
produce a heat differential could produce a desired effect. "Separate" immediately
conjures mechanisms to make removal from the structure simple and quick; however,

83
"disconnect" causes a designer to think about ways to remove preventative loads or
protect components when loads become excessive within the system. Many more of
these ideas and concepts are developed in the Concept Results Section.
3.4.2 Function Structure: Wind Energy Harvesting
The general energy harvesting function structure was a good place to build upon;
developing a wind specific structure that includes the function synonyms creates a
function structure that breeds creative thoughts. It also identifies areas where innovative
solutions are needed to solve the unique problems of this application. Figure 27 presents
the wind energy harvesting function structure. Highlighted regions are functions that
inspire the questions and thoughts presented next.
Figure 27: Wind function structure with highlighted points of discussion.
Collecting wind is an abstract function that requires looking at the problem from
different vantages. What are we collecting? Is it air molecules? Is it the speed of those

84
molecules? Betz's Law states that the power output of a turbine is proportional to the
density of the air, and the cube of wind speed. Increasing either of these parameters
increases the power, but increasing the wind speed radically increases the power output.
How can we increase the speed of the air flowing past the turbine blades? The
consequence of increasing the wind speed is increasing the rotor rotational velocity; is it
possible to increase the rotor angular velocity with no increase in the wind?
Importing and securing to the bridge were functions that offer a broad field in
which to be innovative. Failure of the securing mechanism is unacceptable due to the
inherent danger of an object falling off a bridge into traffic. In addition, simplifying
attachment is important because the areas in which these systems will be placed have low
accessibility. Lastly, the bridge may not be modified in any way; how will the system be
mounted without bolts or welding?
Protecting components was a function that has many divergent paths to take. All
components are arguably important, so decisions on which to focus on protecting
becomes an issue. The prime candidates are normally the most expensive subsystems.
Sacrificial components may be designed to fail before the expensive components reach
unacceptable ranges; however, if the system is inaccessible, any fix becomes expensive.
What is available that will not fail and will protect valuable subsystems? How can it be
incorporated into the design with minimal interruption in operation?
Converting rotational mechanical energy to electrical energy is traditionally done
using a generator. There are many types of generators, as shown from the research in
Chapter 2. Is this a bias though? What alternatives are there to converting mechanical
energy to electrical energy? Questioning this function also led to questions about storing
the electrical energy. Traditionally, storing electrical energy has been accomplished with
batteries. A system capable of powering a communication network for 10 years is not a

85
traditional problem though; will batteries work? If batteries are not capable, what
alternatives are there?
3.5 INNOVATION FUNCTION
A goal of any design challenge is to incorporate innovative aspects into the
solution. Innovation is broader than just thinking outside the box and finding unique
solutions; it also involves understanding the limitations of the solutions. After the
original round of ideation, and the development of function structures, functions where
innovation is paramount are identified to converge upon and study. This section
introduces how thoughts are generated for methods addressing the questions raised about
the highlighted functions in the previous section, analysis of the methods, and the
advantages and disadvantages to that method.
3.5.1 Collect Wind
The first tendency is to find a way to increase the speed of the wind flowing past
the turbine blades using an airfoil toroid. However, from the research presented
previously, variations in the speed (turbulence) also can drastically limit the wind
turbine’s performance. Turbulent flow is defined by the Reynolds number, which is
determined by the speed of the flow (Fox, McDonald, & Pritchard, 2004). Instead of
increasing the flow past the blades, increasing the rotor speed into the generator could
increase power. By rotating the generator in the opposite direction as the rotor, the
generator would effectively see twice the speed.
The advantages of a correctly designed contra-rotating system would be the
increased speed of the rotor. The increase in speed could translate into power production
at wind speeds that would usually be below the lower bound of the generator's operating

86
range. It may also remove the requirement for a gear train to increase the speed input to
the generator, reducing components, costs, weight, and maintenance.
There are three primary disadvantages foreseen in a counter rotating system.
First, the system becomes more complex as the number of components increases, which
also leads to increased failure modes. Second, getting the electricity from the rotating
generator to the circuitry will need to be a dynamic connection. This is accomplished
using brushes; however, brushes deteriorate and require replacing. Third, the upper
bound of the generator's operating speed range is likely to be reached more often. To
resolve this, a braking mechanism will be required on both rotating members, again
increasing complexity and failure modes.
3.5.2 Import and Secure
Securing a wind turbine to a structure without altering that structure instantly
conjures an image of clamping. While exploring this idea, it is important to examine
alternative ways to secure an object to a metal bridge. Adhesives, tape, and magnets are
all methods to fix two objects together. At first tape seems an unlikely candidate, but 3M
advertises a tape that they claim can replace rivets and spot welds, and has been used to
hold skyscraper window glass on the building (Laird, 2010). In addition, the 3M Solar
Acrylic Foam Tape does not require any special application equipment or time to cure
like other adhesives (Laird, 2010). The disadvantages with adhesives and tapes are they
will be permanently attached to the bridge unless removed using solvents, which are both
expensive and environmentally unfriendly. This also means that moving or removing the
turbine will require special tools.
Magnets offer a unique way to temporarily attach an object to metal. Including a
magnetic attachment mechanism would allow the system to be mounted and removed

87
from the bridge without requiring specialized equipment or processes. However,
magnets have some disadvantages. Strong permanent magnets are rare, and consequently
expensive. In addition, there is concern expressed from the civil engineers of the project
that magnets will not adequately hold an object to the bridge to their safety standards.
This concept is going to be saved for further investigation, but will not be pursued in the
first prototype.
This leaves revisiting a clamping mechanism, which still requires designing to
ensure simplicity and safety. The clamping subsystem needs to be capable of tightening
securely onto the bridge, and locking in place until some action is completed to release
the clamp. Concepts including the use of technologies such positive locking cams, and
the seat post clamping system on a bicycle are used in the concepts that follow.
3.5.3 Convert Rotation Energy to Electrical Energy and Store Electrical Energy
The electrical components between the harvester and the network are vital to the
effectiveness of the system. Storing the energy created is a key part to this, batteries
being the obvious choice. However, the analyses of the power requirements presented in
step 1 of the methodology have demonstrated that the system is already beyond current
battery life. Alternative electrical storage may utilize capacitors or supercapacitors, but
can storage of energy be accomplished better somewhere else? Hydraulic and
mechanical storage, such as pressure tanks and flywheels respectively, were some of the
ideas created from questioning the function structure. A hesitation in using some
alternative form of storage is dealing with the inherent losses associated when converting
from one domain to another. Future work may investigate if the advantages justify the
losses, but the current project is going to move forward using electrical storage.

88
The conclusion of this chapter embodies the concepts created from the different
techniques previously discussed. Embodying the concepts is the step to create something
innovative from a creative idea (Johansson, 2006). The functions with innovative
potential are given form in concept embodiments and then described in the next sections.
3.6 CONCEPT RESULTS
Several design challenges are identified to give some structure to the discussion of
the embodiments. The genesis of these challenges is from the methodology discussed
previously, and involved many design parameters, requirements, and constraints. In
addition, these areas result in avenues for potential innovation and are coupled with the
innovative functions as focuses for concept generation. The following challenges were
addressed:
• System may not hang below structure
• Energy is concentrated very close to the bottom of the structure
• Turbulent flow
• Low wind speeds
• Flange and cross frame offer viable attachment points.
• Wind speed is going to be lower at the structure
• Potential for large variation in wind distribution
Operating the turbine during low wind speeds is the first challenge addressed in
concept generation, and is the first discussed. Increasing the rotor speed into the
generator was the focus; Figure 28 shows a preliminary sketch. The embodiment shows
a counter-rotating concept where the rotor spins in one direction while the housing that

89
contains the stator rotates in the opposite direction. A counter-rotating concept would
double the speed the generator sees with the same input wind. In addition, the friction
from a bearing is removed by using a magnetic bearing to float the housing.
Figure 28: Counter-rotating concept drawing.
The next concept drawing, shown in Figure 29, shows an alternative concept,
which has been refined to include other functions. In this concept the speed challenge
was address by increasing the velocity of the flow (wind). A ring, with an airfoil profile,
increases the wind speed by concentrating it into the turbine fins. An epicyclic gear train
is used to further increase the speed as it enters the generator. Attaching to the structure

90
was also addressed, and in this concept a strong magnet was identified as a solution for
mounting, and simple adjustment of the height of the wind harvester.
Figure 29: Flow accelerating with magnetic attachment concept drawing.
The previous concepts produce power at low wind speeds by increasing the speed;
however there are many complexities in accomplishing this approach. Other concepts
addressed the problem alternatively. Figure 30 shows the power curve of a typical wind
turbine, where electricity is not produced at low wind speeds (in this case below 5 mph).
Many factors contribute to this, such as design parameters of the turbine fins, and
constraints of the generator. Ideas were generated on how to increase the power output in
this region, leading to some interesting ideas.

91
Figure 30: Typical wind turbine power output for varying wind speeds.
From the students' work at the Air Force Academy, a concept that continues to
create electricity at low wind speeds uses a different kind of transducer. Piezo-electric
materials create an electric current when deformed or stressed (Priya & Inman, 2009).
The concept developed is a hybrid design involving a piezo-electric material and a
generator. At low wind speeds, the generator is disengaged, and an arm stresses a piezo-
electric strip. As the wind increases in velocity, the generator engages, and the arm no
longer flicks the strip to protect the material. Figure 31 shows the initial CAD model for
the turbine fins, striking arm, and strip clamp. The use of an omni-directional fin design
was adopted to remove a yaw mechanism required in horizontal axis wind turbines, and
better respond to the turbulent flow challenge.

92
Figure 31: Hybrid wind harvester with striking arm, piezoelectric strip clamp, and
turbine.
These embodiments are combined and refined into the final concept embodiment
that is used as a blueprint for the first prototype. Figure 32 shows the solid model of the
concept. Features of this concept include an commercially available frame (A), vertical
axis and omni-directional wind turbine from modified commercial parts (B), a
piezoelectric mounting stand, a hybrid transducer system using a piezoelectric strip (C)
and a generator (D), and an adjustable clamping subsystem (not shown). At low wind
speeds the generator is disengaged, and a bar attached to the rotor strikes the piezoelectric

93
strip. At high wind speeds, the generator is engaged by a centrifugal clutch, and the
piezoelectric strip is disengaged to prevent damage.
Figure 32: Final concept solid model embodiment.
The frame was selected from a commercial company that cuts the extruded
material to the specified length. The frame is made from 8020's HT Series aluminum
framing, and connected using bolts and angle connectors. Aluminum offers proper
strength characteristics while being easily machined for necessary alterations. The
turbine blades are Savonius style that operate better at low and varying wind speeds, and
are made from a 90° pipe elbow cut in half (Mirecki et al., 2007). The swept area is 200
cm2 (10 cm x 20 xm). Creating a vertical axis wind turbine was chosen because it
removes the need for a yaw mechanism, and reacts better to changing wind direction.

94
The hybrid transducer system involves a piezoelectric strip from Piezo Systems, Inc
already attached to a quick mount PCB board, and wired for low power operation (Piezo
Systems, 2008). The generator is a Maxon Motor run in reverse. A 4 Watt DC motor
was selected, with an included gear train to step up the input speed (Maxon Motors,
2010). The clamping subsystem is modular, and can be seen in Figure 33 attaching the
wind harvester to the cross-frame on the bridge.
Figure 33: Full concept mounted to I-girder bridge cross-frame.
From the embodiment the prototype is built for analysis. The next chapter
discusses the analytical model that predicts the performance of the system. The
analytical model gives parameters that may be used to size properly the different
components, validate decisions, and give a basis for scaling the system.

95
Chapter 4: Design Modeling and Design of Experimentation
An analytical model of the wind turbine system is developed to help gauge
component specifications, and predict performance. Setting up an experimental
procedure for testing the prototype is also discussed. This chapter explains the method of
translating the customer needs into performance metrics, how the analytical model was
developed, the design of the lab experimentation, and the deductions drawn from the
different phases of developing a model.
4.1 QUANTIFYING THE CONSTRAINTS, REQUIREMENTS, AND ASSUMPTIONS
The constraints, requirements, and assumptions are more than just metrics to
determine the engineering side of design. They are similar to the border of a puzzle,
allowing the structure to begin to take shape and give clues to the next pieces.
Constraints in this context are defined as any range or extreme value that marks the limits
of an acceptable design. A requirement is the minimum performance criteria that a
design is judged by. A discussion of the specifications, requirements, and assumptions
and their ramifications is presented in this section.
The constraints are divided into 3 groups: geometry, cost, and installation. All
constraints are available in Table 12, grouped by category. The volume constraint is 1
ft3, with the largest surface having an area less than 4 ft2. These dimensions ensure the
device can be placed under most bridge structures without interfering with existing
structures. In addition, it reduces unwanted attention from the public. Cost constraints
involve two aspects: the manufacturing costs, and the required wiring. The
manufacturing cost of the prototype is $600. However, as the design is refined, and
design for manufacture can be implemented, that price must drop to $200 per unit. The

96
cost constraint ensures the harvester is affordable for implementation on the many
bridges of concern. Next, there is a constraint of a maximum 10 feet of wiring from the
harvester to the node. One of the goals of the energy harvester and wireless network is to
avoid the cost of wiring by making the system independent from the grid or a central
power source. Finally, installation specifications deal with time and weight. To keep
installation quick and simple the device should not require more than 1.5 hours to mount,
and should weigh less than 20 lbs. These constraints decrease the installation and labor
costs. Finally, there may be no modifications required when mounting the device to the
bridge. In addition to decreasing the labor costs, this constraint prevents the bridge from
suffering any structural damage during installation.
Table 12: Constraints for energy harvesting in a bridge environment.

97
Similar to the constraints, the requirements are categorized into four topics:
service life, maintenance, material, and operation. Table 13-15 describe the different
requirements, and their performance metrics. The driving force behind developing
energy harvesting for this application is to increase the service life of the health
monitoring to better mimic the service life of the bridge. A service life of the entire
system is set at a minimum of ten years. This service life directly affects the material
choices, as shown in the Material category; all components must resist humidity,
moisture, corrosion, and deterioration for at least ten years. The maintenance interval
would ideally also be ten years; however a minimum requirement of 5 years is
acceptable.

98
Table 13: Time span requirements of an energy harvesting system in a bridge environment.
The operation of the energy harvester must fulfill the requirements of the health
monitoring sensors and communication network. Table 14 gives power levels, voltage
form, and electrical current requirements for different aspects of the health monitoring
network. These requirements are important considerations when choosing an energy
harvesting domain, as well as when designing the harvester. They play a vital role in
sizing the generator. These electrical performance metrics will also be used to measure
the effectiveness of the system. The first iteration is aiming to satisfy the requirements of
the router: providing continuous power of at least 207 mWatts.
Table 14: Operation requirement of the health monitoring sensors and network.

99
Finally the safety requirements are paramount to a successful system. The safety
requirements represent the essential functions that cannot fail during the life of the
system. High standards are used when identifying performance metrics involved in
removing the harvester from the bridge. Requiring a hundred pound of force satisfies
both the prevention of vandalism and assurance that the device will not detach from the
bridge in high winds. The final safety requirement that the device remain above the
flange is very important; the civil engineers express particular concern with traffic
colliding with an object that hangs below the bridge. In addition, if the harvester hangs
below the lowest point, then the clearance height sign must be changed. Requiring the
device to mount above the lowest flange of the bridge mitigates this expense.

100
Table 15: Safety requirements for the bridge environment.
The requirements and constraints are critical to designing and assessing the
mounting mechanism. Some of the requirements and constraints are especially crucial to
the wind harvesting system. For instance, installing the wind harvester within 3 m (10
feet) of the node without modifying the bridge is a difficult design problem. The
optimum placement is furthest from any interfering structures, while the sensors are
going to be placed on the structure. A compromise between these design decisions will
be reached. Particular attention is also taken to ensure the harvester will not break the
lowest plane of the bridge. The focus is for the wind harvester to be completely
contained under the bridge within the girder to satisfy these requirements. This decision
also solves some of the safety requirements involving weather because the bridge deck
will provide protection from hail and rain.
Wildlife presents another safety area that must be considered when designing the
energy harvesting system. The system must protect itself from wildlife, preventing
roosting by animals and corrosion from animal waste. There is a history of activism
against wind turbines due to the damage they cause to migratory patterns, and the death

101
of flying animals such as birds and bats (Barclay, Baerwald, & Gruver, 2007). This
system will be significantly smaller than the large wind farm turbines that these reports
address, but protecting local wildlife is still important. The animal requirements are
important for the project, but the first iteration is concentrating on the other requirements
more heavily.
There are several assumptions that must be made to proceed with the development
of the wind harvesting system. First, it is chosen to use a commercially available
generator instead of developing a new one. Low power generators are not commonly
sold commercially; previous research simply used a small motor and ran it in reverse (Xu
et al., 2010). Motor vendors are research instead, and the motor is assumed to behave
ideally in reverse. This assumption allows the performance characteristics of the motor to
be used when modeling the system. In addition, all the components are assumed to have
linear relationships; for example, the damping in the bushings is assumed to linearly
relate torque and angular velocity.
The wind speed at the girder is assumed to be lower than the environment, but by
only by a small amount. The slightly lower wind speeds are factored into the analytical
model, where the difference is chosen based on the data acquired when characterizing the
bridge. In addition, the flow is assumed to be turbulent due to the disturbances caused by
the bridge and its supporting structure. The turbulent flow is going to adversely affect the
wind turbine; a Savonius style turbine is chosen because it reacts better to varying wind
speeds and changing directions, and is self-starting.
4.2 ANALYTICAL MODELING OF THE WIND TURBINE
Predicting performance of the wind turbine before purchasing components is
important to understand the feasibility and begin quantifying the parameters. Modeling

102
the system using bond graphing techniques identifies state variables and produces state
equations. These equations are programmed into MATLAB to predict performance.
4.2.1 Bond Graphing Representation of the Wind Turbine
Representation of the wind turbine is completed first using a graphical approach
showing the bonds between components (Beaman & Paynter, 1993). Figure 34 shows
the bond graph describing the wind turbine system. The bond graph has three separate
sections: the wind and turbine blades, the coupler between the turbine rotor and the
generator, and the generator rotor (mechanical). The diamond represents the causal
relationship at each node.
Figure 34: Bond graph representation of wind turbine system.
The input flow is converted to a rotation torque by (Menet & Bourabaa, 2006):
Cm is the efficiency of the rotor capturing the wind (conservatively estimated to be
0.2), ρ is the density of air (1.21 kg/m3), υ speed of the wind, R and H are the radius and

103
height of the turbine blades respectively. In the power equation, n is the gear ratio of the
transmission.
The damping due to friction in the bearings that support the rotor shaft are
represented by the resistive element in the "Rotor" section. The inductive element's
rotational inertia is assumed to be dominated by the turbine blades, which are assumed to
be point masses located at the midpoint of the fins. The generator has rotational inertia,
and is represented in the rotor section by the inductive element. Finally, the coupler is
represented by a capacitive element. The capacitive element corresponds to the coupler
as a torsion spring; the inertia and resistance in the coupler are assumed to be negligible
when compared to the inertia of the turbine blades and the damping in the bearing,
respectively. The state variables and equations can be seen below in Equation 6:
The state variables are h1, θ, and h3 that represent the turbine inertia, rotational
displacement, and rotor inertia respectively. As a first approximation, this model is
expected to aid in sizing the generator and turbine blades. The following section
discusses how the model is used in different ways to accomplish these results.
4.2.2 Modeling
The modeling is initially performed to size the motor to be used as a generator.
Two models are performed, one comparing the wind speed to the power output of the
system, and another to determine the charging time of a capacitor connected in series to

104
the generator. The parameters of the turbine are taken from commercially available
products' data sheets, and then compared to each other. Estimation for the bushing's
damping coefficient is required because no posted data was available. The damping and
inertia in the coupler are assumed to be negligible. Maxon Motors provides the generator
rotational moment of inertia, and the torsion spring constant of the coupler is determined
from the material properties of aluminum and geometry. In addition, the generator data
sheet provides a constant for converting the speed of the rotor to a voltage and the torque
of the rotor to current (Maxon Motors, 2010). These two values are used to calculate the
average power produced by the generator.
The electrical component parameters used to model the charging time for
electricity storage are based on components chosen to agree with tests performed by the
United States Air Force Academy, as discussed in Chapter 3. A 2200 µF capacitor and a
44 kΩ resistor are connected in series with the generator.
Finally, the wind for the charging time is was simulated using a random function
that changes the wind speed every minute based on a Rayleigh distribution, centered
around 3 m/s (approximately 6 mph). The wind speed was chosen based on the data
collected and discussed in Chapter 3. The model is run to simulate a minute, and then the
charge time to the router's requirement, 6 volts, is estimated. Figure 35 shows the results
of a trial test run, where the wind was set to zero after 4 seconds, and the response
recorded with speeds in revolutions per minute, rotational displacement in degrees, and
charge in coulombs. The simulation shows the rotation beginning to drop exponentially,
as expected. However, the charge begins decreasing when there is no longer an input,
which should not happen. The issue is resolved by including the modeling equivalent of
a diode bridge that does not allow the capacitor to discharge to the generator. The results

105
of both simulations are discussed in the following section, and simulation code is
included in Appendices B-E.
Figure 35: Trial simulation of the analytical model.
Next, the size of the turbine blades is varied to compare how this will affect the
power levels. The height is restricted by the wind’s penetration into the girder, so only
the radial length is varied. A constant wind speed of 4.5 m/s is used because that is the
approximate average for the region.

106
4.2.3 Results and Implications
The model predicts power production using the MATLAB differential equation
solver ode45 for a 4 W and 10 W motor. The solver determines the rotor speed starting
from rest for a time span of 10 seconds, which is converted to a voltage and current,
which are multiplied to get power. First, the average power generated by the 4 W
generator over that time span for each wind speed is compared to the power predicted by
Betz's Law for the same parameters and a coefficient of 0.3, as seen in Figure 36. Betz's
Law predicts the turbine will supply 200 mW of power at wind speeds of approximately
4 m/s. The analytical model predicts lower power production and a required input wind
speed of approximately 10 m/s. The lower power output is expected because Betz's Law
uses a constant coefficient of performance, when in reality the coefficient is a largely
dependent on the generator characteristics and wind speed (Khaligh & Onar, 2010).

107
Figure 36: Predicted power from analytical model of two generator sizes, and the predicted power by Betz's Law.
Second, the predicted power from the 4 W and 10 W generators are compared in
Figure 37. The two motors respond very similarly as generators; However, there is a
significant cost increase between the two motors. Therefore, using the 4 W motor as a
generator is more acceptable, especially for the proof of concept being developed.

108
Figure 37: Comparison of two (4 W and 10 W) motors acting as generators.
A comparison of the different sizes of the turbine blades by varying the radial
length is shown in Figure 38. The radial lengths range size from 10 cm to 40 cm. The
radial length of the turbine blade is seen to have a significant effect on the power
production of the generator. According to the model, a radial blade length of
approximately 40 cm will produce the required 200 mW of power at wind speeds
between 5 and 6 m/s, which is a good range to protect the turbine and supply proper
power for storage.

109
Figure 38: Comparison of different size turbine blades.
The analytical model of predicted power outputs helps size the motor and turbine.
However, the system is not going to be run directly off the generator; the power is going
to be stored and conditioned. For those purposes, determining the charge time of a
capacitor is important. A second model was run to determine the charge time of a
capacitor, which is modeled as an addition in the bond graph of a capacitor and resistor in
series with the generator after a gyrator, as seen in the bond graph in Figure 39.

110
Figure 39: Bond graph including the electrical load.
The conversion from rotation to electricity uses the speed and torque constants
provided by the motor manufacturer's data sheet (Maxon Motors, 2010). The torque is
related to the current by the torque constant, and the voltage is related to the speed of the
rotor, which is why a gyrator is chosen as the conversion in the bond graph. Solving for
the charge on the capacitor's state equation results in Equation 7:
The simulation is run using a time span of 20 minutes, varying the wind every 3
min and 20 second, resulting in six wind speeds. The wind is calculated using a Rayleigh
distribution random number generator, distributed around 3 m/s. Figure 40 shows the
charge vs. time, and the six different wind speeds used in the simulation. The charge
increases at a relatively constant rate, and so the simulation is used to estimate the time
for the capacitor to reach 6 V. The result is the 2200 µF capacitor can be charged to 6 V
approximately every 20 seconds. If several capacitors can be charged, then the 200 mW
requirement from the router can be accomplished by the proof of concept.

111
Figure 40: Simulating the relationship between charge and time.
The parameters chosen during the simulation give a strong basis for making
design decisions. The next step in constructing a prototype is creating the Bill of
Materials based on the specifications of the modeling design, the ranges available
commercially, and the requirements and constraints discussed previously. Table 16
shows the Bill of Materials, and the parameters used in the analytical model.

112
Table 16: Bill of Materials to be used when searching for commercial products.
From the modeling and requirements and constraints, decisions are made to best
suit the application. The frame will be the heaviest component, and so aluminum will
likely be selected. The motor size and frame dictate the rotor and coupler dimensions.
The turbine blades are currently only restricted by the size range in the model. However,

113
from previous research, the shape is very important to the performance characteristics.
The bearing is also unconstrained, and so the parameters are determined based on the
results from the model, and from a preliminary search of commercially available
bearings. An above average wind speed is chosen, and simulated to determine the
operating speed of the system, and then the bearing is chosen using this as a midrange
operating speed. Figure 41 shows an example of the state variable solutions; the input
wind is 7 m/s, which is above average, but is a reasonable representation of a speed that
the harvester will have to be capable of surviving.

114
Figure 41: State variable results, input wind of 7 m/s.
The first chart shows the rotor and turbine's angular velocity as it reaches a steady
state. The second chart is the rotational displacement, in degrees, of the coupler. Finally,
the third chart shows the speed of the generator shaft after the speed has been increased
using a gear train. The bearing is chosen such that a thousand radians per second falls in
the middle of its operating speeds. Choosing a bearing in this range assures that the
bearing will be capable of handling occasional faster wind speeds. Additional

115
specifications, especially dealing with sealing the bearings from dirt, analyzed when
choosing the bearing.
The development of experiments to test the model and design choices followed
the preliminary selection of components. The experimental design is discussed next
before the final component selection and proof of concept testing is presented in Chapter
5.
4.3 DESIGN OF EXPERIMENTATION
The choice of experimentation is important to validating the work already
completed. Characterizing the turbine and comparing the values to those used in
modeling, measuring the power output from both transducers, and the effects the different
components have on each other are the subjects the experiment is designed to address. In
addition, the materials needed are identified in the following sections.
4.3.1 LabVIEW Data Aquisition
Data acquisition equipment included National Instruments products, an
anemometer, and a wind source (fan). The hardware that collects the data is the NI DAQ
USB-6211, which measures the voltage difference between two terminals. A LabVIEW
VI was written to capture the input voltage, convert it to power, and measure the wind
speed input from the anemometer. The anemometer outputs a voltage pulse for each
rotation; the frequency of the pulses is proportional to 2.5 mph/Hz. This data is saved in
a TDMS format, and then imported into Microsoft Excel for processing. The voltage is
measured across a resistor of known value. Figure 42 shows the circuit, and the
LabVIEW Block Diagram created to save the data is included in Appendix F.
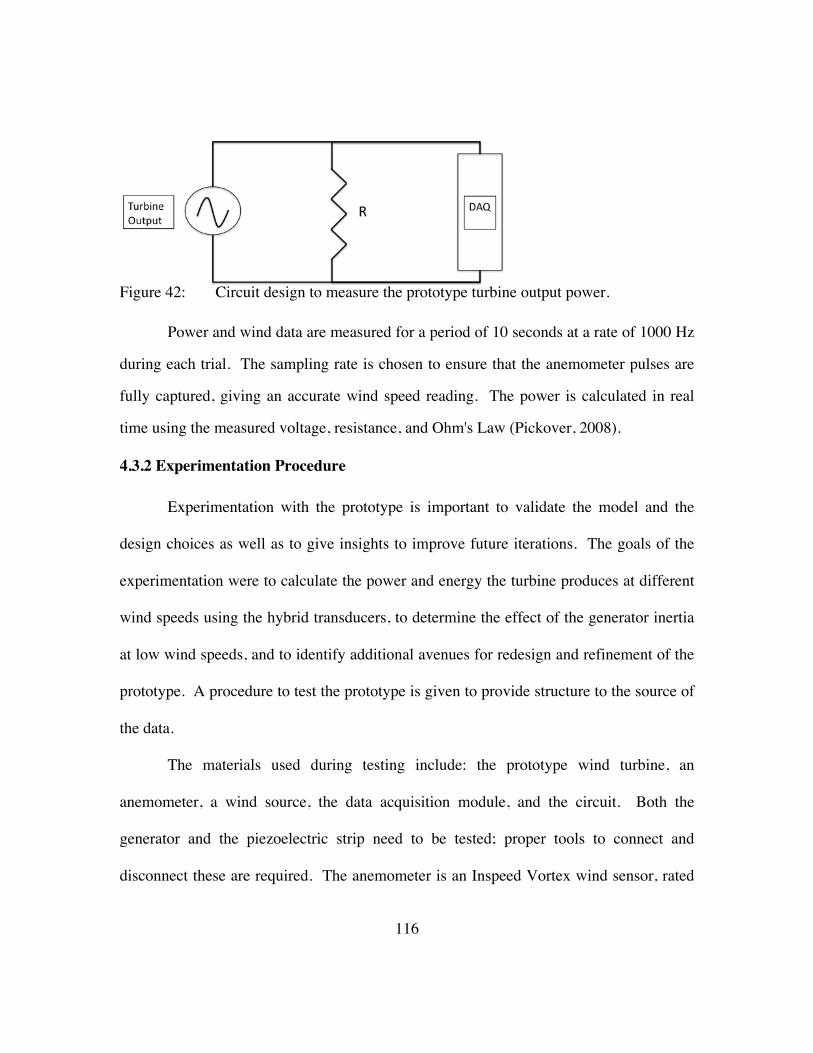
116
Figure 42: Circuit design to measure the prototype turbine output power.
Power and wind data are measured for a period of 10 seconds at a rate of 1000 Hz
during each trial. The sampling rate is chosen to ensure that the anemometer pulses are
fully captured, giving an accurate wind speed reading. The power is calculated in real
time using the measured voltage, resistance, and Ohm's Law (Pickover, 2008).
4.3.2 Experimentation Procedure
Experimentation with the prototype is important to validate the model and the
design choices as well as to give insights to improve future iterations. The goals of the
experimentation were to calculate the power and energy the turbine produces at different
wind speeds using the hybrid transducers, to determine the effect of the generator inertia
at low wind speeds, and to identify additional avenues for redesign and refinement of the
prototype. A procedure to test the prototype is given to provide structure to the source of
the data.
The materials used during testing include: the prototype wind turbine, an
anemometer, a wind source, the data acquisition module, and the circuit. Both the
generator and the piezoelectric strip need to be tested; proper tools to connect and
disconnect these are required. The anemometer is an Inspeed Vortex wind sensor, rated
117
for speeds between 5 and 125 mph (Inspeed.com, 2008). For the lab testing, a 3-speed
fan is used as a wind source. Finally, the circuit, as seen in Figure 42, uses a 44 kOhm
resistor.
The procedure is broken into four measurement categories: the generator alone,
the piezoelectric strip alone, the piezoelectric strip while coupled to the generator, and the
generator while the piezoelectric is engaged. The categories are chosen to clarify and
give insights into the effectiveness of the hybrid system.
The generator output is first measured while the piezoelectric is disengaged to
determine the operating speeds and characteristics of using a motor as a generator. The
reverse operation is anticipated to have some losses that are not used in the model, and
this experiment helps determine more accurate parameters. First, the piezoelectric strip
and mount are removed from the prototype and the generator leads are placed in parallel
with the resistor and output. The fan is run at low speed, decreasing the distance between
the fan and prototype until the turbine first begins to rotate. A trial is run to determine
the cut-in wind speed from rest. The second and third trials run from the same distance,
turning the fan to the medium and high settings, respectively. The three trials are
repeated, decreasing the distance between the wind source and the prototype, which
increases the velocity of the wind seen by the turbine.
The hybrid concept is attractive because it produces power at wind speeds much
lower than the turbine alone. However, the power gain must prove to be worth the added
expenditure. The piezoelectric strip output is measured while the generator is disengaged
to clarify the need to find a mechanical disengaging mechanism. The generator is

118
anticipated to absorb some of the input torque, but how much is to be determined. The
power output of the uncoupled piezoelectric strip gives a comparative value to determine
the generator's absorption, and approximates the power production at low wind speeds
with a mechanically disengaged generator. First, the piezoelectric strip and mount are
attached to the prototype and secured. Next, the generator is decoupled from the turbine
rotor. The leads from the piezoelectric strip are connected to the circuit in parallel with
the DAQ and resistor. The cut-in wind speed is determined in the same manner as for the
generator. Trials are also executed in the same manner, however care is taken to prevent
the rotation from reaching a point where the piezoelectric strip breaks.
The previous trials are repeated with the generator coupled to the turbine rotor.
These trials quantify the amount of energy absorbed by the open circuit generator, and
reveal the need to pursue a mechanical disengaging function. If the results are
inappreciably different, then an electrical switch could be used to open the generator
circuit during periods of low wind speeds. If there is a large difference in the
piezoelectric strip's power output, this function will need to be pursued. The wind speeds
need to be mimicked as closely as possible, and therefore the trials are conducted with the
wind source at the same distances as the previous category's trials.
The final category is measuring the generator output with the piezoelectric strip
mounted and engaged. The purpose of this category is to determine if the power output
at low wind speeds makes up for the losses of the generator inductance. In addition, the
range of the cut-in wind speed is recorded to find the different ranges of operation
between a coupled and uncoupled piezoelectric strip. This knowledge will help to

119
determine when to disengage the piezoelectric strip. The setup is the same as the
previous category, except the leads from the generator are input into the circuit instead of
the piezoelectric leads.
Testing the prototype using the previously described procedure is conducted after
the assembly of the different components. The experiment design can be found as an
itemized procedure in Appendix G.
Modeling the system gives an engineering understanding of how the wind turbine
works, and how the various factors alter its behavior. Creating an analytical model is
valuable to anticipate the potential output based on available components, and forces the
designer to become intimately knowledgeable about the system. First, the model helps
match components to the specifications and requirements. Second, understanding the
system gives good insights into how the testing should be done, and what parameters
need to be measured to characterize the wind turbine. Chapter 5 deals with constructing
the proof of concept, testing it, and then comparing the empirical data to the analytical
model.

120
Chapter 5: Prototype Development and Experimentation
The physical result of the work presented is embodied in a proof of concept first
envisioned in Chapter 4. This chapter describes the commercially available components,
fabricated components, and any differences observed between them and the analytical
model. Next, the experiments articulated in Chapter 4 are conducted, with the results
presented. Finally, a concept is laid out and described with new innovations to solve
issues encountered when building and testing the proof-of-concept.
5.1 PROOF OF CONCEPT
The proof of concept is broken into two commercial sub-systems, and four
fabricated components. The components acquired commercially are the power
transducers (generator and piezoelectric strip), and the frame. The components that are
fabricated for the proof of concept are the mounting structures (for the bushings,
generator, and piezoelectric strip), the turbine blades, rotor, and shaft coupler.
The generator is a motor run backwards as a generator to produce a voltage and
current. Maxon Motors USA sells a variety of motors in different sizes and offers the full
specifications of the different products, and has the option to automatically match a drive
train to the system. From the analytical model using the parameters and equations
provided by the retailer a 26 mm diameter, 4 Watt motor is selected with a transmission
gear ratio of 15. After the power, the two primary variables that led to the motor
selection were the nominal speed and torque. The nominal speed is 5090 rpm, which
translates to a rotor speed of approximately 340 rpm; the nominal torque is 5.45 mN-m,

121
or a torque on the rotor of approximately 75 mN-m (Maxon Motors, 2010). The nominal
speed is at the high end of the anticipated speeds the harvester will encounter. However,
the large operating range under the nominal speed means the system will produce power
most of the time, and rarely reach dangerous speed levels.
The piezoelectric strip is a bending actuator with a built in quick mount and wire
leads on one end from Piezo Systems, Inc. The leads are for low power operation, and a
built-in bleed resistor protects the strip and any user electronics from transient voltages
(Piezo Systems, 2008). To stress the piezoelectric strip, a striking arm is built into the
rotor coupling component. From the stiffness parameter given on the piezoelectric
specification sheet the optimal deformation is calculated, resulting in the placement of the
piezoelectric mounting structure relative to the rotor.
The final commercially sought component was the frame that serves as the
skeleton for mounting the other subsystems. Plenty of room is included to allow
potential future additions. Aluminum is selected for its strength-to-weight characteristics
and machining properties. The HT Series framing from 80/20, Inc. provides the
characteristics and shape for proper strength and simple adjustment. In addition, 80/20
cut the frame to specification and included hardware such as bolts, nuts, and angle
connectors.
The remaining components, shown in Figure 43, are constructed from modified
commercial products, or are custom made from stock materials. The rotor and bushing
subsystems (A) are taken from an attic vent. The vents operate in similar conditions, and
deal with similar requirements, such as operation in low wind speeds. The vent has two
bushings, and a 3/8" rotor. Two custom mounting plates (B) are fabricated to hold the
bushings on the frame. Aligning the bushings' and generator's axes of rotation is a
nontrivial part of this fabrication. The center hole is the reference for all other machining

122
operations to help keep the shafts aligned. The plates are thin sheets of steel, which lie
across the aluminum skeleton (C). Next, the mount that holds the piezoelectric strip (D)
is constructed from aluminum and mounted to the lower steel plate. A coupler (E) that
connects the rotor to the generator shaft is made from 3/4" aluminum rod. Two setscrews
engage the coupler to the rotor and generator shaft. The size is determined by the key
width of the generator shaft. Protruding from the coupler is a striking arm to engage the
piezoelectric strip. The coupler is threaded at the same height as the centerline of the
piezoelectric strip when mounted. A screw sits in these threads, extending from the
coupler to the piezoelectric strip with an interference of 0.1 mm. Finally, the turbine
blades (F) are 90° PVC pipe elbows with a 10 cm diameter and 20 cm length, resulting in
a swept area of approximately 200 cm2. The half pipe bend is a shape that will efficiently
capture the wind, and offers the advantage of minimal fabrication. Figure 43 shows the
embodiment of the proof of concept wind turbine.

123
Figure 43: Embodiment of the proof of concept wind turbine.
Multiple lessons are learned in the construction of this first iteration wind turbine
system. The first deceptive expectation that must be avoided is an assumption that
components ordered from vendors are the exact dimensions specified. Careful selection
is important to receiving what is needed, but designer should be prepared to modify the
components so they interface properly. This is most apparent when ordering bearings for
the rotor shaft. Small imperfections cause large misalignments; the solution was to
acquire a bushing and rotor system from an analogous product as described previously.

124
In future iterations, this problem can be solved by paying particular attention the
tolerances, and designing features into the custom housing to aid in alignment.
Second, there were unforeseen consequences to the design of the coupler
connecting the shaft of the generator to the rotor. The coupler is fabricated from an
aluminum rod with holes of respective sizes bored into each end, and fastens to the shaft
with setscrews. Misaligning the setscrew with the keyed edge of the generator shaft
caused the coupler to slip, such that the generator does not rotate at the same speed as the
rotor. Alternative products exist that are better designed to connect shafts and reduce
slipping and misalignment.
Finally, the turbine fins are constructed from PVC for the reasons previously
stated. However, the aerodynamic properties of the blades have a drastic effect on the
performance of the wind turbine. Creating very smooth turbine blades will result in a
more efficient turbine; the next iteration should use alternative materials and technologies
to improve this aspect of the turbine blades.
5.2 EXPERIMENTATION
The proof of concept is intended to show the feasibility of the system in
accomplishing the goals and requirements of the system. Experimentation procedures
and products for the proof of concept are described in Chapter 4. In addition, knowledge
gained from this proof-of-concept model will inform subsequent iterations.
5.2.1 Characterizing the Proof of Concept
Several questions are posed about the systems that must be answered to further
develop the analytical model and the prototype. What are the effects of the transducers on
each other, generator to piezoelectric and piezoelectric to generator? What is the effect

125
of an electrical load on the piezoelectric? What is the best way to predict the power
output for modeling? How well does the analytical model predict the actual system?
The first step in characterizing the wind harvester is acquiring data from the
different outputs. Three outputs are measured: voltages from the generator, voltages
from the piezoelectric transducer, and voltages from the anemometer. Figure 44 and
Figure 45 show the raw data output from the generator and the piezoelectric actuator, and
the anemometer respectively. The motor generator outputs a DC voltage. The
piezoelectric transducer outputs voltage events, and then oscillates to rest. Finally, the
anemometer outputs a pulse for each rotation.
Figure 44: Voltage signatures measure from generator and piezoelectric.

126
Figure 45: Anemometer raw data output.
Power from the generator and piezoelectric strip is calculated using Ohm's Law
and a known resistor value. Due to the erratic nature of the generator data, the average
power is calculated over a time span of 10 seconds. The average power is compared to
the average wind speed, described later. The piezoelectric data is similarly analyzed and
compared. In addition, the energy captured by the piezoelectric is calculated using a
numerical integration method.
The wind data is used to calculate the wind speed. Each pulse represents one
rotation of the rotor; each rotation equates to 2.4 mph (Inspeed.com, 2008). An algorithm
is developed to analyze the data and give the instantaneous wind speed and the average
wind speed. The code is available in Appendix B. The following sections describe the
analysis of the data, and the information gained from that analysis, answering the
questions previously posed.

127
5.2.2 Analysis of Data
The objectives are to capture power at low wind speeds by striking the
piezoelectric strip, and then engaging the generator as the rotor increases in speed. Two
solutions to engaging the generator are an electrical solution (e.g., a threshold diode) and
mechanical switch (i.e., a clutch). The electrical switch is believed to be simpler and
more cost effective than a mechanical clutch. However, there is concern that the
generator will slow the rotor down significantly, even with no electrical load. Data is
collected to compare the effect the open circuit generator has on the rotor speed.
The original method to compare the effect of the generator on the piezoelectric
power production involved first measuring the rotor speed directly using a non-contact
tachometer, and then comparing that to the power levels. However, the setup had
problems that affected the results. The tachometer uses an infrared laser reflecting from a
piece of reflective tape attached to the rotating member to determine the rotational speed.
Large amounts of reflective material, such as metal, will make the readings inaccurate.
In the case of this prototype, the frame causes too much interference to obtain accurate
readings.
An alternative procedure uses the piezoelectric transducer to determine the
rotational speed using some simple data analysis. Figure 46 shows the piezoelectric
voltage events during operation. The combination of one striking arm and one
piezoelectric strip signifies each event measured from the strip is the equivalent of one
rotation. Counting these events over a known time period and interpolating to a minute
scale gives the rotor's speed in revolutions per minute. Each spike represents the
deformation of the piezoelectric transducer by the striking arm during a rotation of the
rotor. The blue plots indicate the rotor uncoupled from the generator; the green plots
represent the rotor coupled to the generator with no electrical load (open-circuit).
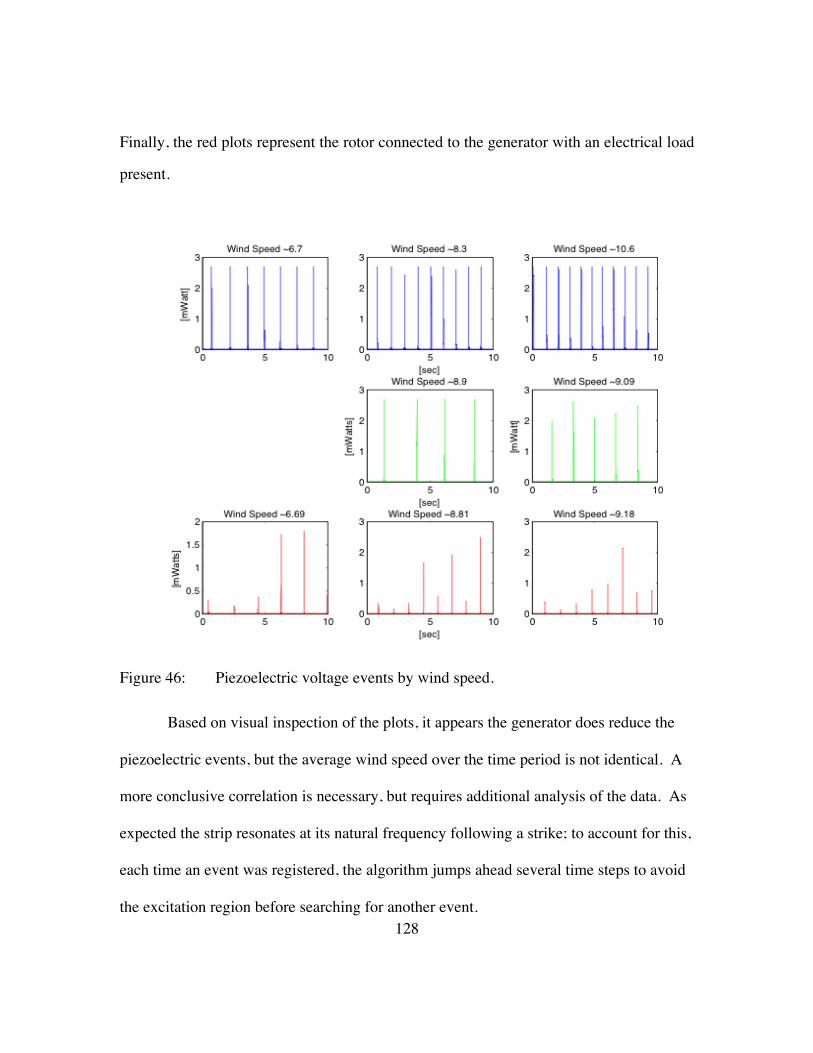
128
Finally, the red plots represent the rotor connected to the generator with an electrical load
present.
Figure 46: Piezoelectric voltage events by wind speed.
Based on visual inspection of the plots, it appears the generator does reduce the
piezoelectric events, but the average wind speed over the time period is not identical. A
more conclusive correlation is necessary, but requires additional analysis of the data. As
expected the strip resonates at its natural frequency following a strike; to account for this,
each time an event was registered, the algorithm jumps ahead several time steps to avoid
the excitation region before searching for another event.

129
Figure 47 shows the raw data from a single striking event of the piezoelectric
strip. The algorithm records an incident, proceeds beyond the resonant period, and
searches for the subsequent incidents.
Figure 47: Single voltage event from striking the piezoelectric strip.
The data (wind speed, piezoelectric voltage, and generator voltage, if coupled) are
collected over a period of ten seconds. Power is calculated using the measured voltage, a
known resistor, and Ohm's Law (Pickover, 2008), as previously discussed. Then, the
data from the rotor when the generator is engaged are correlated to the data when the
generator is unengaged, as seen in Figure 48.

130
Figure 48: Comparison of rotor speed vs. wind speed with the generator coupled and uncoupled.
This comparison highlights the effects of the generator on the rotor speed. In
addition, the effect of the electrical load is shown to be inconsequential when compared
to the open circuit rotor speed. The starting speed for the uncoupled rotor is much lower
than when the generator is engaged. According to these conclusions, a proper
mechanical switch may be more effective than an electrical switch for increasing the
energy captured at low wind speeds by the. Additional testing is required to learn how
the losses of a mechanical switch will affect the rotor speed. The electrical switch is not
a justifiable addition either because an electrical load does not have a great effect on the
rotor speed.

131
Figure 49 shows the average power of the generator, and the coupled and
uncoupled piezoelectric vs. wind speed. The generator power is significantly higher than
either piezoelectric contribution. However, a mechanical switch still needs to be
investigated for further iterations of the wind harvester because it will likely allow energy
capture at wind speeds below the cut-in speed of the generator (below 5 mph). If the
mechanical switch is deemed infeasible, then the system should probably keep the
generator engaged full time. Without a mechanical switch the piezoelectric is not
obsolete either; as demonstrated, the voltage events can be used to collect energy and to
determine the rotor speed. This information may be valuable for system operation,
maintenance, and protection. For example, an alternative use of the piezoelectric strip
could be to charge a capacitor for aided starts. The capacitor discharges an input voltage
into the generator, reversing its normal function and initiating rotor rotation for low wind
speed starts. This is especially valuable if a Darrieus style turbine blade is used because
that blade design is not self-starting (Meyers, 2009c).

132
Figure 49: Measured average power of prototype wind harvester.
To further emphasize the importance of investigating a mechanical clutch, the
power is integrated to determine the energy captured at the lower wind speeds. The
lowest wind speed at which the generator captured energy is just below 6 mph. However,
the uncoupled piezoelectric began capturing energy between 3 and 4 mph. The
trapezoidal numerical method is used to integrate over the time span for each wind speed
measured. Figure 50 shows the results of the integration, broken into scenarios. Not only
does the uncoupled system capture energy at much lower wind speeds, but the uncoupled
system captures a magnitude more energy than the coupled/no load and coupled/electrical
load system.

133
Figure 50: Energy captured by piezoelectric strip in different scenarios.
Next, the analytical model developed in Chapter 4 is compared to the empirical
data gathered. The components are chosen based on the accuracy of the model, and so
the accuracy must be validated. To do so the predicted power from the generator is
compared to the real power as a function of input wind. Figure 51 shows the comparison
of the predicted power to the real power.

134
Figure 51: Comparison of analytical vs. empirical power data.
The predicted response shows similar characteristics as the empirical data;
however, the model begins to deviate rapidly as wind increases. Varying the parameters
will give a better estimate of the predicted power to be used for future work. The first
step to modifying the original model to better fit the empirical data is to determine the
damping in the rotor bushing. The assumed damping parameter value was 0.05 [mN-
m*sec/rad], and was assumed to be linear. The torque is calculated from the Savonius
torque equation previously discussed (Menet & Bourabaa, 2006), and then compared to

135
the uncoupled rotational speed. The rotational speed is determined by analyzing the
piezoelectric events, as previously discussed. Figure 52 shows the calculated torque
compared to the rotor's rotational speed, and a linear trend line.
Figure 52: Determining the damping coefficient of the bushings.
The trend line is shown to be accurate in predicting the torque-velocity
relationship, with a squared correlation coefficient of 0.86. The damping coefficient is
seen in the trend line equation to be equal to 0.07 [mN-m*min/rev], which is close to the
estimated value of 0.05 [mN-m*min/rev]. This indicates that the generator has some
significant mechanical damping as well; this result is an additional reason to investigate a
mechanical clutch. The damping parameter is increased to find a value that creates a
model that better describes the empirical data. This same method is used with the coupled
piezoelectric data, and is seen in

136
Figure 53.
Figure 53: Determining the damping coefficient of the generator.
Figure 54 shows the results of varying the damping coefficient, and the empirical data.
The damping coefficient value of 0.17 [mN-m*min/rev] determined with the previous
method matched better, but was still too low. A damping coefficient value of 3.5 [mN-
m*min/rev] best follows the data. This gives a conservative prediction at lower wind
speeds, and will likely give liberal estimates as wind speeds deviate from the average
local wind speed. Additional model adaptations are investigated, but none gave a result
that mimicked the empirical data as accurately.

137
Figure 54: Varying damping coefficient in model to better describe data.
Additional validation of the accuracy of varying the damping coefficient is seen in
Figure 55. Here the rotor speed is compared to the average wind speed, and the model
again is much better at describing the system with a damping value of 3.5 [mN-
m*min/rec].

138
Figure 55: Comparison of rotor speed to average wind speed with variable damping coefficient.
The second step to developing a better prediction model for the power of the
system is to determine a more accurate factor to quantify the conversion from mechanical
energy to electrical energy. The simplest way to do this is to estimate the power output
based on input wind speed. However, a power-wind speed model will limit a designer's
capability to predict the effects any changes will have on the system. The model already
mimics the empirical data, so providing a better correlation between the rotor speed and
the power output will give the designer the ability to change component parameters and
more accurately predict power output. The previous model assumed constant scaling
factor relating torque to current and speed to voltage. By plotting the rotor velocity,
determined from the piezoelectric event, against the measure power output, as seen in

139
Figure 56, a conversion equation is determined using a linear trend line. The squared
correlation coefficient shows the trend line closely fits the empirical data.
Figure 56: Correlation of output power and rotor velocity. New simulations were run using the empirically derived conversion equation to
find an even better fit.
Figure 57 shows the first two iterations of the simulations. The first uses a damping
coefficient of 3.5, which underestimated the power, but followed the slope well. The
second uses a damping coefficient of 1. This combination gave a closer estimate at the
expense of an inaccurate slope.

140
Figure 57: Matching the model to the empirical data by varying the transformer coefficient.
Continued optimization of the component parameters will yield a more accurate
model. However, the goal is to develop a model that can be used for scalability. Factors
such as generator coefficients are likely unique to each generator (motor). Therefore,
correlations between components must be determined by testing to determine the proper
relationships. It is more efficient to use the motor specifications published by the
manufacturer, and take into account significant mechanical damping from the generator.

141
Finally, the designer should assume that the prediction will overestimate the average
power available.
The final step is to determine the charging time of the power storage components
of the system using the modified model. No testing is currently complete because the
electrical system is yet to be completed. The same simulation is run with the modified
parameters to determine charging time. Figure 58 shows the simulation using the new
parameters. The estimated time to charge a capacitor is thirty seconds, meaning the
system can charge a bank of capacitors and provide the necessary power for router
operation in that time.
Figure 58: Simulated charge time of updated model.

142
5.3 HYBRID REDESIGN
There were many limitations when constructing the proof-of-concept model, from
feasibility to availability. As a design project, it is good practice to remove all limitations
and just let the designer put together a creative idea to push the boundaries of what can be
done. This section affords just that opportunity.
Many issues have been identified throughout the journey of this project;
compromises were made for many of them, and the rest were engineered or designed
around. What can be done if we removed the boundaries of the accepted? Take away the
status quo. Creative solutions to the following problems are addressed: increasing the
captured energy at low wind speeds before engaging the generator, protecting the system
from high winds, and attaching the system to a bridge.
As demonstrated, the generator has a higher cut-in speed than the rotor and slows
down the rotor when engaged. Large wind turbines use different kinds of active controls
to affect what this speed is, and limit the speeds at which the turbines produce power to
protect the system (Muljadi & Butterfield, 2001). For a maintenance-free, autonomous
system at low power, this kind of control is not feasible. The heart of the problem is the
generator, so the solution may be to redesign the generator. The problem becomes
creating a generator that has a lower stall torque, but still captures energy over a large
range of wind speeds. To accomplish this mechanically, the rotational inertia needs to be
minimized; electrically, any influence of a magnetic field on the coil should be removed.
The idea is to use a governor to maintain a more constant speed by having a variable
inertia. Point masses on the ends of pivoting arms accomplish this effect by varying the
radius of the system as the speed increases.
When the wind is low, the system produces power by striking a piezoelectric
strip. To protect the strip, the striking arm should disengage or move out of its striking

143
position. The pivoting arm of the governor has exactly the properties to provide the
functionality to harvest low wind power by striking a piezoelectric strip. As the rotor
speeds up, the arms will pivot away from the piezoelectric strip, discontinuing the
striking action.
A generator works by either moving a coil through a magnetic field, moving the
magnetic field, or changing the intensity of the magnetic field. The magnetic field can be
created by a permanent magnet or electromagnet. Increasing the linear speed and the
number of coils will increase the induced current in the coil. Figure 59 shows the rotor
and stator assemblies for a new generator concept for a wind energy harvester. Permanent
magnets are be used as masses on a governor. The coils are formed into a bowl shape,
with the radius of the bowl's arc being just longer than the length of the pivot arm. An
important constraint for this design is minimizing the air gap between the permanent
magnets and the coil. The rotor assembly consists of the central rotor (A), pivoting rotor
arms (B), and permanent magnets (C). The stator shows the housing (D), piezoelectric
array (E), coils (F), and magnetic brake (G).

144
Figure 59: Pivoting rotor assembly and exploded stator assembly.
Protecting the system in higher winds will be an important function for a
successful system. Increasing the density of winding in the coil puts more torque back
into the system, which slows the rotor down. The proposed design has coils increasing in
density as they move up the bowl to both increase the power output of the generator, and
to protect it at higher speeds. Finally, the system may include a magnetic brake at the top
of the bowl; instead of using a permanent magnet, the system would have an electrical
switch that sends current through the top coils, creating its own magnetic field. Figure 60
shows a solid model of the vision for the hybrid system with variable rotor inertia.

145
Figure 60: Wind energy harvester with variable rotor inertia.
The shell has been made transparent so the details are visible. The turbine fin in
this design is helically shaped to take advantage of the omni-directional characteristics,
and for better turbulent flow characteristics. The system's main components would be
molded from plastic, with built-in alignment features for the piezoelectric strips and the
coils. This will ensure proper alignment and minimize the air gap between the coil and
rotating magnet. This system uses four piezoelectric strips, but these could be increased
for increased production.
The final system component for the design is a method to attach it to the bridge.
Height is going to be of paramount importance; the height should be easily tuned in the
field so that it can be set properly. In the concept shown in Figure 61, bolts are used to

146
clamp two halves together hold the bowl casing and clamp to the cross frame. The height
is adjustable in two phases. First, major height adjustments are made in the clamping
location. Minor adjustments can be made using shims of different thicknesses placed
between the casing and the attaching system. Figure 61 shows the completed system
mounted to the cross frame of an I-girder bridge. The top has been removed to show the
inner systems; normally the concept is closed to protect the inner components from
animals and weather. Additionally, molded into the system will be a whistle system to
help deter animals; the whistle will have a frequency outside the human hearing range.
Figure 61: Concept mounted to cross frame on the bridge structure.

147
Developing an analytical model of this system will be very important to get the
proper characteristics. Determining the proper mass for the governor is vital for the
system to be effective. Extensive research determining the relationship between the
magnetic field and induced current needs to be conducted to optimize the output. Finally,
tolerances will be very important; the piezoelectric transducers will need to be aligned
properly and the air gap between the coil and magnets need to be minimized.
Wind harvesting for the bridge application is a promising method to power the
health monitoring system. The system developed in this research demonstrates that off-
the-shelf components can be used to create a system that captures energy and charges the
storage media. The system can now be refined to increase efficiency and optimize
energy harvesting.

148
Chapter 6: Conclusions and Future Work
6.1 OBJECTIVES
The thesis set out several stated objectives to give boundaries to the scope of the
project and research. For convenience, the five objectives from Chapter 1 are listed again
below.
1. Review the previous art and literature, and evaluate the effectiveness of these to
provide innovative avenues.
2. Use ideation and concept generation techniques to develop a plethora of concepts
to potentially be implemented.
3. Use design modeling to develop an understanding of the important parameters,
constraints, and design variables to be used during implementation.
4. Use the previous work in prototype development, and validate previous modeling
using experimentation.
5. Draw conclusions about the consequences, ramifications, and opportunities of
wind energy harvesting, and to discuss potential future research in the area.
The first objective was to review the current literature to evaluate the state of the
art and gain insights into areas to focus innovative thinking. Scholarly journals, technical
books, thesis and dissertations, and patents are just some of the resources searched for
applicable literature. Each had different impacts on the research.
Scholarly papers were integral in gaining a technical background necessary for
understanding and designing a wind harvesting system. In addition to understanding the
effects of different aspects of a wind harvest system, technology options were discovered

149
allowing the focus to be on solving the problem instead of developing new technology.
Advancing a technology often means building upon the foundation that others have laid
for us. Analyzing the previous research to learn how previous scholars have come to
conclusions helped mold the method, modeling, and experimentation conducted in this
thesis. Technical monographs gave the assumptions and equations necessary to begin
modeling the system. These resources proved invaluable in developing an analytical
model to be used when determining the parameters for different elements of the system,
and finally in selecting components.
Patents provided insights into what has been thought of, but possibly not ever
done before. In addition to being very detailed, patents are often filed by experts in the
field who are prepared to push the envelope. Adopting this attitude, and using the
information for inspiration helped the creativity of the project. The very nature of patents
forces anyone with a new idea to explore avenues of innovation. Large companies have
used patents to protect their intellectual property, and often "bracket" patents to prevent
improvements (Bagley & Dauchy, 1998). Some may see this strategy as self-centered
and hindering to inventors. However, this strategy merely challenges the inventor to be
innovative because the inventor is forced to develop something truly unique and novel.
The second objective was to begin the innovation process: coming up with ideas
and documenting them. Using concept generation tools a large quantity of ideas was
produced, ranging from the improbable to the obvious. Among these there are many new
ideas, and more importantly many creative ideas. While a new idea may be original, to
be creative it "must have some measure of relevance; it must be valuable" (Johansson,
2006). The value for these ideas is the potential for development in a bridge application.
The concept variants shown range in complexity and functionality.

150
Models for the system were developed at several levels to predict performance
and choose parameter values. The first preliminary model, shown in Chapter 1, began
the assemblage of parameters involved in wind harvesting. The optimization code and
simulation were a valuable case study that began the investigation of designing a wind
turbine for a bridge application. More detailed models were created as more information
became available, and now a scalable model exists that provides anticipated output power
and simulated performance under random wind input. This model is set up to aid in
continued development of wind harvesting for a low power application. In addition, the
modeling was fundamental in becoming intimately familiar with the details of the system.
Every equation and parameter was studied to create a better and more accurate model; the
intimacy was transferred as the parameters become tangible in the form of physical
components.
The fourth objective was to build a proof-of-concept model to verify the previous
work and modeling, and to begin the development of a field wind harvester to be used in
a bridge environment. The proof-of-concept model utilized some of the concepts
generated, and parameters from the model were identified and tested in the laboratory.
These tests confirmed some of the assumptions made during the design process, and gave
insights into adjustments to be made in future iterations. Finally, the proof-of-concept
model provided a means to validate the initial analytical model and increase the accuracy
of the model.
The final objective was to draw conclusions about the consequences,
ramifications, and opportunities of wind harvesting, which is done in this chapter. Lastly,
discussing the future research and work for energy harvesting follows. Wind harvesting
has been shown to be capable of powering the node transmitter; with enough storage for
an hour of operation, the transmitter can be operated in the router mode. Less storage is

151
likely sufficient; however, with the unreliability of wind, an hour of storage will prevent
system failure due to low wind. The variability of wind is reflected in the simulation
discussed in Chapter 5, and was in estimating the charging time of the capacitors. The
analytical model was constructed such that it can be used to scale the system
appropriately to power alternatives to the transmitter. For instance, the requirements to
power the gateway were assessed by using parameter values for a larger generator and
turbine. Figure 62 shows the simulated output from three different generators available
off the shelf; the y-axis shows power in Watts in this scenario because the gateway
requires an order of magnitude more power than the node. The speed constant and torque
constant are the variable specifications given for the motors. Three generators are shows,
red and green dots, and the dotted blue line, representing three motors with a 250 Watt
power rating and differing torque and speed constants (47.5, 201; 127, 75.4; 253, 37.3).
The generators produce similar power outputs, so it is concluded that the constants are
inversely coupled.

152
Figure 62: Comparison of power output to large generators. Next, the swept area is modified to further increase the power output. After
multiple brief simulations, a turbine size and motor is chosen. A simulation model was
conducted using the parameters from one of the generators discussed previously, and an
increased swept area: fin height of 20 cm, and a radial length of 200 cm. The power
versus wind speed of this simulation using these parameters can be seen in Figure 63.

153
Figure 63: Large generator with increased swept area.
This combination of parameters generates the necessary 10 Watts just above the
average wind speed. The simulated design uses a 250 watt motor from Maxon Motors,
Inc., with a turbine fin swept area of 0.4 m2, and 8 F supercapactior. The random wind
simulation is run using these design parameters to show the time to charge the
supercapacitor to 72 C to provide 24 V to the gateway. Figure 64 shows the results of the
simulation, giving a charge time of approximately 20 minutes.

154
Figure 64: Simulation of a wind harvester large enough to power a gateway.
The work here shows the great potential of wind energy harvesting for monitoring
the health of infrastructure. By utilizing the available in situ energy, these systems can
increase their lifespan, decrease maintenance costs, minimize installation costs, and
decrease the environmental impact. The lifespan of a monitoring system would normally
be limited by battery technology. By harvesting energy, the system will be limited by the
components instead. Replacing the batteries on a system is seen as one of the most
intensive maintenance costs. Harvesting energy mitigates this system requirement, thus
making the system more cost effective and an attractive alternative to the visual
inspection methods currently used. In addition, minimizing the wiring reduces the
installation cost. If the system was going to be powered using batteries, then to minimize

155
battery maintenance, a central battery would be used, requiring wires to run from there to
the nodes and sensors. With energy harvesting, each system is autonomous from the
central site, greatly reducing the required wiring. Finally, reducing the use of batteries
decreases the negative environmental effects of the system from the manufacture of the
batteries (Czyzewski, 2011).
This system will be significantly more expensive than the proof-of-concept model
constructed for the router. However, the significantly increased power requirements of
the gateway may need to be taken into account in the future, and a different cost schedule
used. The suggested cost of systems is more logically applied dependent upon the
distribution and quantity of harvesters required.
The proof-of-concept model brings several innovative aspects to the wireless
health-monitoring network, and wind energy harvesting. First, the wind harvester is
designed to attach to the bridge at a midpoint between the girders where the maximum
laminar wind will be. The height is adjustable to multiple heights so the system is
capable of being used on multiple structures. Locking clamps give secure and simple
installation on the cross frames of the bridges, decreasing set up costs. Tuning the height
also gives the installer the freedom to maximize any ducting the girders cause.
Second, unique turbine fin shapes are used to cope with the wind conditions found
under the bridge amongst the girders. There is minimal vertical penetration up in the
girders; the wind turbine blades have a minor vertical dimension, and a major radial
dimension to maximize the available wind without having any part of the system below
the bottom flange of the girder. An omni-directional vertical axis wind turbine is used to
minimize the effects of changes in flow direction.
Lastly, combining two transducers, one to operate at low wind speeds and one to
operate at high wind speeds, gives the proof-of-concept model increased ability to

156
capture energy. At low wind speeds when the generator is incapable of producing
electricity, the striking arm deforms the piezoelectric strip. The next prototype will
include additional strips and striking arms to increase the energy capture. At higher
speeds, the generator is engaged because it more efficiently converts the wind energy to
electricity. A mechanical switch will control the engagement of the generator based on
the rotor's rotational speed. When the generator is engaged, the piezoelectric strip will be
disengaged to protect the material.
Now that the objectives for this research are completed, a new set needs to be
formed to guide the next phase of research on the project. New objectives are listed
following the discussion about the future research in the next section.
6.2 FUTURE RESEARCH
The larger project has a structured time frame for completed tasks, and future
research must address these items first. The most immediate milestone involving energy
harvesting is the fabrication of a field testable prototype. The alpha prototype is expected
to power the transmitter during operation over an extended time frame on location. The
second milestone is a beta prototype to be developed from the alpha testing to further
advance the capabilities of the system. To get from the current model to these goals
several actions must be taken, which are laid out in more detail below.
The first and most restricting step to be completed before the system is field ready
is the development of electrical rectifying, conditioning, and storage subsystems.
Determining the time in the lab to charge a capacitor, supercapacitor, battery, or some
combination must be completed to validate the charging model already presented. In

157
addition, this will give the approximate capabilities to build up enough storage to power
the field experimentation. Using a hybrid conglomerate of storage devices during testing
would be valuable to assess the best option for the bridge application given the life,
required duty cycles, and limitations of the currently available technology.
Second, a protective cover for the frame must be added to the prototype before it
is deployed into the field. Again, the field test should be used as an opportunity to test
the effectiveness of different materials in protecting the harvester from the elements and
bridge environment. The initial design has plastic panels protecting the outer surfaces of
the frame; alternative materials used in similar applications should be investigated and
analyzed for cost and weight characteristics. Similarly, the attachment points need to be
added to the frame. Preliminary designs have been presented, but more attention needs to
be given to these components.
The first field deployment should also be used to validate as many design
decisions as possible. For example, an assumption was made about the best turbine fin
design for the first proof of concept. The literature suggested the Savonius fin
architecture as best due to its ability to self-start, omni-directional nature, and stability in
varying and turbulent wind. The bridge environment is different from those found in the
research; future testing of the effectiveness of different wind turbine fin architectures on a
bridge will expand the insights, validate the design decision, give effective alternatives,
and uncover their advantages and disadvantages. Additionally, the use of hybrid designs
may lead to an even more optimized system for the bridge scenario while expanding the
applications of the wind harvester. The defined selection for fin architecture should be

158
made and supported by the research and alpha field experimentation before the beta
prototype is implemented.
Below is a concise list of recommended objectives to be pursued in future
research of wind harvesting for the bridge sensor network:
1. Review the available electrical storage technologies, and evaluate the best options
for the bridge application. Develop the electrical storage for the wind harvester,
and demonstrate the harvester's capabilities for powering the transmitting node in
the lab.
2. Use ideation and concept generation techniques to develop an innovative
attaching mechanism to be used on the bridge.
3. Test and validate the turbine fin design. Test alternative fin designs in the field to
determine to most effective turbine fin architecture.
4. Use the previous work to develop a field prototype, and compare to the analytical
model.
5. Draw conclusions about the consequences, ramifications, and opportunities for
development of a second-generation field prototype.
Figure 65 shows a hidden line rendering of the next generation wind harvester.
This harvester will have a mechanical switch to engage the generator when wind speeds
reach 3 m/s. It will have multiple striking arms to increase the power contributions of the
piezoelectric at low wind speeds. It will also disengage these striking arms when the
generator is engaged to protect the piezoelectric strip. A protective outer housing will
surround the frame to protect the rotor and internal components. Finally, a second

159
housing will contain the conditioning, rectifying, storage electrical components, and the
electrical leads of the generator.
Figure 65: Wireframe for the next generation wind harvester. The frame is removed in Figure 66 to give a clearer view of the components, and
how they interact. Four striking arms are used on the rotor to increase the power
generated by the piezoelectric strip. The rotor is shown entering one side of the
mechanical switch (green), and the generator enters the generator bushing (red). The
generator bushing is keyed where the generator enters it; additionally the generator

160
bushing has a setscrew to better secure it to the generator. Figure 66 also shows a close
up exploded view of the mechanical switch subsystem. The mechanical switch is made
of two bushings contained in a housing (blue). At higher speeds, the clutch arms
(yellow) engage the generator bushing; the arms rotate away from the center at higher
speeds due to inertia.
Figure 66: Close up of wind harvesting components and exploded view of mechanical switch.
6.3 FUTURE WORK
The future research is laid out in the previous section; here is a look at the larger
future of energy harvesting based on the opinions developed during the process of writing
this thesis. While opinions are not typically included in research or technical papers, here
is an opportunity to briefly share the other thoughts about the subjects that are studied.

161
The opinions are broken into three categories: idea communication, attitude, and
development.
Communication is considered the key to continuing the progress of energy
harvesting and developing alternative energy. There are two main facets to
communicating when discussing energy harvesting. First, there is the communication
among the population of energy harvesting designers and developers. Second, is the
communication between the technical people of energy harvesting and the public. The
technical community communicates through publishing papers, personal contacts, and the
acquisition of intellectual property through corporate transactions. As the community
grows, communication via these avenues is becoming increasingly difficult largely due to
sheer volume (Harper, 2010). Methods for communicating are more numerous than they
have ever been in history, which makes it more likely that the available information will
be overwhelming. In addition, it has become more difficult to sift through the research
that lacks value to find the research that is valid.
The first stage in increasing valuable communication is creating an environment
of open knowledge. An important aspect of this open information society is bringing
together people with different backgrounds, expertise, and goals with minds open to new
ways to accomplish their goals. When these people come together they form an
intersection, and from this intersection, known as the "Medici Effect", comes innovative
ideas (Johansson, 2006). Johansson summarizes the following characteristics of
intersectional innovations: they are surprising and fascinating, take leaps in new
directions, open up new fields, create a space for the innovators, generate followers,

162
provide a source of directional innovation, and can affect the world in unprecedented
ways. All these characteristics are important to the future of energy harvesting.
The second stage in this valuable communication environment is giving
innovators the tools and information available, and setting them loose. An intriguing way
to accomplish this is set out by von Hippel in "Democratizing Innovation". Instead of
multiple users with similar needs investing and developing similar innovations, the
original innovator diffuses their information to everyone by freely revealing what they
have developed for all to examine, imitate, or modify to add value to society (von Hippel,
2005). This goes against typical intellectual property attitudes and business models
which bottle up the information in patents, preventing others from using it without the
permission from an assignee. This limits the resources of society because an innovator
can often take an idea and apply it effectively to new problems, so making this
information available to them is vital to maximizing the productive development. The
access to patents creates the intersection where innovation occurs without the parties
being physically near each other.
The final communication that will help the development of energy harvesting is
by getting it into more people's lives. A technology's use can be divided into five
psychograpic groups: Innovators, Early Adopters, Early Majority, Late Majority, and
Laggards (Moore, 2002). There is a gap between psychograpic groups, a dissociation
that prevents new groups from accepting new technology if it is presented in the same
way as it was to the previous groups (Moore, 2002). The Innovators and Early Adopters
represent a small portion of the population; currently, energy harvesting is being used by

163
these groups. The Early Majority is driven by a strong sense of practicality, and is
content to wait and see how other people benefit before investing in the technology.
They represent roughly one-third of the whole adoption life-cycle, so getting to this group
is important to the success of energy harvesting.
Energy harvesting needs Malcolm Gladwell's Connectors, Mavens, and Salesmen.
Connectors are able to introduce the right people to each other; given a person with a
need, a Connector can find a qualified person to meet that need. Mavens connect a
person with a question to the information they need to answer that question. A Maven is
motivated to educate and help, but a Salesmen persuades (Gladwell, 2002). Energy
harvesting needs to be put into the hands of Connectors, Mavens, and Salesmen to tip an
epidemic of energy harvesting adoption. The people will cross the chasm between
psychographic groups, getting harvesting technology into the early majority (Moore,
2002). As the epidemic grows, demand rises. Adoption of the technology becomes a
matter of letting our capitalist system work. These communication steps are vital to the
future work of energy harvesting, but an attitude shift is also paramount.
First world societies need a greater awareness of the sheer volume of waste
produced by society, and the effect that has on unrelated groups. Scientists have
identified five floating islands, composed mostly of plastic, one of which is roughly the
size of Texas and doubling in size every decade (Hoshaw, 2009). Researchers at the
University of Plymouth are finding plastic pellets in beaches throughout the world,
including ones that do not have a plastic factory anywhere nearby (Weisman, 2007). The
Not In My Back Yard (NIMBY) attitude is hindering the solution to the problem. First,

164
we need to stop being so naive in thinking that there are not far (distance) reaching
effects of our lifestyle. When processes are local to the end user, the user begins to
demand sustainability (McDonough & Braungart, 2002). The problem then becomes
understanding how changing attitudes about energy harvesting relates to making
processes local?
The process is electricity generation, and a way to change attitudes is by finding
applications that put this technology visibly into the hands of the citizens where they can
directly benefit from it. The citizenry worry extensively about oil because they physically
put it in their cars. They have an intimate relationship with oil and its constituents;
alternative energy should share this kind of exposure on a larger scale. Developing
smaller power output applications is important to changing this problem. Storage
becomes a very important aspect of this project because it is a current hindrance to
widespread adoption. The grid is not set up currently to accept input energy from a wide
network of producers. There is talk of a "smart grid", but no significant implementation
has occurred; a large wide spread smart gird is years if not decades away. Curtailing the
energy loads individually by harvesting and storing energy at the individual level to be
used for some of the low power applications at the source is a quicker step to increasing
usage and exposure to the public.
To develop wind energy harvesting new applications need to be identified,
applications where the private sector is involved and educated about wind turbines.
Examples of installations on a private level include outdoor lighting, especially motion
sensor lights that are only on for a short period of time, monitoring systems, and helping

165
curtail phantom loads (electricity drawn by devices when they are off). Wind turbines
could amplify wireless signals within a building or home. Finally, lighting for streets and
traffic should have more wind energy harvesting.
Further in the future, portable wind turbines can be used to charge electric
scooters, where the turbine is set up when the scooter is parked for extended periods of
time, and runs the motor in reverse to store power in the battery. The existing electronic
charging devices are ineffective. This is another significant issue with the term "green
energy" because advertisers use the current trend to falsely promote their products.
Another very effective way of changing attitudes is by introducing energy
harvesting to younger generations through education. This project has shown the use of
motors as generators is effective, and gives an opportunity to begin studying energy
harvesting in a classroom setting by reclaiming broken electromechanical devices and
reusing their components, specifically motors, for energy harvesting. This sort of
reclamation is exceptionally implementable because the reclaimed devices can likely be
donated. This would be valuable for educating future generations about harvesting
energy, reusing materials, and designing engineered products. In addition, the earlier
and younger people are when they are exposed to energy harvesting technology, the more
they will be willing to adopt its uses.
6.4 CONCLUDING REMARKS
The project has wonderful goals, and provides a great platform to make an impact
on the world. Monitoring the health of bridges helps protect the lives of people who use

166
bridges and secures the investment of building and maintaining bridges. However, that is
not the only outcome of the project. In addition, the bridge project represents a problem
that pushes technology to its boundaries, and pushes the engineer to set a new bar by
developing the technology. Personally, it serves as a valuable educational tool and a
purpose to push me to new levels of design and expand my engineering capabilities.
Monitoring the health of our infrastructure has become essential to the continued
success of our nation. Processing capabilities have increased to a stage that we can
accurately predict much better how a structure will behave. However, we must know the
condition of the structure to do this. Health monitoring has great potential to give us the
capability of maximizing the life and safety of our infrastructure, and to be more efficient
about allocating money for construction, care, and replacement of infrastructure.
Research into energy harvesting must continue. Applications such as bridge
health monitoring are vital to the development of alternative energy capture because they
provide an environment where the limits can be tested, pushed, and expanded. It also
demonstrates what can be done. If energy harvesting is possible in an extreme
environment such as a bridge for 10 years without maintenance, then someone's home
appears to be a much less challenging application. It becomes a matter of putting in the
effort to change our habits, and working harder to be more diverse. Additionally, the
health monitoring application shows how a portfolio of harvesting systems can work
together to produce power from many different sources. There is not going to be one
single replacement for fossil fuels. It is going to be a diverse network of harvesting from
many sources on many levels working in symbiosis that is capable of finally unseating

167
fossil fuels from the energy throne. Fossil fuels have become an oligarchy of a symbolic
energy government, a set of dictators dominating the energy society. As in prior human
history, that power needs to shift away from the minority and towards the majority. The
uncertainty in the environmental impact of fossil fuels will likely not be proved in time to
curtail its effects. However, even if our stance puts us on the side that the global climate
change is natural, we should still be able to respect that there is no harm in us
contributing as little pollution as possible. A better balance of energy acquisition will
accomplish better use of the resources available.

168
Appendix A: Betz's Maximum Efficiency Derivation
The theoretical maximum for a wind turbine is approximately 59%. The maximum
efficiency is calculated using conservation of energy and conservation of mass. Conservation of
energy assumes an ideal turbine with no aerodynamic losses. Finally, the mass flow through the
turbine area is assumed to be the average of the wind flow before and the wind flow after the
turbine. The following offers the full derivation for reference (Khaligh & Onar, 2010).
Conservation of Energy:
Mass flow:
Substituting (2) into (1) and dividing by a time (here, an assumed time duration of
1 second for simplicity) gives an equation for power, (3):
Extracted -

169
Available -
Comparison of Extracted Power to Available Power:
Finding the Max-Min:
Setting (5) equal to zero gives roots of 1/3 and -1. Plugging these values back
into the extracted power ratio (4) results in P/P0 = 59.2%. Plotting (4) for v2/v1 = [0 1]
gives the theoretical output for different wind speed ratios, and can be seen below in
Figure 67.

170
Figure 67: Power ratio as a function of wind speed ratio.

171
Appendix B: Data Analysis Code
Protodata.m clear all close all %---------------------> PIEZO, UNCOUPLED <----------------- %---------------------------------------------------------- F = csvread('Piezo - High 2.csv'); %Piezo, 10.62 E = csvread('Piezo - Med 2.csv'); %Piezo, uncoupled, 8.33 D = csvread('Piezo - Low2.csv'); %Piezo, uncoupled, 6.73 C = csvread('Piezo - High.csv'); %Piezo, uncoupled, 6.39 B = csvread('Piezo - Med.csv'); %Piezo, uncoupled, 3.31 A = csvread('Piezo - Low.csv'); %Piezo, uncoupled, 4.17 %---------> Converting to Average Wind Speed [mph]<-------- winddata(:,1) = A(:,1); winddata(:,2) = A(:,5); winddata(:,3) = B(:,5); winddata(:,4) = C(:,5); winddata(:,5) = D(:,5); winddata(:,6) = E(:,5); winddata(:,7) = F(:,5); %---------------------------------------------------------- %-------------------> Power Levels [mWatts]<--------------- Power(:,1) = A(:,1); Power(:,2) = A(:,4); Power(:,3) = B(:,4); Power(:,4) = C(:,4); Power(:,5) = D(:,4); Power(:,6) = E(:,4); Power(:,7) = F(:,4); [windspeed, avewind] = WIND2(winddata); %---------------------------------------------------------- %---------------------> Energy [mJ] <---------------------- %d = A(2,1) - A(1,1); for p = 1:length(avewind) AvePow(p,1) = mean(Power(:,p+1)); end

172
for p = 1:length(avewind) Energy(p,1) = trapz(Power(:,p+1)); end %---------------------> PIEZO, COUPLED <------------------- %---------------------------------------------------------- Fc = csvread('Piezo - Generator - High.csv'); %Piezo, coupled, 5'3" Ec = csvread('Piezo - Generator - Med.csv'); %Piezo, coupled, 5'3" C1 = csvread('Cor1.csv'); C2 = csvread('Cor2.csv'); C3 = csvread('Cor3.csv'); C4 = csvread('Cor4.csv'); C5 = csvread('Cor5.csv'); C6 = csvread('Cor6.csv'); C7 = csvread('Cor7.csv'); C8 = csvread('Cor8.csv'); C9 = csvread('Cor9.csv'); %--------> Converting to Average Wind Speed [mph]<--------- winddatac(:,1) = Ec(:,1); winddatac(:,2) = Ec(:,5); winddatac(:,3) = Fc(:,5); winddatac(:,4) = abs(C1(:,2)); winddatac(:,5) = abs(C2(:,2)); winddatac(:,6) = abs(C3(:,2)); winddatac(:,7) = abs(C4(:,2)); winddatac(:,8) = abs(C5(:,2)); winddatac(:,9) = abs(C6(:,2)); winddatac(:,10) = abs(C7(:,2)); winddatac(:,11) = abs(C8(:,2)); winddatac(:,12) = abs(C9(:,2)); %---------------------------------------------------------- %-------------------> Power Levels [mWatts]<--------------- Powerc(:,1) = Ec(:,1); Powerc(:,2) = Ec(:,4); Powerc(:,3) = Fc(:,4); Powerc(:,4) = C1(:,5); Powerc(:,5) = C2(:,5); Powerc(:,6) = C3(:,5); Powerc(:,7) = C4(:,5); Powerc(:,8) = C5(:,5);

173
Powerc(:,9) = C6(:,5); Powerc(:,10) = C7(:,5); Powerc(:,11) = C8(:,5); Powerc(:,12) = C9(:,5); [CC, DD] = size(Powerc); [windspeedc, avewindc] = WIND2(winddatac); for q = 1:6 avePower(1,q) = mean(Power(:,q+1)); end for q2 = 1:DD-1 avePowerc(1,q2) = mean(Powerc(:,q2+1)); end %---------------------------------------------------------- %---------------------> Energy [mJ] <---------------------- %d = A(2,1) - A(1,1); for p = 1:length(avewindc) AvePowc(p,1) = mean(Powerc(:,p+1)); end for p = 1:length(avewindc) Energyc(p,1) = trapz(Powerc(:,p+1)); end %---------------------> GENERATOR, UNCOUPLED <------------- %---------------------------------------------------------- J = csvread('Generator-High.csv'); %Generator, uncoupled, 2' I = csvread('Generartor-High.csv'); %Generator, uncoupled, 3'9" H = csvread('Generator - Med.csv'); %Generator, uncoupled, 3'9" R1 = csvread('Generator - Rec1.csv'); R2 = csvread('Generator - Rec2.csv'); R3 = csvread('Generator - Rec3.csv'); R4 = csvread('Generator - Rec4.csv'); R5 = csvread('Generator - Rec5.csv'); R6 = csvread('Generator - Rec6.csv'); R7 = csvread('Generator - Rec7.csv'); R8 = csvread('Generator - Rec8.csv'); R9 = csvread('Generator - Rec9.csv'); R10 = csvread('Generator - Rec10.csv');

174
R11 = csvread('Generator - Rec11.csv'); R12 = csvread('Generator - Rec12.csv'); R13 = csvread('Generator - Rec13.csv'); R14 = csvread('Generator - Rec14.csv'); %--------> Converting to Average Wind Speed [mph]<--------- winddatag(:,1) = H(:,1); winddatag(:,2) = H(:,5); winddatag(:,3) = I(:,5); winddatag(:,4) = J(:,5); winddatag(:,5) = R1(:,5); winddatag(:,6) = R2(:,5); winddatag(:,7) = R3(:,5); winddatag(:,8) = R4(:,5); winddatag(:,9) = R5(:,5); winddatag(:,10) = R6(:,5); winddatag(:,11) = R7(:,5); winddatag(:,12) = R8(:,5); winddatag(:,13) = R9(:,5); winddatag(:,14) = R10(:,5); winddatag(:,15) = R11(:,5); winddatag(:,16) = R12(:,5); winddatag(:,17) = R13(:,5); winddatag(:,18) = R14(:,5); %---------------------------------------------------------- %-------------------> Power Levels [mWatts]<--------------- Powerg(:,1) = H(:,1); Powerg(:,2) = H(:,4); Powerg(:,3) = I(:,4); Powerg(:,4) = J(:,4); Powerg(:,5) = R1(:,4); Powerg(:,6) = R2(:,4); Powerg(:,7) = R3(:,4); Powerg(:,8) = R4(:,4); Powerg(:,9) = R5(:,4); Powerg(:,10) = R6(:,4); Powerg(:,11) = R7(:,4); Powerg(:,12) = R8(:,4); Powerg(:,13) = R9(:,4); Powerg(:,14) = R10(:,4); Powerg(:,15) = R11(:,4); Powerg(:,16) = R12(:,4); Powerg(:,17) = R13(:,4); Powerg(:,18) = R14(:,4);

175
[windspeedg, avewindg] = WIND2(winddatag); %---------------------------------------------------------- %---------------------> Energy [mJ] <---------------------- %d = A(2,1) - A(1,1); for p = 1:length(avewindg) AvePowg(p,1) = mean(Powerg(:,p+1)); end for p = 1:length(avewindg) Energyg(p,1) = trapz(Powerg(:,p+1)); end %---------------------------------------------------------- %--------------------------> csvwrite <-------------------- [aa,bb] = size(winddatag); [cc,dd] = size(Powerg); [ee,ff] = size(winddatac); [gg,hh] = size(Powerc); [ii,jj] = size(winddata); [kk,ll] = size(Power); csvwrite('ProtoPowerw.csv', winddata); csvwrite('ProtoPowerp.csv', Power); csvwrite('ProtoPowerwg.csv', winddatag); csvwrite('ProtoPowerpg.csv', Powerg); csvwrite('ProtoPowerwc.csv', winddatac); csvwrite('ProtoPowerpc.csv', Powerc); [ae, be] = size(avewind); [ce, de] = size(Energy); [fe, ge] = size(avewindc); [he, ie] = size(Energyc); csvwrite('ProtoEnergyAveWind.csv', avewind'); csvwrite('ProtoEnergyEnergy.csv', Energy, 0, be); csvwrite('ProtoEnergyAveWindC.csv', avewindg', 0, be+de); csvwrite('ProtoEnergyEnergyC.csv', Energyg, 0, be+de+ge); %---------------------------------------------------------- %--------------------------> Figures <--------------------- [o,p] = size(Power); [oc,pc] = size(Powerc); RPM = zeros(1,pc-1); for j = 2:p k = 1; while k <= o

176
if abs(Power(k,j)) > .0015 RPM(j-1) = RPM(j-1) + 1; k = k + 100; else k = k + 1; end end end RPM = RPM*6; %The rotor's revolutions/min RPMc = zeros(1,pc-1); for j = 2:pc kc = 1; while kc <= oc if abs(Powerc(kc,j)) > .0015 RPMc(j-1) = RPMc(j-1) + 1; kc = kc + 100; else kc = kc + 1; end end end RPMc = RPMc*6; %----------------------------------------------------------%--------------------------> Figures <--------------------- figure(1) plot(avewind, AvePow, '.', 'MarkerSize', 15) hold on plot(avewindg, AvePowg, 'r.', 'MarkerSize', 15) plot(avewindc, AvePowc, 'g.', 'MarkerSize', 15) title('Measured Average Power') xlabel('Wind Speed [mph]') ylabel('Average Power [mWatts]') figure(2) subplot(2,3,1) plot(Power(:,1), Power(:,5)) title('Wind Speed ~6.7') ylabel('Power [mWatt]') subplot(2,3,2) plot(Power(:,1), Power(:,6)); title('Wind Speed ~8.3')

177
xlabel('time [sec]') subplot(2,3,3) plot(Power(:,1), Power(:,7)); title('Wind Speed ~10.6') subplot(2,3,4) plot(Powerc(:,1), Powerc(:,3), 'g'); title('Wind Speed ~6.68') ylabel('Power [mWatt]') subplot(2,3,5) plot(Powerc(:,1), Powerc(:,2), 'g'); title('Wind Speed ~8.9') xlabel('time [sec]') subplot(2,3,6) plot(Powerc(:,1), Powerc(:,8), 'g'); title('Wind Speed ~11.27') legend('Uncoupled', 'Coupled') figure(3) plot(avewind, Energy, '.', 'MarkerSize', 15) hold on plot(avewindc(1,1:2), Energyc(1:2,1), 'g.', 'MarkerSize', 15) plot(avewindc(1,3:11), Energyc(3:11,1), 'r.', 'MarkerSize', 15) title('Energy vs. Wind Speed') xlabel('Wind Speed [mph]') ylabel('Energy [mJ]') legend('Uncoupled', 'Coupled, No Load', 'Coupled, Elec Load') figure(4) plot(avewindg, Energyg, 'r.', 'MarkerSize', 15) hold on plot(avewind, Energy, '.', 'MarkerSize', 15) title('Energy vs. Wind Speed') xlabel('Wind Speed [mph]') ylabel('Energy [mJ]') legend('Generator', 'Uncoupled Piezo', 'Location', 'Best') figure(5) subplot(3,1,1) plot(Powerg(:,1), Powerg(:,2), 'r');

178
title('Power @ ~6 mph') xlabel('time [sec]') ylabel('Power [mWatt]') subplot(3,1,2) plot(Powerg(:,1), Powerg(:,3), 'r'); title('Power @ ~11 mph') xlabel('time [sec]') ylabel('Power [mWatt]') subplot(3,1,3) plot(Powerg(:,1), Powerg(:,4), 'r'); title('Power @ ~13 mph') xlabel('time [sec]') ylabel('Power [mWatt]') time = Power(:,1); for r = 1:17 P(:,r) = Powerg(:,r+1); end figure(6) subplot(2,1,1) plot(R2(:,1), R2(:,2), 'r') xlabel('Time [sec]') ylabel('Voltage [Volts]') title('Generator Signature') subplot(2,1,2) plot(F(:,1), F(:,2)) xlabel('Time [sec]') ylabel('Voltage [Volts]') title('Piezoelectric Signature')

179
WIND2.m function [windspeed, avewind] = WIND2(winddata) [m, n] = size(winddata); for l = 2:n j = 1; for i = 1:(m-1) if (winddata(i,l) > .05 && winddata(i+1,l) < .001) T(j,l-1) = winddata(i,1); j=j+1; end end end for h = 1:(n-1) for k = 1:(length(T)-1) if (T(k+1,h) && T(k,h) ~= 0) windspeed(k, h) = ((T(k+1,h)-T(k,h))^-1)*2.5; end end end for n = 1:(n-1) for o = 1:length(windspeed) if(windspeed(o,n) ~= 0) wd(o) = windspeed(o,n); end end avewind(1,n) = mean(wd); end

180
Appendix C: Damping Calculation Code
CalcB.m clear all close all %---------------------> PIEZO, UNCOUPLED <--------------------------------- %-------------------------------------------------------------------------- F = csvread('Piezo - High 2.csv'); %Piezo, 10.62 E = csvread('Piezo - Med 2.csv'); %Piezo, uncoupled, 8.33 D = csvread('Piezo - Low2.csv'); %Piezo, uncoupled, 6.73 C = csvread('Piezo - High.csv'); %Piezo, uncoupled, 6.39 B = csvread('Piezo - Med.csv'); %Piezo, uncoupled, 3.31 A = csvread('Piezo - Low.csv'); %Piezo, uncoupled, 4.17 %------------------> Converting to Average Wind Speed [mph]<--------------- winddata(:,1) = A(:,1); winddata(:,2) = A(:,5); winddata(:,3) = B(:,5); winddata(:,4) = C(:,5); winddata(:,5) = D(:,5); winddata(:,6) = E(:,5); winddata(:,7) = F(:,5); Power(:,1) = A(:,1); Power(:,2) = A(:,4); Power(:,3) = B(:,4); Power(:,4) = C(:,4); Power(:,5) = D(:,4); Power(:,6) = E(:,4); Power(:,7) = F(:,4); [windspeed, avewind] = WIND2(winddata); [o,p] = size(Power); RPM = zeros(1,p-1); %Determining the revolutions during data acquisition. for j = 2:p k = 1; while k <= o

181
if abs(Power(k,j)) > .0015 RPM(j-1) = RPM(j-1) + 1; k = k + 100; else k = k + 1; end end end RPM = RPM*6; %The rotor's revolutions/min radpsec = RPM*60/2/pi; B = [avewind', radpsec']; csvwrite('CalcB.csv',B); %---------------------> PIEZO, COUPLED <--------------------------------- %-------------------------------------------------------------------------- Fc = csvread('Piezo - Generator - High.csv'); %Piezo, coupled, 5'3" Ec = csvread('Piezo - Generator - Med.csv'); %Piezo, coupled, 5'3" C1 = csvread('Cor1.csv'); C2 = csvread('Cor2.csv'); C3 = csvread('Cor3.csv'); C4 = csvread('Cor4.csv'); C5 = csvread('Cor5.csv'); C6 = csvread('Cor6.csv'); C7 = csvread('Cor7.csv'); C8 = csvread('Cor8.csv'); C9 = csvread('Cor9.csv'); winddatac(:,1) = Ec(:,1); winddatac(:,2) = Ec(:,5); winddatac(:,3) = Fc(:,5); winddatac(:,4) = abs(C1(:,2)); winddatac(:,5) = abs(C2(:,2)); winddatac(:,6) = abs(C3(:,2)); winddatac(:,7) = abs(C4(:,2)); winddatac(:,8) = abs(C5(:,2)); winddatac(:,9) = abs(C6(:,2)); winddatac(:,10) = abs(C7(:,2)); winddatac(:,11) = abs(C8(:,2)); winddatac(:,12) = abs(C9(:,2)); Powerc(:,1) = Ec(:,1);

182
Powerc(:,2) = Ec(:,4); Powerc(:,3) = Fc(:,4); Powerc(:,4) = C1(:,5); Powerc(:,5) = C2(:,5); Powerc(:,6) = C3(:,5); Powerc(:,7) = C4(:,5); Powerc(:,8) = C5(:,5); Powerc(:,9) = C6(:,5); Powerc(:,10) = C7(:,5); Powerc(:,11) = C8(:,5); Powerc(:,12) = C9(:,5); [CC, DD] = size(Powerc); [windspeedc, avewindc] = WIND2(winddatac); [m,n] = size(Powerc); RPMc = zeros(1,n-1); %Determining the revolutions during data acquisition. for j = 2:n k = 1; while k <= m if abs(Powerc(k,j)) > .0015 RPMc(j-1) = RPMc(j-1) + 1; k = k + 100; else k = k + 1; end end end RPMc = RPMc*6; %The rotor's revolutions/min radpsecc = RPMc*60/2/pi; C = [avewindc', radpsecc']; csvwrite('CalccB.csv',C);

183
Appendix D: Power vs. Wind Speed Code
%This model couple with simpturbine2.m will plot the average power vs wind %speed for several wind speeds. clear all close all global inwind; global wind; global ii; global T1; ii = 0; r = .30; %m m = .01; %kg J1 = 3*m*r^2; %Rotational Inertia of the Turbine %J1 = 200; %Rotational Inertia of the Turbine %B = 2000; %Losses in the bearing %k = 20000; %Torsional spring constant of the coupler %b = .1; %losses in the coupler due to twisting %J2 = 25; %Rotation Inertia of the coupler %H = .1; %10 cm %R = .2; %20 cm %rho = 1.21; %density of air alum_dens = 7874; %kg/m^3 alum_h = .075; %m r2inner = .009525; %m r2outer = .01905; %m volume = alum_h*pi*(r2outer^2-r2inner^2); m2 = alum_dens*volume; %Torsional spring constant of the coupler SM_alum = 24*10^9; %GPa Shear Modulus k = SM_alum*volume; n = 15; n0 = 5090*2*pi/60; %[rpm*(2pi-rad/rev)*(1min/60sec)] Nominal speed From Maxon Motors USA speedtorquegrad = 39*2*pi/60; %[rpm/mNm]*(2pi-rad/rev)*(1min/60sec) from Maxon Motors speedconstant = 1190; %[rpm/Volt] From Maxon Motors torqueconstant = 8; %[mNm/A] J3 = 11.6/1000; %v_wind = rayl; tspan = [0 10]; inputwind = 3:10;

184
%G2 = sqrt(pi/30000*15)/R; %T1 = 0; %T2 = k*X(2); %emf = G2*sqrt(T2); for i = 1:length(inputwind) inwind = inputwind(i); x0 = [0, 0, 0, 0]; [t, X] = ode45(@simpturbine2, tspan, x0); Volts = X(:,3)*n/J3*60/2/pi*speedconstant^-1; Current = X(:,2)*k/n*torqueconstant^-1; Power = .0401*X(:,3)/J3 - .1649; %5plot(t,X, '-') %hold on AveRotor(i) = mean(X(:,3)/J3); %AvePower(i) = mean(Volts.*Current); AvePower(i) = mean(Power); end figure(1) plot(inputwind, AvePower, '.', 'MarkerSize', 15) xlabel('Wind Speed [m/s]') ylabel('Power [mWatts]') %legend('h1', 'theta', 'h2') figure(2) subplot(4,1,1) plot(t, X(:,1)/J1) title('State Variable Results') subplot(4,1,2) plot(t, X(:,2)*180/pi) subplot(4,1,3) plot(t, X(:,3)/J3) subplot(4,1,4) plot(t, X(:,4)) figure(3) plot(inputwind, AveRotor, '.', 'MarkerSize', 15)

185
function T = simpturbine2(t, x0) global inwind; global wind; global ii; global T1; %-----------------------------Turbine Blade Parameters-------------------- r = .30; %m m = .1; %kg J1 = 3*m*r^2; %Rotational Inertia of the Turbine B = 1; %[Nm-sec^-1] Losses in the bearing %-----------------------------Coupler Parameters-------------------- alum_dens = 7874; %kg/m^3 alum_h = .075; %m r2inner = .009525; %m r2outer = .01905; %m volume = alum_h*pi*(r2outer^2-r2inner^2); m2 = alum_dens*volume; %Torsional spring constant of the coupler SM_alum = 24*10^9; %GPa Shear Modulus k = SM_alum*volume; %-----------------------------Rotor Parameters-------------------- J3 = 12.3/1000;%/100^2;%[g-cm^2](1 kg/1000g)(1m^2/(100cm)^2) Rotor Inertia From Maxon Motors USA %------------------------Determining the input torque---------------------- H = .1; %10 cm R = .5; %20 cm rho = 1.21; %[kg/m^3] density of air Cm = .2; T1 = Cm*rho*R^2*H*inwind^2*1000; %[mNm] v_wind = 3;%raylrnd(x0(2)); % 2*rand(1)+5;Rayleigh random number generator 3mph center %if t==0 % T1 = Cm*rho*R^2*H*inwind^2*1000; %[mNm] %else % T1 = 0; %end

186
%---------------------------Generator Parameters--------------------------- n = 15; n0 = 5090*2*pi/60; %[rpm*(2pi-rad/rev)*(1min/60sec)] Nominal speed From Maxon Motors USA speedtorquegrad = 190*2*pi/60; %[rpm/mNm]*(2pi-rad/rev)*(1min/60sec) from Maxon Motors speedconstant = 1380; %[rpm/Volt] From Maxon Motors %T2 = .002*30000/pi/n; %[mNm] .002 = target power 15 = gear ratio %---------------------------Generator Parameters--------------------------- C = 2200*10^-6; %[microfarads] Resist = 44000; %[kOhms] %----------------------------State Equations------------------------------ %if(x0(1)/J1 < 3.6442) % T3 = 0; %else % T3 = (n0-x0(2)*n/J3)*speedtorquegrad^-1; %end %h1dot = T1 - x0(1)/J1*B - T3; %h3dot = T3; h1dot = T1 - k*x0(2) - x0(1)/J1*B; thetadot = x0(1)/J1 - x0(3)/J3; h3dot = x0(2)*k - x0(3)/J3*B; qdot = (x0(3)*15/J3*60/2/pi*speedconstant^-1-x0(4)*C)/Resist; T = [h1dot; thetadot; h3dot; qdot];

187
Appendix E: Simulating Random Wind Code
%This model with simpturbine.m attempts to anticipate charge time for a %varying wind speeds. clear all close all global inwind; global wind; global ii; global T1; ii = 0; r = .30; %m m = .01; %kg J1 = 3*m*r^2; %Rotational Inertia of the Turbine %J1 = 200; %Rotational Inertia of the Turbine %B = 2000; %Losses in the bearing %k = 20000; %Torsional spring constant of the coupler %b = .1; %losses in the coupler due to twisting %J2 = 25; %Rotation Inertia of the coupler %H = .1; %10 cm %R = .2; %20 cm %rho = 1.21; %density of air alum_dens = 7874; %kg/m^3 alum_h = .075; %m r2inner = .009525; %m r2outer = .01905; %m volume = alum_h*pi*(r2outer^2-r2inner^2); m2 = alum_dens*volume; %Torsional spring constant of the coupler SM_alum = 24*10^9; %GPa Shear Modulus k = SM_alum*volume; n = 15; n0 = 5090*2*pi/60; %[rpm*(2pi-rad/rev)*(1min/60sec)] Nominal speed From Maxon Motors USA speedtorquegrad = 190*2*pi/60; %[rpm/mNm]*(2pi-rad/rev)*(1min/60sec) from Maxon Motors speedconstant = 60.4; %[rpm/Volt] From Maxon Motors torqueconstant = 158; %6.94; %[mNm/A] J3 = 12.3/1000; %v_wind = rayl; tspan = [0 10]; for jj = 1:12

188
inputwind(jj) = raylrnd(3); end %G2 = sqrt(pi/30000*15)/R; %T1 = 0; %T2 = k*X(2); %emf = G2*sqrt(T2); H1 = 0; THETA = 0; H3 = 0; Q = 0; time = 0; for i = 1:length(inputwind) inwind = inputwind(i); x0 = [H1(length(H1),1), THETA(length(THETA),1), H3(length(H3),1), Q(length(Q),1)]; [t, X] = ode45(@simpturbine, tspan, x0); Volts = X(:,3)*n/J3*60/2/pi*speedconstant^-1; Current = X(:,2)*k/n*torqueconstant^-1; %5plot(t,X, '-') %hold on time = [time; time(length(time))+t]; H1 = [H1; X(:,1)]; THETA = [THETA; X(:,2)]; H3 = [H3; X(:,3)]; Q = [Q; X(:,4)]; AvePower(i) = mean(Volts.*Current); end figure(1) subplot(2,1,1) plot(time/6, Q*10) %legend('h1', 'h3', 'wind') title('Charge Model') xlabel('Time [min]') ylabel('Charge [coul]') subplot(2,1,2) bar((50:100:(100*length(inputwind)-50))/60, inputwind, 1) xlabel('Time [min]') ylabel('Wind Speed [m/s]') axis([ 0 20 0 (max(inputwind)+1)]) %figure(2) %plot(inputwind, AvePower, '.', 'MarkerSize', 15) %xlabel('Wind Speed [m/s]') %ylabel('Power [mWatts]')

189
%legend('h1', 'theta', 'h2') figure(3) subplot(4,1,1) plot(time, H1/J1) title('State Variable Results') subplot(4,1,2) plot(time, THETA*180/pi) subplot(4,1,3) plot(time, H3/J3) subplot(4,1,4) plot(time, Q)

190
function T = simpturbine(t, x0) global inwind; global wind; global ii; global T1; %-----------------------------Turbine Blade Parameters-------------------- r = .30; %m m = .1; %kg J1 = 3*m*r^2; %Rotational Inertia of the Turbine B = 3.5; %[Nm-sec^-1] Losses in the bearing %-----------------------------Coupler Parameters-------------------- alum_dens = 7874; %kg/m^3 alum_h = .075; %m r2inner = .009525; %m r2outer = .01905; %m volume = alum_h*pi*(r2outer^2-r2inner^2); m2 = alum_dens*volume; %Torsional spring constant of the coupler SM_alum = 24*10^9; %GPa Shear Modulus k = SM_alum*volume; %-----------------------------Rotor Parameters-------------------- J3 = 12.3/1000;%/100^2;%[g-cm^2](1 kg/1000g)(1m^2/(100cm)^2) Rotor Inertia From Maxon Motors USA %------------------------Determining the input torque---------------------- H = .1; %10 cm R = .3; %20 cm rho = 1.21; %[kg/m^3] density of air Cm = .2; %wind(1) = 2; %wind(2) = 12; %wind(3) = 5; %wind(4) = 18; %wind(5) = 3; %T1 = Cm*rho*R^2*H*inwind^2*1000; %[mNm] %if rem(t,2) ~= 0

191
%n = 0; %if inwind < 3 % inwind = 0; %end %if t >= 1*n % inwind = raylrnd(5); % T1 = Cm*rho*R^2*H*inwind^2*1000; % ii=ii+1; %elseif t>=5 && t<10 % inwind = wind(n+1); %ii = ii+1; % T1 = Cm*rho*R^2*H*inwind^2*1000; %[mNm] % ii=ii+1; %else %n = n + 1; %end % inwind = raylrnd(2); %ii = ii+1; T1 = Cm*rho*R^2*H*inwind^2*1000; %[mNm] ii=ii+1; %end % wind(ii) = inwind; t v_wind = 3;%raylrnd(x0(2)); % 2*rand(1)+5;Rayleigh random number generator 3mph center %if t==0 % T1 = Cm*rho*R^2*H*inwind^2*1000; %[mNm] %else % T1 = 0; %end %---------------------------Generator Parameters--------------------------- n = 15; n0 = 5090*2*pi/60; %[rpm*(2pi-rad/rev)*(1min/60sec)] Nominal speed From Maxon Motors USA speedtorquegrad = 190*2*pi/60; %[rpm/mNm]*(2pi-rad/rev)*(1min/60sec) from Maxon Motors speedconstant = 1380; %[rpm/Volt] From Maxon Motors torqueconstant = 6.94; %[mNm/A] %T2 = .002*30000/pi/n; %[mNm] .002 = target power 15 = gear ratio %---------------------------Generator Parameters-----------

192
---------------- C = 2200*10^-6; %[microfarads] Resist = 44000; %[kOhms] %----------------------------State Equations------------------------------ %if(x0(1)/J1 < 3.6442) % T3 = 0; %else % T3 = (n0-x0(2)*n/J3)*speedtorquegrad^-1; %end transformer = .0401*x0(3)/J3*60/2/pi-.1649 %h1dot = T1 - x0(1)/J1*B - T3; %h3dot = T3; h1dot = T1 - k*x0(2) - x0(1)/J1*B; thetadot = x0(1)/J1 - x0(3)/J3; h3dot = x0(2)*k - x0(3)/J3*B-x0(4)/C/R*torqueconstant; qdot = (x0(3)*15/J3*60/2/pi*speedconstant^-1-x0(4)*C)/Resist; T = [h1dot; thetadot; h3dot; qdot];

193
Appendix F: LabVIEW Block Diagram
The NI LabVIEW block diagram for acquiring the voltage, power, and wind
speed during experimentation is seen below. The 32 Channel NI USB 6211 Data
Acquisition module was used. Wind was created using a 3-stage fan, and was measured
using an anemometer. The voltage was measured across a resistor for a span of 10
seconds, with a sampling rate of 1000 Hz.

194
Appendix G: Experimental Procedure
Wind Prototype Testing Procedure
To test the wind harvester proof-of-concept model, a procedure was developed so
that the results can be repeated, and to validate the results. The data collected was
analyzed to validate the model, and to improve the model. The procedure is laid out here
in steps for simple implementation.
Materials:
• Prototype wind turbine
o Generator
o Piezo
• Anemometer
• 3-Speed Fan
• Tape Measure
• NI DAQ USB-6211
• 44 kOhm resistor
Preliminary Set Up
1. Develop a LabVIEW VI to measure the input voltage from the circuit board, and
the anemometer. The VI should output data including the time, voltage, power,
and wind data.

195
2. Construct a circuit with a known resistance. The output from the energy harvester
should be connected in parallel with the resistance, as well as the acquisition
module.
Generator Output
3. Connect only the generator to the circuit board. The piezoelectric strip and mount
are not on the prototype during this portion of the experiment.
4. Place the fan a distance away, and record.
5. Acquire the data starting with the fan on its low speed. Allow the system to reach
a steady state.
6. Repeat with the fan on its medium speed, and then high speed from the same
distance.
7. Move the fan to a new distance and record. Again acquire the data at each fan
setting.
Piezoelectric Strip Output
8. Disconnect the generator from the circuit and the rotor.
9. Mount the piezoelectric strip onto the prototype, and connect it to the circuit.
10. Record the fan distance from the prototype.
11. Acquire the data beginning with the fan on the lowest setting. Repeat each speed
while increasing the fan speed setting. Connect the coupler to the generator.
12. Move the fan to a new distance and record. Repeat data acquisition of at each
speed setting.

196
Piezoelectric Strip Output with Generator Losses
13. Repeat the piezoelectric strip output measurements.
14. Keep the fan at the same distance.
15. Connect the generator to the rotor. Leave the generator disconnected to the circuit
(open).
16. Acquire the data (the output of the piezoelectric) at each of the fan settings.
Generator Output with Piezoelectric Strip Losses
17. Keep the fan at the same distance as the piezoelectric strip output with generator
losses.
18. Disconnect the piezoelectric strip from the circuit.
19. Connect the generator to the circuit.
20. Repeat measuring the output of the generator. The piezoelectric strip will be an
open circuit.
Note: Readings were taken for 10 second intervals at a 1000 Hz. The total number of
samples taken was 100 x100 = 10,000 Samples. The file was saved as a TDMS file, and
then converted to an Excel spreadsheet. The columns were time, voltage, current, power,
and wind speed, in that order. The wind speed is computed as the number of pulses/time
* 2.5 mph/Hz. Distances were measured from the front of the fan grill to the center of the
rotor. Files were saved in the following fashion: measured transducer - open circuit
transducer - fan speed setting. Distances were recorded to the right of the data.

197

198
References
Abe, K.-ichi, & Ohya, Y. (2004). An investigation of flow fields around flanged diffusers
using CFD. Journal of Wind Engineering and Industrial Aerodynamics, 92(3-4), 315-330. doi: 10.1016/j.jweia.2003.12.003.
American Association of State Highway and Transportation Officials. (2011). Bridging the Gap. Retrieved April 17, 2011, from http://www.transportation1.org/bridgereport/facing-facts.html.
Appa, K. (2001). Contra-Rotating Wind Turbine System. US. Appa, K., & Appa, S. N. (2004). Method of Increasing Wind Farm Energy Production.
US. Bagley, C. E., & Dauchy, C. E. (1998). Intellectual Property. The Entrepreneurʼs Guide
to Business Law (pp. 433-493). West Educational Publishing Company. Bai, H., Atiquzzaman, M., & Liljia, D. (2004). Wireless Sensor Network for Aircraft
Health Monitoring. Broadband Networks, 748-750. Barclay, R. M. R., Baerwald, E. F., & Gruver, J. C. (2007). Variation in bat and bird
fatalities at wind energy facilities: assessing the effects of rotor size and tower height. Canadian Journal of Zoology, 85(3), 381-387. doi: 10.1139/Z07-011.
Beaman, J. J., & Paynter, H. M. (1993). Modeling of Physical Systems. Beeby, S. P., & OʼDonnell, T. (2009). Electromagnetic Energy Harvesting. In S. Priya &
D. J. Inman (Eds.), Energy Harvesting Technologies (pp. 129-165). New York: Springer.
Boyle, R. (2010). Chicago Garage Fires Up Helical Wind Turbines for Attractive, Earth-Friendly Parking. Popular Science. Retrieved from http://www.popsci.com/technology/article/2010-08/chicago-garage-fires-wind-turbines-earth-friendly-parking.
Chen, W., Wiecek, M. M., & Zhang, J. (1999). Quality Utility: A Compromise Programming Approach to Robust Design. ASME Journal of Mechanical Design, 121(2), 179-187.
Craziest Gadgets. (2008). Hymini Wind Powered Personal Gadget Charger. Czyzewski. (2011). Team Assesses Environmental Impact of Vehicle Batteries. The
Engineer. Retrieved May 2, 2011, from http://www.theengineer.co.uk/sectors/automotive/team-assesses-environmental-impact-of-vehicle-batteries/1008455.article.
Diamond, J. (1999). Guns, Germs, and Steel: The Fates of Human Societies. New York: W.W. Norton and Company.
Diamond, J. (2005). Collapse: How Societies Choose to Fail or Succeed. New York: Penguin Group.
Ehrlich, E., Flexner, S. B., Carruth, G., & Hawkins, J. M. (1986). Oxford American Dictionary. New York: Avon Books.

199
Enviro-Energies Holdings Inc. (2009). EnviroEnergies. Retrieved September 6, 2010, from www.enviro-energies.com/index.htm.
Eriksson, S., Bernhoff, H., & Leijon, M. (2008). Evaluation of different turbine concepts for wind power. Renewable and Sustainable Energy Reviews, 12(5), 1419-1434. doi: 10.1016/j.rser.2006.05.017.
Fasl, J., Wood, S., Helwig, T., Potter, D., Samaras, V., Frank, K., et al. (2010). Evaluation of Wireless Devices for Monitoring Fracture-Critical Steel Bridges. 7th International Bridge Engineering Conference. San Antonio, Tx.
Fish, F., Watts, P., & Dewar, S. (2010). The Science. Our Technology. Whalepower. Retrieved September 6, 2010, from www.whalepower.com/drupal.
Forced Green. (2008). Aeroelastic Flutter A Green Power Phenomena. Retrieved March 4, 2011, from http://www.forcedgreen.com/2010/02/aeroelastic-flutter-a-green-power-phenomena/.
Fox, R. W., McDonald, A. T., & Pritchard, P. J. (2004). Introduction to Fluid Mechanics (Sixth.). Hoboken, NJ: John Wiley & Sons.
Gaskell, C. N. (2006). Ducted Wind Turbine. US. Gladwell, M. (2002). The Tipping Point. New York: Little, Brown and Company. Goldemberg, J. (2007). Ethanol for a Sustainable Energy Future. Science, 315(5813),
808-810. doi: 10.1126. Goren-Inbar, N., Alperson, N., Kislev, M. E., Simchoni, O., Melamed, Y., Ben-Nun, A.,
et al. (2004). Evidence of Hominin Use of Fire at Gesher Benot Yaʼaqov, Israel. Science, 304(5671), 725-727. doi: 10.1126/science.1095443.
Grant, a, Johnstone, C., & Kelly, N. (2008). Urban wind energy conversion: The potential of ducted turbines. Renewable Energy, 33(6), 1157-1163. doi: 10.1016/j.renene.2007.08.005.
Grauers, A. (1996). Design of Direct-Driven Permanent-Magnet Generators. Computer Engineering.
Hansen, A. D., Iov, F., Blaabjerg, F., & Hansen, L. H. (2004). Review of Contemporary Wind Turbine Concepts and their Market Penetration. Wind Engineering, 28(3), 247-263. doi: 10.1260/0309524041590099.
Hansen, M. O. L., Sorensen, N. N., & Flay, R. G. J. (2000). Effect of Placing a Diffuser around a Wind Turbine. Wind Energy, 3(4), 207-213. doi: 10.1002/we.37.
Harper, R. H. R. (2010). Texture: Expression in the Age of Communications Overload. Cambridge, MA: The MIT Press.
Heliosolaire Energies Renouvelables. (2011). Our Wind Turbine Selections. Retrieved March 4, 2011, from http://www.heliosolaire.com/en/sections/gamme-de-materiels-selectiones.
Hippel, E. von. (2005). Why Users Often Freely Reveal Their Innovations. Democratizing Innovation (pp. 78-91). Cambridge, MA: The MIT Press.
Hohmann, D. P., OʼToole, M. S., Ramsey, K. L., & Smith, S. D. (2008). Bridge Facts, FY 2008. Austin, Tx: Brige Division, Texas Department of Transportation.

200
Hoshaw, L. (2009). Scientists Explore Growing Ocean Garbage Patches. New York Times. Retrieved April 24, 2011, from http://www.nytimes.com/2009/11/10/science/10patch.html.
Inspeed.com. (2008). Inspeed Vortex Wind Sensor. Retrieved March 29, 2011, from http://www.inspeed.com/anemometers/Vortex_Wind_Sensor.asp.
Jensen, D. J., Weaver, J., Wood, K. L., Linsey, J., & Wood, J. (2009). Techniques to Enhance Concept Generation and Develop Creativity. ASEE Annual Conference (pp. 1-25). Austin, TX.
Johansson, F. (2006). The Medici Effect. Boston: Harvard Business School Press. Khaligh, A., & Onar, O. C. (2010). Energy Harvesting: Solar, Wind, and Ocean Energy
Conversion Systems. In A. Emadi (Ed.), (pp. 101-165). Boca Raton: CRC Press. Kim, H., Tadesse, Y., & Priya, S. (2009). Piezoelectric Energy Harvesting. In S. Priya &
D. J. Inman (Eds.), Energy Harvesting Technologies (pp. 3-39). New York: Springer.
Knight, a M., & Peters, G. E. (2005). Simple Wind Energy Controller for an Expanded Operating Range. IEEE Transactions on Energy Conversion, 20(2), 459-466. doi: 10.1109/TEC.2005.847995.
Knowles, R. S. (1978). The Greatest Gamblers (2nd ed.). Norman: University of Oklahoma Press.
Ko, J. M., & Ni, Y. Q. (2004). Technology Developments in Structural Health Monitoring of Large-Scale Bridges. Engineering Structures, 27(12), 1715-1725.
Kurlansky, M. (2002). Salt: A World History. New York: Penguin Books. Laird, J. (2010). PV Innovations: Solar manufacturing moves mainstream. Renewable
Energy Focus, 11(5), 44-49. Elsevier Ltd. doi: 10.1016/S1755-0084(10)70116-2. Markusen, S. (2011). Rare Earth Elements: A Bubble or a Long-Term Growth Story?
FINalternatives. Retrieved April 29, 2011, from http://www.finalternatives.com/node/16367.
Matoge, A., Kotanagi, S., Yoshida, Y., Utsunomiya, F., & Kishi, M. (2002). Timepiece Having Thermoelectric Generator Unit. United States.
Maxon Motors, I. (2010). A-max 26 Æ26 mm, Precious Metal Brushes CLL, 4 Watt, Œ approved. Retrieved from http://shop.maxonmotor.com/ishop/download/article/200938.xml.
McDonough, W., & Braungart, M. (2002). Cradle to Cradle. New York: North Point Press.
McDougal, C. (2009). Born to Run: A Hidden Tribe, Superathletes, and the Greatest Race the World Has Never Seen. New York: Alfred A. Knopf.
Memmott, J. (2007). Bureau of Transportation Statistics Special Report: Highway Bridges in the United States. Washington D.C.
Menet, J.-L., & Bourabaa, N. (2006). INCREASE IN THE SAVONIUS ROTORS EFFICIENCY VIA A PARAMETRIC INVESTIGATION Jean-Luc Menet 1 , Nachida Bourabaa 2 (p. 11). Valencia. Retrieved from www.2004ewec.info/files/23_1400_jeanlucmenet_01.pdf.

201
Meyers, B. (2009a). Wind Turbine History. Centurion Energy. Retrieved March 3, 2011, from http://centurionenergy.net/wind-turbine-history.
Meyers, B. (2009b). Basic Wind Turbine Building. Centurion Energy. Retrieved March 4, 2011, from http://centurionenergy.net/basic-wind-turbine-building.
Meyers, B. (2009c). Types of Wind Turbines. Centurion Energy. Retrieved March 3, 2011, from http://centurionenergy.net/types-of-wind-turbines.
Miniwiz Sustainable Energy Dev. LTD. (n.d.). Hymini. Retrieved September 6, 2010, from http://www.hymini.com/html/HYmini.html.
Mirecki, A., Roboam, X., & Richardeau, F. (2007). Architecture Complexity and Energy Efficiency of Small Wind Turbines. IEEE Transactions on Industrial Electronics, 54(1), 660-670. doi: 10.1109/TIE.2006.885456.
Moore, G. A. (2002). Crossing the Chasm. New York: HarperCollins Publishers. Muljadi, E., & Butterfield, C. P. (2001). Pitch-controlled variable-speed wind turbine
generation. IEEE Transactions on Industry Applications, 37(1), 240-246. doi: 10.1109/28.903156.
National Transportation Safety Board. (2008). Collapse of I-35W Highway Bridge, Minneapolis, Minnesota, August 1, 2007. Washington D.C.
Nheolis SAS. (2010). Nheolis 3D Wind Turbines. Retrieved September 6, 2010, from www.nheolis.com.
Nixon, N. (2008). Timeline: The History of Wind Power. The Guardian. Retrieved March 3, 2011, from http://www.guardian.co.uk/environment/2008/oct/17/wind-power-renewable-energy.
Online Compact Oxford English Dictionary. (2011). Infrastructure. Retrieved January 17, 2011, from http://www.askoxford.com/concise_oed/infrastructure.
Otto, K. N., & Antonsson, E. K. (1993). Tuning Parameters in Engineering Design. ASME Journal of Mechanical Design, 115(1), 14-19.
Otto, K. N., & Wood, K. L. (2001). Product Design: Techniques in Reverse Engineering and New Product Development. Upper Saddle River, New Jersey: Prentice-Hall, Inc.
Parker, P. M. (2011). Energy Harvesting. Websterʼs Online Dictionary. Retrieved March 3, 2011, from http://www.websters-online-dictionary.net/definitions/Energy+harvesting?cx=partner-pub-0939450753529744:v0qd01-tdlq&cof=FORID:9&ie=UTF-8&q=Energy+harvesting&sa=Search#906.
Pickover, C. A. (2008). Archimedes to Hawking: Laws of Science and the Great Minds Behind Them (pp. 246-255). New York: Oxford University Press, Inc.
Piezo Systems, I. (2008). Standard Quick Mount Bending Actuators. Office. Woburn, MA. Retrieved from http://www.piezo.com/catalog7C.pdf files/Cat7C.40.pdf.
Polinder, H., Pijl, F. F. A. van der, Vilder, G.-J. de, & Tavner, P. J. (2006). Comparison of Direct-Drive and Geared Generator Concepts for Wind Turbines. IEEE Transactions on Energy Conversion, 21(3), 725-733.
Priya, S., & Inman, D. J. (2009). Energy Harvesting Technologies. Print (p. 32). New York City: Springer.

202
Rea, M. L. (2001). Wind Driven Generator Having Counter-Rotating Armature and Rotor. US.
Renovation Headquarters. (2011). Annual Average Wind Speed - Major US Cities. Retrieved January 29, 2011, from http://www.renovation-headquarters.com/annual-wind-speed.html.
Roberts, P. (2004). The End of Oil. New York: Houghton Mifflin Company. Schwartz, A. (2010a). Fields of Windstalks Harvest Kinetic Energy From the Wind.
Inhabitat. Retrieved September 6, 2010, from http://inhabitat.com/2010/0818/kinetic-windstalk-field-harvests-energy-from-the-breeze/.
Schwartz, A. (2010b). “Wind Lens” Turbines Could Boost Energy Generation 3X. Inhabitat. Retrieved March 9, 2011, from http://inhabitat.com/wind-lens-turbines-could-boost-energy-generation-3x/.
Scott, C. (2010). Energy-Generating Kite Park Offers Extreme Green Parasailing. Inhabitat. Retrieved March 9, 2011, from http://inhabitat.com/2010/08/18/energy-generating-kite-park-offers-extreme-green-parasailing/.
Smil, V. (2003). Energy at the Crossroads: Global Perspectives and Uncertainties (pp. 239-316). Cambridge, MA: The MIT Press.
Snyder, G. J. (2009). Thermoelectric Energy Harvesting. In S. Priya & D. J. Inman (Eds.), Energy Harvesting Technologies (pp. 325-336). New York: Springer.
Steingart, D. (2009). Power Sources for Wireless Sensor Networks. In S. Priya & D. J. Inman (Eds.), Energy Harvesting Solutions. New York City: Springer.
Stiesdal, H. (1998). The Wind Turbine: Components and Operation. Energy. Bonus Energy A/S. Retrieved from http://www.windmission.dk/workshop/BonusTurbine.pdf.
Sullivan, A., & Sheffrin, S. M. (2003). Economics: Principles in Action (p. 474). Upper Saddle River, New Jersey: Pearson Prentice Hall.
Tuite, D. (2007). Energy Harvesting Gets Big—And Small. Electronic Design, 64-68. Walker, V. T., Johnson, B. R., Shumaker, C. E., Wolford, C. B., Shank, J. C., &
Roseburg, M. S. (2010). Energy Harvesting. Air Force Academy. Ward, L. (2007). Windbelt, Cheap Generator Alternative, Set to Power Third World.
Popular Mechanics. Retrieved September 6, 2010, from http://www.popularmechanics.com/science/energy/solar-wind/4224763.
Weather Underground. (2010). . Retrieved February 21, 2010, from www.wunderground.com.
Weaver, J., Wood, K. L., Crawford, R. H., & Jensen, D. (2010). Design of Energy Harvesting Technology: Feasibility for Low-Power Wireless Sensor Networks. International Design Engineering Conferences & Computers andInformation in Engineering Conference. Montreal, Quebec, Canada: ASME.
Weaver, J., Wood, K. L., Crawford, R. H., & Jensen, D. (2011). Exploring Innovation Opportunities in Energy Harvesting Using Functional Modeling Approaches. International Design Engineering Technical Conferences & Computers and Information in Engineering Conference. Washington D.C. ASME.

203
Weisman, A. (2007). The World Without Us. New York: Thomas Dunne Books. What is a Freegan. (2008). . Retrieved September 17, 2010, from http://freegan.info. White, C., Talley, A., Jensen, D. J., & Wood, K. L. (2010). From Brainstorming to C-
Sketch to Principles of Historical Innovators: Ideation Techniques to Enhance Student Creativity. ASEE Annual Conference (pp. 2010-2278). Lexington, KY.
Wright, A., & Wood, D. (2004). The starting and low wind speed behaviour of a small horizontal axis wind turbine. Journal of Wind Engineering and Industrial Aerodynamics, 92(14-15), 1265-1279. doi: 10.1016/j.jweia.2004.08.003.
Xu, F. J., Yuan, F. G., Hu, J. Z., & Qiu, Y. P. (2010). Design of a miniature wind turbine for powering wireless sensors. Aerospace, 7647(2), 764741-764741-9. doi: 10.1117/12.847429.
Yen, J. T. (1978). Tornado-Type Wind Turbine. US. Yousef, A. A., Pasupathy, P., Wood, S., & Neikirk, D. P. (2010). Passive Sensors for
Detecting Corrosion in Concrete Bridge Decks. 7th International Bridge Engineering Conference Improving Reliability and Safety - Restoration, Renewal and Replacement. San Antonio, Tx.
Yu, P. L., & Leitmann, G. (1974). Compromise Solutions, Domination Structures, and Salukvadzeʼs Solution. Journal of Optimization Theory and Applications, 13(3), 362-378.
Zeleny, M. (1973). Compromise Programming. Mulitple Criteria Decision-Making. Columbia: University of South Carolnia Press.