copyright by kiran kalkunte seshadri 2015
TRANSCRIPT

Copyright
by
Kiran Kalkunte Seshadri
2015

The Thesis Committee for Kiran Kalkunte Seshadri
Certifies that this is the approved version of the following thesis:
Integrated Open Source Life Cycle Assessment of Electricity
Generation Technologies
APPROVED BY
SUPERVISING COMMITTEE:
Carey W King
James Eric Bickel
Michael Carbajales-Dale
Supervisor:

Integrated Open Source Life Cycle Assessment of Electricity
Generation Technologies
by
Kiran Kalkunte Seshadri, B.E.; M.S.
Thesis
Presented to the Faculty of the Graduate School of
The University of Texas at Austin
in Partial Fulfillment
of the Requirements
for the Degree of
Master of Science in Energy and Earth Resources
The University of Texas at Austin
December 2015

Dedication
I would like to dedicate this thesis to my beloved wife and to the memory of my beloved
mother.

v
Acknowledgements
I would like to express my sincere gratitude to Dr. Carey King for his continuous
guidance over the course of this research. Dr. King’s teaching, patience, understanding of
concepts, knowledge and help has enabled me to complete this thesis.
I would like to thank Dr. Eric J Bickel and Dr. Michael Carbajales-Dale for
serving on my thesis committee.
I would like to thank Ms. Jessica Smith for her continuous guidance over the
course of my graduate studies in the EER program.
I would like to thank my friends and colleagues at Microchip Technologies
(formerly Standard Microsystems Corporation) for their support during my graduate
studies.
I would like to thank my parents, siblings and friends for being there for me in
time of need.
Last but not the least, I would like to thank my wife for her unwavering support
and the motivation she provided me to complete this degree program.

vi
Abstract
Integrated Open Source Life Cycle Assessment of Electricity
Generation Technologies
Kiran Kalkunte Seshadri, M.S.E.E.R
The University of Texas at Austin, 2015
Supervisor: Carey W King
Energy return ratios help us to understand the influence of energy on the growth,
structure and organization of societies. Energy return ratios also help assess the
likelihood of new technologies in terms of sustainability and their influence on economic
growth. Net energy analysis is part of Life Cycle Assessment and calculates Energy
return ratios of energy systems. In this thesis, we have created LCA models for multiple
electricity technologies using data from (Hertwich et al. 2015). The LCA models are
integrated to create a system-scale LCA model. Energy return ratios for all the models are
calculated using the LCA models representing electricity generation technologies and for
the integrated LCA model. We have developed a scalable, object oriented, open source
methodology that allows for expansion of the integrated system-scale LCA model and
also enable creation and analysis of any other LCA model.

vii
Table of Contents
List of Tables ......................................................................................................... ix
List of Figures ..........................................................................................................x
Introduction ..............................................................................................................1
Background of Life Cycle Assessment and Energy Return Ratios ................1
Scope of this thesis..........................................................................................5
Goals and Objectives ......................................................................................7
Integrated LCA model ...........................................................................7
Energy Return Ratios .............................................................................7
Open source LCA methodology ............................................................8
Organization of the thesis ...............................................................................8
Design ....................................................................................................................10
LCA Assessment ...........................................................................................11
Energy Return Ratios ....................................................................................12
Method 1: Based on the Bottom-up framework (Brandt et al. 2013) ..13
Total Energy Output (TEO) ........................................................13
Total Waste Heat (TWH) ............................................................13
Total Waste Heat from Feedstock (TWHFS) ...............................15
Net Energy Ratio (NER) .............................................................16
Gross Energy Ratio (GER) .........................................................17
Net External Energy Ratio (NEER) ............................................17
Gross External Energy Ratio (GEER) ........................................17
Method 2: NER and NEER from CED ................................................18
Open source ..................................................................................................20
Implementation ......................................................................................................22
LCA Data ......................................................................................................22
Software Tools ..............................................................................................24
Creating system-scale LCA model ...............................................................24

viii
Creating subsystem-scale LCA models ...............................................24
Merging subsystem-scale LCA models ...............................................27
System-scale and Subsystem-scale LCA Assessment ..................................28
System-scale and Subsystem-scale Energy Return Ratios ...........................33
Open source ..................................................................................................39
Expansion of LCA models by adding processes..................................39
Development of any subsystem-scale and system-scale LCA models 41
Results ....................................................................................................................44
Results from subsystem-scale LCA and ERR computation .........................44
Results from System-scale LCA and ERR computation ..............................52
Discussion ..............................................................................................................55
Conclusion .............................................................................................................63
Appendix A ............................................................................................................65
Background of Object Oriented Methodology .............................................65
LCA Process as an Object.............................................................................66
LCA System as tree of processes ..................................................................67
Building the LCA System-scale model.........................................................74
Creating subsystem-scale LCA models ...............................................74
Conversion of subsystem-scale LCA tree to matrices .........................76
Creating the A header-matrix pair ..............................................77
Creating the B header-matrix pair...............................................81
Creating the F vector ...................................................................81
Object based merging to create system-scale models ..........................81
Process Definition .........................................................................................85
References ..............................................................................................................88

ix
List of Tables
Table 1: Types of Energy Return Ratios (King 2014) ...........................................12
Table 2: Subsystem-scale Energy Return Ratios Results (using Method 1) (Region:
US, Year: 2010) ................................................................................49
Table 3: NER and NEER using Method 2 (Arvesen and Hertwich 2015) (Region: US,
Year: 2010) .......................................................................................51
Table 4: System-scale Electricity Demand for 2050 scenario (Year: 2050) .........53
Table 5: System-scale Material usage and emissions (Year: 2050) ......................54
Table 6: System-scale Energy Return Ratios (Year: 2050) ...................................54
Table 7: Comparison of ERR results from Method 1 and Method 2 .....................62
Table 8: Basic Process Attributes ..........................................................................66
Table 9: Other Process Attributes ..........................................................................66
Table 10: Process Attributes for Representing Children .......................................67
Table 11: Processes of LCA System for Electricity Generation from Coal ..........71

x
List of Figures
Figure 1: Part of the Coal wo IGCC Model showing fuel input & methane emissions
...........................................................................................................20
Figure 2: Execution of Parse program in Matlab ...................................................26
Figure 3: Execution of Merge Program in Matlab .................................................27
Figure 4: An example of an A-Header worksheet .................................................28
Figure 5: An example of an A matrix worksheet ...................................................29
Figure 6: An example of a B Header .....................................................................30
Figure 7: An example of the B matrix ...................................................................30
Figure 8: An example of the F vector ....................................................................31
Figure 9: LCA Assessment program execution in Matlab .....................................31
Figure 10: An example of the s vector ...................................................................32
Figure 11: An example of the g vector ..................................................................32
Figure 12: An example of the Energy Conversion Factor vector ..........................33
Figure 13: An example of Feedstock vector ..........................................................34
Figure 14: An example of Efficiency vector..........................................................35
Figure 15: An example of the Waste Heat vector ..................................................36
Figure 16: Execution of Energy return ratio computation program in Matlab ......37
Figure 17: Execution of the lca_err_comp program in Matlab ..............................38
Figure 18: Addition of a process to the A-Header .................................................40
Figure 19: Addition of a process to A-matrix ........................................................40
Figure 20: Addition of a process to B-matrix ........................................................41
Figure 21: Addition of process to F vector ............................................................41
Figure 22: Subsystem-scale Aluminum Material Usage (Region: US, Year: 2010)46

xi
Figure 23: Subsystem-scale GHG Emissions (Region: US, Year: 2010) ..............47
Figure 24: Comparison of Aluminum usage with (Hertwich et al. 2015) (Region: US,
Year: 2010) .......................................................................................59
Figure 25: Comparison of GHG emissions with (Hertwich et al. 2015)(Region: US,
Year: 2010) .......................................................................................60
Figure 26: NER Comparison .................................................................................61
Figure 27: LCA Process Tree ................................................................................68
Figure 28: Cyclic LCA System Tree for Electricity Generation from Coal ..........70
Figure 29: Flattened LCA System for Electricity Generation from Coal ..............73
Figure 30: Algorithm to create process-objects in a LCA model ..........................75
Figure 31: Algorithm to Convert a Process to a Process-Object ...........................76
Figure 32: Algorithm to Convert all process-objects to A & B header-matrix pair78
Figure 33: Algorithm to Update the A & B header-matrix pair for a process .......80
Figure 34: Algorithm to merge two subsystem-scale LCA models .......................84
Figure 35: Merge tree.............................................................................................85
1
Introduction
Life Cycle Assessment (LCA) is an effective tool for analyzing future electricity
generation scenarios. Metrics like resource usage over the lifetime of the system or the
product is computed using LCA. LCA has an added advantage over economic analyses
because the latter do not include some impacts like Greenhouse gas emissions, land
usage, ecotoxicity and other environmental impacts. Net energy analysis is performed
using LCA and is used to calculate energy return ratios (Brandt et al. 2011, Raugei et al.
2012, Brandt et al. 2013, King 2014, Arvesen and Hertwich 2015). The study presented
in (Hertwich et al. 2015) calculates material flows and non-renewable energy demand by
integrating twenty-one electricity generation technologies. However, the study presented
in (Hertwich et al. 2015) does not compute energy return ratios. In this thesis, twenty-one
LCA models are developed using data from (Hertwich et al. 2015) representing twenty-
one electricity generation technologies. These models are then integrated to develop a
single LCA model. A common methodology is developed that enables calculation of
energy return ratios for all the LCA models. This thesis also presents an open source
methodology that enables expansion and improvement of the integrated LCA model.
BACKGROUND OF LIFE CYCLE ASSESSMENT AND ENERGY RETURN RATIOS
Life Cycle Assessment (LCA) is a widely used methodology used to measure
resource use (materials and energy) and environmental impacts over the lifetime of a
system (Sanden and Arvesen 2014) or a product, where a product can mean goods or
services (Finnveden et al. 2009). LCA has been employed in various sectors of the
society and the economy like policy and decision making at various levels from
government to the corporations (Hellweg and Canals 2014), analysis of new and existing
energy sources (Aresta et al. 2005, Pehnt 2006, Martinez et al. 2009) and analysis of new

2
and existing electricity supply technologies (Mann and Spath 2001, Odeh and Cockerill
2009, Espinosa et al. 2011, Raugei et al. 2012). LCA is used extensively in determining
the environmental impact (e.g., emissions, land use, ecotoxicity etc.) over the lifetime of
various systems or products (Reap et al. 2008, Hellweg and Canals 2014, Hertwich et al.
2015). Apart from measuring resource use and environmental impact, LCA is used to
calculate energy usage and energy return ratios. Cumulative Energy Demand (CED) is an
energy metric of that is generally computed using LCA methodologies and represents the
total direct and indirect energy used over the life time of the energy system (Hujibregts et
al. 2010). Energy return ratios are calculated using LCA models either using CED
(Sanden and Arvesen 2014) or using inventory data that makes up the LCA model
(Raugei et al. 2012, Brandt et al. 2013). Energy Return Ratios (ERRs) refer to a set of
energy metrics that are defined to quantify the energy input and output relationship
obtained from an energy generation systems and technologies. ERRs are one type of
metric that can be calculated from life cycle analysis (LCA) that is often more focused on
environmental analysis of products and processes that can include energy systems, fuels,
and electricity generation technologies (Sanden and Arvesen 2014). The term ERR is a
generic term for more specific calculations of energy output divided by energy inputs
required to make that output. In short, energy analysis and the calculation of ERRs can be
considered a subset of LCA.
In the past and current literature, Energy Return Ratios have been interpreted for
importance within various different contexts and boundary considerations: societal (Hall
et al. 2009), anthropology-based societal organizational (Tainter et al. 2003), economical
(King 2014) and social (Lambert et al. 2014). More specifically in the context of energy
systems, ERRs have been used to compare different fuel sources (Cleveland 2005,
Hammerschlag 2006, Gately 2007, Gagnon 2009, Hall et al. 2009, Dale et al. 2011),

3
electricity producing technologies (Heller et al. 2004, Kubiszewski 2010, Raugei et al.
2012, Weissbach et al. 2013), and system-scale energy efficiencies of a combination of
technologies (Brandt et al. 2013, King et al., 2015).
Tainter et al. (2003) defines energy gain as the difference between of energy
extracted and the energy invested to gain that energy. Energy, in general or energy gain,
in particular, “influences the structure and organization of living systems” (Tainter et al.
2003). Measuring energy return ratios at the societal level, helps in understanding the
influence of energy on society’s growth, structure and organization (Tainter et al. 2003,
King et al. 2015). Calculating energy return ratios of energy technologies helps in
understanding how future technologies can influence society’s economic growth,
structure and organization.
In the most general form, the energy return ratios are defined as the ratio of the
energy output to the ratio of energy used to deliver the energy to the society (King et al.
2015). There are different variations of energy return ratios and the difference between
these ratios stem from the differences in the way the numerators and the denominators
that make up the ERRs are defined. Some of the different types of ERRs used in the past
and current literature are EROI (Energy Returned On Investment) (Hall et al. 2009), Net
Energy Ratio, Gross Energy Ratio, Net External Energy Ratio and Gross External Energy
Ratio (Brandt et al. 2011, Brandt et al. 2013, King 2014, King et al. 2015). The
definitions of these ratios are provided in future sections of the thesis.
EROI is a widely used and an important metric representing energy return ratios
and has various applications. Societal EROI, as defined by (Hall et al. 2009), can be used
to analyze the sustenance of a society. Studies have shown that the increase in EROI
correlates to improved social and quality of life indicators like GDP per capita, human
development index, literacy rate and gender inequality index (Lambert et al. 2014). From

4
the perspective of energy generation systems, economic and energetic EROI will help
analyze if the energy system is a net source or a sink of useful energy to the society
(Arvesen and Hertwich 2015). The energy ratios in general and EROI in particular can
“also help illuminate two important aspects of an energy system: the quality of the energy
resource being extracted, and the ingenuity with which humans extract that energy”
(Brandt et al. 2011).
Often EROI is used too broadly because of the variations in the mathematical
definitions of the same (King et al. 2015). Also, the usefulness of the EROI depends on
the definition of the numerator and denominator that make up the energy ratio (Brandt et
al. 2011). Net Energy Ratio (NER) and Net External Energy Ratio (NEER) provide more
standardized definitions of energy return ratios by specifying what should be in the
numerator and what should be in the denominator. Net Energy Ratio is the ratio of energy
output to the total energy consumed (Brandt et al. 2011, King 2014). Net External Energy
Ratio is defined as the ratio of energy output to the total energy consumed excluding any
energy converted to waste heat as direct energy from any primary energy source
feedstock converted to an energy carrier output (Brandt et al. 2011, King 2014). EROI
refers to the definition of NEER (specified mathematically later). NER and NEER serve
the same role that EROI plays in helping quantify various benefits from an energy
system. In addition, NER and NEER also help in identification and differentiation of
energy systems that require less energy from the society from those that require more
(Brandt et al. 2011). Systems that use less external energy from the society have higher
NEER values than other systems indicating that they are self-fueling systems (Brandt et
al. 2011, King 2014).
Gross Energy Ratios viz. Gross Energy Ratio (GER) and Gross External Energy
Ratio (GEER) are gross equivalents of the NER and NEER. GER is defined as the ratio

5
of gross energy output to the total energy consumed. Gross energy output of a system is
the sum of energy output from the system and the total energy consumed by the system.
Gross energy is also the total primary energy extracted from the Earth required to power
the modeled processes. GEER is defined as the ratio of the gross energy output to the
total energy consumed excluding the energy from the primary energy source feedstock
(Brandt et al. 2011, King 2014).
There are several papers describing methods for calculating energy return ratios
(Cleveland 2005, Heller et al. 2004, Hammerschlag 2006, Gately 2007, Gagnon 2009,
Hall et al. 2009, Dale et al. 2011, Kubiszewski 2010, Brandt et al. 2011, Raugei et al.
2012, Brandt et al. 2013, Weissbach et al. 2013, King 2014, Arvesen and Hertwich
2015). However, majority of the available literature calculate energy return ratios for
specific energy systems (Cleveland 2005, Heller et al. 2004, Hammerschlag 2006, Gately
2007, Gagnon 2009, Dale et al. 2011, Kubiszewski 2010, Raugei et al. 2012, Weissbach
et al. 2013). As a result, methodologies available for different energy sources are
different. (Brandt et al. 2011) propose a generic methodology to compute energy return
ratios for any energy system. We discuss this methodology further because it provides
two advantages – first, the possibility of using the same framework consistently for
multiple electricity generation technologies to compute energy return ratios and perform
comparison of these electricity generation technologies and second, the possibility of
computation of all indirect impacts that are associated with the inputs to the system.
SCOPE OF THIS THESIS
The main scope of our research is to compute energy return ratios for individual
electricity producing technologies as well as at the system-scale by considering current
and future electricity supply mix scenarios.

6
The majority of the studies in the current literature have focused on computing
energy return ratios for specific energy systems by analyzing them individually
(Cleveland 2005, Heller et al. 2004, Hammerschlag 2006, Gately 2007, Gagnon 2009,
Dale et al. 2011, Kubiszewski 2010, Raugei et al. 2012, Weissbach et al. 2013). As a
result, methodologies developed for different energy sources vary significantly. While
energy return ratios computed using individual models that have consistent system
boundary definitions and comprehensively account for all energy inputs (within the
boundary) can be used to compare multiple electricity generation technologies, it is
desirable to have a harmonized method of computing energy return ratios for multiple
electricity generation technologies. (Hertwich et al. 2015) follow a consistent and
comprehensive methodology to compute material flows and cumulative energy demand
for multiple electricity generation technologies, but have not performed computations of
energy return ratios. (Arvesen and Hertwich 2015) understand and recognize that the
study in (Hertwich et al. 2015) does not perform energy return ratio computation.
However, (Arvesen and Hertwich 2015) have not performed computation of energy
return ratios. Our research seeks to use the data from (Hertwich et al. 2015) to perform
energy return ratio computation for various electricity generation technologies.
(Hertwich et al. 2015) compute CED for various electricity generation
technologies. When these CED values are used to compute NEER using the (Arveson and
Hertwich 2015) method, some of the results are inconsistent with the expected range of
calculated values (e.g the NEER for coal power plants for some regions is less than 0)
(This calculation NER from CED is described in the Design chapter). This brings into
question the validity of CED results presented by (Hertwich et al. 2015). Therefore, our
research seeks to apply the (Brandt et al. 2013) framework to inventory data from
(Hertwich et al. 2015) to compute energy return ratios at subsystem-scale and system-

7
scale instead of using the (Arveson and Hertwich 2015) method applied to CED from
(Hertwich et al. 2015).
While, the main focus of the research is on energy return ratios, our research also
seeks to compare the material and emissions flows to the results reported by (Hertwich et
al. 2015) in order to understand how far off our models are from the (Hertwich et al.
2015). The reason our calculations should produce different, mainly lower quantities of
energy and material needs, as compared to (Hertwich et al. 2015) is that our analysis is
missing much of the input data used by (Hertwich et al. 2015). Many of the (Hertwich et
al. 2015) inputs were obtained from the proprietary Ecoinvent database, and thus are not
provided in the supplemental information of (Hertwich et al. 2015).
Lastly, our research seeks to make all the subsystem-scale and system-scale LCA
models and methodology open source for the net energy community to add data and build
upon the models in order to refine energy return ratio computations.
GOALS AND OBJECTIVES
Integrated LCA model
The goal of this research is to develop an integrated open source LCA model
encompassing multiple electricity generation technologies using data from (Hertwich et
al. 2015) to enable calculation of material and energy flows.
Energy Return Ratios
The goal of this research is to develop a harmonized methodology to compute
energy return ratios using subsystem-scale and system-scale LCA models for different
electricity generation technologies.

8
Open source LCA methodology
The goal of this research is to provide an open source LCA methodology that will
enable expansion and improvement of the unified system-scale LCA model by adding
data and processes. The open source methodology is also required to enable creation of
any LCA models and performing LCA assessment and ERR computation. Some of the
important characteristics of an open source LCA methodology are
1. Use of main-stream tools like Microsoft Excel to develop subsystem-scale or
system-scale LCA models.
2. Use of main-stream tools like Matlab to develop programs that implement
functionality pertaining system-scale model creation, LCA and energy ratio
analyses.
3. A simple way of specifying processes of a LCA model, the required matrices
for LCA and energy ratio analyses.
4. A simple way of creating new LCA models or adding processes and data to
existing LCA models.
5. A scalable way of creating and analyzing system-scale models that contains
large number of processes.
ORGANIZATION OF THE THESIS
The rest of this thesis is organized into four chapters – Design, Implementation,
Results, Discussion and Appendix A . The methodology designed for LCA assessment
and energy return ratios computations are described in the Design chapter. The
Implementation chapter includes a description of the source and organization of data, list
of software tools used, description of source code and programs. The Results chapter

9
presents a description of the unified, system-scale LCA model that encompasses twenty-
one electricity generation technologies. Additionally, it also includes the results of LCA
assessment and energy return ratio computations for subsystem-scale and system-scale
LCA models. Lastly, the Discussion chapter presents an analysis of the results and goals
for future work. The object oriented methodology and algorithms designed to create the
system-scale LCA models is described in Appendix A.

10
Design
The system or subsystem under consideration is modeled as a LCA system
comprising of a set of interdependent processes. Each process is modeled as a single
column, and corresponding row, in a matrix of all processes. Each process describes the
necessary inputs for producing some output such as a material, energy carrier, or
economic service. Environmental flows are also associate with each process and
organized into a different matrix. Life Cycle Inventory analysis (LCI) is the first part of
the overall LCA methodology that involves compilation of the inputs and outputs of the
pathways (Suh 2005). The process of LCI will primarily result in two matrices that make
up the LCA model. The technology matrix, also referred to as the A matrix, represents
processes for material and energy flows of the LCA system (Heijungs and Suh 2002,
Brandt et al. 2013). The intervention matrix, also referred to as the B matrix, represents
the environmental flows (like pollutants) of the LCA system (Heijungs and Suh 2002,
Brandt et al. 2013). In order to complete the model and enable net and gross energy
analysis, the demand vector, also referred to as the f vector, is defined and it represents
the desired material or energy output from the LCA system (Heijungs and Suh 2002,
Brandt et al. 2013). The matrix based methodology calculates all indirect impacts that are
associated with the inputs to the system and all environmental flows (into the economy
from the environment and from the economy into the environment) due to the provision
of final demand.
Object oriented methodology is used to convert the data from (Hertwich et al.
2015) to create subsystem-scale and system-scale LCA models. This methodology,
including all the algorithms we have developed, is described in Appendix A.

11
After the system-scale LCA models were created, two processes were added –
“General primary energy” and “Electricity Supply from Grid”. “General primary energy”
process contains energy inputs required for material production and extraction that are
not provided in the original data but are provided by the supplementary information in
(Hertwich et al. 2015). More specifically, this process captures the non-electricity based
energy required to extract metals like Aluminum, Copper, Nickel, Pig iron and
manufacture materials like glass and metallurgical grade silicon. If the process has an
electricity based energy input, it is added to the “Electricity supply from Grid” process.
The “Electricity supply from Grid” process is used link the electricity input for some
processes in the LCA model to the outputs produced by the model. For example, in the
system-scale LCA model, grid electricity is used as an input to the process that represents
the installation of the cables required for a roof-mounted PV poly-Si electricity
generation system. Using the “Electricity supply from Grid”, the input electricity to the
process the represents installation of cables is linked to the output of the system viz.
electricity from a combination of technologies like Coal, Natural gas, Hydro etc. For the
“Electricity Supply from Grid”, we have assumed that 35% of electricity comes from
Gas, 40% from Coal (IGCC without CCS), 15% Hydro and 10% from PV Poly-Si
(Roof). Using these two processes, and the Waste Heat vector (described later), all direct
and indirect energy required by the LCA model is accounted for.
LCA ASSESSMENT
Matrix based LCA assessment described in (Heijungs and Suh 2002) (Brandt et
al. 2013) is used to perform LCA assessment on the subsystem-scale and system-scale
LCA models developed using the methodology above. Equations (1) and (2) are used to
perform the LCA assessment (Heijungs and Suh 2002) (Brandt et al. 2013)

12
𝐬 = 𝐀−1. 𝐟 (1)
𝐠 = 𝐁. 𝐬 (2)
The f vector represents the demand for the required outputs. 𝐀−1 is the inverse of
the A matrix. s vector is the called the scaling vector. The scaling factor of each of the
unit processes required to produce f in the s vector. The g vector is called inventory
vector and represents the emissions that are a result of meeting the demand of the outputs
in the f vector.
ENERGY RETURN RATIOS
Energy return ratios described in (Brandt et al. 2013, King 2014) are calculated
using LCA system-scale and subsystem-scale models. The energy ratios are categorized
into two types depending on the type of output energy computed – Net and Gross. The
energy ratios are further categorized into two types depending on whether feedstock is
included as an input. Table 1 shows the four types of energy ratios. Factors like Total
Energy Demand, Total Waste Energy and Total Feedstock Energy are calculated in order
to obtain the energy ratios.
Feedstock included as input Feedstock not included as input
Gross Gross Energy Ratio (GER) Gross External Energy Ratio (GEER)
Net Net Energy Ratio (NER) Net External Energy Ratio (NEER)
Table 1: Types of Energy Return Ratios (King 2014)

13
Energy ratios are calculated using two methods. Method 1 is developed based on
the bottom-up framework proposed by (Brandt et al. 2013). Method 2 uses the
methodology proposed in (Arvesen and Hertwich 2015) using CED
Method 1: Based on the Bottom-up framework (Brandt et al. 2013)
Total Energy Output (TEO)
Energy Output, as well as the required outputs of products from non-energy
processes, are represented in the f vector. However depending on the way the processes
are defined, the f vector may possibly include energy outputs that are not represented in
units of energy (like MJ). Typically, outputs like electricity are represented in units of
kWh. In order to convert units of electricity to other energy units (like MJ), a one-
dimensional Energy Conversion Factor (ECF) vector is defined. For a LCA system that
has m process, the size of the ECF vector will be Mx1. Total energy output (TEO) is
obtained by dot product of the f vector and the EFC vector. TEO is computed by the
equation shown in (3).
𝑇𝐸𝑂 = ∑ (𝐟𝑖 . 𝐄𝐂𝐅𝑖)𝑀𝑖=0 (3)
m = Total number of processes defined in the LCA model
fi = ith element of the F vector
ECFi = ith element of the ECF vector
Total Waste Heat (TWH)
Waste Heat (WH) is defined only for primary energy conversion processes that
converts a primary energy feedstock (like coal, natural gas etc) to a form of energy (like
electricity) delivered as an output to meet the demand and also as intermediate inputs to
other processes. For each primary energy Conversion Process (CP), Waste heat obtained
by subtracting the output of the primary energy conversion process from the input

14
primary energy feedstock to that primary energy conversion process as shown in equation
(4).
𝑊𝑎𝑠𝑡𝑒 𝐻𝑒𝑎𝑡𝐶𝑃,𝑖 = 𝑃𝑟𝑖𝑚𝑎𝑟𝑦 𝐸𝑛𝑒𝑟𝑔𝑦 𝐼𝑛𝑝𝑢𝑡𝑖 − 𝐸𝑛𝑒𝑟𝑔𝑦 𝑂𝑢𝑡𝑝𝑢𝑡𝑖 (4)
In matrix form, waste energy from all LCA processes is represented by a 1xM
matrix, where M is the number of processes in the LCA model. Each element of the
matrix is defined as shown in equation (5).
𝑊𝐻𝐶𝑃,𝑖 = {𝑄𝐼𝑖 ∗ 𝐸𝐶𝐹𝐼𝑖 − 𝑄𝑂𝑖 ∗ 𝐸𝐶𝐹𝑂𝑖 (For Energy Conversion Process)
0 (For other processes) (5)
QIi is the quantity of the primary feedstock (like coal/natural gas). This physical
unit of the primary feedstock is converted to MJ using an energy conversion factor ECFIi
(e.g, MJ/kg). QOi is the quantity of the output of the conversion process (like electricity).
This unit is converted to MJ using another appropriate energy conversion factor ECFOi
(e.g., MJ/kWh).
For non-conversion processes, the waste heat from non-electricity sources is
added to the WH vector. For example, for the Aluminum extraction process,
supplementary information of (Hertwich et al. 2015) specifies that the energy input is
4.5MJ/Kg. This is added to the WH vector for the Aluminum extraction process.
The total waste heat (TWH) in a given LCA system depends on the demand and is
obtained by equation (6).
𝑇𝑊𝐻 = 𝑊𝐻. 𝑠 (6)

15
Total Waste Heat from Feedstock (TWHFS)
Waste Heat from Feedstock is defined for every conversion process that takes a
primary feedstock source as an input. In order to identify such conversion processes, a
matrix FS is defined. FS is an Mx1 matrix and the definition of the elements of the matrix
is shown in equation (7).
𝐅𝐒𝑖 = {1 (For Energy Conversion Process)
0 (For other processes) (7)
For each conversion process that takes feedstock as an input, an Efficiency matrix
is also defined. 𝜂 is an Mx1 matrix and the definition of the elements of the matrix is
shown in equation (8).
𝜂𝑖 = {Efficiency (For Energy Conversion Process)
0 (For other processes) (8)
Waste Heat from Feedstock (WHFS) is the energy content from the feedstock that
is dissipated as heat during the conversion process. WHFS for every process is computed
using equation (9).
𝐖𝐇𝐹𝑆,𝑖 = {
0 (if ηi=0)
𝐟𝑖 ∗ 𝐄𝐂𝐅𝑖 ∗ 𝐅𝐒𝑖 ∗ ((1
𝜂𝑖) − 1) (if η
i>0)
(9)
The waste heat from feedstock going directly to the energy output is a function of
the energy carrier. However, the processes in the LCA model are setup such that, the
primary conversion process (like process representing Coal to Electricity) is distinct from
the “Final processes” (like process for electricity generation from Coal-IGCC) for a given
subsystem-scale LCA model. The LCA assessment is performed by setting the demand of

16
the “Final Process” (fi for Final process) to a non-zero value (like 1 KWh). The value of
the demand vector element for the conversion process (fi) is set to zero. In order to avoid
the problem of zeroing-out the waste heat, si is used instead of fi. The input from the
conversion process to the Final process is set to 1. Therefore, si of the conversion process
will be equal to the fi of the final process. Hence, equation is (9) is updated to use si
instead of fi. Therefore, the Waste Heat from Feedstock (WHFS) is computed using
equation (10).
𝐖𝐇𝐹𝑆,𝑖 = {
0 (if ηi=0)
𝐬𝑖 ∗ 𝐄𝐂𝐅𝑖 ∗ 𝐅𝐒𝑖 ∗ ((1
𝜂𝑖) − 1) (if η
i>0)
(10)
Total Waste Heat from Feedstock is the total waste heat from feedstock going
directly to the output and is computed using equation (11).
𝑇𝑊𝐻𝐹𝑆 = ∑ 𝑊𝐻𝐹𝑆,𝑖 𝑀𝑖=0 (11)
Net Energy Ratio (NER)
NER is defined as the ratio of the net energy produced as output, which is
represented as Total Energy Output to the Total Waste Heat produced during generation.
NER is computed using the equation (12).
𝑁𝐸𝑅 = 𝑇𝑜𝑡𝑎𝑙 𝐸𝑛𝑒𝑟𝑔𝑦 𝑂𝑢𝑡𝑝𝑢𝑡 (𝑇𝐸𝑂)
𝑇𝑜𝑡𝑎𝑙 𝑊𝑎𝑠𝑡𝑒 𝐻𝑒𝑎𝑡 (𝑇𝑊𝐻) (12)

17
Gross Energy Ratio (GER)
GER is defined as the gross energy extracted to the total waste energy produced
during generation. The gross energy is defined as the sum of the total energy produced
for output (TED) and the Total Waste Energy produced during generation. GER is
computed using the equation (13).
𝐺𝐸𝑅 = 𝑇𝑜𝑡𝑎𝑙 𝐸𝑛𝑒𝑟𝑔𝑦 𝑂𝑢𝑡𝑝𝑢𝑡+𝑇𝑜𝑡𝑎𝑙 𝑊𝑎𝑠𝑡𝑒 𝐸𝑛𝑒𝑟𝑔𝑦
𝑇𝑜𝑡𝑎𝑙 𝑊𝑎𝑠𝑡𝑒 𝐸𝑛𝑒𝑟𝑔𝑦 (13)
Net External Energy Ratio (NEER)
NEER is a measure of net energy generation without considering energy content
of feedstock as an intermediate energy input that is converted to heat as a component of
Total Waste Heat. The NEER is computed using equation (14). The Total Waste Heat
from Feedstock represents the energy content in the primary feedstock (like coal) that is
converted to an output in Total Energy Output. This is subtracted from the Total Waste
Energy to obtain the total external energy required to meet the energy demand.
𝑁𝐸𝐸𝑅 =
𝑇𝑜𝑡𝑎𝑙 𝐸𝑛𝑒𝑟𝑔𝑦 𝑂𝑢𝑡𝑝𝑢𝑡
(𝑇𝑜𝑡𝑎𝑙 𝑊𝑎𝑠𝑡𝑒 𝐻𝑒𝑎𝑡−𝑇𝑜𝑡𝑎𝑙 𝑊𝑎𝑠𝑡𝑒 𝐻𝑒𝑎𝑡 𝑓𝑟𝑜𝑚 𝐹𝑒𝑒𝑑𝑠𝑡𝑜𝑐𝑘 𝑔𝑜𝑖𝑛𝑔 𝑑𝑖𝑟𝑒𝑐𝑡𝑙𝑦 𝑡𝑜 𝑜𝑢𝑡𝑝𝑢𝑡)
(14)
Gross External Energy Ratio (GEER)
GEER is a measure of gross energy generation without taking feedstock into
consideration. The GEER is computed using equation (15).

18
𝐺𝐸𝐸𝑅 =
(𝑇𝑜𝑡𝑎𝑙 𝐸𝑛𝑒𝑟𝑔𝑦 𝑂𝑢𝑡𝑝𝑢𝑡+𝑇𝑜𝑡𝑎𝑙 𝑊𝑎𝑠𝑡𝑒 𝐸𝑛𝑒𝑟𝑔𝑦−𝑇𝑜𝑡𝑎𝑙 𝑊𝑎𝑠𝑡𝑒 𝐻𝑒𝑎𝑡 𝑓𝑟𝑜𝑚 𝐹𝑒𝑒𝑑𝑠𝑡𝑜𝑐𝑘 𝑔𝑜𝑖𝑛𝑔 𝑑𝑖𝑟𝑒𝑐𝑡𝑙𝑦 𝑡𝑜 𝑜𝑢𝑡𝑝𝑢𝑡)
(𝑇𝑜𝑡𝑎𝑙 𝑊𝑎𝑠𝑡𝑒 𝐸𝑛𝑒𝑟𝑔𝑦−𝑇𝑜𝑡𝑎𝑙 𝑊𝑎𝑠𝑡𝑒 𝐻𝑒𝑎𝑡 𝑓𝑟𝑜𝑚 𝐹𝑒𝑒𝑑𝑠𝑡𝑜𝑐𝑘 𝑔𝑜𝑖𝑛𝑔 𝑑𝑖𝑟𝑒𝑐𝑡𝑙𝑦 𝑡𝑜 𝑜𝑢𝑡𝑝𝑢𝑡)
(15)
Method 2: NER and NEER from CED
ERR is computed using the (Arvesen and Hertwich 2015) method for electricity
generation technologies using the data from (Hertwich et al. 2015). The NER and NEER
are calculated from CED using equations (16) and (17) respectively. (Arvesen and
Hertwich 2015) state that the when energy ratios are calculated the denominator should
contain the energy that is diverted from the society. Energy lost from sources like fugitive
emissions cannot be considered as energy diverted from the society. However, CED
represents the total energy extracted from nature. The energy lost from sources that
cannot be considered as diverted from the society should therefore be subtracted from the
CED. The Energy Output, Fuel Input and Energy lost are computed using the data in the
LCA models and is described in the future sections of this chapter. The CED is used from
the results of the study in (Hertwich et al. 2015).
𝑁𝐸𝑅 =𝐸𝑛𝑒𝑟𝑔𝑦 𝑂𝑢𝑡𝑝𝑢𝑡
𝐶𝐸𝐷 (16)
𝑁𝐸𝐸𝑅 = 𝐸𝑛𝑒𝑟𝑔𝑦 𝑂𝑢𝑡𝑝𝑢𝑡
𝐶𝐸𝐷−(𝐹𝑢𝑒𝑙 𝐼𝑛𝑝𝑢𝑡+𝐸𝑛𝑒𝑟𝑔𝑦 𝑙𝑜𝑠𝑡) (17)
We consider the LCA model for electricity generation from Coal without IGCC,
that we have developed using data from (Hertwich et al. 2015), as an example to compute
NER and NEER. Figure 1 shows a part of the LCA model showing processes that
contributes to the “Energy lost” and also the “fuel input”. The “Plant Operation” process
is the process that represents conversion of coal to electricity.

19
The total fuel input is calculated using equation (18). Waste HeatPO represents the
waste heat released by the “Plant Operation” process. Energy OutputPO represents the
energy output from the “Plant Operation” process. (Arvesen and Hertwich 2015) state
that in order to be consistent, all the factors that make up the energy return ratio should be
in the same heat values unit. From the model, the waste heat of 4.938MJ is released per
kWh (Energy Output = 3.6 MJ) of electricity from the “Plant Operation” process.
Assuming that the waste heat is already in the HHV (High Heating Value), the Energy
Output is converted to HHV from LHV (Low Heating Value) by increasing it by 5%.
𝐹𝑢𝑒𝑙 𝐼𝑛𝑝𝑢𝑡 = 𝑊𝑎𝑠𝑡𝑒 𝐻𝑒𝑎𝑡𝑃𝑂 + 𝐸𝑛𝑒𝑟𝑔𝑦 𝑂𝑢𝑡𝑝𝑢𝑡𝑃𝑂 (18)
𝐹𝑢𝑒𝑙 𝐼𝑛𝑝𝑢𝑡 = 4.938 + (3.6 ∗ 1.05) MJ (19)
The Energy lost from equation (17) is calculated by adding the energy lost by
methane emissions from the “Plant Operation” process and the “Coal Transport” process.
It is calculated by using equations (20) and (21)
𝑀𝑒𝑡ℎ𝑎𝑛𝑒𝑘𝑔 = (1𝐾𝑊ℎ × (1.03 × 10−5)𝑘𝑔/𝐾𝑊ℎ) + (0.3149𝑘𝑔 ×
(8.55 × 10−5)𝑘𝑔/𝑘𝑔) (20)
𝐸𝑛𝑒𝑟𝑔𝑦 𝑙𝑜𝑠𝑡 = 𝑀𝑒𝑡ℎ𝑎𝑛𝑒𝑘𝑔 × 𝐻𝐻𝑉 𝑜𝑓 𝑚𝑒𝑡ℎ𝑎𝑛𝑒 (21)

20
Energy Lost
Final Process -Electricity from Coal
Plant Operation
Coal Transport
3.6 MJ of Electricity
1 kWh of Electricity
0.3149 kg of Coal
8.55E-07 kg of Methane per kg of Coal transported
1.03E-05 kg of Methane per kWh
of electricity
4.938 MJ of waste heat per kWh of
electricity
0.3149 kg of Coal
from Mine
Figure 1: Part of the Coal without IGCC Model showing fuel input & methane emissions
OPEN SOURCE
One of the goals of the thesis is to enable expansion of system-scale LCA model.
The expansion can be achieved by adding data and processes to the A and the B matrices
of the system-scale LCA model.
The open source methodology also enables development of any subsystem-scale
and system-scale LCA models. This goal is achieved by incorporating these design
principles in the methodology –
1. The process attributes are designed to be generic and they can be used to
represent any process uniquely.
2. There are no size limitations to the A and B matrices.

21
3. The process of adding data or new processes to existing LCA models is
designed to be straightforward and simple and is explained in the
Implementation chapter.
4. The merging algorithm that is used to merge subsystem-scale models into a
system-scale LCA model is designed to be generic. Any number of models
can be merged using the algorithm and there is no restriction on the number of
processes or types of processes.

22
Implementation
LCA DATA
Data from the (Hertwich et al. 2015) is used to develop the LCA models in this
thesis. (Hertwich et al. 2015) sub-divided into 21 subsystem-scale technology files
(Microsoft Excel Workbook), each technology file representing a different electricity
generation technology. The data for the following 21 electricity generation technologies
are used –
1. COAL, with IGCC
2. COAL, without IGCC
3. COAL, subcritical with CCS
4. COAL, subcritical without CCS
5. COAL, supercritical with CCS
6. COAL, supercritical without CCS
7. CSP, trough wet-mined syn
8. GAS, NGCC with CCS
9. GAS, NGCC without CCS
10. HYDRO, dam storage, Baker 1 (Aysen)
11. HYDRO, dam storage, Baker 2 (Aysen)
12. PV, CdTe, ground-mounted
13. PV, CdTe, roof-mounted

23
14. PV, CIGS, ground-mounted
15. PV, CIGS, roof-mounted
16. PV, poly-Si, ground-mounted
17. PV, poly-Si, roof-mounted
18. CSP, central tower dry
19. WIND, offshore, gravity-based foundation
20. WIND, offshore, steel foundation
21. WIND, onshore
Each file contains processes defined for a particular electricity generation
technology. Each process is defined as a different spreadsheet in the workbook. Each
process contains inputs from numerous other processes. The processes that input into a
given process are categorized into different types depending on the source of the data –
1. Own System: These are processes provide some input to a given process and
are defined in same LCA model.
2. Ecoinvent: These are processes provide some input to a given process but are
taken from Ecoinvent database. The ecoinvent processes are not defined in the
technology file. Access to the ecoinvent database is required in order to get
the definition of the processes to complete the LCA model.
3. Input-Output Background: These processes mostly represent capital
investment related processes.

24
4. Natural resources: These processes represent the natural resource use like
water and land use. They do not include primary energy natural resources like
coal, natural gas etc.
5. Emissions: These processes represent emissions like CO2, NO2, VOC,
Particulate matter etc
SOFTWARE TOOLS
Matlab is used to develop the LCA system-scale model and perform LCA
assessment on the models. Object oriented Matlab is used to implement the definition of
processes and all code related to parsing the technology files, creation of matrices,
merging subsystem-scale matrices into system-scale matrices and performing net-energy
analysis on the LCA models.
CREATING SYSTEM-SCALE LCA MODEL
The system-scale LCA model is created using the following two steps –
1. The individual technology files (that contain data for subsystems) are parsed
and subsystem-scale LCA models are created. Subsystem-scale LCA models
contain A header-matrix pair, B header-matrix pair and F matrix.
2. The subsystem-scale LCA models are then merged to create a system-scale
LCA model.
Creating subsystem-scale LCA models
A Matlab program called “parse” is developed and is used to create the
subsystem-scale LCA model for every technology. This program takes the technology
workbook file as an input and produces the A header, A matrix, B header, B matrix and
the f vector.

25
The following functionality is implemented in this program –
1. A number of spreadsheets in the excel workbook is read. This will represent
the number of “Own-system” processes to be created for the subsystem.
2. Each spreadsheet is read and a process object is created. All the attributes of
the process object is populated using the data in the sheet. Child processes are
also created for every process that provides an input to the process under
consideration.
3. After all the spreadsheets are read, the model will have a structure as shown in
Figure 29.
4. The A header and A matrix are created by inserting data from all the processes
and their children.
5. The B header and B matrix are created by inserting data from all the
processes.
6. A preliminary f vector is created by setting the demand for the electricity to 1
kWh.
7. The A header, A matrix, B header, B matrix and f vector are created as
separate CSV files.
Figure 2 shows an example of how the “parse” program is run in Matlab taking a
Microsoft Excel workbook file that represents one electricity generation technology. This
file is obtained as part of the data from (Hertwich et al. 2015).

26
Figure 2: Execution of Parse program in Matlab

27
The technology files are Microsoft Excel workbooks that use Visual Basic
Macros. Some of the technology files were not readable by Matlab R2015 on Windows 7.
Such files could only be read using Matlab R2015 on Apple iOS. However, Matlab
running on Apple iOS does not support creation and insertion of individual sheets in an
Excel workbook. While it would have been desirable for the “parse” program to create an
Excel workbook with separate spreadsheets for A header, A matrix, B header, B matrix
and the f vector, this was not possible due to the two problems above. Therefore, the
“parse” program is designed to write the matrices and headers into CSV files. These CSV
files are combined into a single Microsoft Excel workbook manually in order to use the
“merge” program.
Merging subsystem-scale LCA models
The “mergexl” program is used to merge two subsystem-scale LCA models. It
takes two input subsystem-scale LCA models in the form of Microsoft Excel Workbooks
and produces a merged output Microsoft Excel Workbook. Figure 3 shows an example of
how the “mergexl” program is run in Matlab.
Figure 3: Execution of Merge Program in Matlab

28
All the 21 subsystem-scale LCA models are merged taking two at a time as shown
in Figure 35.
SYSTEM-SCALE AND SUBSYSTEM-SCALE LCA ASSESSMENT
A Matlab program called “lca_comp” is developed that will take two Microsoft
Excel Workbooks as an input. The first Excel Workbook contains the LCA model
(mainly A and B matrices). The second Excel Workbook contains the demand vector (F
vector). Figure 4 shows an example of an A header of a LCA model that represents the
generation of electricity from coal shown in Figure 28. The A header contains the
attributes of the processes in the A matrix. Because the A matrix is a square matrix, the
A-header represents the processes in both the X and Y direction. Each row of the A
header represents a process and the cells of the row represent the attributes of the process.
Figure 4: An example of an A-Header worksheet

29
Figure 5 shows an example of an A matrix of the LCA model that represents
electricity generation from Coal. It contains the actual A matrix with processes as defined
by the A header.
Figure 5: An example of an A matrix worksheet
Figure 6 shows an example of the B header of the LCA model that represents
electricity generation from Coal. The B header contains the attributes of the processes in
the B matrix. Each row in the B header list represents an emissions or a waste heat
process. In the X direction, every column of the B matrix is represented by the processes
in the A header list.

30
Figure 6: An example of a B Header
Figure 7 shows an example of the B matrix in the LCA model. It contains the
actual B matrix.
Figure 7: An example of the B matrix
Figure 8 shows an example of the f vector of the LCA model that represents
electricity generation from Coal. The f vector contains only one element per row and it

31
represents the demand for the output of the corresponding process in the same row of the
A header.
Figure 8: An example of the f vector
The “lca_comp” program is run and it will generate the s-matrix and the g-matrix.
These matrices are written into the same Microsoft Excel Workbook as new worksheets.
Figure 9 shows how the “lca_comp” is run using Matlab.
Figure 9: LCA Assessment program execution in Matlab
Figure 10 and Figure 11 show the s and the g vectors that are written into the
same Excel Workbook that contains the f vector, after LCA assessment.

32
Figure 10: An example of the s vector
Figure 11: An example of the g vector

33
SYSTEM-SCALE AND SUBSYSTEM-SCALE ENERGY RETURN RATIOS
A Matlab program “err_comp” is developed to compute the energy return ratios.
In addition to the A, B and F matrices (like lca_comp), the program reads four matrices –
ECF-A, Feedstock, Efficiency and WasteHeat_MJ matrices. The description of these
matrices are provided further in this chapter. The matrices are input to the program using
three input arguments. The first argument is the Microsoft Excel Workbook containing
the LCA model that comprises of the A, B, ECF-A, Efficiency and WasteHeat_MJ
matrices. This is the second input argument to the program is the Excel workbook that
contains the F vector. The third argument to the program is the Excel workbook that
contains the “Feedstock” vector.
The Energy Conversion Matrix (ECF-A) contains the energy conversion factors to
MJ for each row in A. Figure 12 shows an example of the ECF-A matrix of the LCA
model that represents electricity generation from Coal.
Figure 12: An example of the Energy Conversion Factor vector

34
The Feedstock (FS) matrix is used to identify processes that represent primary
conversion of fuel under consideration to electricity. Figure 13 shows the FS matrix of
the LCA model that represents electricity generation from Coal. This is provided as an
input to the err_comp program in order to provide the flexibility to the user to decide
what is considered as feedstock and what is not. For example, when analyzing the
electricity generation from Coal, Natural gas should not be considered as feedstock but
Coal should be considered as feedstock, for the purposes of NEER and GEER
calculations. Similarly, when analyzing the electricity generation from Wind, Coal and
Natural gas should not be considered as feedstock. By making this an argument to the
err_comp program, the methodology provides the flexibility of identifying what fuel
sources are considered as feedstock and what is not.
Figure 13: An example of Feedstock vector

35
The Efficiency matrix contains the efficiency for primary energy conversion
processes. Figure 14 shows an example of the Efficiency matrix of the LCA model that
represents electricity generation from Coal.
Figure 14: An example of Efficiency vector
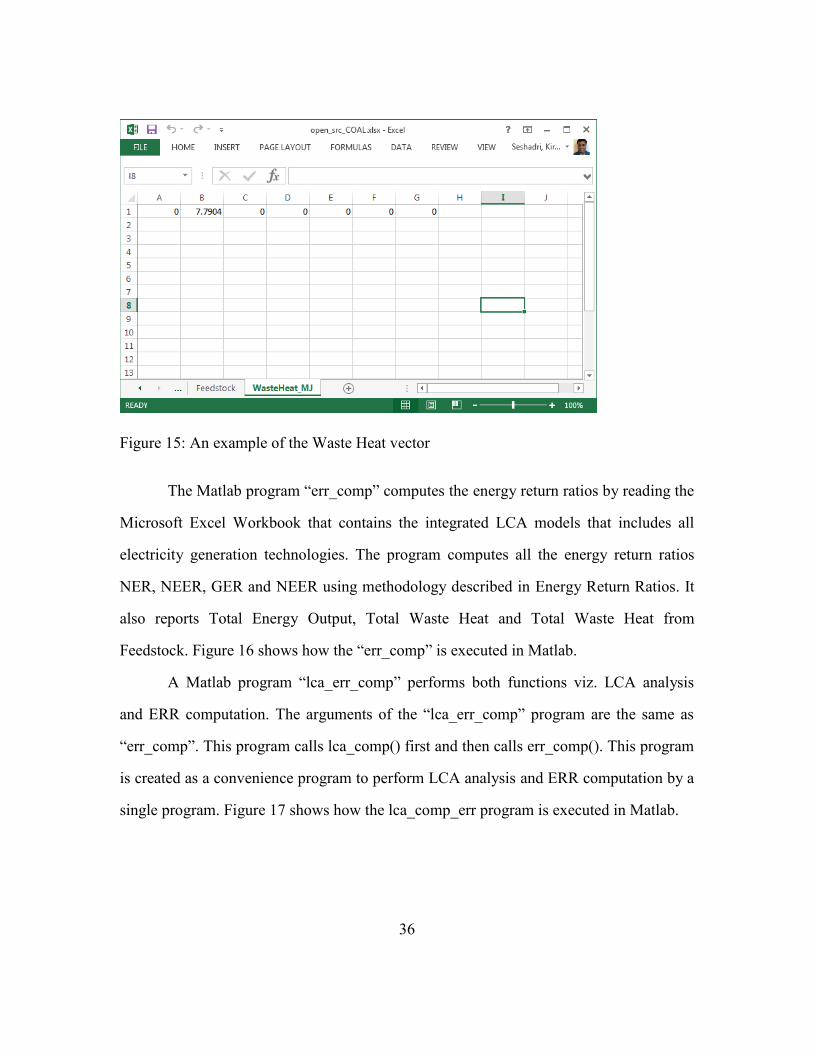
The WasteHeat_MJ matrix represents the Waste Energy for every conversion
process computed as described in Total Waste Heat (TWH). The entries of the
WasteHeat_MJ matrix is in unit Mega Joules. Figure 15 shows an example of the Waste
Energy matrix of the LCA model that represents electricity generation from Coal.
36
Figure 15: An example of the Waste Heat vector
The Matlab program “err_comp” computes the energy return ratios by reading the
Microsoft Excel Workbook that contains the integrated LCA models that includes all
electricity generation technologies. The program computes all the energy return ratios
NER, NEER, GER and NEER using methodology described in Energy Return Ratios. It
also reports Total Energy Output, Total Waste Heat and Total Waste Heat from
Feedstock. Figure 16 shows how the “err_comp” is executed in Matlab.
A Matlab program “lca_err_comp” performs both functions viz. LCA analysis
and ERR computation. The arguments of the “lca_err_comp” program are the same as
“err_comp”. This program calls lca_comp() first and then calls err_comp(). This program
is created as a convenience program to perform LCA analysis and ERR computation by a
single program. Figure 17 shows how the lca_comp_err program is executed in Matlab.

37
Figure 16: Execution of Energy return ratio computation program in Matlab

38
Figure 17: Execution of the lca_err_comp program in Matlab

39
OPEN SOURCE
Open source methodology enables development of any LCA subsystem-scale and
system-scale models. In addition, the open source methodology also enables the
expansion of the merged system-scale LCA model by adding processes to the LCA
model.
Expansion of LCA models by adding processes
The subsystem-scale or system-scale LCA models are expanded by adding
processes to the A and/or B header-matrix pairs. Processes can be added by simply
adding rows and columns to the “A-Header”, “A-matrix”, “B-Header” or “B-matrix”
worksheets of the Microsoft Excel workbook that contains the LCA model. Related
changed to the f vector will be required before performing LCA assessment or ERR
computation.
An example LCA model for generation of electricity from coal is shown in Figure
28. In order to add a process that represents use of steel to the LCA model, a new row is
added to the A-Header. Figure 18 shows the highlighted row that represents process of
steel generation. To restrict the scope of the model, the process of steel generation is
defined to output 1 kg of steel. Additionally, it is defined to consume some amount of
electricity to produce. Lastly, the “Plant infrastructure” process is modified to have a
steel input. These inputs and outputs to the steel generation process is represented in the
A-matrix. The additions to the A-matrix are shown in Figure 19 as highlighted cells. The
emissions related to the steel generation process are added to the B-matrix as shown in
Figure 20 as highlighted cells. The demand F-matrix is also modified to account of the
new process that is added as shown in Figure 21 as a highlighted cell. If energy return

40
ratios have to be computed, the matrices required for ERR computation should also be
accordingly modified.
Figure 18: Addition of a process to the A-Header
Figure 19: Addition of a process to A-matrix

41
Figure 20: Addition of a process to B-matrix
Figure 21: Addition of process to F vector
Development of any subsystem-scale and system-scale LCA models
A generic definition of the “process” class is created to be used to represent any
arbitrary process. A number of customizations that was performed for the “process” class

42
used for developing LCA models from (Hertwich et al. 2015) data is removed to create
the open-source class definition of the “process”. The members of the open-source
version of the “process” class are made generic and the methods are simplified. The
members of the open-source version of the “process” class are –
1. Name – Name of the process
2. Process Type – The types of processes are
3. OUTPUT: processes that represent the output of the LCA mdoel.
4. PRIMARY_ENERGY: processes that represent primary energy sources like
Coal, Natural gas etc
5. SEC_ENERGY: processes that conversion of primary energy to some form of
secondary energy like diesel from oil etc
6. OTHER, NONE: processes that do not fall into any of the above types
7. Attributes 1 through 15: Members to hold attributes of the process
The methods defined in the open-source version of the “process” class are also
made generic in order to operate on any arbitrary process.
In order to define the LCA model, the A matrix, A header, B matrix, B header and
F matrix are created as separate spreadsheets in a single Microsoft Excel Workbook.
Processes can be added to the LCA model by just adding rows and columns to the A
header-matrix pair or the B header-matrix pair. When a process needs to be added to A,
the attributes are entered as a new row in the A header. The “Name” is the 1st attribute
and is mandatory to define the process. All other attributes are optional and are provided
to be used by an LCA system-scale model to uniquely identify the process.

43
Object-oriented Merging is the last step to create a system-scale model. The open-
source version of the “merge” program uses the open-source version of the “process”
class. The algorithm used is same as what is shown in Figure 34. The method in the
“process” class to compare two process objects is made generic in order to compare any
attributes.

44
Results
Twenty-one subsystem-scale LCA models were developed using the data from
(Hertwich et al. 2015). Each subsystem-scale LCA model represents an electricity
generation technology. The models were merged to create a system-scale model with 537
processes in the A matrix representing different energy and material processes and 60
processes in the B matrix representing different emissions processes. LCA assessment
and ERR computation is performed on the subsystem-scale models and on the system-
scale model after merging. The results of the LCA assessment are present in the s vector
and the g vector for the energy demand present in the f vector. The s vector contains the
materials, fuels and primary energy feedstock required to meet the energy demand. The g
vector contains the emissions resulting from emissions resulting from electricity
generation to meet the demand.
RESULTS FROM SUBSYSTEM-SCALE LCA AND ERR COMPUTATION
Material usage for a number of materials like aluminum, concrete, iron, copper, etc are
computed for each technology using the integrated LCA model. A number of
environmental impacts like Green House Gas emissions (GHG), Particulate Matter (PM),
Volatile Organic Compounds (VOC), Oxides of Nitrogen (NOx) etc are also computed
using the integrated LCA model. Aluminum and GHG are taken as an example in this
section because these were included directly and modeled in all the subsystem-scale
models (and not from Ecoinvent). The usage of Aluminum for every electricity
generation technology is shown in Figure 22. Other materials like iron, cement, copper
etc are available for some models but not available for some models because of the use of
Ecoinvent data in the data from (Hertwich et al. 2015). CO2 equivalent greenhouse gas
emissions is measured by adding the amount of CO2 emissions, methane and NO2. The

45
GHG emissions are shown in Figure 23. Other emissions like VOC, PM, Carbon
monoxide and water vapor are also computed but these are not available for all the
subsystem-scale models.
The energy return ratios are computed for every technology using the integrated
LCA model. Table 2 shows the Total Energy Output, Total Waste Heat, and Total Waste
Heat from Feedstock. The efficiency for the conversion processes for each LCA model is
also provided in the Table 2 and is obtained from data provided by supplementary
information of (Hertwich et al. 2015).
Table 3 shows the results of the NER and NEER values (Region: US and Year:
2010) computed using (Arvesen and Hertwich 2015) for all electricity generation
technologies LCA models developed in this thesis.

46
Figure 22: Subsystem-scale Aluminum Material Usage (Region: US, Year: 2010)
0.310.30
0.00
0.08
0.00
0.08
0.04
0.06
0.00 0.00
0.05
0.030.01
0.03 0.02 0.030.04 0.03 0.03
0.00 0.000.00
0.05
0.10
0.15
0.20
0.25
0.30
0.35Aluminum Material usage (kg/MWh)

47
Figure 23: Subsystem-scale GHG Emissions (Region: US, Year: 2010)
156.67 147.36
1.68 2.15 1.86 2.34 1.16 8.61 0.00 0.00 0.30 3.67 3.67
860.18
726.67
805.66
126.27 113.68 115.96
365.00
42.65
0.00
100.00
200.00
300.00
400.00
500.00
600.00
700.00
800.00
900.00
1000.00CO2 Emissions (kg/MWh)

48
η Total
Energy
Output
(MJ)
Total
Waste
Heat
(MJ)
Total Waste
Heat from
Feedstock
(MJ)
NER NEER GER GEER
PV, Poly-Si, roof NA 3.6 1.5088 0.00 2.39 2.39 3.39 3.39
PV, Poly-Si, ground NA 3.6 1.4106 0.00 2.55 2.55 3.55 3.55
PV, CIGS, roof NA 3.6 0.0252 0.00 142.86 142.86 143.86 143.86
PV, CIGS, ground NA 3.6 0.8032 0.00 4.48 4.48 5.48 5.48
PV, CdTe, roof NA 3.6 0.0453 0.00 79.47 79.47 80.47 80.47
PV, CdTe, ground NA 3.6 0.8481 0.00 4.24 4.24 5.24 5.24
CSP, trough NA 4.61E+10 4.42E+09 0.00 10.43 10.43 11.43 11.43
CSP, tower NA 4.08E+10 5.46E+09 0.00 7.48 7.48 8.48 8.48
HYDRO, Baker 1 NA 8.33E+11 6.67E+09 0.00 124.79 124.79 125.79 125.79
HYDRO, Baker 2 NA 4.54E+11 4.91E+09 0.00 92.45 92.45 93.45 93.45
WIND, onshore NA 3.6 9.2458 0.00 0.39 0.39 1.39 1.39
WIND, offshore, steel NA 3.6 4.1409 0.00 0.87 0.87 1.87 1.87
Table 2 continued on next page

49
WIND, offshore, gravity NA 3.6 4.1409 0.00 0.87 0.87 1.87 1.87
COAL, subcritical wo CCS 0.382 3.6 6.204 5.8241 0.58 9.48 1.58 10.48
COAL, IGCC wo CCS 0.436 3.6 4.9761 4.6569 0.72 11.28 1.72 12.28
COAL, SCPC wo CCS 0.407 3.6 5.5856 5.2452 0.64 10.58 1.64 11.58
COAL, subcritical w CCS 0.272 3.6 10.1771 9.6353 0.35 6.64 1.35 7.64
COAL, IGCC w CCS 0.322 3.6 7.962 7.5455 0.45 8.64 1.45 9.64
COAL, SCPC w CCS 0.294 3.6 9.1004 8.6449 0.40 7.90 1.40 8.90
GAS, NGCC wo CCS 0.556 3.6 4.4625 2.8748 0.81 2.27 1.81 3.27
GAS, NGCC w CCS 0.474 3.6 5.8378 3.9949 0.62 1.95 1.62 2.95
Table 2: Subsystem-scale Energy Return Ratios Results (using Method 1) (Region: US, Year: 2010)

50
Technology CED
(MJ/K
Wh)
Waste heat
from Primary
Conversion
Process
(MJ/KWh)
Fuel Input
for Primary
Conversion
Process
(MJ/KWh)
Total
Methane
emitted
(kg/KWh)
Energy lost
(MJ)
(methane heat
value 55.5
MJ/kg)
NER NEER
PV, Poly-Si, roof 0.8656 0 0 1.764E-06 9.79E-05 4.16 4.16
PV, Poly-Si, ground 0.8808 0 0 2.360E-06 1.31E-04 4.09 4.09
PV, CIGS, roof 0.3058 0 0 1.901E-08 1.06E-06 11.77 11.77
PV, CIGS, ground 0.3756 0 0 8.028E-07 4.46E-05 9.58 9.59
PV, CdTe, roof 0.2343 0 0 2.107E-08 1.17E-06 15.36 15.36
PV, CdTe, ground 0.3008 0 0 8.319E-07 4.62E-05 11.96 11.97
CSP, trough 0.3641 0 0 3.450E-08 1.91E-06 9.89 9.89
CSP, tower 0.6399 0 0 9.732E-08 5.40E-06 5.63 5.63
Table 3 continued on next page

51
HYDRO, Baker 1 1.9264 0 0 1.368E-11 7.59E-10 1.87 1.87
HYDRO, Baker 2 0.1391 0 0 2.508E-11 1.39E-09 25.89 25.89
WIND, onshore 0.1704 0 0 3.422E-09 1.90E-07 21.13 21.13
WIND, offshore, steel 0.2489 0 0 2.137E-08 1.19E-06 14.47 14.47
WIND, offshore, gravity 0.2544 0 0 2.137E-08 1.19E-06 14.15 14.15
COAL, subcritical wo CCS 9.838 6.18 9.96 1.130E-05 6.28E-04 0.37 -29.59
COAL, IGCC wo CCS 8.468 4.938 8.718 1.056E-05 5.87E-04 0.43 -14.37
COAL, SCPC wo CCS 9.226 5.56 9.34 2.976-07 1.65E-05 0.39 -31.57
COAL, subcritical w CCS 14.16 10.15 13.93 1.543E-05 8.57E-04 0.25 15.75
COAL, IGCC w CCS 11.42 6.663 10.443 3.748E-07 2.08E-05 0.32 3.67
COAL, SCPC w CCS 13.05 9.08 12.86 1.158E-06 6.43E-05 0.28 18.82
GAS, NGCC wo CCS 8.03 3.59 7.37 8.575E-09 4.76E-07 0.45 5.45
GAS, NGCC w CCS 9.519 4.819 8.599 9.967E-09 5.53E-07 0.38 3.91
Table 3: NER and NEER using Method 2 (Arvesen and Hertwich 2015) (Region: US, Year: 2010)
52
RESULTS FROM SYSTEM-SCALE LCA AND ERR COMPUTATION
The system-scale integrated LCA model contains all the processes from 21
subsystem-scale LCA models. The demand for the system-scale LCA model is obtained
using electricity generation mix provided by the International Energy Agency (IEA) Blue
map scenario for 2050 (IEA 2010) similar to the demand used in (Hertwich et al. 2015).
Table 4 shows the demand of electricity from various generation technologies derived
from the Blue map scenario for the year 2050 (IEA 2010). The electricity demand from
various electricity generation technologies for the year 2050 is added to the F vector of
the system-scale LCA model. The LCA assessment and ERR computation is performed
using the system-scale LCA model. Table 5 shows selected materials and selected
emissions required to meet the supply.
The Efficiency, Waste Energy and Feedstock matrices are merged into the
system-scale LCA model. ERR computation is performed on the system-scale LCA
model. The Table 6 shows the results of the ERR computation.

53
Electricity Generation Technology Electricity Demand (TWh)
PV, Poly-Si, roof 247.9
PV, Poly-Si, ground 247.9
PV, CIGS, roof 1053.5
PV, CIGS, ground 1053.5
PV, CdTe, roof 1053.5
PV, CdTe, ground 1053.5
CSP, trough 123.9
CSP, tower 123.9
HYDRO, Baker 1 2667
HYDRO, Baker 2 2667
WIND, onshore 1638
WIND, offshore, steel 1638
WIND, offshore, gravity 1638
COAL, subcritical wo CCS 1275
COAL, IGCC wo CCS 1275
COAL, SCPC wo CCS 1275
COAL, subcritical w CCS 1529
COAL, IGCC w CCS 1529
COAL, SCPC w CCS 1529
GAS, NGCC wo CCS 4283
GAS, NGCC w CCS 1815
Table 4: System-scale Electricity Demand for 2050 scenario (Year: 2050)

54
Materials
Aluminum 24.1 Million Metric tonnes/yr
Copper 1.3 Million Metric tonnes/yr
Emissions
CO2 Equivalent 85868.6 Million Metric tonnes/yr
Particulate matter (< 2.5 microns) 36.4 Million Metric tonnes/yr
Table 5: System-scale Material usage and emissions (Year: 2050)
Total Energy Output 1.033 x 10¹⁶ MJ
Total Waste Heat 4.5191 x 10¹⁵ MJ
Total Waste Heat from Feedstock 4.1618 x 10¹⁵ MJ
Net Energy Ratio 2.2852
Net External Energy Ratio 28.909
Gross Energy Ratio 3.2852
Gross External Energy Ratio 29.909
Table 6: System-scale Energy Return Ratios (Year: 2050)

55
Discussion
The data obtained from (Hertwich et al. 2015) uses inputs from the Ecoinvent
database. The LCA models developed using the data from (Hertwich et al. 2015) contain
processes that represent the inputs from Ecoinvent. However, because of lack of access to
the Ecoinvent during the development of this research, all the elements of the column
(except the diagonal elements) of the A-matrix representing an Ecoinvent process are set
to zero. This means, to produce a unit of output from the Ecoinvent process, there are no
material or energy inputs required and there are no emissions from these processes. In
other words, some energy and other inputs required to produce these materials are not
accounted for in the system-scale LCA model. Therefore, the material usage and
emissions reported by the subsystem-scale and system-scale LCA models developed in
this research are under-counted. However, using the “General primary input” and the
“Electricity Supply mix” processes, we have attempted to resolve the problem and
attempt to consider all direct and indirect energy sources.
Figure 24 shows a comparison of Aluminum usage between the results obtained by LCA
assessment developed in this thesis to the Aluminum usage reported by (Hertwich et al.
2015). The usage of Aluminum (Figure 22) per MWh obtained from the LCA assessment
of every electricity generation technology is less than the Aluminum usage per MWh
reported in (Hertwich et al. 2015) because of the exclusion of Ecoinvent data from our
models. However, the trend of Aluminum usage among the different models appears to
be the same as the results from (Hertwich et al. 2015). For example, the usage of
Aluminum for electricity generation from Solar PV roof-mounted is less than the usage
of Aluminum for electricity generation from IGCC Coal in the results from this thesis and
from (Hertwich et al. 2015). Figure 25 shows a comparison of CO2 equivalent GHG

56
emissions between the results obtained by LCA assessment of the system-scale LCA
model developed in this thesis to the CO2 equivalent GHG emissions reported by
(Hertwich et al. 2015). The CO2 equivalent GHG emissions per MWh of electricity
(Figure 23) computed from the subsystem-scale LCA assessment for most of the
electricity generation technology is less than the CO2 equivalent GHG emissions per
MWh of electricity reported in (Hertwich et al. 2015) because of exclusion of Ecoinvent
data from our models. However, the trend of CO2 equivalent GHG emissions among the
different models appears to be the same as the results in (Hertwich et al. 2015). The GHG
for Solar PV Poly-Si calculated from our model is greater than (Hertwich et al. 2015)
because the Solar PV Poly-Si uses electricity from the grid. Because of the use of the
“Electricity Supply from Grid”, this electricity will inturn be supplied by the combination
of mainly Natural gas (35%) and Coal (40%) sources. As a result, the GHG for Solar PV
Poly-Si in our model is high. In (Hertwich et al. 2015), it not clear what is the supply mix
of grid electricity used.
Most of the subsystem-scale LCA models developed in this thesis are based on
outputting a unit of electricity. However, the subsystem-scale CSP and Hydro LCA
models are based on outputting a CSP or Hydro power plant respectively. For CSP, two
types of power plants are modelled and a lifetime of 30 years is assumed similar to the
(Hertwich et al. 2015). Supplementary data of (Hertwich et al. 2015) also provides annual
electricity generation from these plants. Using the lifetime and the annual electricity
generation, the material use and emissions per unit of electricity is computed for CSP
subsystem-scale LCA models. For Hydro, two reservoirs are modelled and a lifetime of
80 years is assumed similar to the (Hertwich et al. 2015). Supplementary data of
(Hertwich et al. 2015) also provides the capacity of the power plants. The capacity factor
of about 0.5 is assumed for the power plants. Using the capacity, capacity factor and the

57
lifetime of the power plant, material use and emissions per unit of electricity is computed
for Hydro subsystem-scale LCA models.
Table 7 shows a comparison of the energy return ratios computed using (Arvesen
and Hertwich 2015) method (Method 2) with the energy return ratios computed using the
methodology developed in this thesis (Method 1 based on (Brandt et al. 2013)). NER, for
all fossil fuel technologies and some renewable technologies (CIGS-ground, CdTE-
ground, Hydro and CSP), from Method 1 and Method 2 match closely but the NER
computed from Method 1 is greater than NER computed from Method 2. This is possibly
due to the exclusion of energy sources like diesel, oil or natural gas in some models
because they are input in physical units (like kg, m3) instead of purely energy units (like
MJ). Including these energy sources into the Waste heat vector will decrease the NER
computed by Method 1. The inclusion of the energy sources that are provided in physical
units is taken as a goal of future research. NER computed using Method 1 for some
technologies (PV Poly-Si, CIGS-ground, CdTE-ground, Wind) is lower than the NER
computed using Method 2. One possible reason for this is the use of electricity from the
grid and the difference in the supply mix assumptions between the Method 1 and 2.
The NEER from Method 2 has resulted in values that are not in the expected
range of acceptable values. NEER for Subcritical wo CCS, IGCC wo CCS and SCPC wo
CCS are negative numbers (-29.59, -14.37 and -31.57 respectively), which is not
expected. The NEER is –ve because the denominator of Equation (17) is –ve. The factors
of that make up the denominator are the CED, Fuel input and the Energy Lost and they
are used directly from the data provided by supplementary information of (Hertwich et al.
2015). The main reason the CED is –ve is because CED is greater than the calculated
Fuel input. CED cannot be greater than the Fuel input to maintain energy balance.
Therefore, there is reason to believe that there are inconsistencies in the CED and Fuel

58
input factors that arise possibly from the large inconsistencies of the heating values of
Coal from Ecoinvent. (Arvesen, personal email communication, Nov 09 2015).
The results from the system-scale LCA assessment is mainly driven by the energy
mix in the demand matrix of the system-scale LCA model. The system-scale LCA results
are not compared with (Hertwich et al. 2015) because the energy mix used for system-
scale LCA computation is not known. For example, the Blue map 2050 scenario demand
of electricity from Wind is 4916 TWh (IEA 2010). However, it does not provide the
demand from onshore wind, offshore wind – steel foundation and offshore wind – gravity
foundation. In this thesis, the demand for electricity from different sources of wind-based
electricity generation is split evenly (33% each). However, the demand for electricity
from different sources of wind-based electricity generation used in (Hertwich et al. 2015)
is unknown. Another example is, even though the total amount of energy from coal is
known, the energy demand for IGCC wo CCS, Supercritical wo CCS, Supercritical w
CCS and Subcritical wo CCS is not known. Even though the energy mix is made as
similar to (Hertwich et al. 2015) as possible, difference in energy mix within the same
type of electricity producing technology may result in a large difference in material use
and environmental impact. For example, differences in demand from PV Poly-Si will
have big differences in the Aluminum usage because of the relatively high Aluminum per
MWh for PV Poly-Si. Also, the difference in assumptions like the capacity factor and the
electricity gird’s supply mix will have impact on the material use and environmental
impact results. Additionally, when the material use and environmental results from the
same integrated LCA model aligns with (Hertwich et al. 2015), it can be assumed that,
when the supply mix is the same, the results from our system-scale LCA analysis should
also align with (Hertwich et al. 2015). Therefore, the system-scale material use and
environmental impact results are not compared to (Hertwich et al. 2015).

59
Figure 24: Comparison of Aluminum usage with (Hertwich et al. 2015) (Region: US, Year: 2010)
0.31 0.30
0.00
0.08
0.00
0.08
0.040.06
0.00 0.00
0.050.03
0.010.03 0.02 0.03
0.04 0.03 0.03
0.00 0.00
0.420.40
0.10
0.53
0.10
0.54
0.17
0.10
0.06
0.02
0.060.03 0.05
0.110.09 0.10
0.16
0.130.15
0.010.01
0.00
0.10
0.20
0.30
0.40
0.50
0.60Aluminum Material usage (kg/MWh)
Reference Data from(Hertwich et al. 2015)

60
Figure 25: Comparison of GHG emissions with (Hertwich et al. 2015)(Region: US, Year: 2010)
156.67 147.36
1.68 2.15 1.86 2.34 1.16 8.61 0.00 0.00 0.30 3.67 3.67
860.18
726.67
805.66
126.27 113.68 115.96
365.00
42.6556.97 57.51 19.54 24.25 16.07 20.64 27.78 40.94
117.818.54 12.12 17.45 17.23
909.50
758.34
848.04
218.59 157.12194.65
516.73
228.74
0.00
100.00
200.00
300.00
400.00
500.00
600.00
700.00
800.00
900.00
1000.00CO2 Emissions (kg/MWh)
Reference Data from (Hertwich et al.2015)

61
Figure 26: NER Comparison
2.39 2.55
142.86
4.48
79.47
4.24
10.437.48
124.79
92.45
0.39 0.870.87
0.58 0.72 0.64 0.35 0.45 0.40 0.81 0.624.16 4.09 11.77
9.58 15.3611.96 9.89
5.631.87
25.8921.13
14.47 14.15
0.37 0.43 0.39 0.25 0.32 0.28 0.45 0.380.00
20.00
40.00
60.00
80.00
100.00
120.00
140.00
160.00Net Energy Ratio
Using our methodology (Method 1)
Using (Arvesen and Hertwich 2015) (Method 2)

62
Our method (Method 1) ERR from CED (Method 2)
NER NEER NER NEER
PV, Poly-Si, roof 2.39 2.39 4.16 4.16
PV, Poly-Si, ground 2.55 2.55 4.09 4.09
PV, CIGS, roof 142.86 142.86 11.77 11.77
PV, CIGS, ground 4.48 4.48 9.58 9.59
PV, CdTe, roof 79.47 79.47 15.36 15.36
PV, CdTe, ground 4.24 4.24 11.96 11.97
CSP, trough 10.43 10.43 9.89 9.89
CSP, tower 7.48 7.48 5.63 5.63
HYDRO, Baker 1 124.79 124.79 1.87 1.87
HYDRO, Baker 2 92.45 92.45 25.89 25.89
WIND, onshore 0.39 0.39 21.13 21.13
WIND, offshore, steel 0.87 0.87 14.47 14.47
WIND, offshore, gravity 0.87 0.87 14.15 14.15
COAL, subcritical wo CCS 0.58 9.48 0.37 -29.59
COAL, IGCC wo CCS 0.72 11.28 0.43 -14.37
COAL, SCPC wo CCS 0.64 10.58 0.39 -31.57
COAL, subcritical w CCS 0.35 6.64 0.25 15.75
COAL, IGCC w CCS 0.45 8.64 0.32 3.67
COAL, SCPC w CCS 0.40 7.90 0.28 18.82
GAS, NGCC wo CCS 0.81 2.27 0.45 5.45
GAS, NGCC w CCS 0.62 1.95 0.38 3.91
Table 7: Comparison of ERR results from Method 1 and Method 2

63
Conclusion
The methodology presented in this thesis has resulted in the development of a
system-scale LCA model that includes 21 different electricity producing technologies.
The programs developed using this methodology have enabled LCA assessment and
energy return ratio computations at system-scale and subsystem-scale. Two
methodologies were developed to calculate energy return ratios using the LCA models.
An open source methodology was developed to enable improvement of the system-scale
LCA model.
The absence of data from Ecoinvent database has resulted in undercounting the
material use and energy factors viz. waste heat, total energy consumed and total energy
from feedstock. The energy ratios calculated using the bottom-up methodology
developed in this thesis (Method 1) are not as complete as they can be because of absence
of inputs from the Ecoinvent database. This results in many energy inputs missing and
therefore, the energy ratios are not actually representative of the real system. The energy
ratios calculated by Method 1 are higher than the energy ratios of the real system. The
goal of future research is to complete the model by adding data that is not currently
included.
The computation of energy ratios using CED values (Method 2) was performed
because the energy factors are undercounted in Method 1, due to the exclusion of inputs
from the Ecoinvent database. However, some NEER values calculated using Method 2
have resulted in negative values. Negative values for energy ratios are incorrect and
represents energy imbalance, which is physically not possible. The factors that make up
the denominator of the NEER (Equation 17) is a negative number. The factors that make
up the denominator are the CED, Fuel input and the Energy Lost, and they are used

64
directly from the data provided by (Hertwich et al. 2015). The main reason the CED is
negative is because CED is greater than the calculated Fuel input. CED cannot be greater
than the Fuel input to maintain energy balance. This indicates there are inconsistencies in
the relationships between CED and waste heat values provided by (Hertwich et al. 2015).
Reconciling the energy balance information for full LCAs that use Ecoinvent and
economic input information, is thus a priority for future research.

65
Appendix A
BACKGROUND OF OBJECT ORIENTED METHODOLOGY
Objected Oriented Methodology (OOM) is a programming model where the
functionality is implemented using objects as the fundamental data structures to store data
and logical procedures. OOM provides significant benefits compared to conventional
sequential programming models. Apart from some advantages related to actual process of
developing the source code and managing the source code, OOM provides important
advantages like reusability, interoperability and scalability. Objects are defined by
defining classes. Classes can be reused either by adding more members and methods to
the class or by using inheritance. Inherited objects from same parent class provide
interoperability. Large data sets and complex functions can be implemented using OOM
and modern simulators run object oriented programs very efficiently due to the use of
garbage collection. Therefore, programs developed using OOM are scalable.
The fundamental data structure of an OOM program is an object. An object is
defined by a class. An instance of a class is an object. Objects contain members and
methods. Members are variables that are used to hold data. Methods are functions that are
used to implement arithmetic and logical operations on the data of the object. Objects can
hold objects of the same kind or different kind using handles. This is an important
property that enables programmers to build scalable models.
The system under consideration is designed as a system of inter-dependent
processes. Each process is a finite system that consumes some inputs and produces some
output. In order to represent a system, a number of processes are defined with well-
defined relationships in terms of the inputs and outputs of between processes.

66
LCA PROCESS AS AN OBJECT
A process is the fundamental data-structure using which the LCA model is
developed. In the context of a class-based object oriented methodology, the process is
defined by a class and the class includes all the attributes of a LCA process. Some of the
basics attributes of the process object are shown in Table 8. A process can have
additional attributes as shown in Table 9. Using all the attributes of a process, the process
can be uniquely identified in a LCA model.
Basic Process
Attributes
Description
Name Name of the process
Output Unit Unit of the output generated by the process
Output Quantity For a given object, the amount of the output for which the
process is characterized
Table 8: Basic Process Attributes
Other Process
Attributes
Description
Process Type Output/Input/Natural resources etc
Category Process Category (Construction, materials etc)
Subcategory Process Sub-category (concrete generation, metal extraction
etc)
Source of Data Own model/Ecoinvent etc
Table 9: Other Process Attributes

67
LCA SYSTEM AS TREE OF PROCESSES
A LCA system is modelled as a collection of a number of process objects. There
is a finite relationship between processes in terms of the inputs and outputs of the
processes. A given process of a system can have inputs from a number of processes. In
order to represent this relationship in the object oriented methodology, the process is
designed to have one or more children process objects. These children processes are
linked to the parent using object handles. An object handle is used to represent the
relationship between the child process object from a parent process object. It is used to
programmatically link the parent object and the child object. Table 10 shows the
additional attributes that are required to store data related to child processes. Table 11
shows an example of a system with multiple processes and their relationships.
Process Attributes for representing Children Description
Handles for Children Handles for Child process objects
Number of Children Number of Child processes
Table 10: Process Attributes for Representing Children

68
Final Process
Process B
Process A
Process C
Process AB1
Process A1
Process C1
Process B1
Figure 27: LCA Process Tree
When modeling a LCA system, a final process-object is created first and it
represents the process which produces the final unit of output under analysis. This final
process-object will have one or more children, each one providing some amount of the
input to be used in the final process-object. These process-objects are represented as
Process A, B and C in the Figure 27. These children process-objects will in-turn have
their own children process-objects that represents inputs going into the child process.
These process-objects are represented as Process A1, AB1, B1 and C1. Therefore, the
LCA system is built as a tree of process-objects with the top node of the process-object
representing the final process of the system.
Figure 28 shows an example LCA system modeling generation of electricity from
coal. The LCA system has 7 processes. The LCA model of the system depicting the
various relationships between processes is shown in Table 11. The descriptions of the
processes are –

69
1. Final process: Final process represents the unit of electricity generated by the
coal generation process. It has three children viz. Plant Infrastructure, Plant
Operation and Cabling. These child processes represent the inputs to the Final
process to generate a unit of electricity which is primary outputs of the model.
2. Plant operation process: The Plant operation represents the process that
involves conversion of coal to electricity. Plant operation process has one
child viz. the Coal Extraction process.
3. Plant Infrastructure: Plant infrastructure represents the requirement of having
to construct the coal plant. In this example, it has one child process viz. the
aluminum required to developing the plant infrastructure.
4. Cabling: Cabling represents the process of installing cables in order to provide
electricity produced by the plant to the grid. It has one child process viz. the
aluminum required to developing cabling.
5. Aluminum Generation: This process represents the generation of aluminum.
This process has one child process viz. the electricity input required for
aluminum generation.
6. Coal Extraction: This process represents the extraction of coal to be used in
the Plant operation. This process has one child process viz. the coal from the
coal-mine.
7. Coal from Mine: This process represents the coal extracted from the mine.
This process does not have any children and it represents one of the primary
energy inputs to the LCA system.

70
Final Process (Electricity from Coal)
Plant Infrastructur
e
Plant Operation
Cabling
Aluminum Production
Coal Extraction
Electricity from Plant Operation
One Coal Plant
Cables for Transmission
Extracted Coal
Aluminum for Plant
Infrastructure
Aluminum for Cabling
Electricity for Aluminum Production
Electricity for Cabling
Coal From Mine
Coal from Mine
Figure 28: Cyclic LCA System Tree for Electricity Generation from Coal

71
Name Output Output
Unit
Output
Quantity
Number
of
children
Children
Final Process -
Electricity from
Coal
Electricity KWh 1 3 Plant Infrastructure,
Plant Operation,
Cabling, Cabling
Plant Operation Electricity KWh 1 1 Coal Extraction
Plant
Infrastructure
Coal Plant coal
plant
1 1 Aluminum Extraction
Cabling Aluminum Kg 1 1 Aluminum Extraction
Aluminum
Generation
Aluminum Kg 1 1 Electricity from Coal
Coal Extraction Coal Kg 1 1 Coal from Mine
Coal from Mine Coal Kg 1 0 NA
Table 11: Processes of LCA System for Electricity Generation from Coal
LCA models will have relationships from outputs of the some processes to inputs
to some processes. In a LCA model tree, if there is a relationship between a parent
process and its child process such that, the output of a given parent process is an input to
a child process then, the model is said to be cyclic tree. The computational complexity
when creating and parsing models will be very high because of the cyclic nature of the
LCA models.
In order to reduce the computational complexity, the model is converted to a
flattened model. The computation complexity is reduced because, in the flattened model,

72
there is only one level of relationship for a given process. Processes have children but do
not have grandchildren. The flattened model will have a set of handles to all the processes
modeled in the system. The cyclic LCA model shown in example Figure 28 is converted
to a flattened model shown in Figure 29.

73
All Processes in the System
Final Process
(Electricity from Coal)
Plant Infrastruct
ure
Plant Operation
CablingAluminum Extraction
Coal Extraction
Electricity from Plant Operation
Coal Plant
Cables for Transmission Extracted
Coal
Aluminum for Plant
Infrastructure
Aluminum for Cabling
Electricity for
Aluminum Production
Electricity for Cabling
Aluminum Production
Final Process
(Electricity from Coal)
Final Process
(Electricity from Coal)
Plant Operation
Plant Infrastruct
ureCabling
Coal Extraction
Aluminum Production
Coal From Mine
Coal from Mine
Figure 29: Flattened LCA System for Electricity Generation from Coal

74
BUILDING THE LCA SYSTEM-SCALE MODEL
The system-scale model is designed as a set of individual LCA subsystem-scale
models using a bottom-up methodology. Each subsystem-scale represents a different
electricity generation technology. The subsystem-scale models are first built and these
subsystem-scale models are then merged in order to obtain a single, unified system-scale
model. Data from (Hertwich et al. 2015) is used for building subsystem-scale models.
Creating subsystem-scale LCA models
A subsystem-scale LCA model has a restricted scope. It is modeled as a set of
processes pertaining to the output under consideration at the subsystem-level boundary.
An algorithm shown in Figure 30 is used to create the subsystem-scale model. All the
processes of the subsystem are converted to process-objects starting from the final
process of a subsystem. Each process-object, after creation, is added to a list of processes.
The list of processes contains all processes that belongs to the subsystem.
The algorithm to convert a process to a process-object is shown in Figure 31. For
a given process of a subsystem, the process-object is first created using object oriented
methodology by creating an instance of the process class. After the object is created, all
the required attributes of the process are set using the process’s attributes. For all the
inputs to the process, child processes are created. The child processes are created by
creating instances of the process class. The process contains a list of handles of the child
processes and a variable to denote the number of children. The quantity of the input
required to generate one unit of the output is copied into the child process along with
other attributes of the child process. The handle of this child process is added to the list of
children in the parent process. The number of children for the process is also

75
incremented. Because the subsystem LCA model is flattened, there is no requirement to
create the grandchildren of the process under consideration.
Start
Convert pathway to process-object
Add this process object to list of processes in the subsystem
Are there more processes?
EndNo
Yes
Figure 30: Algorithm to create process-objects in a LCA model

76
Start
Create Process Object
Read pathway data for Process
Are there more child processes?
Create Child Process Object
Read pathway data for Child Process
Populate Child Process attributes (name, output unit, output quantity, category
etc)
Add this process object to list of Child processes & Increment number of
children
End
No
Yes
Populate Process attributes (name, output unit, output quantity, category
etc)
Add this process object to list of processes in the subsystem
Figure 31: Algorithm to Convert a Process to a Process-Object
Conversion of subsystem-scale LCA tree to matrices
The processes of the subsystem-scale LCA model is converted to the A and B
header-matrix pairs format using an algorithm that processes one process at a time. The A

77
and B matrices are used to LCA assessment and ERR computation (Heijungs and Suh
2002). The A matrix is the technology matrix and it contains economic flows that include
energy and material flows. The B matrix is the intervention matrix and it contains
environmental flows that include emissions flows (Heijungs and Suh 2002).
Creating the A header-matrix pair
The A header-matrix pair contains all the energy and material processes a given
subsystem. The A header-matrix pair has two parts – A-header and the A-matrix. The A-
header is a list of process-objects whose data is present in the matrix – one for every row
in the A-matrix. Because the A-matrix is a square matrix, the A-header is also the header
every column in the A-matrix. The A-matrix is the actual matrix that contains the
quantities. The separation of the header and matrix facilitates easier implementation using
tools like Matlab. The rows represent processes that provides inputs to the processes
present in the columns.
The algorithm to update the A header-matrix pair is shown in Figure 32. Before
the algorithm starts, the A-matrix is an empty matrix and the A-header is an empty list of
processes. The final process is first added to the A-header. The final process will be the
first row and first column of the A matrix. All the children of the final process are then
added as rows to the A header-matrix pair. It is important to note that all the quantities
from the child processes are added in the column of the parent process. Following the
final process, all the other processes of the LCA subsystem and their children are added
or updated into the A header-matrix pair.

78
Start
Get process object
Update A or B header-matrix pair with process object
Does process have children
End
No
Yes
Get child process
Update A or B header-matrix pair with child process object
Does process have more children
Are there more processes in subsystem
Yes
Yes
No
No
Figure 32: Algorithm to Convert all process-objects to A & B header-matrix pair

79
The algorithm to update or add a given process to the A header-matrix pair is
shown in Figure 33. When a parent process is being updated or added into the A header-
matrix pair, a column is added to the A-matrix and all elements of the column are set to 0.
The addition of the column is not performed for child processes. The quantities from
child processes are added into the same column as the parent. A variable called col_num
is maintained to keep track of which column the data is updated into. Processes that deal
with material and energy outputs are added into the A header-matrix pair. Emissions
processes and waste heat processes are updated into the B header-matrix pair. Process
attributes like process-type can help distinguish the type of the process and is used to
decide if the process is to updated into the A header-matrix pair or the B header-matrix
pair.
If the destination of the process is the A header-matrix pair, then the A-header is
searched to see if the process being added is already present as a row. If the row is not
present, a new row, with all zeros, is added to the A matrix and the process is also added
to the A header list. If the row is already present, the index of the row is recorded in a
variable called row_num. For cases where the row is not present, the row_num will be set
equal to the index of the latest row that was added to the A header-matrix pair.
Lastly, the A matrix is updated using the indices row_num and col_num. The
element of at A(row_num, col_num) is set equal to the output quantity of the process
being added. If the process is providing an input to another process, then the output
quantity being added is negative.

80
Start
Get Process Object
Is there is row for the process present in A-
header already?
No
Yes
Is this a Process an emissions
process?
End
NoYes
Find the row_num in A where the process is already present.
This will be row_num
Set A(row_num, col_num) = - output quantity of the process
Add process to A-header. Add a new row to A-matrix. Set all
values in the new row to 0. Set the row_num equal to the index
of this new row
Is there is row for the process present in B-
header already?
No
Yes
Find the row_num in B where the process is already present.
This will be row_num
Set B(row_num, col_num) = output quantity of the process
Add process to B-header. Add a new row to B-matrix. Set all
values in the new row to 0. Set the row_num equal to the index
of this new row
Add column to A-matrix and B-matrix. Set all values in the new column to 0. Set col_num
equal to the index of this new row
Is this a parent process?
Get col_num of the parent matrix.
Yes No
Figure 33: Algorithm to Update the A & B header-matrix pair for a process

81
Creating the B header-matrix pair
Creating the B header-matrix is very similar to how the A header-matrix pair is
created. All processes with outputs representing emissions or waste heat is added to the B
header-matrix pair. The algorithm to update or add a given process to the B header-
matrix pair is shown in Figure 33. This algorithm is the same as the one used when
adding processes to the A header-matrix pair. The key difference is, the addition of
columns to the B header-matrix pair depends on the addition of A header-matrix pair. For
a given parent process, the columns are added to B header-matrix pair when columns are
added to the A header-matrix pair.
Lastly, when the B matrix is updated using the indices row_num and col_num, the
element of at B(row_num, col_num) is set equal to the output quantity of the process
being added. Because the process is an emissions or a waste heat process, the quantity is
positive.
Creating the F vector
F vector represents the demand of output from each process. The F vector will be
created by the system modeler and will be an input to the model. The entries of the F
vector will represent the rows of the A matrix. Therefore, the A header is used to
represent the processes of the F vector. A separate header is not required.
Object based merging to create system-scale models
Large systems will have numerous processes. A large system-scale LCA model
will include numerous relationships that will hard to model at the system level. In order
to solve this problem, the large system-scale model is designed using a bottom-up
approach. The models are designed and developed at the sub-system level. Because of the
restricted scope at the subsystem-scale, all the inter-process relationships are added into

82
the subsystem-scale model. The individual subsystem-scale models are then merged to
obtain a large system-scale model on which LCA can be performed.
In the bottom-up approach is shown in Figure 35, multiple subsystem-scale
models might share some common processes. For example, a subsystem LCA model for
Electricity from Coal and Electricity from Wind share a process that represents
generation of steel. When merging the subsystem models, processes that are common
between the models are identified. For the processes that are common, the values in the A
and B matrices are appropriately set when merging. For identifying common processes,
brute force comparison can be performed yielding very high runtimes for big models.
Instead, merging is done by saving the indices of processes in the models that are being
merged and selectively extracting models processes that are not common.
The merge is run on two subsystem-scale LCA models viz. input1 and input2 to
produce a merged output. The algorithm to merge two subsystem-scale LCA models is
shown in Figure 34. Additional handles called “in1_idx” and “in2_idx” are created in
each process object. “in1_idx” represents the index of each process in the input1 process
list. “in2_idx” represents the index of each process in the input2 process list.
“output_idx” represents the index of each process in the output process list. The A
header-matrix pairs of the input models are read by the algorithm. Lists of process objects
are created while reading the A header-matrix and B header-matrix pairs for each input.
The in1_idx while reading the input1 A header-matrix pair. The in2_idx is updated while
reading the input2 A header-matrix pair. Common processes between input1 and input2
are identified. All processes from input1 and input2 are added to the output process list.
Common processes are only added from input1. Finally, the output A matrix is created
using the in1_idx and in2_idx of each processes in the output process list. Merging of B
matrices is also done using the same algorithm.
83
A process attribute called “demand” is added to the process object. In order to
merge the F matrices, the demand value for every process in A-header is read into the
corresponding “demand” attribute of process object. After merging the matrices and
when output header-matrix pair is being created, a new F matrix is created using the
“demand” attributes of all processes in the output process list.
Merge is designed to take two input subsystem-scale LCA models at a time. A
merge tree is created in order to merge a large number of models. In a merge tree, the
output of merge from one level is used as an input to the next level. Merge trees help to
keep the complexity manageable because larger matrices are created and handled while
merging towards the top of the tree.

84
Start
Read Input1 A and create input1 A header-matrix pair. Set in1_idx
for all processes
Read Input2 A and create input2 A header-matrix pair. Set in2_idx
for all processes
End
For each Input2 A process list, set in1_idx
For each Input1 A process list, set in2_idx
Copy all Input1 A process list to Output A process list
Copy Input2 A process that are already not present in Output A
process list
Create Output matrix with all zeros
For every element of Output A matrix, copy from input1 A or
input2 A depending on in1_idx and in2_idx
Figure 34: Algorithm to merge two subsystem-scale LCA models

85
Merge Subsystem
1
Merge Subsystem
2
Merged Subsystem
1-2
Merge Subsystem
3
Merge Subsystem
4
Merged Subsystem
3-4
Merged Subsystem
1-2-3-4
Figure 35: Merge tree
PROCESS DEFINITION
A class called “process” is defined and it becomes the fundamental data structure
used to create process objects that represent all processes for all electricity generation
technologies. Having objects of the same class for all processes enables easy
interoperability between code that handles multiple susbsystems (like merging and net-
energy analysis code). The “process” class has two important constituents – members and
methods. The members represent the attributes of a given process that the object is
presenting. In order to fully capture all the data from the (Hertwich et al. 2015) source
technology files, the following attributes are defined in the class definition (similar to
attributes present in the processes from (Hertwich et al. 2015)) –
1. Source
2. Name

86
3. LCA category
4. LCA Sub-category
5. LCA Activity
6. Complete name
7. Internal process code
8. Product code
9. IO Classification/CPA code
10. Temporal lifetime
11. First year of Expense
12. Discount factor
13. Regional representativeness
14. Country Code
15. Quantity
16. Quantity Unit
17. Quantity Min
18. Quantity Max
19. Unit Factor
20. Standard Unit
Other members of the class include

87
1. proc_handle: this is a list of handles to all the children of this process
2. proc_index: It is an integer that represents the number of children
3. filename, sheetname, process name: Strings that represent some basic
technology file information.
4. in1_idx and in2_idx : these are handles used for merging operations.
5. parse_state and next_parse_state: These are used for the parsing state
machine.
Methods are functions that are implemented in the class. Some common
functionality is implemented as methods in the class. Some of the important methods of
the “process” class are –
1. parse: This is the main function that reads the sheet and creates a process
object for every process. It also reads the processes that are inputs to a given
process and creates the child process objects and list of children. This function
is used extensively when reading data from the spreadsheets.
2. compare: It compares two process objects and provides a result to denote if
the process objects represent the same process. The function compares all the
relevant attributes to determine if the processes are the same. This function is
used extensively when creating matrices and during merging operations.
3. Copy_process_values: this function is called by the parse() function. It is used
to copy a line from the excel sheet to the attributes.
Other methods that help in making the overall code more organized, more
readable and more manageable are added in the “process” class definition.

88
References
Aresta M, Dibenedetto A, and Barberio G, “Utilization of macro-algae for enhanced CO2
fixation and biofuels production: Development of a computing software for an
LCA study.” Fuel Processing Technology 86, no. 14-15 (2005): 1679-1693
Arvesen, Anders, and Hertwich, Edgar, “More caution is needed when using life cycle
assessment to determine energy return on investment (EROI).” Energy Policy 76,
(2015): 1-6
Arvesen, Anders, and Sandén, Björn, “Energy Balance and Climate Impact of Renewable
Power: Is there cause for concern?” In Systems perspectives on renewable power,
edited by Björn A. Sandén, 72-83. Sweden: Chalmers University of Technology,
www.chalmers.se/en/areas-of-advance/energy/cei/Pages/Systems-Perspectives-
on-Renewable-Power.aspx, 2014
Brandt, Adam, and Dale, Michael, “A General Mathematical Framework for Calculating
Systems-Scale Efficiency of Energy Extraction and Conversion: Energy Return
on Investment (EROI) and Other Energy Return Ratios.” Energies 4, no.8 (2011):
1211-1245
Brandt A., Dale M., and Barnhart C., “Calculating systems-scale energy efficiency and
net energy returns: A bottom-up matrix-based approach.” Energy 62, (2013): 235-
247
Cleveland, Cutler, “Energy quality and energy surplus in the extraction of fossil fuels in
the U.S.” Ecological Economics 6, (1992): 139-162
Cleveland, Cutler, “Net energy from the extraction of oil and gas in the United States.”
Energy 30, (2005): 769-782
Dale M, Krumdieck S, and Bodger P, “Net energy yield from production of conventional
oil.” Energy Policy 39, (2011): 7095-7102
Espinosa N, García-Valverde R, Urbina A, and Kerbs F, “A life cycle analysis of
polymer solar cell modules prepared using roll-to-roll methods under ambient
conditions.” Solar Energy Materials and Solar Cells 95, no. 5 (2011): 1293-1302
Finnveden G, Hauschild M, Tomas Ekvall, Guinée J, Heijungs R, Hellweg S, Koehler A,
Pennington D, and Suh S, “Recent developments in Life Cycle Assessment.”
Journal of Environmental Management 91, no. 1 (2009): 1–21
Gagnon N, Hall C, and Brinkler L, “A Preliminary Investigation of Energy Return on
Energy Investment for Global Oil and Gas Production.” Energies 2, no. 3 (2009):
490-503
Gately, Mark, “The EROI of U.S. offshore energy extraction: A net energy analysis of
the Gulf of Mexico.” Ecological Economics 63, (2007): 355-364

89
Hall C, Balogh S, and Murphy D, “What is the Minimum EROI that a Sustainable
Society Must Have?” Energies 2, no.1 (2009): 25-47
Hall C, Lambert J, and Balogh S, “EROI of different fuels and the implications for
society.” Energy Policy 64, (2014): 141-152
Hammerschlag, Roel, “Ethanol’s Energy Return on Investment: A Survey of the
Literature 1990-Present.” Environmental Science and Technology 40, no. 6
(2006): 1744-1750
Heijungs, Reinout, and Suh, Sangwon. The Computational Structure of Life Cycle
Assessment. Dordrecht: Kluwer Academic Publishers, 2002.
Heller M, Keoleian G, Mann M, and Volk T, “Life cycle energy and environmental
benefits of generating electricity from willow biomass.” Renewable Energy 29,
no. 7 (2004): 1023-1042
Hellweg, Stefanie, and Canals, Llorenç Milà i, “Emerging approaches, challenges and
opportunities in life cycle assessment.” Science 344, no. 6188 (2014): 1109-1113
Hujibregts M, Hellweg S, Frischknecht R, Hendriks H, Hungerbühler K, and Hendriks J,
“Cumulative Energy Demand As Predictor for the Environmental Burden of
Commodity Production.” Environmental Science and Technology 44, no. 6
(2010): 2189-2196
Hertwich E., Gibon T, Bouman E, Arvesen A, Suh S, Heath G, Bergesen J, Ramirez A,
Vega M, and Shi L. “Integrated life-cycle assessment of electricity-supply
scenarios confirms global environmental benefit of low-carbon technologies.”
PNAS 112, no. 20 (2015): 6277-6282
IEA, “Energy Technology Perspectives 2010 – Scenarios and Strategies to 2050.”
International Energy Agency, 2010
King, Carey. “Matrix method for comparing system and individual energy return ratios
when considering an energy transition.” Energy 72, (2014): 254-265
King, Carey, “Comparing World Economic and Net Energy Metrics, Part 3:
Macroeconomic Historical and Future Perspectives.” Energies 8, (2015): 12997-
13020
King C., Maxwell J., and Donovan A., “Comparing world economic and net energy
metrics, Part 1: Single Technology and Commodity Perspective.” Energies 8,
(2015): 12949-12974
Kubiszewski I, Cleveland C, and Endres P, “Meta-analysis of net energy return for wind
power systems.” Renewable Energy 35, no. 1 (2010): 218-225
Lambert J, Hall C, Balogh S, Gupta A, and Arnold M, “Energy, EROI and quality of
life.” Energy Policy 64, (2014): 152-167

90
Mann, M.K, and Spath, P.L, “A life cycle assessment of biomass cofiring in a coal-fired
power plant.” Clean Products and Processes 3, no. 2 (2001): 81-91
Martínez E, Sanz F, Pellegrini S, Jiménez E, Blanco J, “Life cycle assessment of a multi-
megawatt wind turbine.” Renewable Energy 34, no. 3 (2009): 667-673
Odeh, Naser, and Cockerill, Timothy, “Life cycle analysis of UK coal fired power
plants.” Energy Conversion and Management 49, no. 2 (2008): 212-220
Pehnt, Martin, “Dynamic life cycle assessment (LCA) of renewable energy
technologies.” Renewable Energy 31, no.1 (2006): 55-71
Raugei M, Palmer P, and Fthenakis V, “The energy return on energy investment (EROI)
of photovoltaics: Methodology and comparisons with fossil fuel life cycles.”
Energy Policy 45, (2012): 576-582
Reap J, Roman F, Duncan S, and Bras B, “A survey of unresolved problems in life cycle
assessment. Part 2: impact assessment and interpretation” International Journal of
Life Cycle Assessment 13, (2008): 374–388
Suh, Sangwon, and Huppes, Gjalt, “Methods for Life Cycle Inventory of a product.”
Journal of Cleaner Production 13, (2015): 687-697
Tainter J, Allen T, Little A, and Hoekstra T, “Resource Transitions and Energy Gain:
Contexts of Organization.” Conservation Ecology 7, no. 3 (2003)
Weissbach D, Ruprecht G, Huke A, Czerski K, Gottlieb S, and Hussein A, “Energy
intensities, EROIs (energy returned on invested), and energy payback times of
electricity generating power plants.” Energy 52, (2013): 210-221